
TrendSide
101 Posts

TrendSide
You will find : 1. Research 2. Observation 3. Patterns 4. Future Events 5. News 6. Current Sentiment.
9 Following
33 Followers
160 Liked
Posts
All
Quotes
PINNED


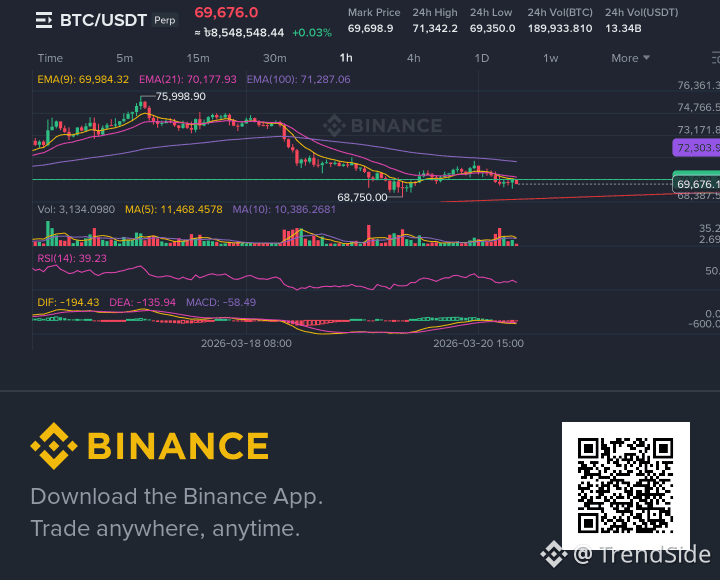
Let’s break this down cleanly from The 1H BTC/USDT chart.
🧠 Current Structure (Key Observations)
Price: ~69.7K
Trend: Short-term bearish / ranging
EMAs:
EMA(9) < EMA(21) → bearish momentum
Price below EMA(100) → macro intraday weakness
RSI ~40 → not oversold yet (room down)
MACD → still negative, weak bullish attempt failing
👉 Market is in a low-momentum consolidation after a dump
📊 Key Levels (Liquidity Zones)
🔴 Above (Liquidity Targets)
70.2K – 70.5K → EMA21 + local rejection zone
71.2K – 71.5K → EMA100 + major short liquidity
72.3K → HTF resistance (big liquidity pool)
🟢 Below (Liquidity Targets)
69.3K – 69K → equal lows (weak liquidity)
68.7K → recent low
67.8K – 68K → strong liquidity cluster (major target)
⚔️ Scenarios & Probability
🐻 Bearish Scenario (Primary) — 60–65%
Setup:
Price fails to reclaim 70.2K
Continues making lower highs
Move: ➡️ Sweep 69K liquidity
➡️ Break 68.7K low
➡️ Expand toward 68K – 67.8K
💡 Reason:
Trend + EMA alignment bearish
RSI not oversold
Liquidity sitting below is cleaner
🐂 Bullish Scenario (Relief Bounce) — 35–40%
Setup:
Strong reclaim of 70.2K
Volume spike + short squeeze
Move: ➡️ Push to 71.2K (EMA100)
➡️ Possible wick to 72.3K
💡 BUT:
Likely a liquidity grab (bull trap) unless structure flips
🎯 Liquidity Play (What Smart Money Likely Does)
👉 Most probable path:
Small bounce / fake breakout toward 70K+
Trap longs
Dump → take 68.7K & 68K liquidity
⚠️ Classic:
“Induce → Trap → Sweep liquidity”
📉 What You Should Watch (Trigger Signals)
Bear confirmation:
Rejection from 70K–70.2K
Lower high formation
Increasing sell volume
Bull confirmation:
Clean breakout + hold above 70.5K
RSI > 50
MACD flip positive
🧩 Final Verdict
👉 Bias: Bearish continuation
Downside liquidity is more attractive
Structure still weak
📊 Most likely path:
Fake bounce → drop → sweep 68K zone
🧠 Current Structure (Key Observations)
Price: ~69.7K
Trend: Short-term bearish / ranging
EMAs:
EMA(9) < EMA(21) → bearish momentum
Price below EMA(100) → macro intraday weakness
RSI ~40 → not oversold yet (room down)
MACD → still negative, weak bullish attempt failing
👉 Market is in a low-momentum consolidation after a dump
📊 Key Levels (Liquidity Zones)
🔴 Above (Liquidity Targets)
70.2K – 70.5K → EMA21 + local rejection zone
71.2K – 71.5K → EMA100 + major short liquidity
72.3K → HTF resistance (big liquidity pool)
🟢 Below (Liquidity Targets)
69.3K – 69K → equal lows (weak liquidity)
68.7K → recent low
67.8K – 68K → strong liquidity cluster (major target)
⚔️ Scenarios & Probability
🐻 Bearish Scenario (Primary) — 60–65%
Setup:
Price fails to reclaim 70.2K
Continues making lower highs
Move: ➡️ Sweep 69K liquidity
➡️ Break 68.7K low
➡️ Expand toward 68K – 67.8K
💡 Reason:
Trend + EMA alignment bearish
RSI not oversold
Liquidity sitting below is cleaner
🐂 Bullish Scenario (Relief Bounce) — 35–40%
Setup:
Strong reclaim of 70.2K
Volume spike + short squeeze
Move: ➡️ Push to 71.2K (EMA100)
➡️ Possible wick to 72.3K
💡 BUT:
Likely a liquidity grab (bull trap) unless structure flips
🎯 Liquidity Play (What Smart Money Likely Does)
👉 Most probable path:
Small bounce / fake breakout toward 70K+
Trap longs
Dump → take 68.7K & 68K liquidity
⚠️ Classic:
“Induce → Trap → Sweep liquidity”
📉 What You Should Watch (Trigger Signals)
Bear confirmation:
Rejection from 70K–70.2K
Lower high formation
Increasing sell volume
Bull confirmation:
Clean breakout + hold above 70.5K
RSI > 50
MACD flip positive
🧩 Final Verdict
👉 Bias: Bearish continuation
Downside liquidity is more attractive
Structure still weak
📊 Most likely path:
Fake bounce → drop → sweep 68K zone
🔥If you are smart enough to trade the news
✅ How many gas fields, LNG terminals, oil refineries were actually hit/destroyed
⚠️ How many are still at high risk of attack next
----------------------------------------
🔥 1. GAS FIELDS (Natural Gas Infrastructure)
South Pars (world’s largest gas field)
Damage:
~12–22% of Iran’s gas production affected
------------
⚠️ Still at risk
1. South Pars (again – could be fully destroyed)
2. Shared Qatar–Iran North Dome section
3. Iranian domestic gas networks
📊 High-risk gas fields: → 2–3 major systems
-----------------------------------------
🔥 2. LNG TERMINALS (Liquefied Natural Gas)
🇶🇦 Qatar – Ras Laffan LNG complex
World’s largest LNG hub
2 LNG trains destroyed/damaged
👉 Impact:
~17% global LNG supply disrupted
Multi-year damage (3–5 years)
📊 Total LNG facilities hit: → 1 major hub (but VERY critical globally)
----------------
⚠️ Still at risk
1. Remaining LNG trains at Ras Laffan (12+ still operating)
2. UAE LNG/export terminals
3. Oman LNG facilities
📊 High-risk LNG facilities: → 5–10+ installations region-wide
-----------------------------------------
🔥 3. OIL REFINERIES
✅ Already hit
1 🇸🇦 Saudi refinery (Ras Tanura) → minor damage but shutdown
2. 🇰🇼 Kuwait refineries (Mina Abdullah + Mina Al-Ahmadi) → fires reported
3. 🇧🇭 Bahrain refinery → operations halted
4. 🇮🇷 Iran refinery (Asaluyeh / Tehran region earlier) → damaged
📊 Total refineries affected: → ~5–8 (varying damage levels)
(Not all destroyed, but disrupted/shutdown)
-----
⚠️ Still at risk
1. Saudi Aramco mega refineries (Ras Tanura, Yanbu)
2. UAE (Habshan, Fujairah)
3. Kuwait & Bahrain remaining capacity
4. Iranian domestic refineries
📊 High-risk refineries: → 15–25 major facilities
✅ DAMAGED
1. Gas fields 1
2. LNG terminals 1 major (2 units destroyed)
3. Oil refineries ~5–8
--------
⚠️ STILL IN DANGER (NEXT TARGETS)
1 Gas fields 2–3
2. LNG terminals 5–10+
3. Oil refineries 15–25
✅ How many gas fields, LNG terminals, oil refineries were actually hit/destroyed
⚠️ How many are still at high risk of attack next
----------------------------------------
🔥 1. GAS FIELDS (Natural Gas Infrastructure)
South Pars (world’s largest gas field)
Damage:
~12–22% of Iran’s gas production affected
------------
⚠️ Still at risk
1. South Pars (again – could be fully destroyed)
2. Shared Qatar–Iran North Dome section
3. Iranian domestic gas networks
📊 High-risk gas fields: → 2–3 major systems
-----------------------------------------
🔥 2. LNG TERMINALS (Liquefied Natural Gas)
🇶🇦 Qatar – Ras Laffan LNG complex
World’s largest LNG hub
2 LNG trains destroyed/damaged
👉 Impact:
~17% global LNG supply disrupted
Multi-year damage (3–5 years)
📊 Total LNG facilities hit: → 1 major hub (but VERY critical globally)
----------------
⚠️ Still at risk
1. Remaining LNG trains at Ras Laffan (12+ still operating)
2. UAE LNG/export terminals
3. Oman LNG facilities
📊 High-risk LNG facilities: → 5–10+ installations region-wide
-----------------------------------------
🔥 3. OIL REFINERIES
✅ Already hit
1 🇸🇦 Saudi refinery (Ras Tanura) → minor damage but shutdown
2. 🇰🇼 Kuwait refineries (Mina Abdullah + Mina Al-Ahmadi) → fires reported
3. 🇧🇭 Bahrain refinery → operations halted
4. 🇮🇷 Iran refinery (Asaluyeh / Tehran region earlier) → damaged
📊 Total refineries affected: → ~5–8 (varying damage levels)
(Not all destroyed, but disrupted/shutdown)
-----
⚠️ Still at risk
1. Saudi Aramco mega refineries (Ras Tanura, Yanbu)
2. UAE (Habshan, Fujairah)
3. Kuwait & Bahrain remaining capacity
4. Iranian domestic refineries
📊 High-risk refineries: → 15–25 major facilities
✅ DAMAGED
1. Gas fields 1
2. LNG terminals 1 major (2 units destroyed)
3. Oil refineries ~5–8
--------
⚠️ STILL IN DANGER (NEXT TARGETS)
1 Gas fields 2–3
2. LNG terminals 5–10+
3. Oil refineries 15–25
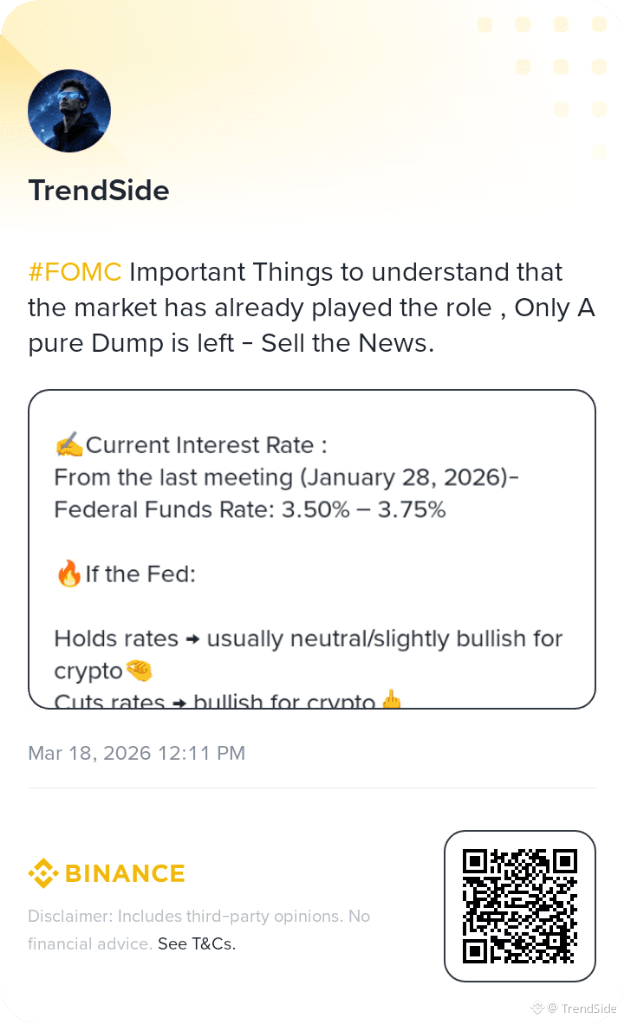
#FOMC Important Things to understand that the market has already played the role , Only A pure Dump is left - Sell the News.
So , What makes a Bull- Run , when people think It's so high and liquidity build upside.. Then they continuously hunt the nearest Liquidity...And we call it Bull-Run.
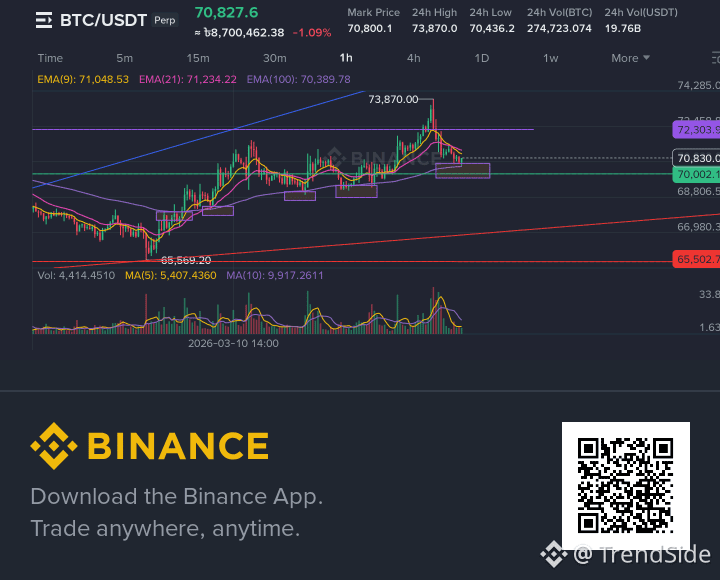
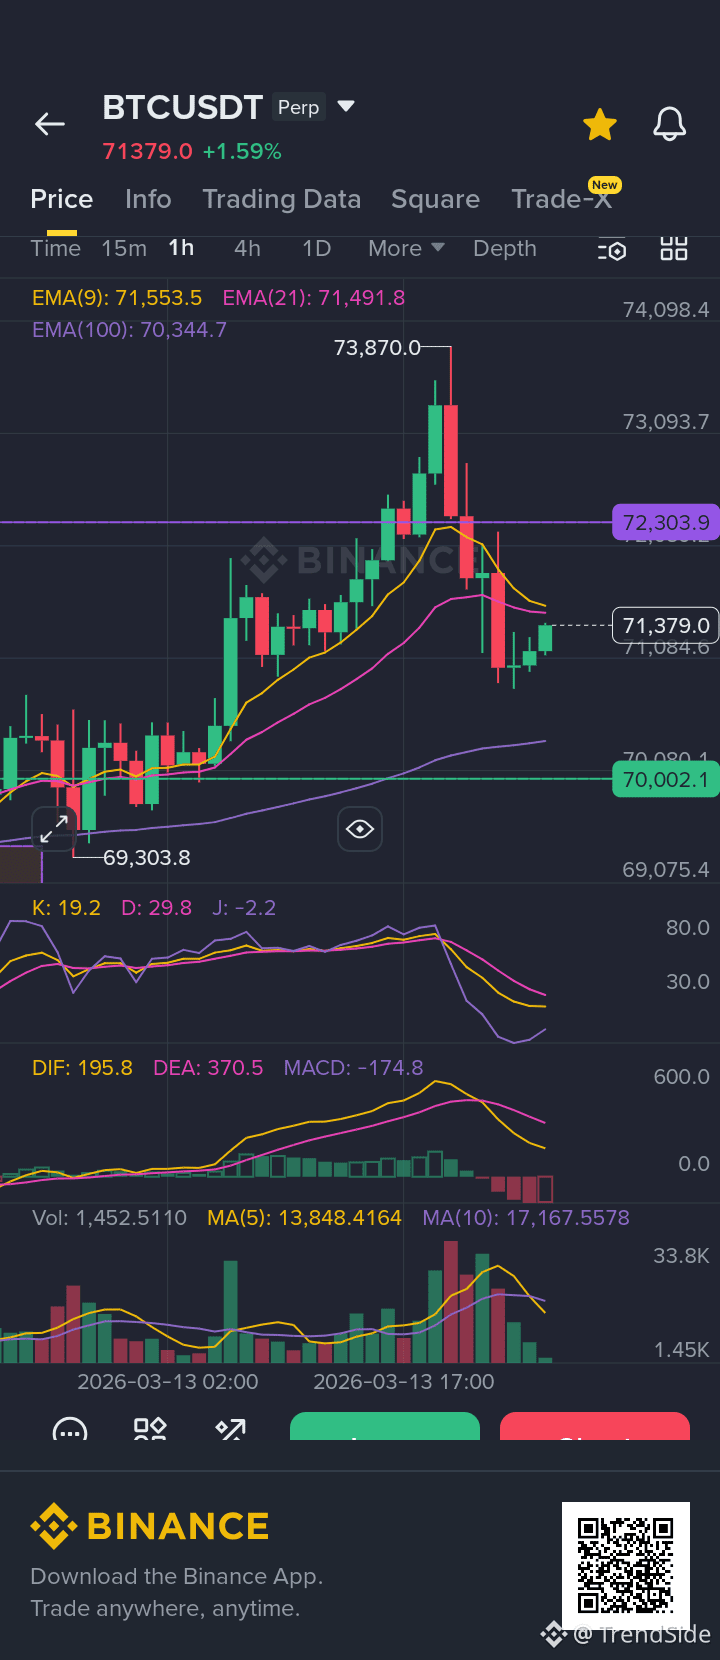
I analyzed BTC/USDT 1H chart carefully. Let’s break it down step-by-step ----
1️⃣ Current Structure
Recent high: ~ 73,870
Current price: ~ 71,380
Major resistance: 72,300
Major support: 70,000
BTC made a strong impulsive move up, then a sharp correction.
This usually means the market is cooling down before the next move.
---
2️⃣ EMA Analysis
Chart shows:
EMA9: 71,553
EMA21: 71,491
EMA100: 70,344
📌 What this means:
Price fell below EMA9 and EMA21 → short-term bearish pressure
But price is still above EMA100 → overall trend still bullish
So this is a pullback inside an uptrend, not a full reversal yet.
---
3️⃣ Momentum Indicators
MACD
Bearish crossover happened
Momentum decreasing
KDJ
Came from oversold zone
Trying to bounce
📌 Interpretation:
Downside momentum is weakening
Small relief bounce possible
----
4️⃣ Key Levels That Control Everything
🔴 Resistance
72,300
73,000
73,800
🟢 Support
71,000
70,000 (very strong)
69,300
---
5️⃣ Most Likely Scenario (My Probability)
Scenario 1 – Most Likely (65%) ➡️ Small bounce
➡️ Test 72,000 – 72,300
➡️ Rejection
➡️ Retest 70,500 – 70,000
Reason:
MACD still bearish
EMA rejection area above
---
Scenario 2 – Bullish Break (35%)
If BTC breaks and holds above 72,300
Then price can quickly go to:
🎯 73,800
🎯 74,500
🎯 75K liquidity
Because there is very little resistance above 74K.
---
6️⃣ For a scalp trade:
📍 Short setup
Entry: 72,000 – 72,300
Target: 70,500
Stop loss: 73,200
📍 Long setup
Entry: 70,200 – 70,400
Target: 72,000
Stop loss: 69,600
----------+-+-+-----
⚠️ Important:
The $70K level is the battlefield of bulls and bears right now.
If it breaks → 69K fast
If it holds → 74K possible
1️⃣ Current Structure
Recent high: ~ 73,870
Current price: ~ 71,380
Major resistance: 72,300
Major support: 70,000
BTC made a strong impulsive move up, then a sharp correction.
This usually means the market is cooling down before the next move.
---
2️⃣ EMA Analysis
Chart shows:
EMA9: 71,553
EMA21: 71,491
EMA100: 70,344
📌 What this means:
Price fell below EMA9 and EMA21 → short-term bearish pressure
But price is still above EMA100 → overall trend still bullish
So this is a pullback inside an uptrend, not a full reversal yet.
---
3️⃣ Momentum Indicators
MACD
Bearish crossover happened
Momentum decreasing
KDJ
Came from oversold zone
Trying to bounce
📌 Interpretation:
Downside momentum is weakening
Small relief bounce possible
----
4️⃣ Key Levels That Control Everything
🔴 Resistance
72,300
73,000
73,800
🟢 Support
71,000
70,000 (very strong)
69,300
---
5️⃣ Most Likely Scenario (My Probability)
Scenario 1 – Most Likely (65%) ➡️ Small bounce
➡️ Test 72,000 – 72,300
➡️ Rejection
➡️ Retest 70,500 – 70,000
Reason:
MACD still bearish
EMA rejection area above
---
Scenario 2 – Bullish Break (35%)
If BTC breaks and holds above 72,300
Then price can quickly go to:
🎯 73,800
🎯 74,500
🎯 75K liquidity
Because there is very little resistance above 74K.
---
6️⃣ For a scalp trade:
📍 Short setup
Entry: 72,000 – 72,300
Target: 70,500
Stop loss: 73,200
📍 Long setup
Entry: 70,200 – 70,400
Target: 72,000
Stop loss: 69,600
----------+-+-+-----
⚠️ Important:
The $70K level is the battlefield of bulls and bears right now.
If it breaks → 69K fast
If it holds → 74K possible
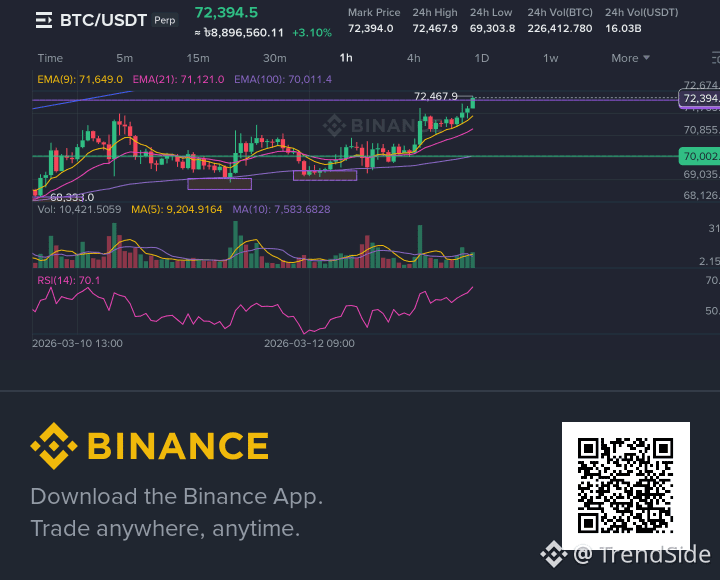
💡With CPI looking stable rather than accelerating, markets could interpret this as less hawkish monetary policy risk → potential bullish sentiment for BTC/crypto if markets interpret the data as confirming cooling inflation pressures (but reactions are fast and often short‑term around releases).
📌 What This Suggests Right Now
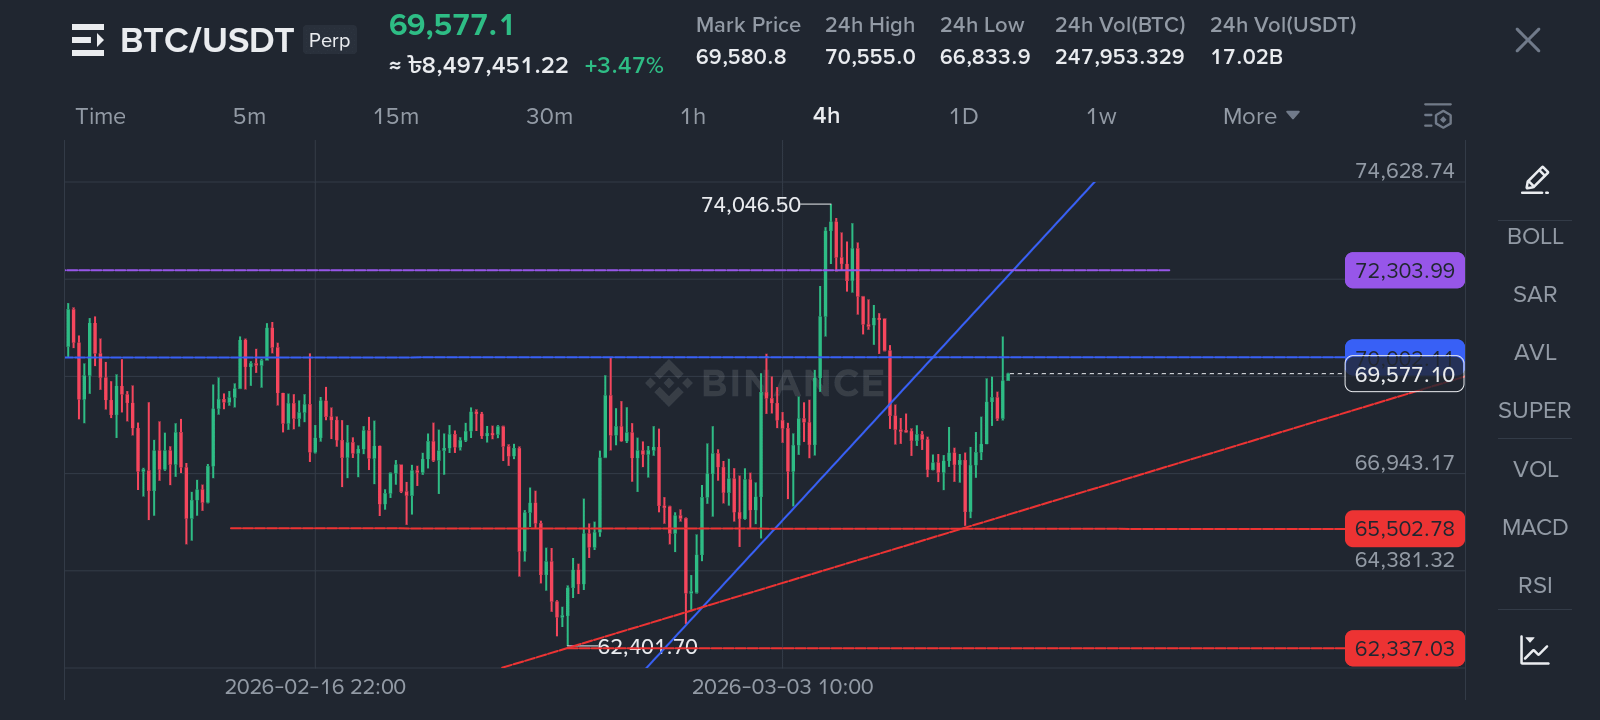
✍️Crypto and stocks are reacting with caution — not big rallies or crashes — as traders sit on their hands until CPI figures fully settle and markets interpret any “surprise.”
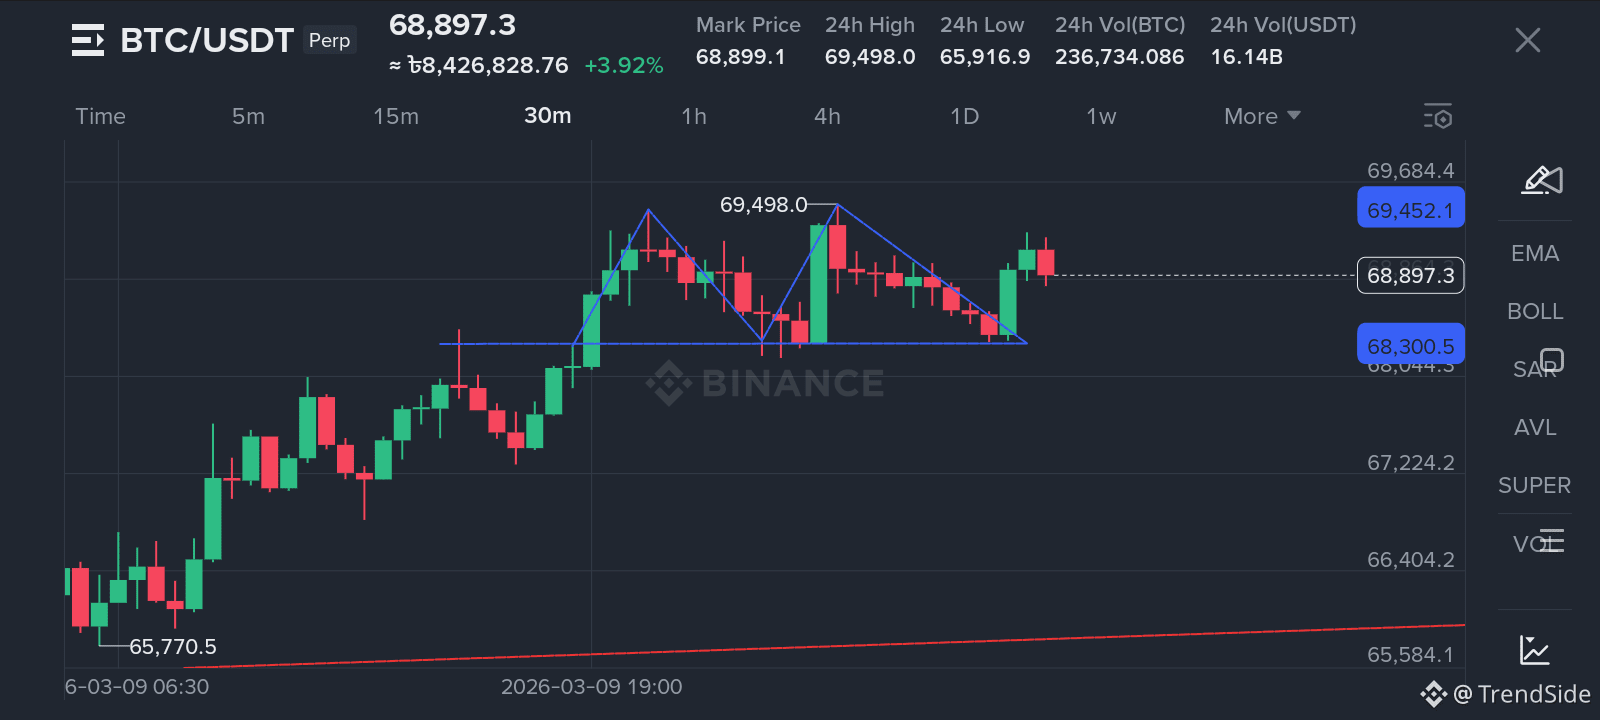
✍️BTC near key technical levels (~$69K) shows indecision: a clear break above $70,000 could signal risk appetite returning, while drops below might extend short‑term pressure.
📌 What This Suggests Right Now
✍️Crypto and stocks are reacting with caution — not big rallies or crashes — as traders sit on their hands until CPI figures fully settle and markets interpret any “surprise.”
✍️BTC near key technical levels (~$69K) shows indecision: a clear break above $70,000 could signal risk appetite returning, while drops below might extend short‑term pressure.
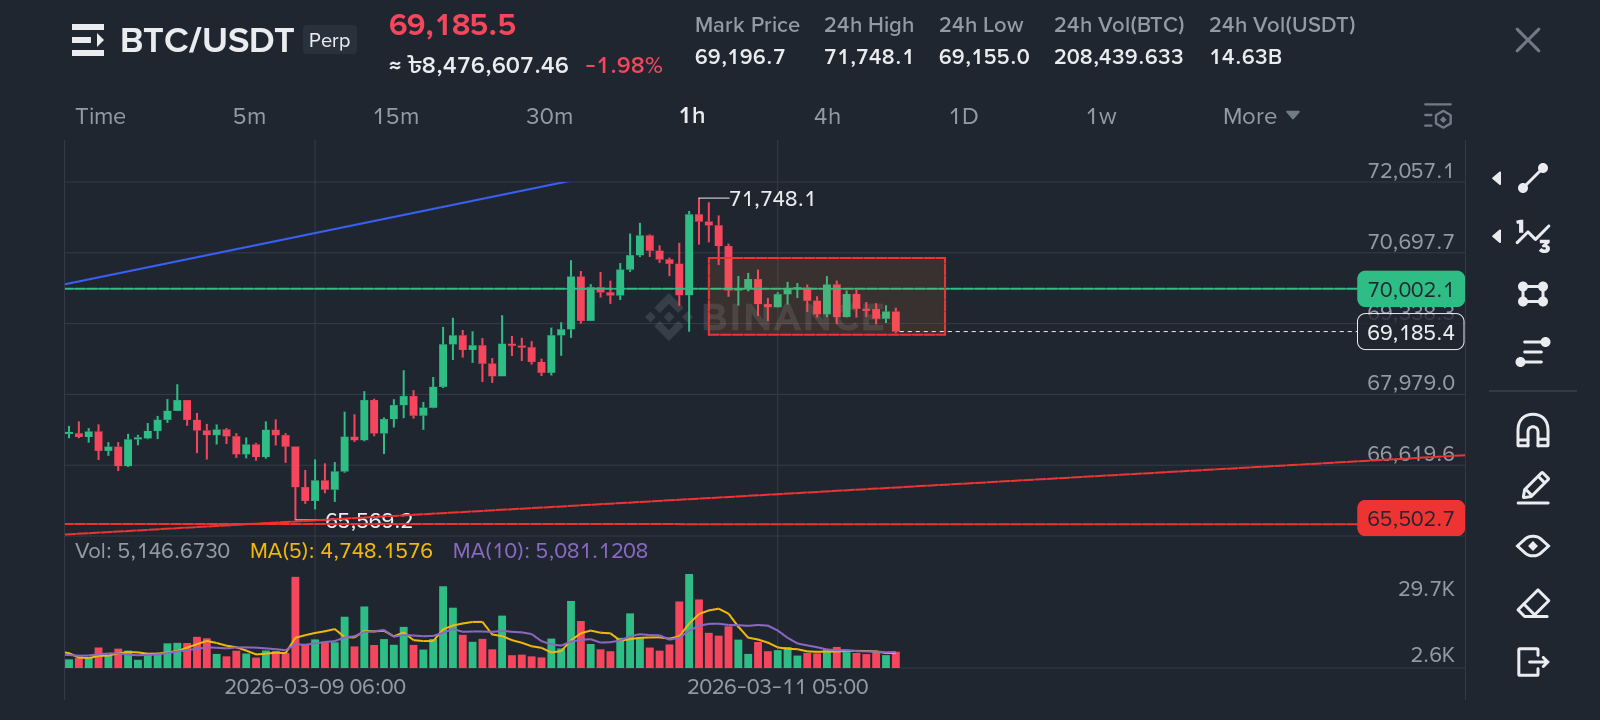
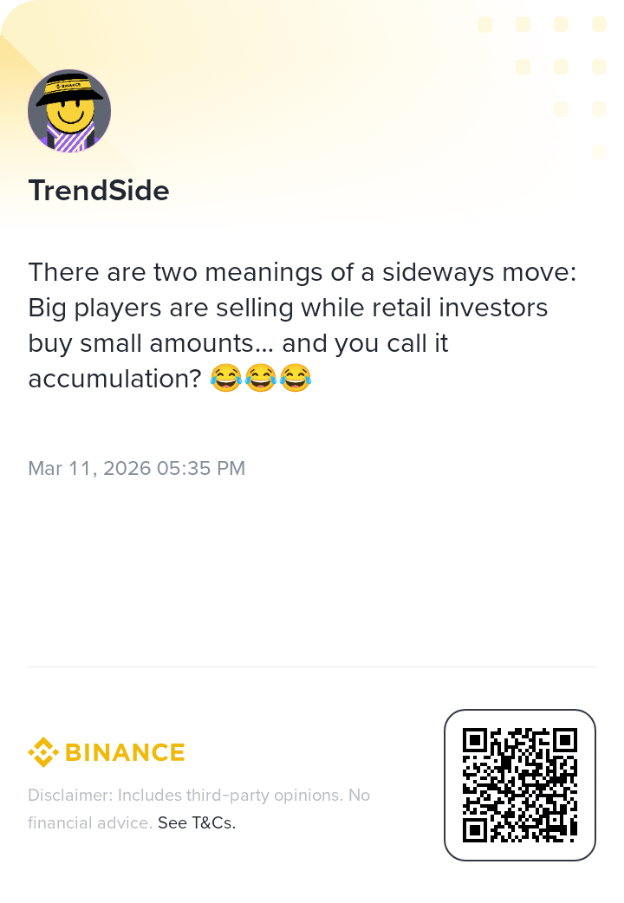
There are two meanings of a sideways move:
Big players are selling while retail investors buy small amounts… and you call it accumulation? 😂😂😂
Big players are selling while retail investors buy small amounts… and you call it accumulation? 😂😂😂
“News is often released to influence the market. When headlines say someone is buying Bitcoin, it can sometimes be a strategy to push prices higher so large holders can sell to retail investors.”
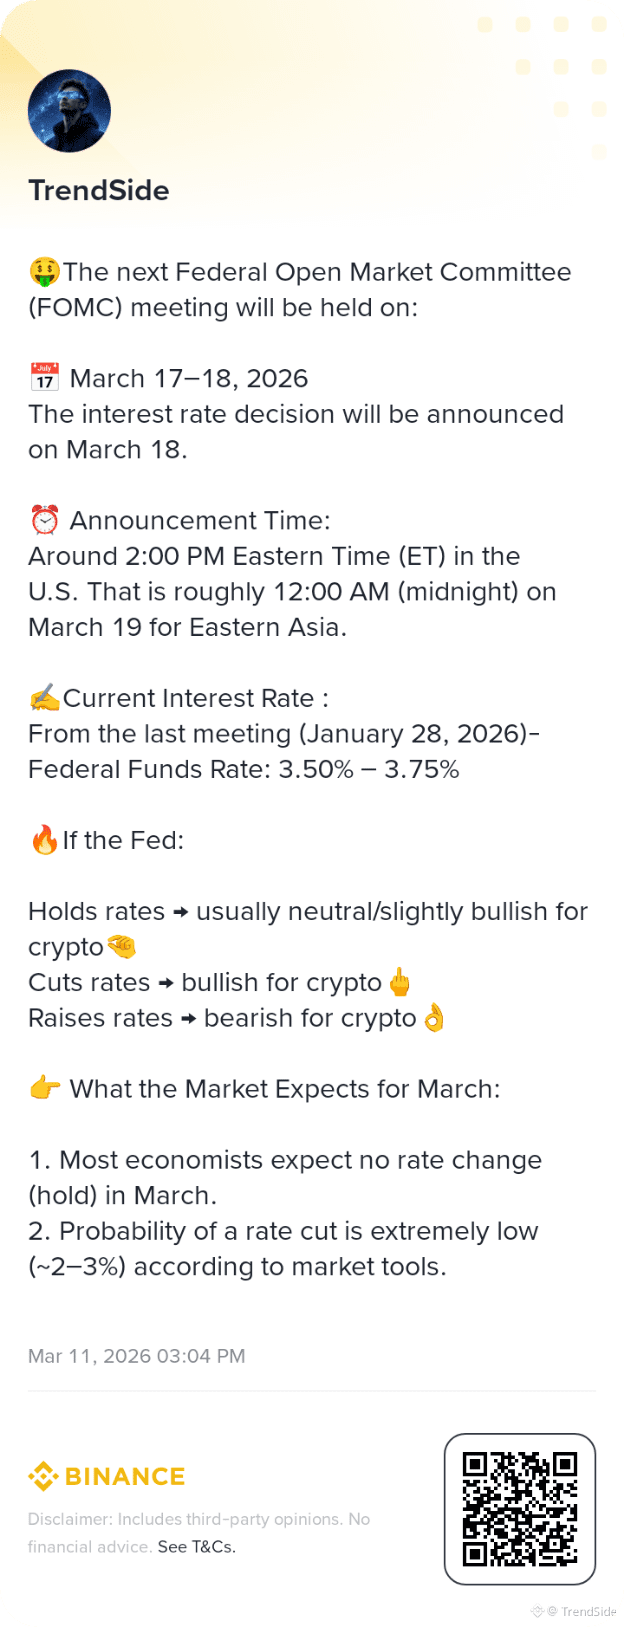
🤑The next Federal Open Market Committee (FOMC) meeting will be held on:
📅 March 17–18, 2026
The interest rate decision will be announced on March 18.
⏰ Announcement Time:
Around 2:00 PM Eastern Time (ET) in the U.S. That is roughly 12:00 AM (midnight) on March 19 for Eastern Asia.
✍️Current Interest Rate :
From the last meeting (January 28, 2026)-
Federal Funds Rate: 3.50% – 3.75%
🔥If the Fed:
Holds rates → usually neutral/slightly bullish for crypto🤏
Cuts rates → bullish for crypto🖕
Raises rates → bearish for crypto👌
👉 What the Market Expects for March:
1. Most economists expect no rate change (hold) in March.
2. Probability of a rate cut is extremely low (~2–3%) according to market tools.
📅 March 17–18, 2026
The interest rate decision will be announced on March 18.
⏰ Announcement Time:
Around 2:00 PM Eastern Time (ET) in the U.S. That is roughly 12:00 AM (midnight) on March 19 for Eastern Asia.
✍️Current Interest Rate :
From the last meeting (January 28, 2026)-
Federal Funds Rate: 3.50% – 3.75%
🔥If the Fed:
Holds rates → usually neutral/slightly bullish for crypto🤏
Cuts rates → bullish for crypto🖕
Raises rates → bearish for crypto👌
👉 What the Market Expects for March:
1. Most economists expect no rate change (hold) in March.
2. Probability of a rate cut is extremely low (~2–3%) according to market tools.
Log in to explore more content