
Stealth_TraderX Elite signal
1.4k Posts

Stealth_TraderX Elite signal
Report
Block User
Crypto Market Analyst 📊 Binance Futures | Price Action Risk Managed Trades Educational Purpose Only
53 Following
189 Followers
1.8K+ Liked
Posts
All
Quotes
Videos
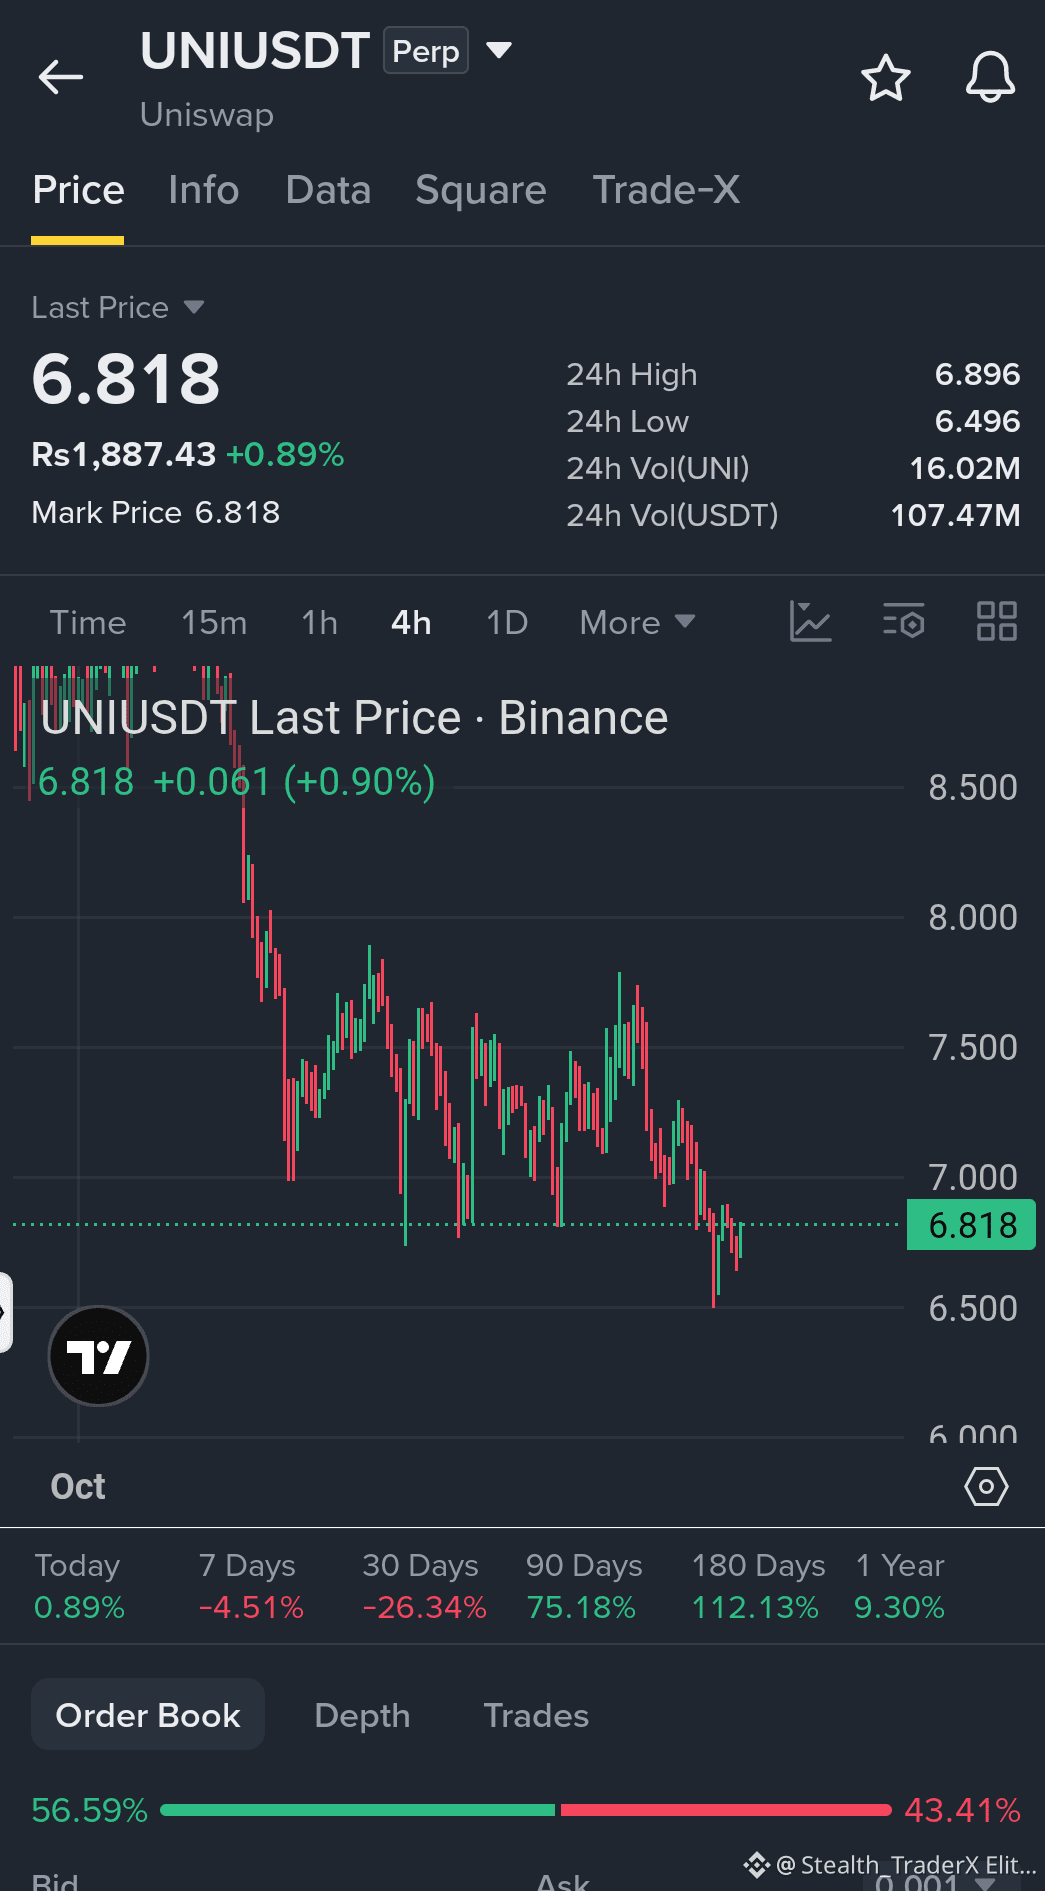
🖼️ Trading pair: $UNI USDT
🕯️ Chart analysis:
The price of UNI may continue to correct in order to accumulate liquidity from previous lows. If the price reacts to these levels, an uptrend will follow.
📍 Entry:
A long position can be opened near the previous lows of $6,000 and $5,800.
✔️ Main Target:
The imbalance zone is above the $8,240 level.#UNIUSDT #analysis #viralpost
🖼️ Trading pair: $UNI USDT
🕯️ Chart analysis:
The price of UNI may continue to correct in order to accumulate liquidity from previous lows. If the price reacts to these levels, an uptrend will follow.
📍 Entry:
A long position can be opened near the previous lows of $6,000 and $5,800.
✔️ Main Target:
The imbalance zone is above the $8,240 level.#UNIUSDT #analysis #viralpost
🕯️ Chart analysis:
The price of UNI may continue to correct in order to accumulate liquidity from previous lows. If the price reacts to these levels, an uptrend will follow.
📍 Entry:
A long position can be opened near the previous lows of $6,000 and $5,800.
✔️ Main Target:
The imbalance zone is above the $8,240 level.#UNIUSDT #analysis #viralpost
1
210
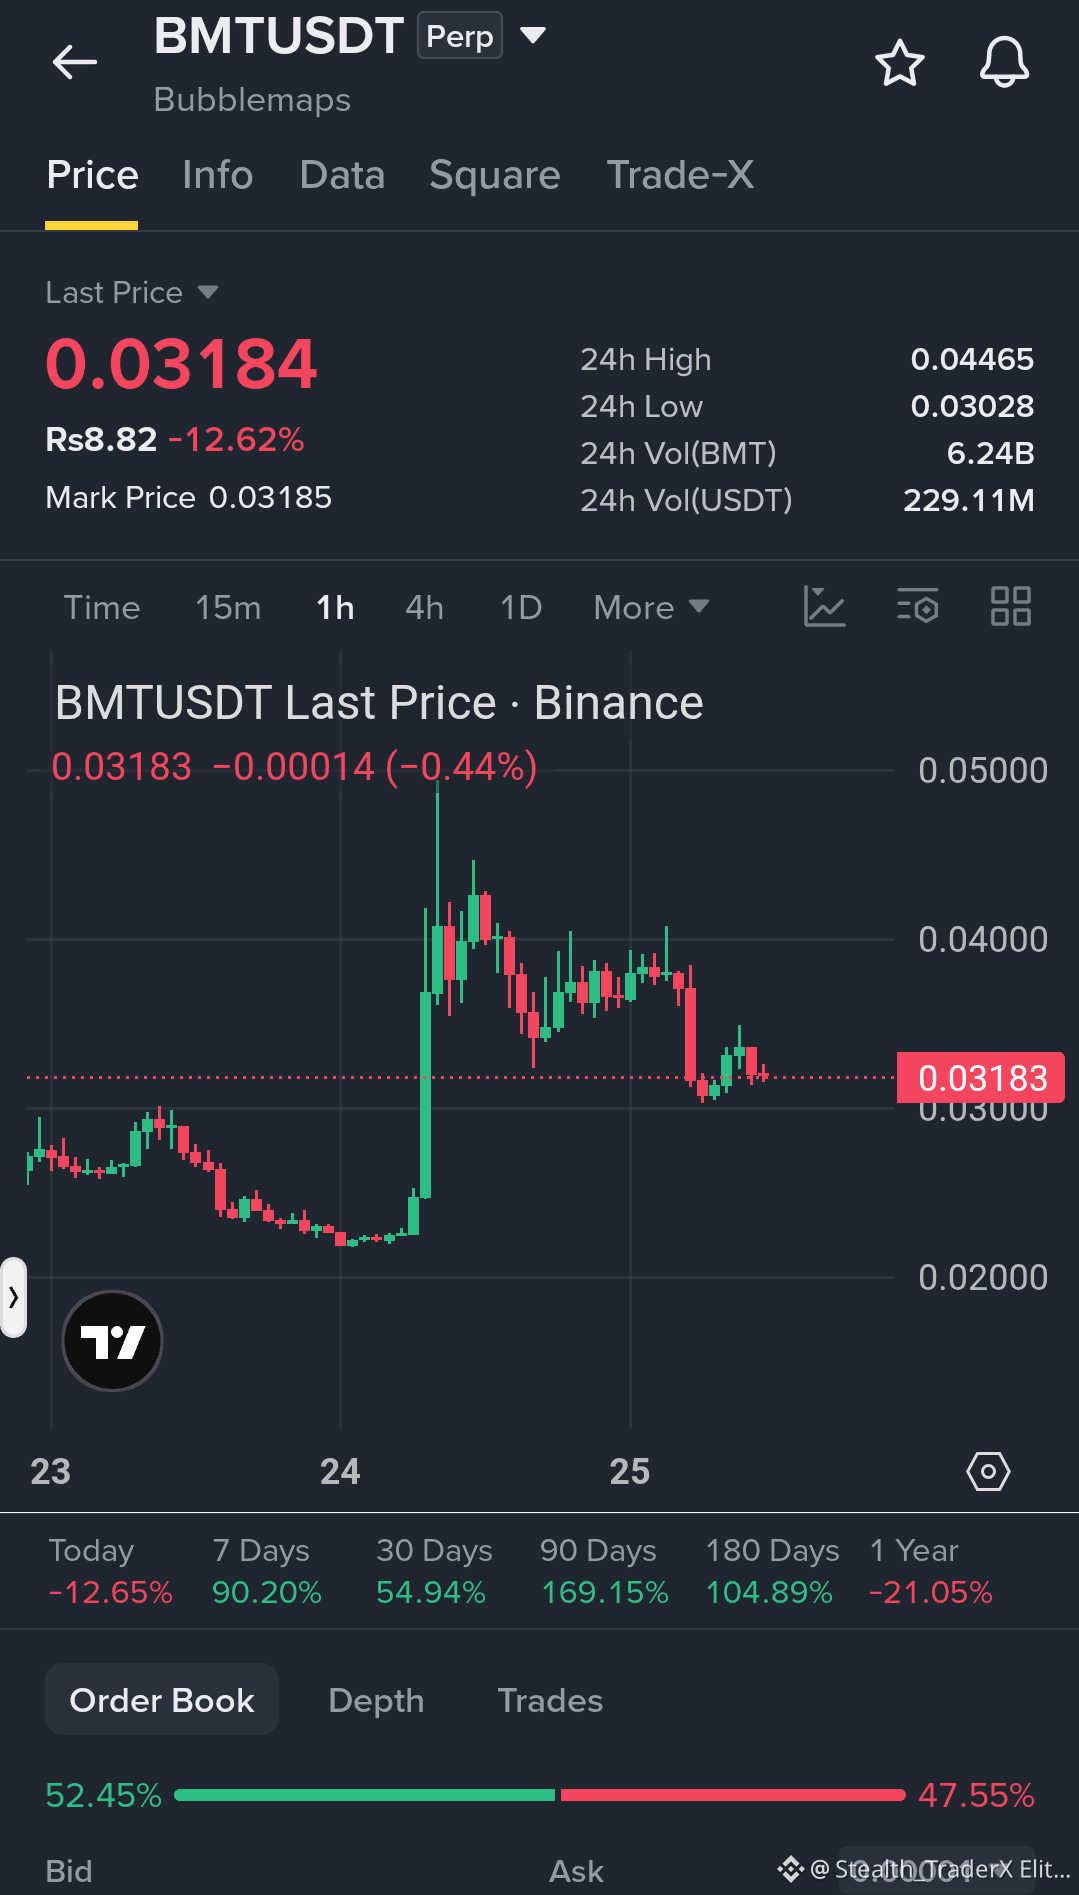
📊 Signal Update
Pair: $BMT USDT
Direction: SHORT
Entry: 0.03229 — 0.03330
🎯 TP1: 0.03108
🎯 TP2: 0.03014
🎯 TP3: 0.02815
🛡 SL: 0.03550
📊 Signal Update
Pair: $BMT USDT
Direction: SHORT
Entry: 0.03229 — 0.03330
🎯 TP1: 0.03108
🎯 TP2: 0.03014
🎯 TP3: 0.02815
🛡 SL: 0.03550
Pair: $BMT USDT
Direction: SHORT
Entry: 0.03229 — 0.03330
🎯 TP1: 0.03108
🎯 TP2: 0.03014
🎯 TP3: 0.02815
🛡 SL: 0.03550
190
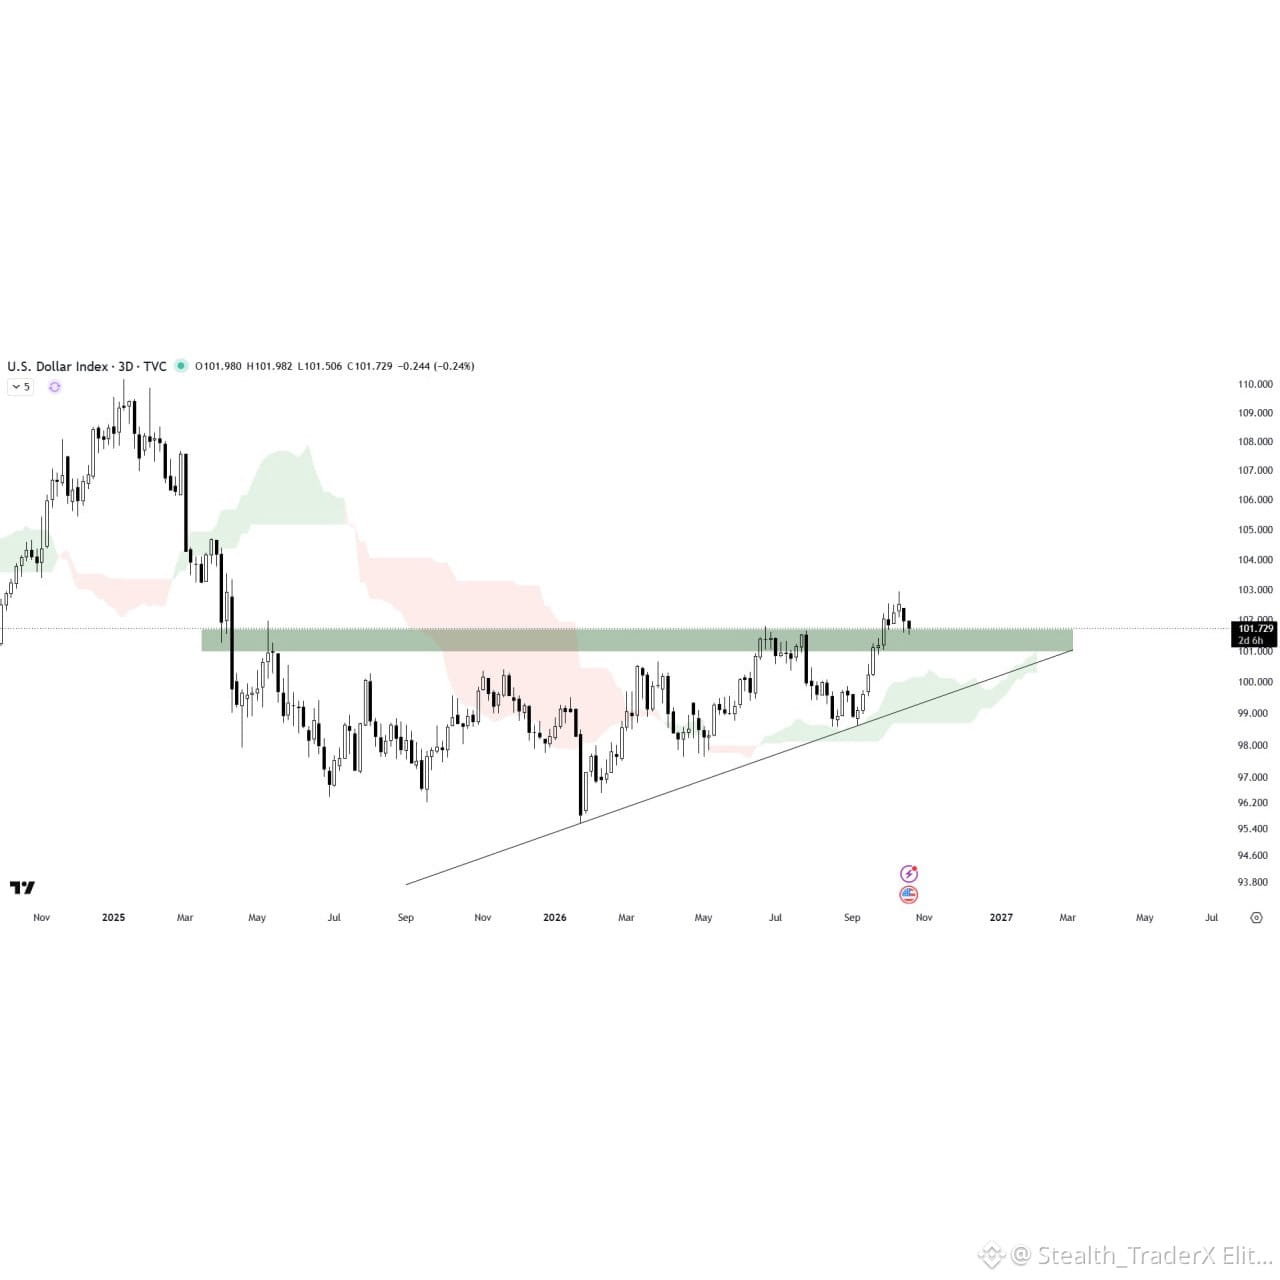
$USDC DOLLAR ANALYSIS
The US Dollar is retesting the breakout level of the ascending triangle pattern, while the Ichimoku cloud is acting as a key support zone.
A successful retest and hold above the breakout level could trigger further upside and strengthen the bullish structure.
However, if the retest fails, the price could move back inside the triangle pattern. Keep a close eye on upcoming price action for confirmation.
Since DXY moves inversely to crypto, this setup could heavily impact upcoming market direction.
$USDC DOLLAR ANALYSIS
The US Dollar is retesting the breakout level of the ascending triangle pattern, while the Ichimoku cloud is acting as a key support zone.
A successful retest and hold above the breakout level could trigger further upside and strengthen the bullish structure.
However, if the retest fails, the price could move back inside the triangle pattern. Keep a close eye on upcoming price action for confirmation.
Since DXY moves inversely to crypto, this setup could heavily impact upcoming market direction.
The US Dollar is retesting the breakout level of the ascending triangle pattern, while the Ichimoku cloud is acting as a key support zone.
A successful retest and hold above the breakout level could trigger further upside and strengthen the bullish structure.
However, if the retest fails, the price could move back inside the triangle pattern. Keep a close eye on upcoming price action for confirmation.
Since DXY moves inversely to crypto, this setup could heavily impact upcoming market direction.
58
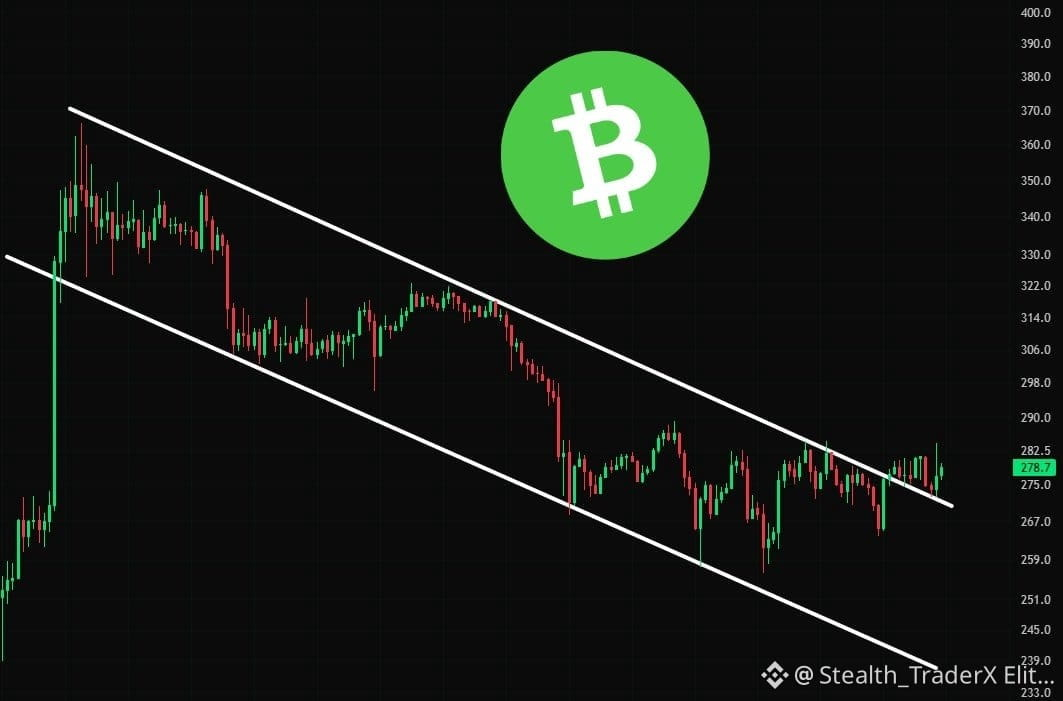
$BCH has broken out of the descending channel and successfully retested it.
$BCH has broken out of the descending channel and successfully retested it.
108
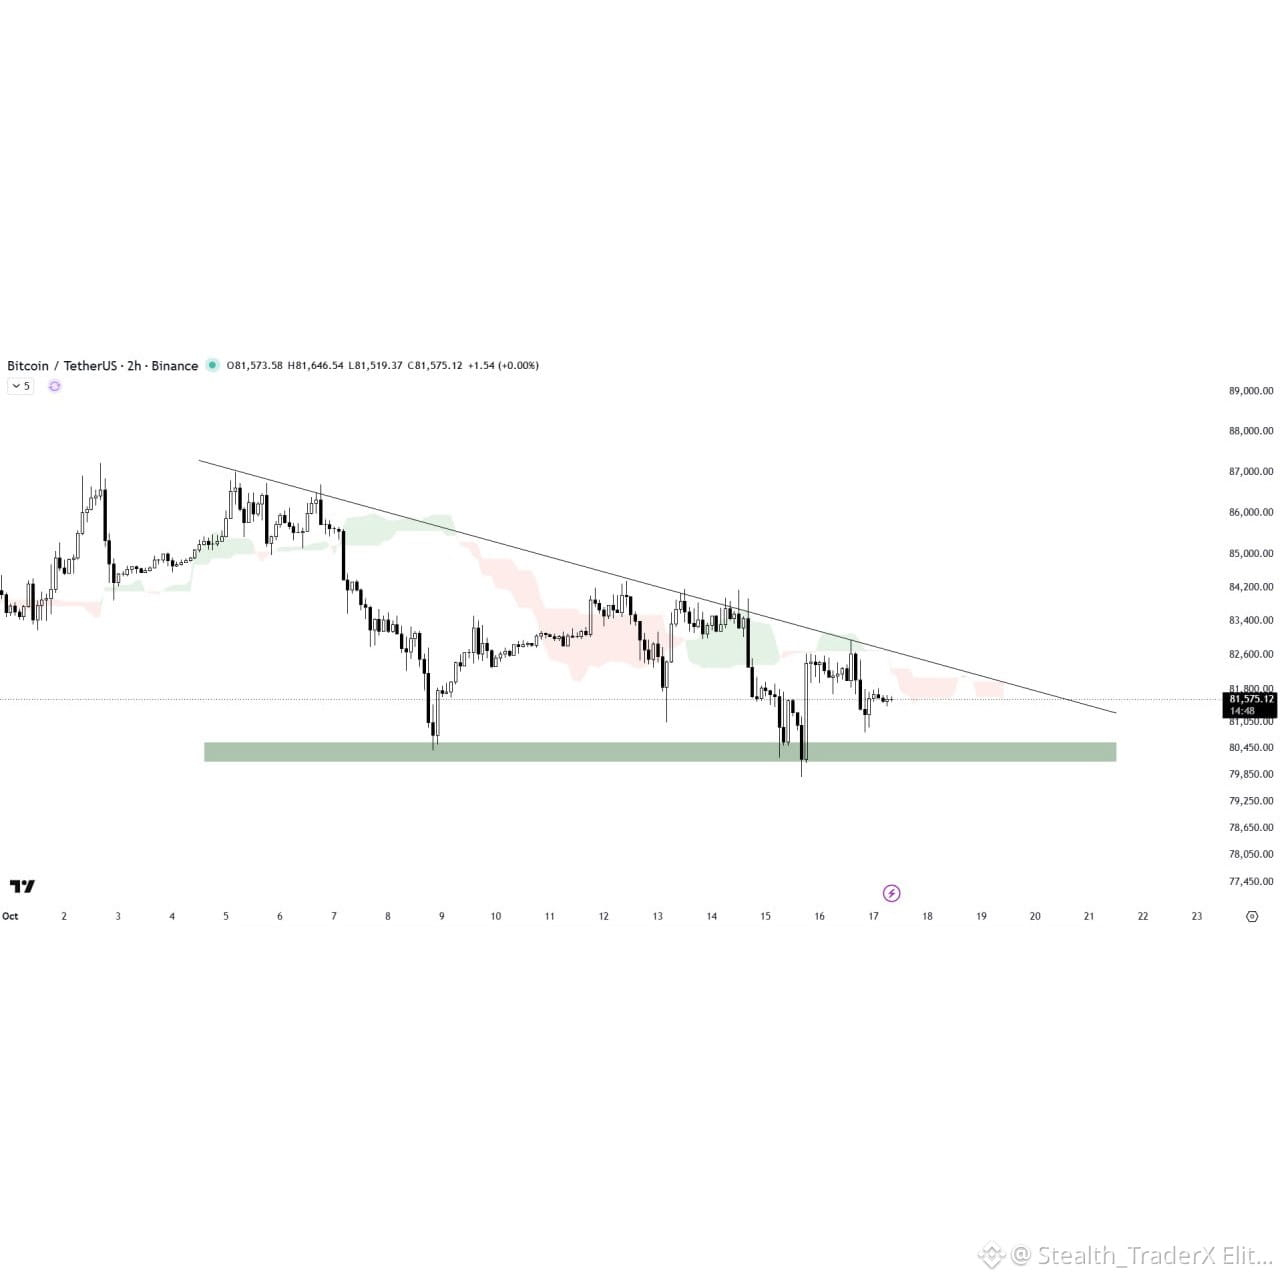
$BTC /USDT ANALYSIS
Bitcoin is consolidating within the descending triangle pattern and is currently trading below the Ichimoku cloud, which is acting as a key resistance barrier.
A solid breakout above the triangle resistance and the cloud could signal a bullish recovery, while a breakdown below the pattern’s support could trigger further downside.
Wait for a confirmed breakout or breakdown to determine the next directional move. Keep a close eye on upcoming price action.
$BTC /USDT ANALYSIS
Bitcoin is consolidating within the descending triangle pattern and is currently trading below the Ichimoku cloud, which is acting as a key resistance barrier.
A solid breakout above the triangle resistance and the cloud could signal a bullish recovery, while a breakdown below the pattern’s support could trigger further downside.
Wait for a confirmed breakout or breakdown to determine the next directional move. Keep a close eye on upcoming price action.
Bitcoin is consolidating within the descending triangle pattern and is currently trading below the Ichimoku cloud, which is acting as a key resistance barrier.
A solid breakout above the triangle resistance and the cloud could signal a bullish recovery, while a breakdown below the pattern’s support could trigger further downside.
Wait for a confirmed breakout or breakdown to determine the next directional move. Keep a close eye on upcoming price action.
1
82
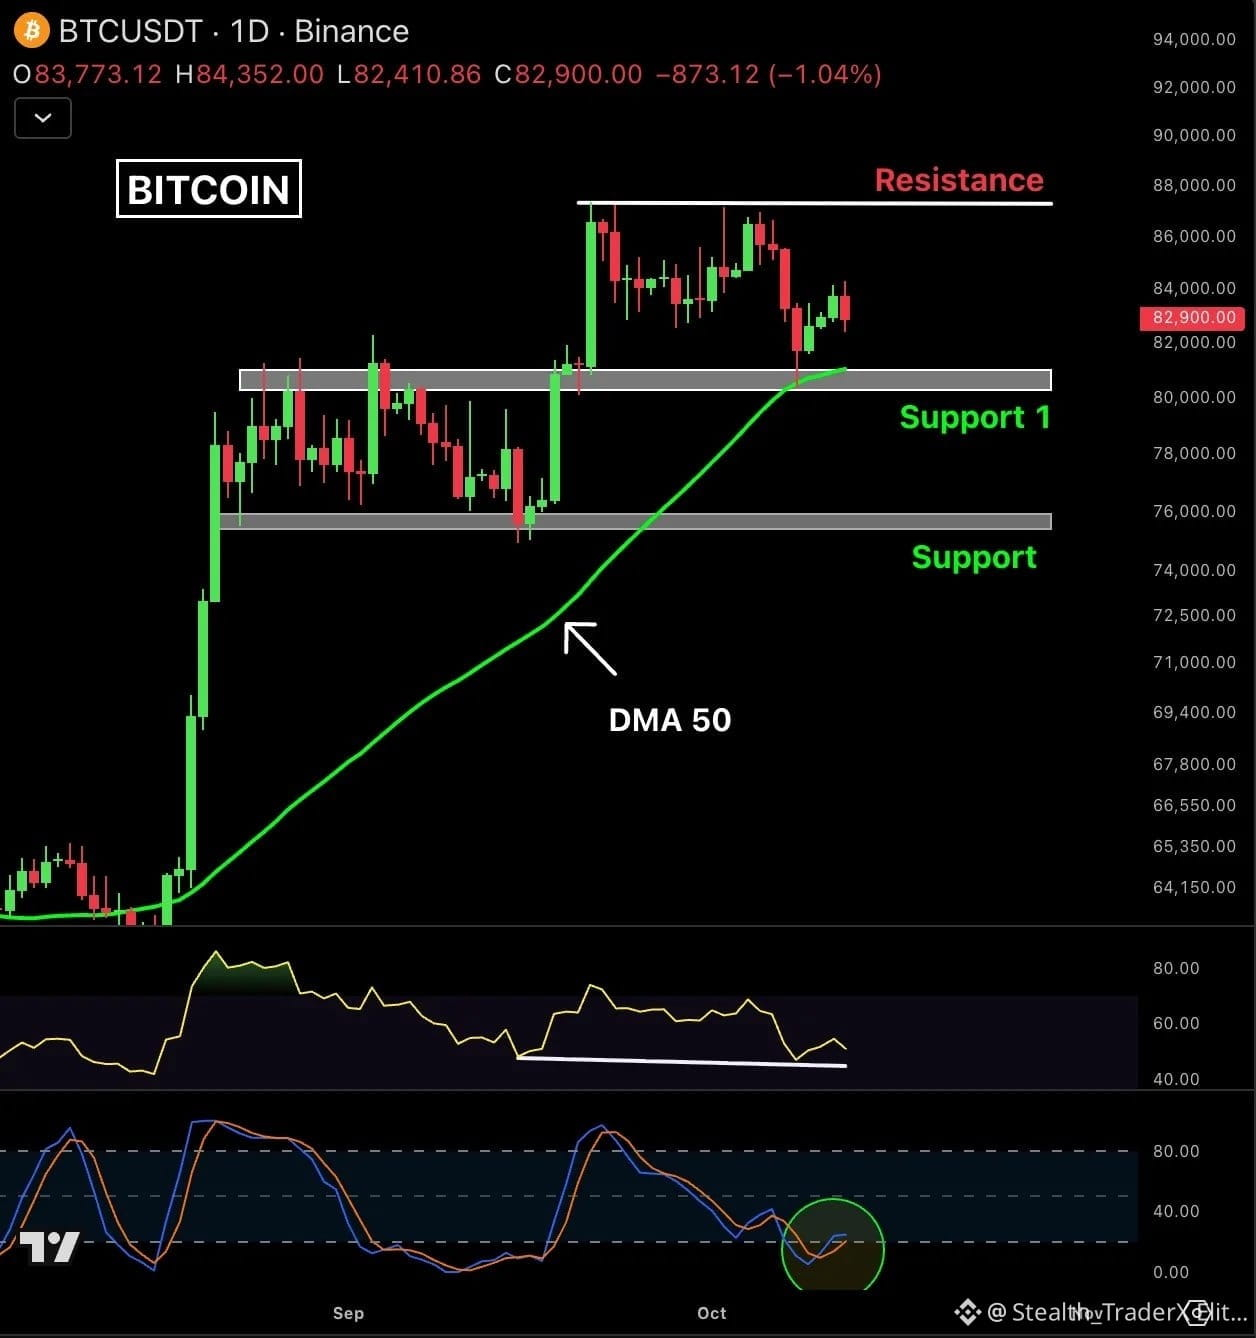
$BTC analysis
Bitcoin bounced from the Daily MA 50 support and trading near $83,000.
Now, all eyes on the $80,960 support and $87,500 resistance.
The next major test comes on October 14 with the US CPI report.#BTC走势分析 #BitcoinOptionsVolatilityHitsFiveYearLow
{spot}(BTCUSDT)
$BTC analysis
Bitcoin bounced from the Daily MA 50 support and trading near $83,000.
Now, all eyes on the $80,960 support and $87,500 resistance.
The next major test comes on October 14 with the US CPI report.#BTC走势分析 #BitcoinOptionsVolatilityHitsFiveYearLow
Bitcoin bounced from the Daily MA 50 support and trading near $83,000.
Now, all eyes on the $80,960 support and $87,500 resistance.
The next major test comes on October 14 with the US CPI report.#BTC走势分析 #BitcoinOptionsVolatilityHitsFiveYearLow
1
45
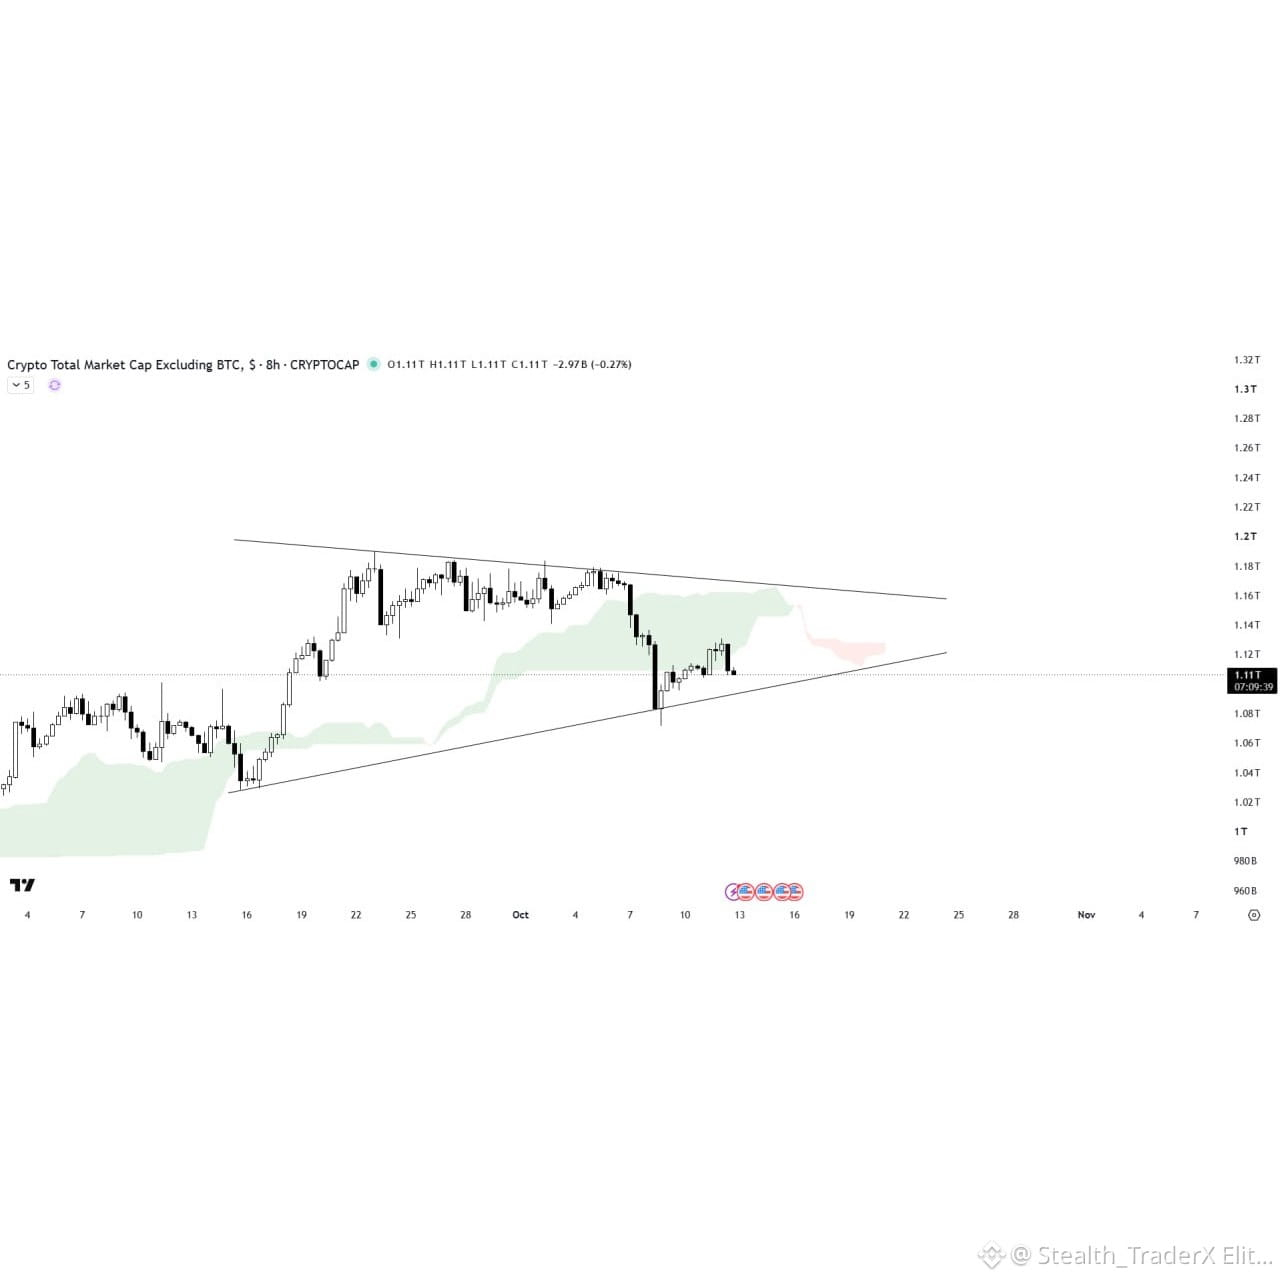
$ALT MARKET CAP ANALYSIS
The ALTS Market Cap is consolidating within the symmetrical triangle pattern and is currently trading above the support trendline.
The Ichimoku cloud is acting as a key resistance barrier above the current price action. We need to wait for a solid breakout or breakdown to confirm the next directional move in the altcoin market.#Altcoins!
$ALT MARKET CAP ANALYSIS
The ALTS Market Cap is consolidating within the symmetrical triangle pattern and is currently trading above the support trendline.
The Ichimoku cloud is acting as a key resistance barrier above the current price action. We need to wait for a solid breakout or breakdown to confirm the next directional move in the altcoin market.#Altcoins!
The ALTS Market Cap is consolidating within the symmetrical triangle pattern and is currently trading above the support trendline.
The Ichimoku cloud is acting as a key resistance barrier above the current price action. We need to wait for a solid breakout or breakdown to confirm the next directional move in the altcoin market.#Altcoins!
1
182
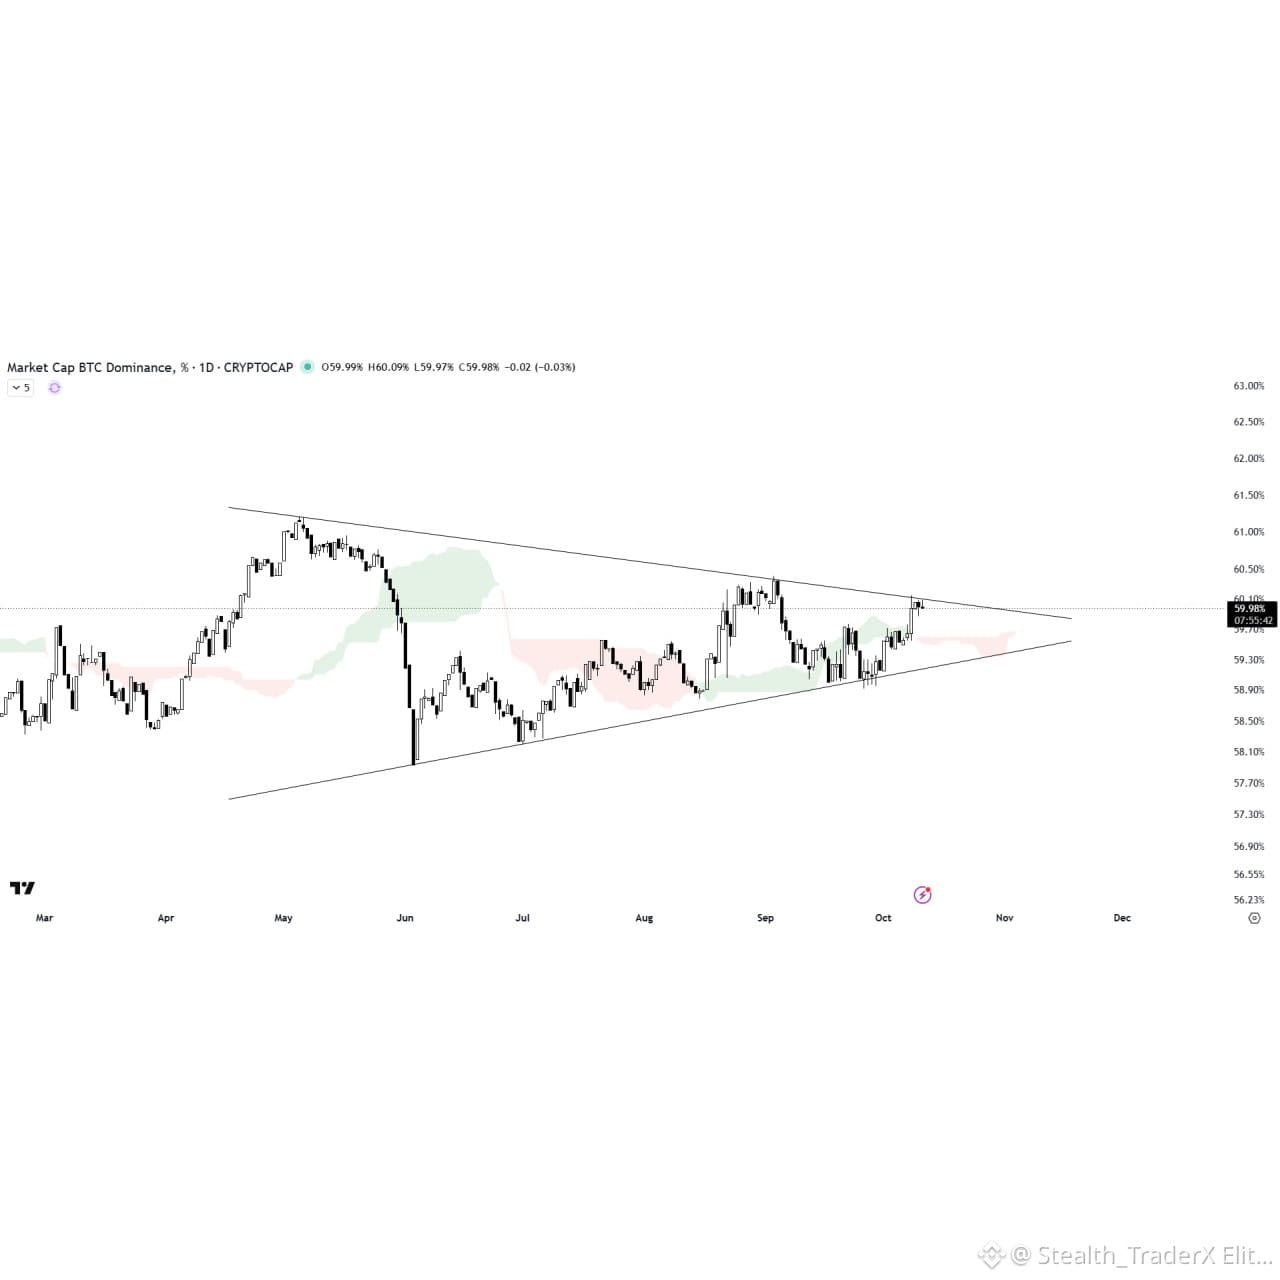
$BTC DOMINANCE ANALYSIS
BTC.D is consolidating within the symmetrical triangle pattern and is currently trading below the resistance trendline.
The Ichimoku cloud is acting as a key support zone below the current price action, showing strength in the structure.
A solid breakout above the triangle resistance could signal a bullish move in BTC.D, while rejection from this level could lead to further downside.
It’s important to note that BTC Dominance often shares an inverse relationship with the altcoin market cap.#BTC #EtherETFsExtendOutflowsToNineDays
$BTC DOMINANCE ANALYSIS
BTC.D is consolidating within the symmetrical triangle pattern and is currently trading below the resistance trendline.
The Ichimoku cloud is acting as a key support zone below the current price action, showing strength in the structure.
A solid breakout above the triangle resistance could signal a bullish move in BTC.D, while rejection from this level could lead to further downside.
It’s important to note that BTC Dominance often shares an inverse relationship with the altcoin market cap.#BTC #EtherETFsExtendOutflowsToNineDays
BTC.D is consolidating within the symmetrical triangle pattern and is currently trading below the resistance trendline.
The Ichimoku cloud is acting as a key support zone below the current price action, showing strength in the structure.
A solid breakout above the triangle resistance could signal a bullish move in BTC.D, while rejection from this level could lead to further downside.
It’s important to note that BTC Dominance often shares an inverse relationship with the altcoin market cap.#BTC #EtherETFsExtendOutflowsToNineDays
1
91
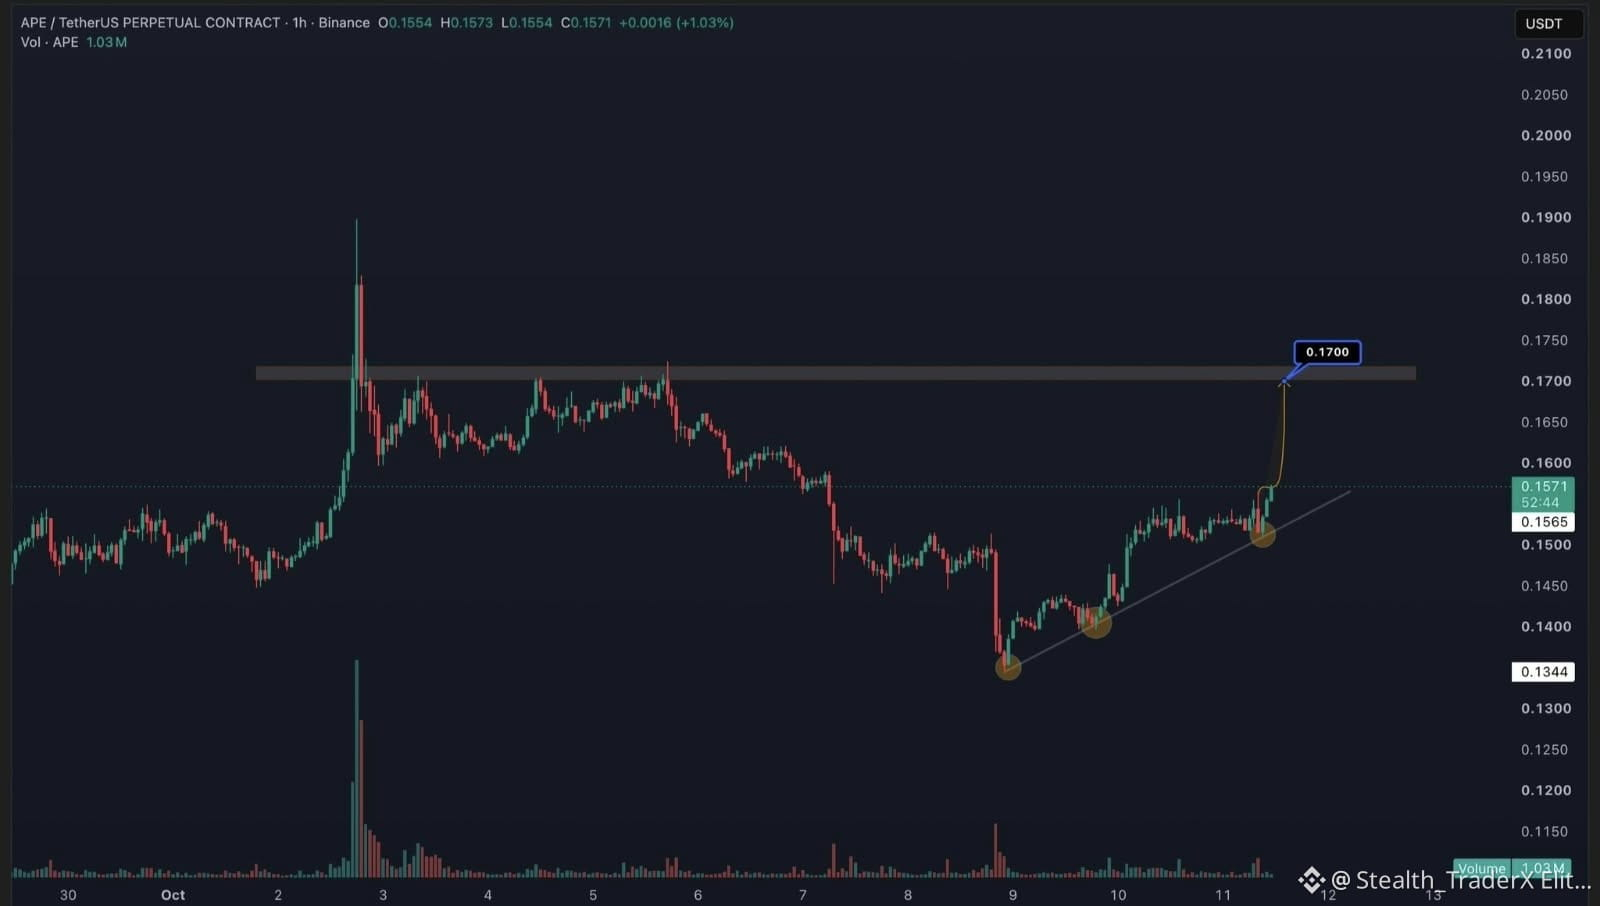
$APE USDT
Keep your eyes on it, i am expecting a continued growth
$APE USDT
Keep your eyes on it, i am expecting a continued growth
Keep your eyes on it, i am expecting a continued growth
1
192
$BTC
$84k loading...
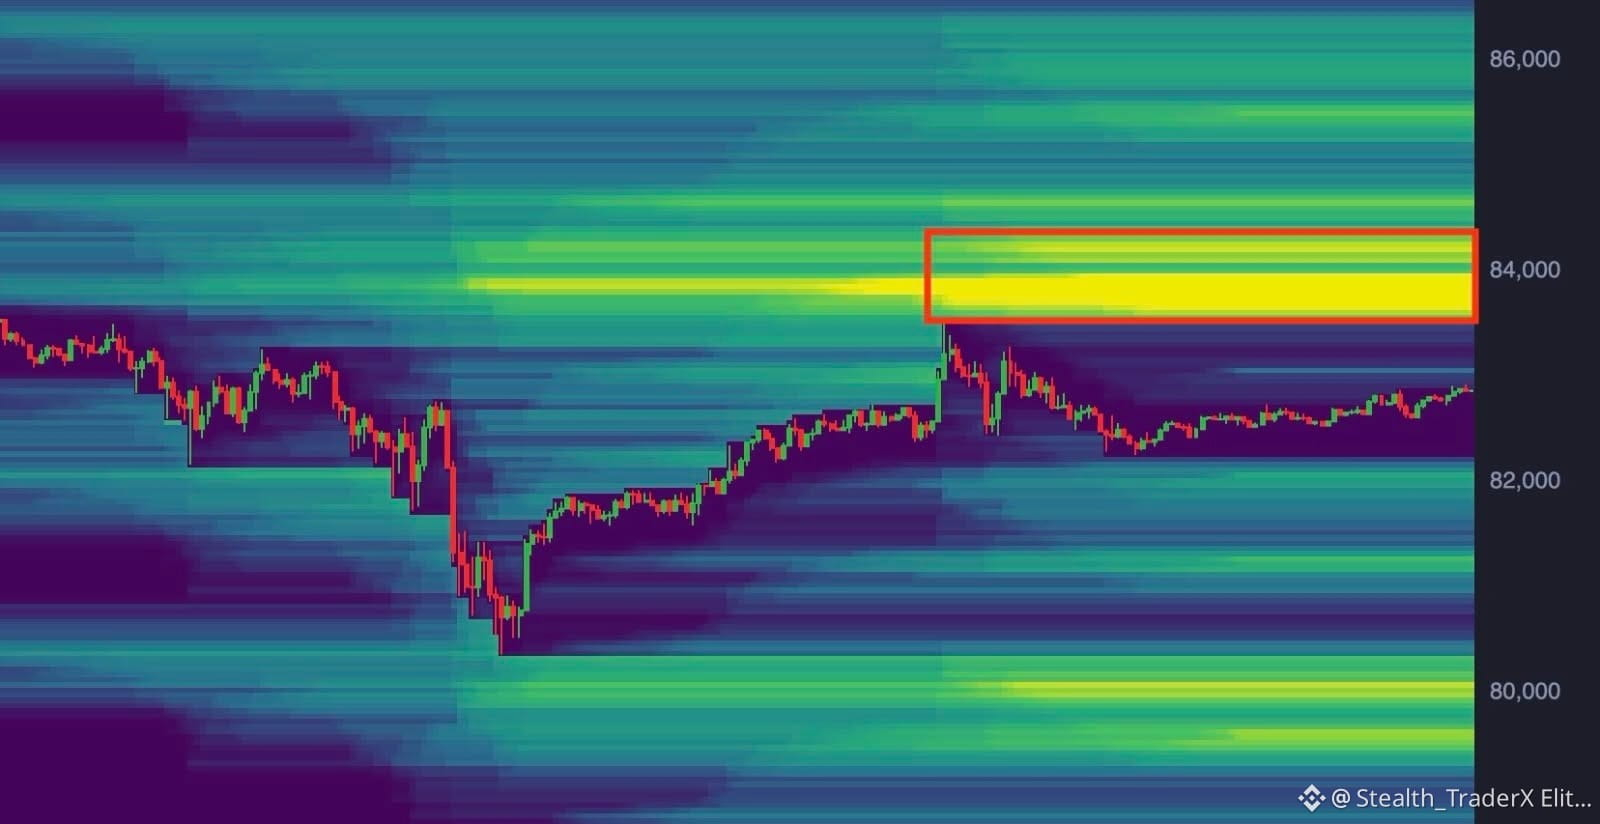
After hunting out the majority of downside liquidity, a huge cluster of short liquidations has built up right around the $84k region.
I wouldn’t be surprised to see this cluster get taken out over the weekend.
A move into that area would also put price right back above the range lows, opening the door for another continuation to the upside if price can hold above them.#BTC #XRPLedgerPatchesXRPCreationBug
$BTC
$84k loading...
After hunting out the majority of downside liquidity, a huge cluster of short liquidations has built up right around the $84k region.
I wouldn’t be surprised to see this cluster get taken out over the weekend.
A move into that area would also put price right back above the range lows, opening the door for another continuation to the upside if price can hold above them.#BTC #XRPLedgerPatchesXRPCreationBug
$84k loading...
After hunting out the majority of downside liquidity, a huge cluster of short liquidations has built up right around the $84k region.
I wouldn’t be surprised to see this cluster get taken out over the weekend.
A move into that area would also put price right back above the range lows, opening the door for another continuation to the upside if price can hold above them.#BTC #XRPLedgerPatchesXRPCreationBug
1
54
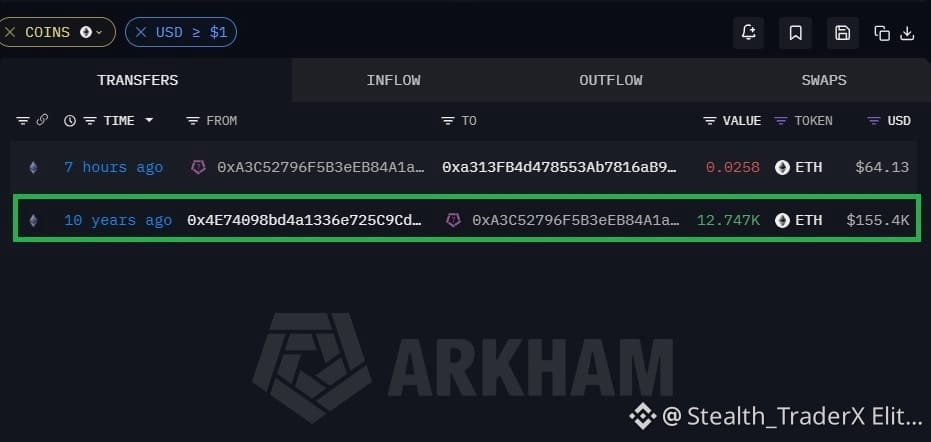
Someone bought 12,747 $ETH at $12 in 2016.
Held it for 10 years and survived multiple 80%+ crashes.
Today, he moved his holding, which is now worth $31,860,000.
A 20,400% return by simply believing.
Someone bought 12,747 $ETH at $12 in 2016.
Held it for 10 years and survived multiple 80%+ crashes.
Today, he moved his holding, which is now worth $31,860,000.
A 20,400% return by simply believing.
Held it for 10 years and survived multiple 80%+ crashes.
Today, he moved his holding, which is now worth $31,860,000.
A 20,400% return by simply believing.
1
89
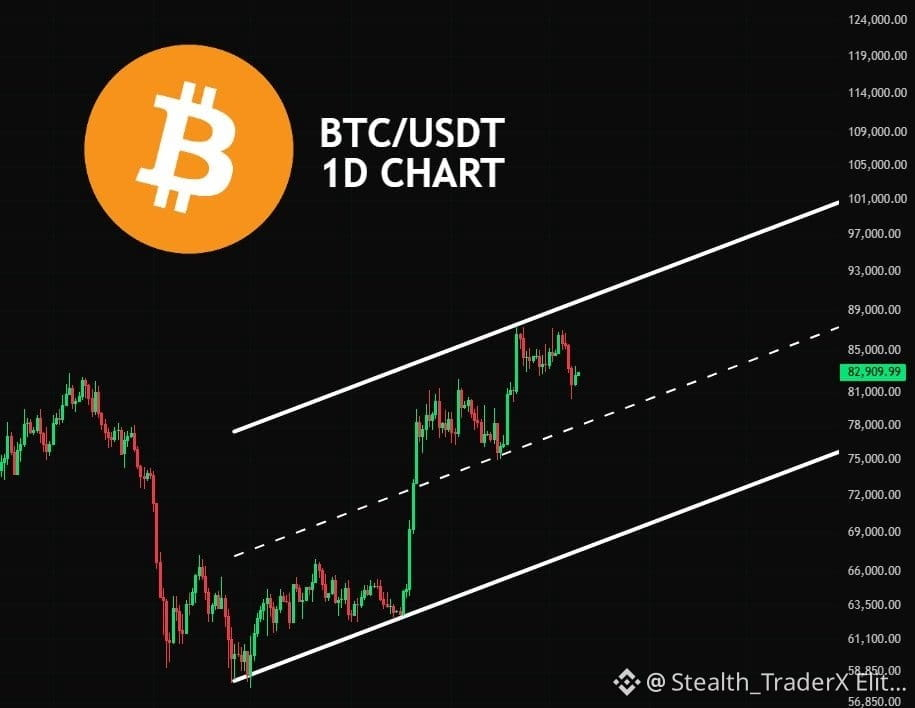
$BTC is also moving within an ascending channel.
$BTC is also moving within an ascending channel.
1
128
$BTC
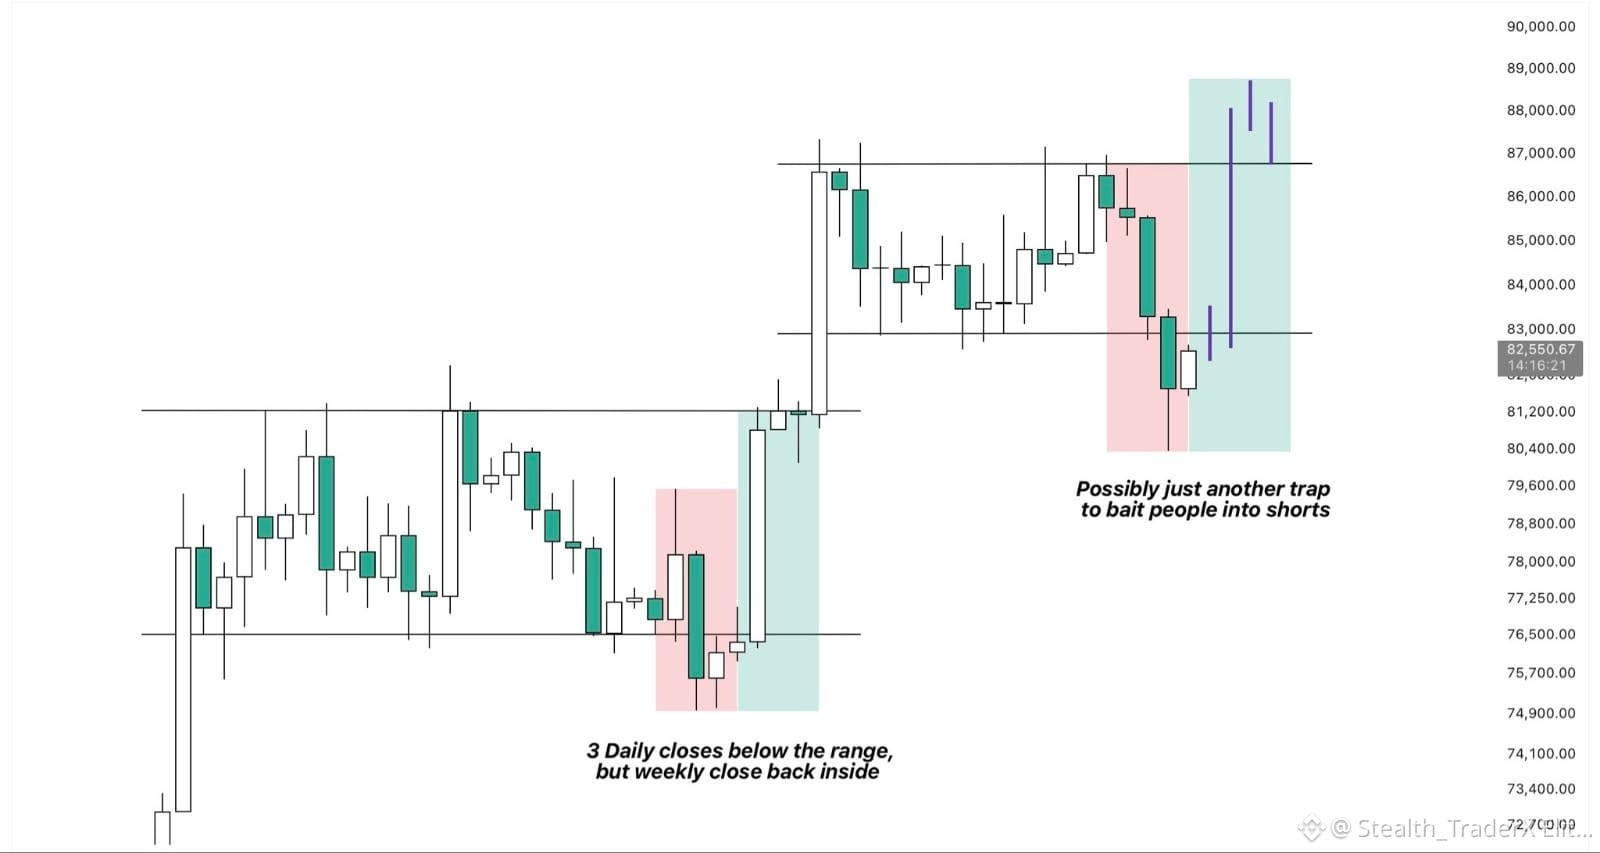
We’ve now seen a daily close below the range lows, so a confirmed breakdown, right?
Well, that’s what many people also thought when price deviated below the lows of the previous range.
However, that’s when BTC pumped roughly 6%, reversing the entire dump and closing the week right back below the highs of that range.
In my opinion, it’s therefore crucial to wait for the upcoming weekly close as confirmation here.
If we close back above $83k, there’s a decent chance we just keep on expanding higher going into next week and trade back around the highs at $87k soon.
But if we close below that level instead, we will likely push lower and potentially even sweep the lows around $75k.
#SolanaPlansToCutBlockTimesTo200ms
$BTC
We’ve now seen a daily close below the range lows, so a confirmed breakdown, right?
Well, that’s what many people also thought when price deviated below the lows of the previous range.
However, that’s when BTC pumped roughly 6%, reversing the entire dump and closing the week right back below the highs of that range.
In my opinion, it’s therefore crucial to wait for the upcoming weekly close as confirmation here.
If we close back above $83k, there’s a decent chance we just keep on expanding higher going into next week and trade back around the highs at $87k soon.
But if we close below that level instead, we will likely push lower and potentially even sweep the lows around $75k.
#SolanaPlansToCutBlockTimesTo200ms
We’ve now seen a daily close below the range lows, so a confirmed breakdown, right?
Well, that’s what many people also thought when price deviated below the lows of the previous range.
However, that’s when BTC pumped roughly 6%, reversing the entire dump and closing the week right back below the highs of that range.
In my opinion, it’s therefore crucial to wait for the upcoming weekly close as confirmation here.
If we close back above $83k, there’s a decent chance we just keep on expanding higher going into next week and trade back around the highs at $87k soon.
But if we close below that level instead, we will likely push lower and potentially even sweep the lows around $75k.
#SolanaPlansToCutBlockTimesTo200ms
1
141
$BTC
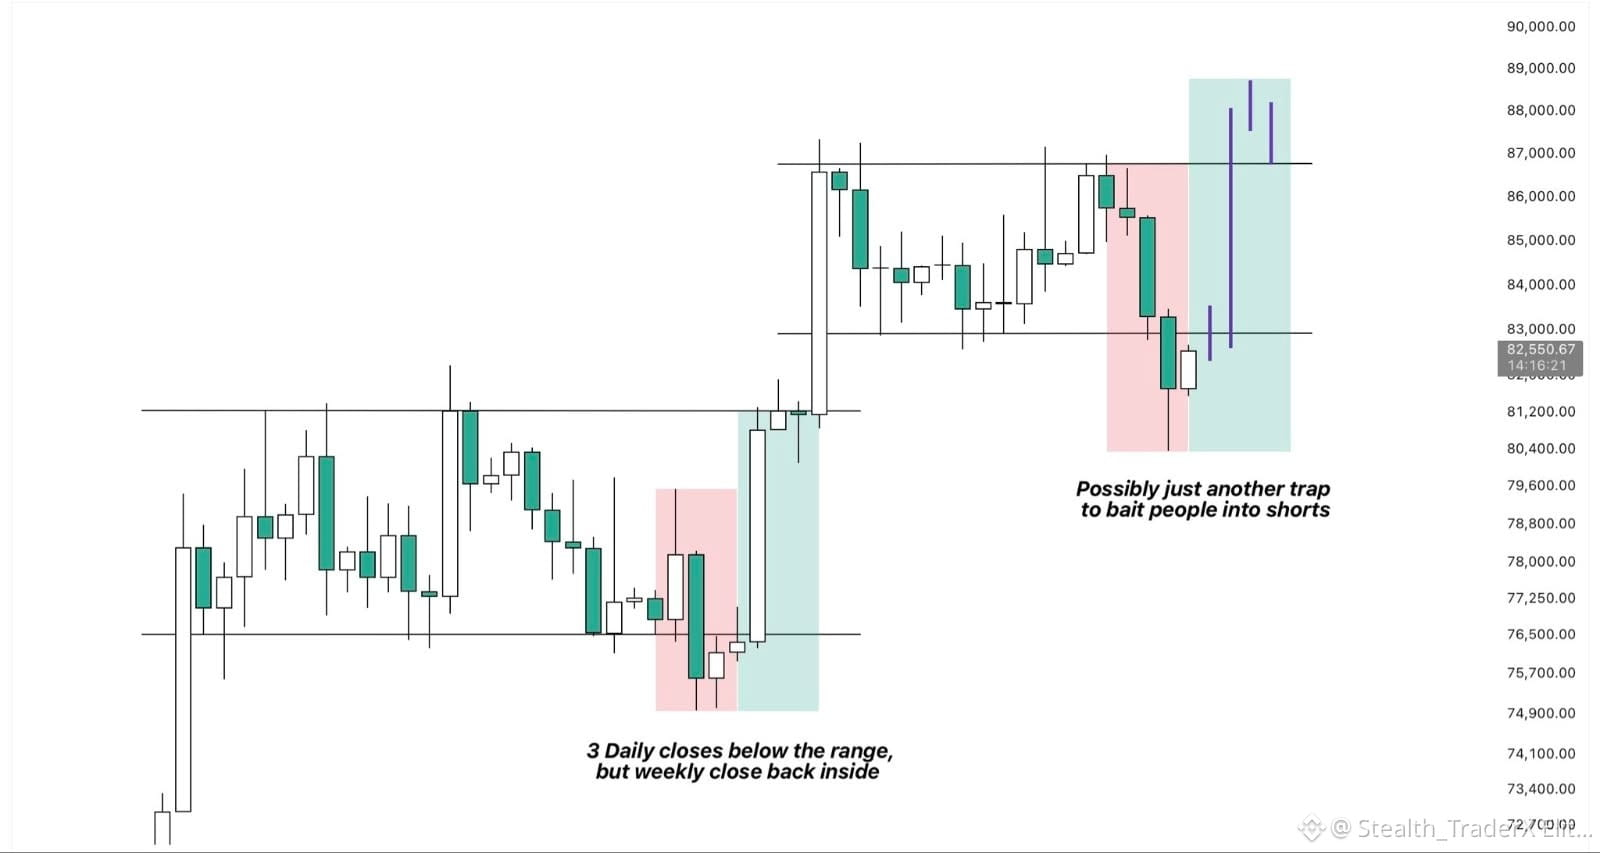
We’ve now seen a daily close below the range lows, so a confirmed breakdown, right?
Well, that’s what many people also thought when price deviated below the lows of the previous range.
However, that’s when BTC pumped roughly 6%, reversing the entire dump and closing the week right back below the highs of that range.
In my opinion, it’s therefore crucial to wait for the upcoming weekly close as confirmation here.
If we close back above $83k, there’s a decent chance we just keep on expanding higher going into next week and trade back around the highs at $87k soon.
But if we close below that level instead, we will likely push lower and potentially even sweep the lows around $75k.
#SolanaPlansToCutBlockTimesTo200ms
$BTC
We’ve now seen a daily close below the range lows, so a confirmed breakdown, right?
Well, that’s what many people also thought when price deviated below the lows of the previous range.
However, that’s when BTC pumped roughly 6%, reversing the entire dump and closing the week right back below the highs of that range.
In my opinion, it’s therefore crucial to wait for the upcoming weekly close as confirmation here.
If we close back above $83k, there’s a decent chance we just keep on expanding higher going into next week and trade back around the highs at $87k soon.
But if we close below that level instead, we will likely push lower and potentially even sweep the lows around $75k.
#SolanaPlansToCutBlockTimesTo200ms
We’ve now seen a daily close below the range lows, so a confirmed breakdown, right?
Well, that’s what many people also thought when price deviated below the lows of the previous range.
However, that’s when BTC pumped roughly 6%, reversing the entire dump and closing the week right back below the highs of that range.
In my opinion, it’s therefore crucial to wait for the upcoming weekly close as confirmation here.
If we close back above $83k, there’s a decent chance we just keep on expanding higher going into next week and trade back around the highs at $87k soon.
But if we close below that level instead, we will likely push lower and potentially even sweep the lows around $75k.
#SolanaPlansToCutBlockTimesTo200ms
1
124
↗️ $BTC
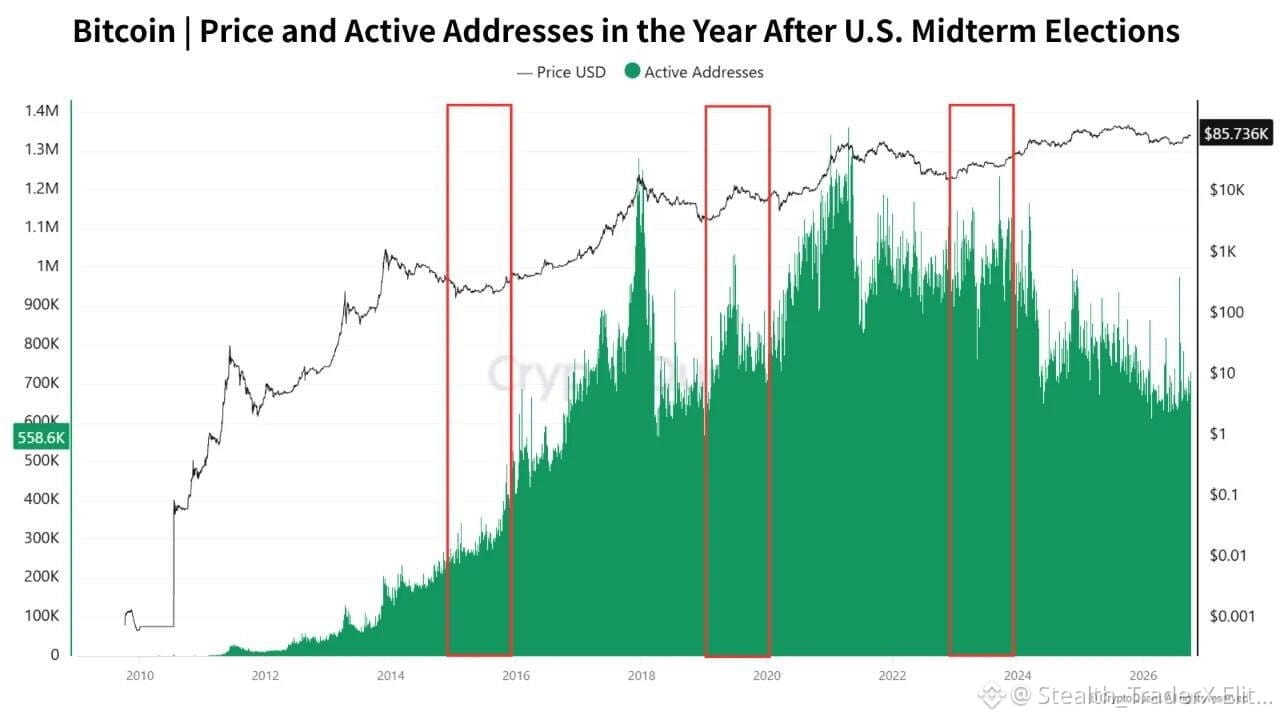
Bitcoin gained 24.5%, 44.9% and 92.3% in the 12 months after the 2014, 2018 and 2022 U.S. midterms, according to a CryptoQuant analyst.
🔲 World Wide Futures | Private signal
↗️ $BTC
Bitcoin gained 24.5%, 44.9% and 92.3% in the 12 months after the 2014, 2018 and 2022 U.S. midterms, according to a CryptoQuant analyst.
🔲 World Wide Futures | Private signal
Bitcoin gained 24.5%, 44.9% and 92.3% in the 12 months after the 2014, 2018 and 2022 U.S. midterms, according to a CryptoQuant analyst.
🔲 World Wide Futures | Private signal
1
43
💰 $APT Coin.
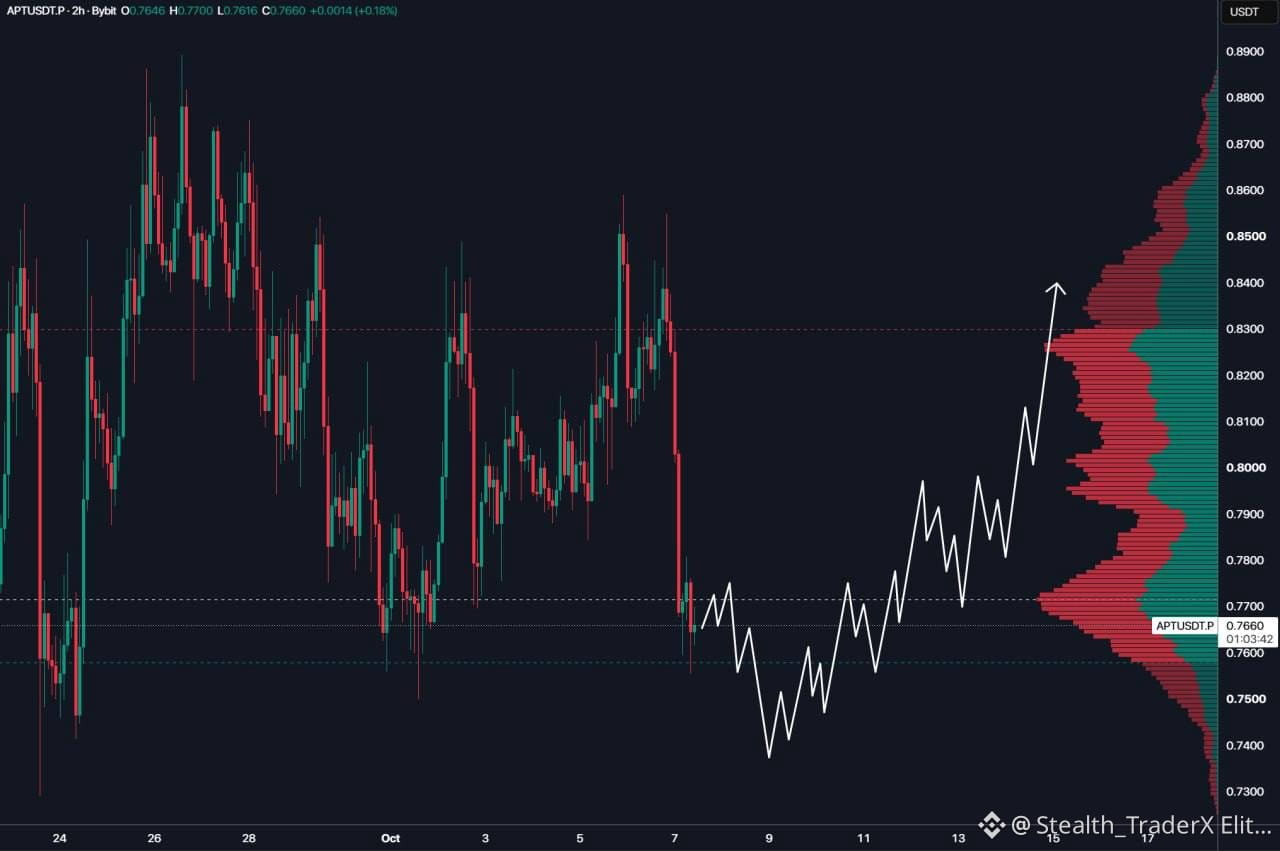
The coin may begin a new uptrend after consolidating below the VAL volume level of $0.7580. If, after consolidating, the coin returns above this level, an uptrend will then begin with the goal of reaching the VAH volume level of $0.83.
#APT🔥
💰 $APT Coin.
The coin may begin a new uptrend after consolidating below the VAL volume level of $0.7580. If, after consolidating, the coin returns above this level, an uptrend will then begin with the goal of reaching the VAH volume level of $0.83.
#APT🔥
The coin may begin a new uptrend after consolidating below the VAL volume level of $0.7580. If, after consolidating, the coin returns above this level, an uptrend will then begin with the goal of reaching the VAH volume level of $0.83.
#APT🔥
1
1.8k
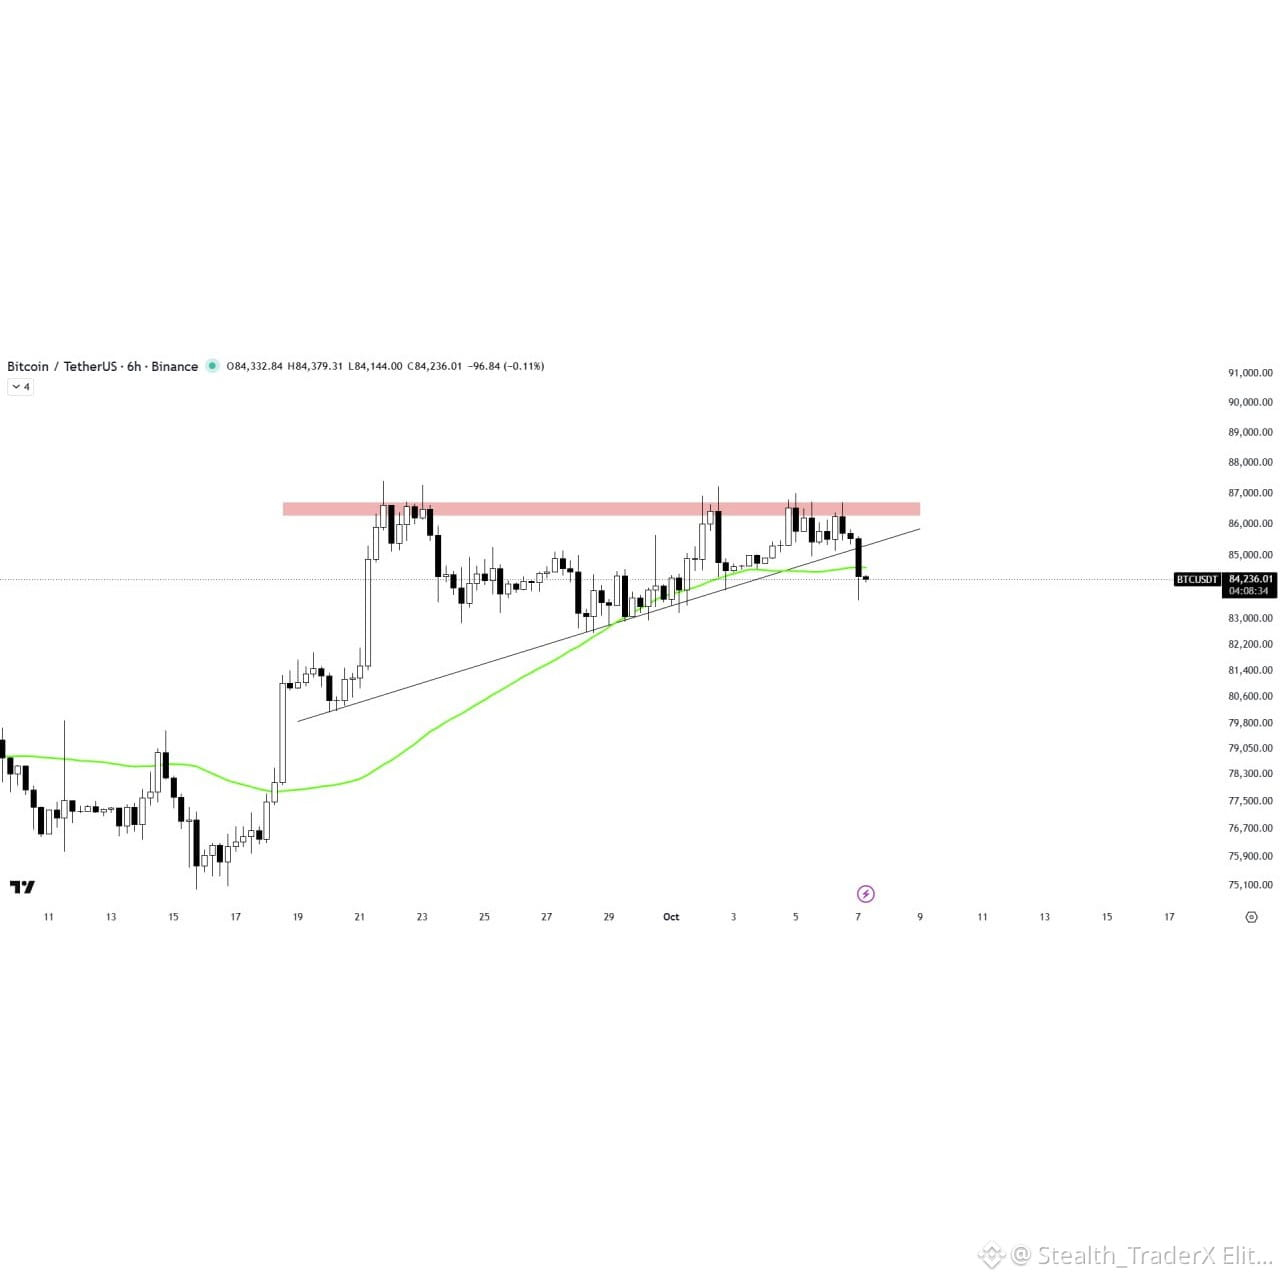
$BTC /USDT ANALYSIS
Bitcoin has broken down from the ascending triangle pattern with significant volume, signaling increasing bearish pressure.
The 50MA is acting as a key resistance barrier above the current price action.
Further downside in the market could follow if bearish momentum continues.
#BTC走势分析 #DubaiVARAIssuesReserveAssetAuditCircular
$BTC /USDT ANALYSIS
Bitcoin has broken down from the ascending triangle pattern with significant volume, signaling increasing bearish pressure.
The 50MA is acting as a key resistance barrier above the current price action.
Further downside in the market could follow if bearish momentum continues.
#BTC走势分析 #DubaiVARAIssuesReserveAssetAuditCircular
Bitcoin has broken down from the ascending triangle pattern with significant volume, signaling increasing bearish pressure.
The 50MA is acting as a key resistance barrier above the current price action.
Further downside in the market could follow if bearish momentum continues.
#BTC走势分析 #DubaiVARAIssuesReserveAssetAuditCircular
100
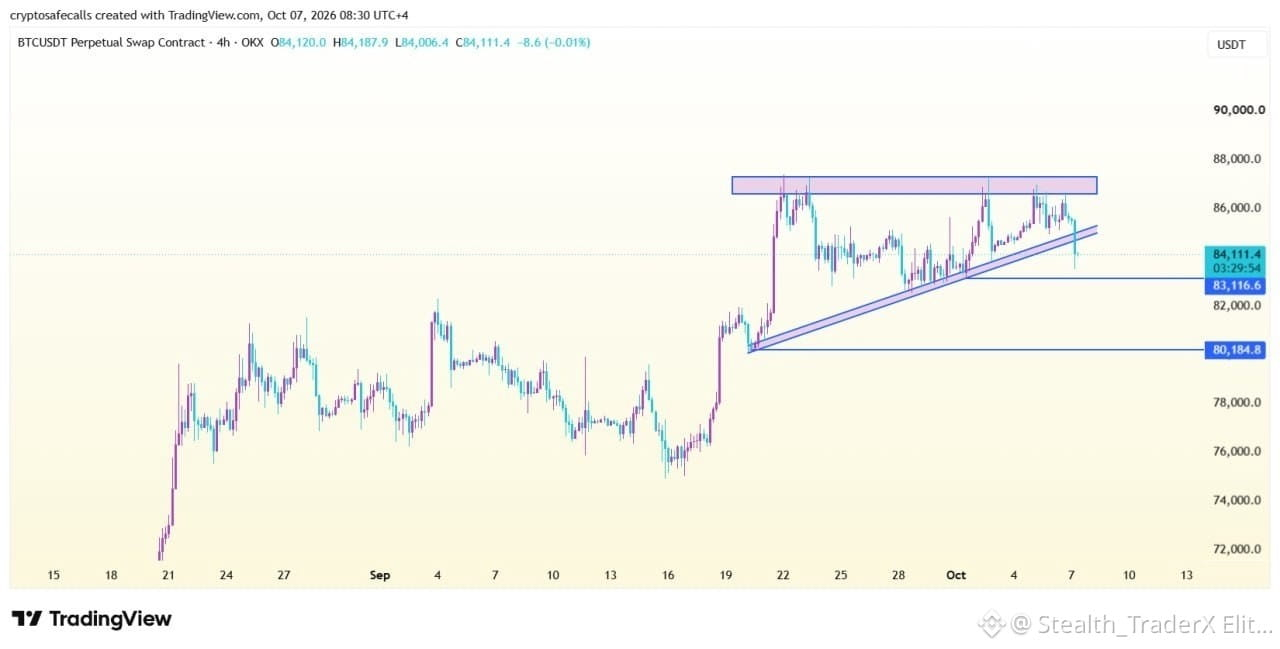
💰$BTC /USDT | 4H Update 🕯
BTC broke the rising trendline and reached the $83,500 zone exactly as mentioned in yesterday’s update.🏹
📌$83K zone is the key level to watch. A breakdown could open $80.2K. 👀
💰$BTC /USDT | 4H Update 🕯
BTC broke the rising trendline and reached the $83,500 zone exactly as mentioned in yesterday’s update.🏹
📌$83K zone is the key level to watch. A breakdown could open $80.2K. 👀
BTC broke the rising trendline and reached the $83,500 zone exactly as mentioned in yesterday’s update.🏹
📌$83K zone is the key level to watch. A breakdown could open $80.2K. 👀
1
134
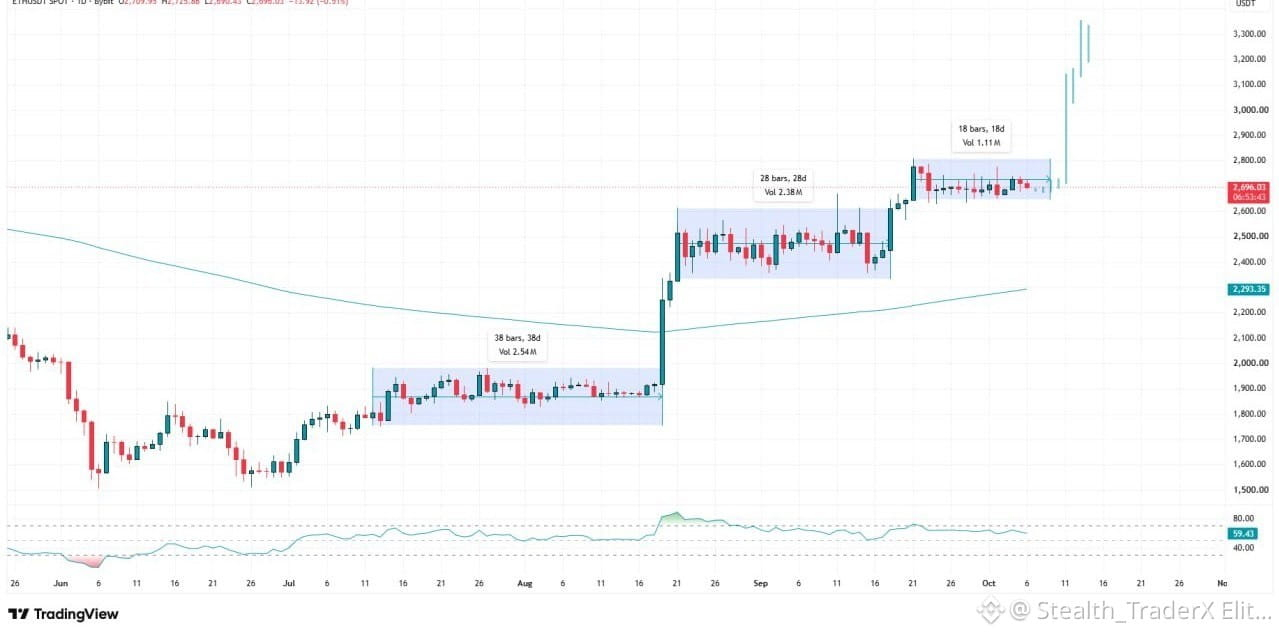
$ETH
Tick-tock… #ETH is approaching a decision point. ⏳
The setup is getting tighter, and the next confirmed move could define the short-term direction.#BinanceLaunchesBinanceIntelligence #analysis
$ETH
Tick-tock… #ETH is approaching a decision point. ⏳
The setup is getting tighter, and the next confirmed move could define the short-term direction.#BinanceLaunchesBinanceIntelligence #analysis
Tick-tock… #ETH is approaching a decision point. ⏳
The setup is getting tighter, and the next confirmed move could define the short-term direction.#BinanceLaunchesBinanceIntelligence #analysis
2
109
Log in to explore more content
Join global crypto users on Binance Square
⚡️ Get latest and useful information about crypto.
💬 Trusted by the world’s largest crypto exchange.
👍 Discover real insights from verified creators.
Email / Phone number
Trending Topics
BinanceIncidentReport
22,597 views
463 Discussing
29 October 2026 Binance Security Incident: Initial Findings and Response Update
Binance Blog
·236 Likes
·652.4k views
BinanceReopensWithdrawalsForMoreAssets
125,635 views
1,678 Discussing
BinanceHourlyDepositsExceedWithdrawals
60,547 views
764 Discussing