
Faysal Aziz
521 Posts

Faysal Aziz
Report
Block User
Trade for Freedom!
Frequent Trader
2.4 Years
11 Following
75 Followers
348 Liked
Posts
All
Quotes
·
--
Bullish
Litecoin (LTC) – Market Update
LTC is currently trading around $53.98, with a market cap of approximately $4.19B and 24H trading volume of $149M.
Litecoin remains a well-established payment-focused blockchain, known for fast transactions and low fees.
The short-term market is showing bearish pressure. Traders are watching for a possible recovery or further downside.
What's your outlook on LTC? Bullish or bearish?
#Litecoin #LTC #CryptoMarket #BinanceSquare
$LTC
{spot}(LTCUSDT)
Litecoin (LTC) – Market Update
LTC is currently trading around $53.98, with a market cap of approximately $4.19B and 24H trading volume of $149M.
Litecoin remains a well-established payment-focused blockchain, known for fast transactions and low fees.
The short-term market is showing bearish pressure. Traders are watching for a possible recovery or further downside.
What's your outlook on LTC? Bullish or bearish?
#Litecoin #LTC #CryptoMarket #BinanceSquare
$LTC
LTC is currently trading around $53.98, with a market cap of approximately $4.19B and 24H trading volume of $149M.
Litecoin remains a well-established payment-focused blockchain, known for fast transactions and low fees.
The short-term market is showing bearish pressure. Traders are watching for a possible recovery or further downside.
What's your outlook on LTC? Bullish or bearish?
#Litecoin #LTC #CryptoMarket #BinanceSquare
$LTC

100
·
--
Bullish
SOL/USDT – Trade Setup
Entry:$92 - $93
Target 1: $96.00
Target 2: $98.00
🛑 Stop Loss: $88
#SOL #Solana #CryptoTrading #TradeSetup
$SOL
{spot}(SOLUSDT)
SOL/USDT – Trade Setup
Entry:$92 - $93
Target 1: $96.00
Target 2: $98.00
🛑 Stop Loss: $88
#SOL #Solana #CryptoTrading #TradeSetup
$SOL
Entry:$92 - $93
Target 1: $96.00
Target 2: $98.00
🛑 Stop Loss: $88
#SOL #Solana #CryptoTrading #TradeSetup
$SOL
2
170
·
--
Bullish
Solana (SOL) Market Update 🚀
SOL is trading around $94.80, with a 24H volume of approximately $1.75B.
Solana's fast transactions, low fees, and strong ecosystem keep it in focus.
Short-term outlook looks slightly bearish. Key support is around $92, while resistance sits near $96–$100.
A breakout above $96 could bring bullish momentum. Otherwise, SOL may remain under pressure.
#Solana #SOL #CryptoAnalysis
$SOL
{spot}(SOLUSDT)
Solana (SOL) Market Update 🚀
SOL is trading around $94.80, with a 24H volume of approximately $1.75B.
Solana's fast transactions, low fees, and strong ecosystem keep it in focus.
Short-term outlook looks slightly bearish. Key support is around $92, while resistance sits near $96–$100.
A breakout above $96 could bring bullish momentum. Otherwise, SOL may remain under pressure.
#Solana #SOL #CryptoAnalysis
$SOL
SOL is trading around $94.80, with a 24H volume of approximately $1.75B.
Solana's fast transactions, low fees, and strong ecosystem keep it in focus.
Short-term outlook looks slightly bearish. Key support is around $92, while resistance sits near $96–$100.
A breakout above $96 could bring bullish momentum. Otherwise, SOL may remain under pressure.
#Solana #SOL #CryptoAnalysis
$SOL

90
·
--
Binance Faces a $6.3 Billion Security Breach
Binance has faced a major security incident involving unauthorized withdrawals from its hot wallet, with an estimated financial impact of $6.3 billion.
Here are the key developments:
🔹 Binance says it will cover the financial losses using company funds and SAFU.
🔹 Around 90% of the affected assets have reportedly been covered.
🔹 Withdrawals have started resuming in phases.
🔹 Approximately $3.64 billion in net outflows were reported following the incident.
🔹 The FBI has attributed the attack to North Korea's TraderTraitor group.
This incident raises important questions about exchange security, transparency, and the protection of digital assets.
The crypto industry needs stronger security measures and greater transparency.
Stay informed. Stay cautious. DYOR.
#Binance #CryptoNews #Bitcoin #CryptoSecurity #Blockchain
$SOL $LTC
{spot}(SOLUSDT)
{spot}(LTCUSDT)
Binance Faces a $6.3 Billion Security Breach
Binance has faced a major security incident involving unauthorized withdrawals from its hot wallet, with an estimated financial impact of $6.3 billion.
Here are the key developments:
🔹 Binance says it will cover the financial losses using company funds and SAFU.
🔹 Around 90% of the affected assets have reportedly been covered.
🔹 Withdrawals have started resuming in phases.
🔹 Approximately $3.64 billion in net outflows were reported following the incident.
🔹 The FBI has attributed the attack to North Korea's TraderTraitor group.
This incident raises important questions about exchange security, transparency, and the protection of digital assets.
The crypto industry needs stronger security measures and greater transparency.
Stay informed. Stay cautious. DYOR.
#Binance #CryptoNews #Bitcoin #CryptoSecurity #Blockchain
$SOL $LTC
Binance has faced a major security incident involving unauthorized withdrawals from its hot wallet, with an estimated financial impact of $6.3 billion.
Here are the key developments:
🔹 Binance says it will cover the financial losses using company funds and SAFU.
🔹 Around 90% of the affected assets have reportedly been covered.
🔹 Withdrawals have started resuming in phases.
🔹 Approximately $3.64 billion in net outflows were reported following the incident.
🔹 The FBI has attributed the attack to North Korea's TraderTraitor group.
This incident raises important questions about exchange security, transparency, and the protection of digital assets.
The crypto industry needs stronger security measures and greater transparency.
Stay informed. Stay cautious. DYOR.
#Binance #CryptoNews #Bitcoin #CryptoSecurity #Blockchain
$SOL $LTC

5
635
·
--
Please Vote for Pakistan and Shafique Jaffery
Please Vote for Pakistan and Shafique Jaffery

Shafique jaffery
·
--
Alhamdililah Nominated in Top 100 Creators
Vote here
Vote here

2
65
·
--
Bullish
What’s up, traders!
It’s been a while, but I’m finally back on Binance Square!
From now on, expect regular market updates, trading insights, and daily signals to keep you updated on the market.
Let’s get back to the charts, stay disciplined, and catch the opportunities together.
Stay tuned — we’re back!
#xrp $XRP
{spot}(XRPUSDT)
What’s up, traders!
It’s been a while, but I’m finally back on Binance Square!
From now on, expect regular market updates, trading insights, and daily signals to keep you updated on the market.
Let’s get back to the charts, stay disciplined, and catch the opportunities together.
Stay tuned — we’re back!
#xrp $XRP
It’s been a while, but I’m finally back on Binance Square!
From now on, expect regular market updates, trading insights, and daily signals to keep you updated on the market.
Let’s get back to the charts, stay disciplined, and catch the opportunities together.
Stay tuned — we’re back!
#xrp $XRP
3
122
·
--
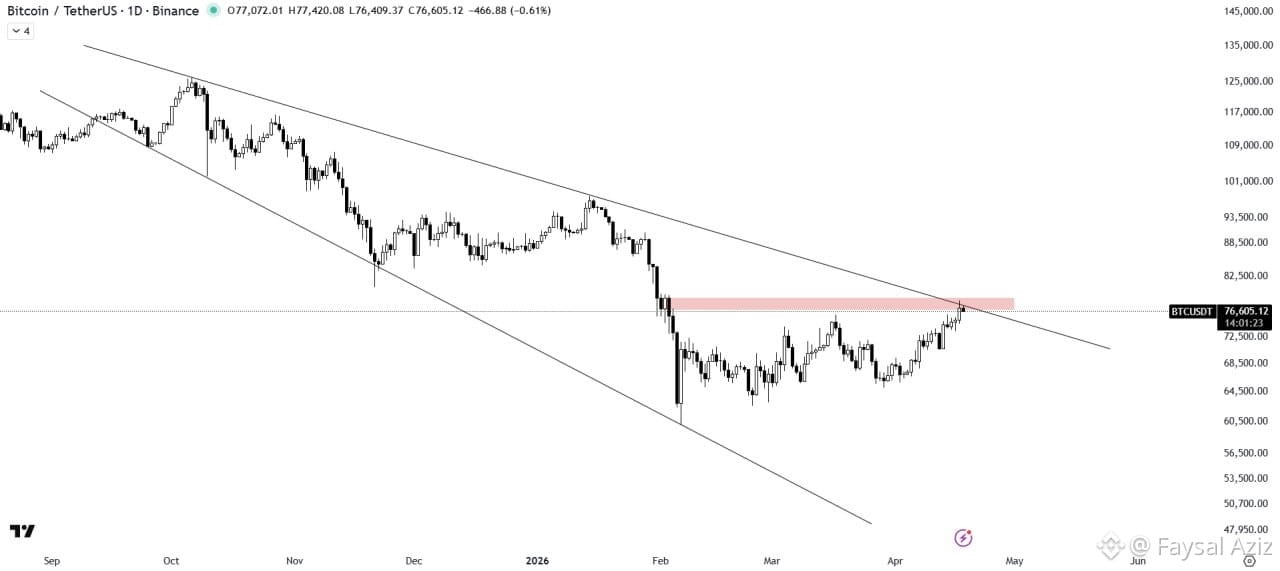
#BTC/USDT ANALYSIS
Bitcoin is facing rejection from both the resistance trendline and the horizontal supply zone, indicating potential for a short-term downward move.
However, a strong breakout above the pattern and the supply zone would invalidate the bearish outlook and could trigger a bullish rally in the market.
$BTC
{spot}(BTCUSDT)
#BTC/USDT ANALYSIS
Bitcoin is facing rejection from both the resistance trendline and the horizontal supply zone, indicating potential for a short-term downward move.
However, a strong breakout above the pattern and the supply zone would invalidate the bearish outlook and could trigger a bullish rally in the market.
$BTC
Bitcoin is facing rejection from both the resistance trendline and the horizontal supply zone, indicating potential for a short-term downward move.
However, a strong breakout above the pattern and the supply zone would invalidate the bearish outlook and could trigger a bullish rally in the market.
$BTC
2
19
·
--
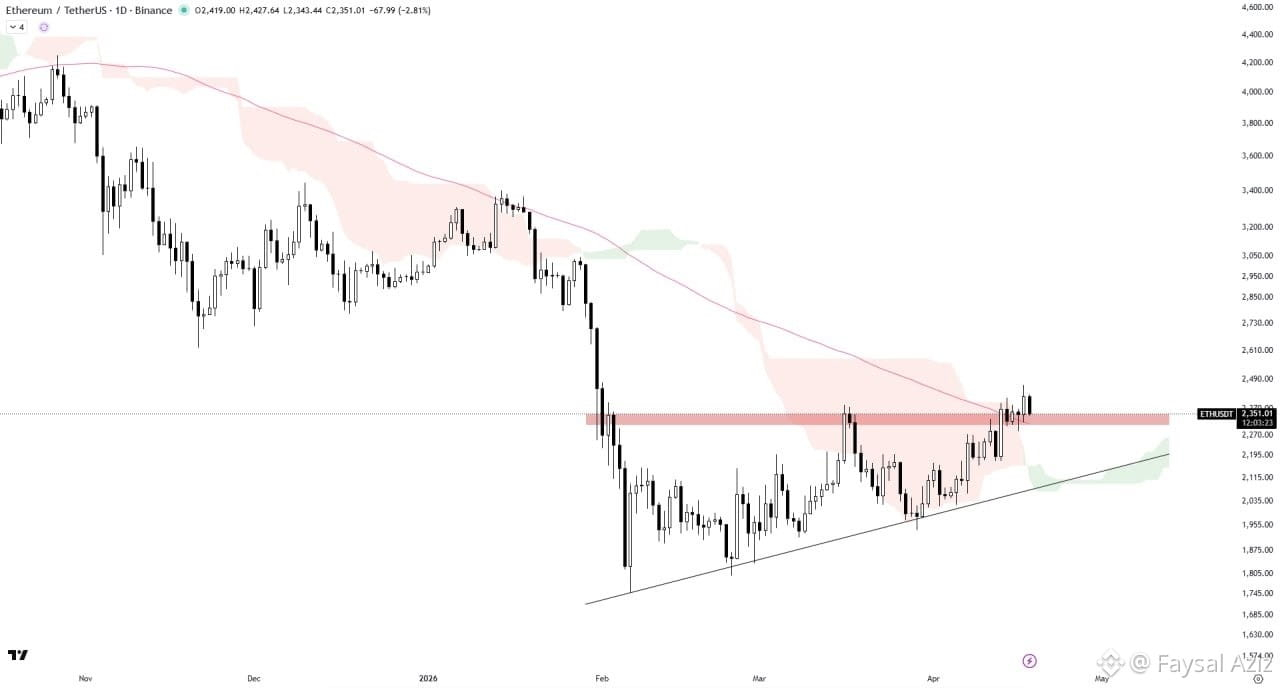
#ETH/USDT ANALYSIS
ETH has broken out of the ascending triangle and is now retesting above it. The 100 MA is also acting as support, while the Ichimoku Cloud indicates a shift in trend.
A successful retest above the triangle would confirm bullish momentum. However, if the retest fails, the price may move back inside the triangle and continue ranging.
$ETH
{spot}(ETHUSDT)
#ETH/USDT ANALYSIS
ETH has broken out of the ascending triangle and is now retesting above it. The 100 MA is also acting as support, while the Ichimoku Cloud indicates a shift in trend.
A successful retest above the triangle would confirm bullish momentum. However, if the retest fails, the price may move back inside the triangle and continue ranging.
$ETH
ETH has broken out of the ascending triangle and is now retesting above it. The 100 MA is also acting as support, while the Ichimoku Cloud indicates a shift in trend.
A successful retest above the triangle would confirm bullish momentum. However, if the retest fails, the price may move back inside the triangle and continue ranging.
$ETH
2
23
·
--
🚀 HYPE Signal Update 🚀
✅ HYPE ALL TPS HIT Successfully 🎯
💰 Profit Booked 🔥
Another smooth move in the market 📈
Discipline + Patience = Results
$HYPE
{future}(HYPEUSDT)
🚀 HYPE Signal Update 🚀
✅ HYPE ALL TPS HIT Successfully 🎯
💰 Profit Booked 🔥
Another smooth move in the market 📈
Discipline + Patience = Results
$HYPE
✅ HYPE ALL TPS HIT Successfully 🎯
💰 Profit Booked 🔥
Another smooth move in the market 📈
Discipline + Patience = Results
$HYPE
1
89
·
--
🚀 GENIUS/USDT ABSOLUTE BEAUTY!
🎯 ALL TAKE PROFIT SMASHED! ✅ 💰
Textbook move — levels respected to perfection.
Congrats to the disciplined traders 👏🔥
$GENIUS
{future}(GENIUSUSDT)
🚀 GENIUS/USDT ABSOLUTE BEAUTY!
🎯 ALL TAKE PROFIT SMASHED! ✅ 💰
Textbook move — levels respected to perfection.
Congrats to the disciplined traders 👏🔥
$GENIUS
🎯 ALL TAKE PROFIT SMASHED! ✅ 💰
Textbook move — levels respected to perfection.
Congrats to the disciplined traders 👏🔥
$GENIUS
1
9
·
--
#LUMIA has breached the descending channel pattern on the daily chart🔥
The breakout completion suggests significant upside potential is being unlocked💁♂️
If the pattern holds, we might see the price surge toward $0.42✈️
$LUMIA
{spot}(LUMIAUSDT)
#LUMIA has breached the descending channel pattern on the daily chart🔥
The breakout completion suggests significant upside potential is being unlocked💁♂️
If the pattern holds, we might see the price surge toward $0.42✈️
$LUMIA
The breakout completion suggests significant upside potential is being unlocked💁♂️
If the pattern holds, we might see the price surge toward $0.42✈️
$LUMIA
166
·
--
#CTK is maintaining its position above the lower border of the descending channel pattern on the weekly timeframe🔍
Emerging accumulation patterns indicate strengthening bullish sentiment👀
A confirmed reversal from this zone could trigger upward movement toward $1.75🐃
$CTK
{spot}(CTKUSDT)
#CTK is maintaining its position above the lower border of the descending channel pattern on the weekly timeframe🔍
Emerging accumulation patterns indicate strengthening bullish sentiment👀
A confirmed reversal from this zone could trigger upward movement toward $1.75🐃
$CTK
Emerging accumulation patterns indicate strengthening bullish sentiment👀
A confirmed reversal from this zone could trigger upward movement toward $1.75🐃
$CTK
47
·
--
#OP Market Analysis
OP/USDT shows a weak bearish structure with price lingering in the upper half of the Bollinger Bands and MACD turning bullish. RSI near 51 suggests indecision, caught between key resistances at 0.1094 and 0.1103. Bull case: hold above 0.1107 to target 0.1148 resistance with momentum likely to build. Bear case: lose 0.1082 support risks a deeper pullback to 0.1060 and below. Key level to watch: 0.1107
$OP
{spot}(OPUSDT)
#OP Market Analysis
OP/USDT shows a weak bearish structure with price lingering in the upper half of the Bollinger Bands and MACD turning bullish. RSI near 51 suggests indecision, caught between key resistances at 0.1094 and 0.1103. Bull case: hold above 0.1107 to target 0.1148 resistance with momentum likely to build. Bear case: lose 0.1082 support risks a deeper pullback to 0.1060 and below. Key level to watch: 0.1107
$OP
OP/USDT shows a weak bearish structure with price lingering in the upper half of the Bollinger Bands and MACD turning bullish. RSI near 51 suggests indecision, caught between key resistances at 0.1094 and 0.1103. Bull case: hold above 0.1107 to target 0.1148 resistance with momentum likely to build. Bear case: lose 0.1082 support risks a deeper pullback to 0.1060 and below. Key level to watch: 0.1107
$OP
4
·
--
#LDO Market Analysis
LDO/USDT is in a bullish structure with price holding above the 0.3177 support and MACD confirming upward momentum. RSI at 60 signals healthy strength without overextension, while price action remains in the upper half of the Bollinger Bands. Bulls target a break above 0.3354 resistance to extend gains toward 0.3410. Bear case triggers if price loses 0.3177 support, risking a deeper pullback to 0.3051. Watch 0.3177 as the key level to keep this bullish setup intact.
$LDO
{spot}(LDOUSDT)
#LDO Market Analysis
LDO/USDT is in a bullish structure with price holding above the 0.3177 support and MACD confirming upward momentum. RSI at 60 signals healthy strength without overextension, while price action remains in the upper half of the Bollinger Bands. Bulls target a break above 0.3354 resistance to extend gains toward 0.3410. Bear case triggers if price loses 0.3177 support, risking a deeper pullback to 0.3051. Watch 0.3177 as the key level to keep this bullish setup intact.
$LDO
LDO/USDT is in a bullish structure with price holding above the 0.3177 support and MACD confirming upward momentum. RSI at 60 signals healthy strength without overextension, while price action remains in the upper half of the Bollinger Bands. Bulls target a break above 0.3354 resistance to extend gains toward 0.3410. Bear case triggers if price loses 0.3177 support, risking a deeper pullback to 0.3051. Watch 0.3177 as the key level to keep this bullish setup intact.
$LDO
5
·
--
#WIF Market Analysis
WIF/USDT trades in a weak bearish structure but shows early bullish MACD divergence. RSI near 52 and price sitting in the upper half of Bollinger Bands suggest potential upside momentum. Bulls need to hold above 0.1909 to challenge resistance at 0.1988 and target a break above 0.2010. On the downside, losing 0.1867 risks a deeper pullback toward 0.1781 support. Watch 0.1909 as the pivot for direction. $WIF
{spot}(WIFUSDT)
#WIF Market Analysis
WIF/USDT trades in a weak bearish structure but shows early bullish MACD divergence. RSI near 52 and price sitting in the upper half of Bollinger Bands suggest potential upside momentum. Bulls need to hold above 0.1909 to challenge resistance at 0.1988 and target a break above 0.2010. On the downside, losing 0.1867 risks a deeper pullback toward 0.1781 support. Watch 0.1909 as the pivot for direction. $WIF
WIF/USDT trades in a weak bearish structure but shows early bullish MACD divergence. RSI near 52 and price sitting in the upper half of Bollinger Bands suggest potential upside momentum. Bulls need to hold above 0.1909 to challenge resistance at 0.1988 and target a break above 0.2010. On the downside, losing 0.1867 risks a deeper pullback toward 0.1781 support. Watch 0.1909 as the pivot for direction. $WIF
6
·
--
#DASH Market Analysis
DASH/USDT shows a weak bullish structure with price hovering near the lower Bollinger Band and RSI below 50, signaling limited momentum. MACD is bearish, indicating sellers still have control despite the slight uptrend. Bull case: hold above 31.9 to target the resistance at 41.4. Bear case: lose 31.7 and risk a deeper pullback towards 30.9 support. Key level to watch is 31.9
$DASH
{spot}(DASHUSDT)
#DASH Market Analysis
DASH/USDT shows a weak bullish structure with price hovering near the lower Bollinger Band and RSI below 50, signaling limited momentum. MACD is bearish, indicating sellers still have control despite the slight uptrend. Bull case: hold above 31.9 to target the resistance at 41.4. Bear case: lose 31.7 and risk a deeper pullback towards 30.9 support. Key level to watch is 31.9
$DASH
DASH/USDT shows a weak bullish structure with price hovering near the lower Bollinger Band and RSI below 50, signaling limited momentum. MACD is bearish, indicating sellers still have control despite the slight uptrend. Bull case: hold above 31.9 to target the resistance at 41.4. Bear case: lose 31.7 and risk a deeper pullback towards 30.9 support. Key level to watch is 31.9
$DASH
5
·
--
#SOL Market Analysis
SOL/USDT shows a weak bullish structure with price hovering near key supports but MACD signals bearish momentum. RSI near 48 and position in the lower half of Bollinger Bands indicate limited upside strength. Bull case holds above 82.9 for a run at 84.56 resistance. Bear case breaks below 81.6, risking a deeper pullback to 78.67 support. Watch 82.9 closely for directional clues. $SOL
{spot}(SOLUSDT)
#SOL Market Analysis
SOL/USDT shows a weak bullish structure with price hovering near key supports but MACD signals bearish momentum. RSI near 48 and position in the lower half of Bollinger Bands indicate limited upside strength. Bull case holds above 82.9 for a run at 84.56 resistance. Bear case breaks below 81.6, risking a deeper pullback to 78.67 support. Watch 82.9 closely for directional clues. $SOL
SOL/USDT shows a weak bullish structure with price hovering near key supports but MACD signals bearish momentum. RSI near 48 and position in the lower half of Bollinger Bands indicate limited upside strength. Bull case holds above 82.9 for a run at 84.56 resistance. Bear case breaks below 81.6, risking a deeper pullback to 78.67 support. Watch 82.9 closely for directional clues. $SOL
69
·
--
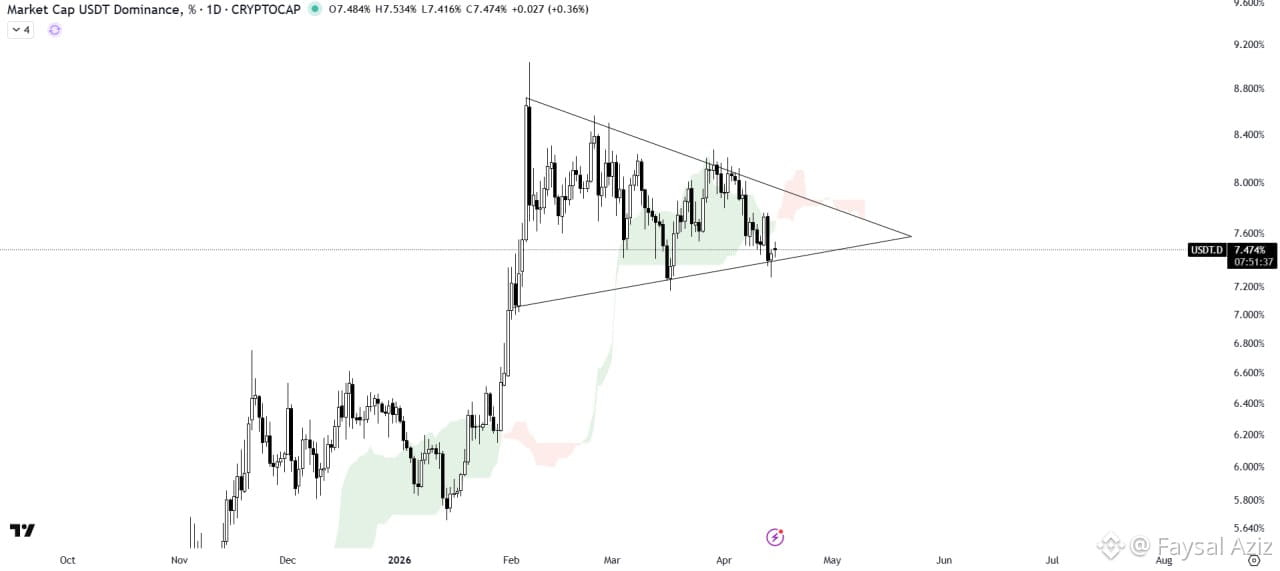
#USDT DOMINANCE ANALYSIS
USDT Dominance is forming a pennant pattern and is currently holding above the support trendline.
The Ichimoku Cloud is acting as a resistance barrier, keeping upward momentum in check. A strong breakout from the pattern would confirm a bullish move.
However, a breakdown below the support trendline would invalidate the setup and could lead to further downside.
It’s important to note that USDT Dominance often exhibits an inverse correlation with the broader cryptocurrency market.$USDT $XRP
{spot}(XRPUSDT)
#USDT DOMINANCE ANALYSIS
USDT Dominance is forming a pennant pattern and is currently holding above the support trendline.
The Ichimoku Cloud is acting as a resistance barrier, keeping upward momentum in check. A strong breakout from the pattern would confirm a bullish move.
However, a breakdown below the support trendline would invalidate the setup and could lead to further downside.
It’s important to note that USDT Dominance often exhibits an inverse correlation with the broader cryptocurrency market.$USDT $XRP
USDT Dominance is forming a pennant pattern and is currently holding above the support trendline.
The Ichimoku Cloud is acting as a resistance barrier, keeping upward momentum in check. A strong breakout from the pattern would confirm a bullish move.
However, a breakdown below the support trendline would invalidate the setup and could lead to further downside.
It’s important to note that USDT Dominance often exhibits an inverse correlation with the broader cryptocurrency market.$USDT $XRP
1
Log in to explore more content
Join global crypto users on Binance Square
⚡️ Get latest and useful information about crypto.
💬 Trusted by the world’s largest crypto exchange.
👍 Discover real insights from verified creators.
Email / Phone number
Trending Topics
BinanceIncidentReport
36,266 views
559 Discussing
29 October 2026 Binance Security Incident: Initial Findings and Response Update
Binance Blog
·276 Likes
·820.5k views
BinanceReopensWithdrawalsForMoreAssets
149,162 views
1,760 Discussing
BinanceHourlyDepositsExceedWithdrawals
69,293 views
810 Discussing