
CRIPTO SIN HUMOS
572 Posts

CRIPTO SIN HUMOS
Report
Block User
Noticias y análisis cripto para Chile y LATAM Datos verificados, cero humo
🇨🇱 BTC · ETH · DeFi · Regulación CMF/SII
Nada de esto es consejo financiero
139 Following
39 Followers
59 Liked
Posts
All
Quotes
Videos
Next week: three dates and one level that will decide
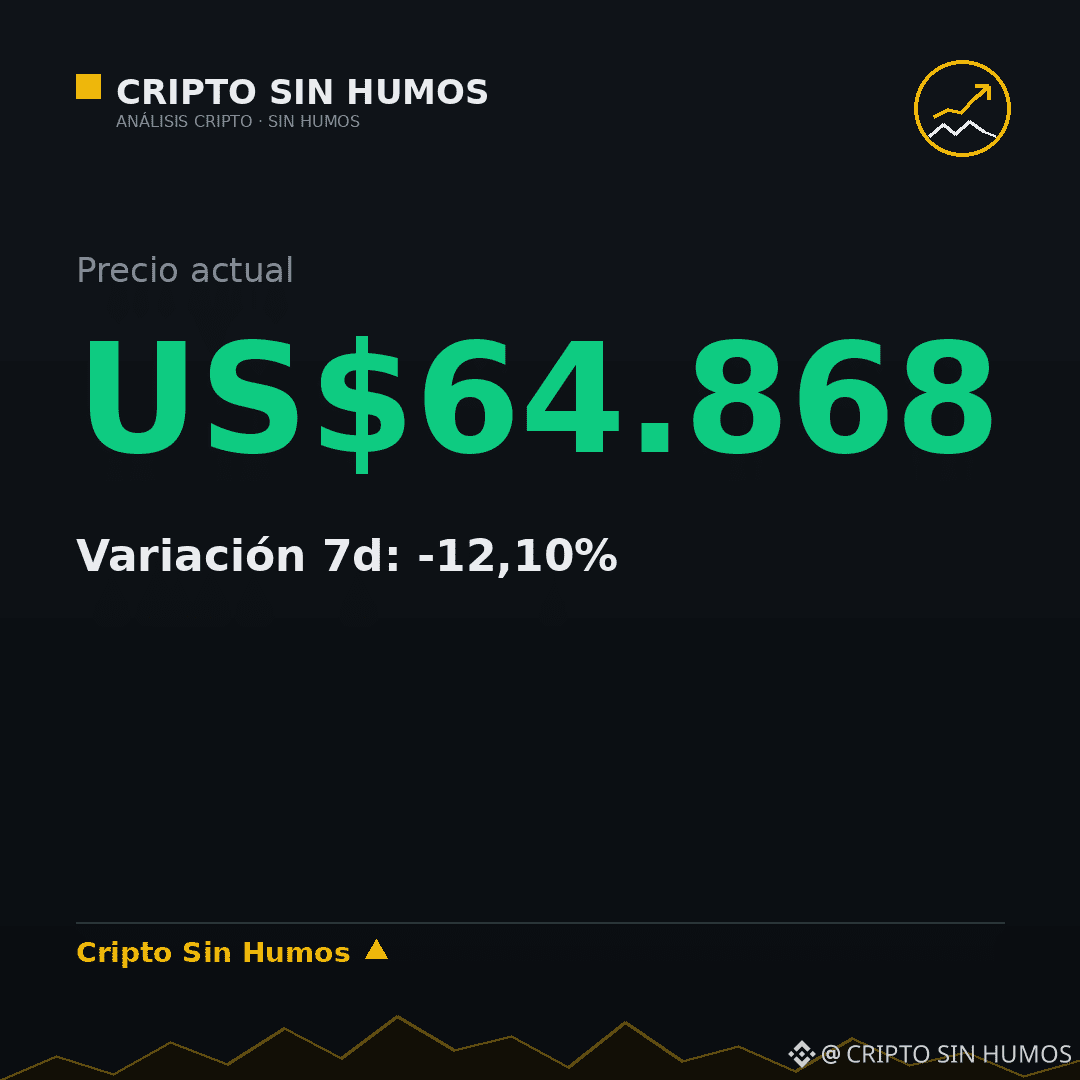
The current price of $BTC stands at US$64,868, a figure far below the 12-month high of US$87,396. This week’s thesis does not depend on the narrative, but on two specific variables: the publication of the MSCI list on November 11 and the daily direction of ETF flows. These data will determine whether the market seeks liquidity or consolidates in extreme fear, with the index at 12/100. My base case is that the 73,200 level acts as a technical barrier as long as flows do not show a clear trend reversal. This view is immediately invalidated if the week closes above 77,700, which would break the current downward structure. Which event weighs more in your analysis: the MSCI list or the flows?
This is not financial advice. Do your own research before investing.
Next week: three dates and one level that will decide
The current price of $BTC stands at US$64,868, a figure far below the 12-month high of US$87,396. This week’s thesis does not depend on the narrative, but on two specific variables: the publication of the MSCI list on November 11 and the daily direction of ETF flows. These data will determine whether the market seeks liquidity or consolidates in extreme fear, with the index at 12/100. My base case is that the 73,200 level acts as a technical barrier as long as flows do not show a clear trend reversal. This view is immediately invalidated if the week closes above 77,700, which would break the current downward structure. Which event weighs more in your analysis: the MSCI list or the flows?
This is not financial advice. Do your own research before investing.
The current price of $BTC stands at US$64,868, a figure far below the 12-month high of US$87,396. This week’s thesis does not depend on the narrative, but on two specific variables: the publication of the MSCI list on November 11 and the daily direction of ETF flows. These data will determine whether the market seeks liquidity or consolidates in extreme fear, with the index at 12/100. My base case is that the 73,200 level acts as a technical barrier as long as flows do not show a clear trend reversal. This view is immediately invalidated if the week closes above 77,700, which would break the current downward structure. Which event weighs more in your analysis: the MSCI list or the flows?
This is not financial advice. Do your own research before investing.
90
Five metrics to check on Monday without drowning in candlesticks
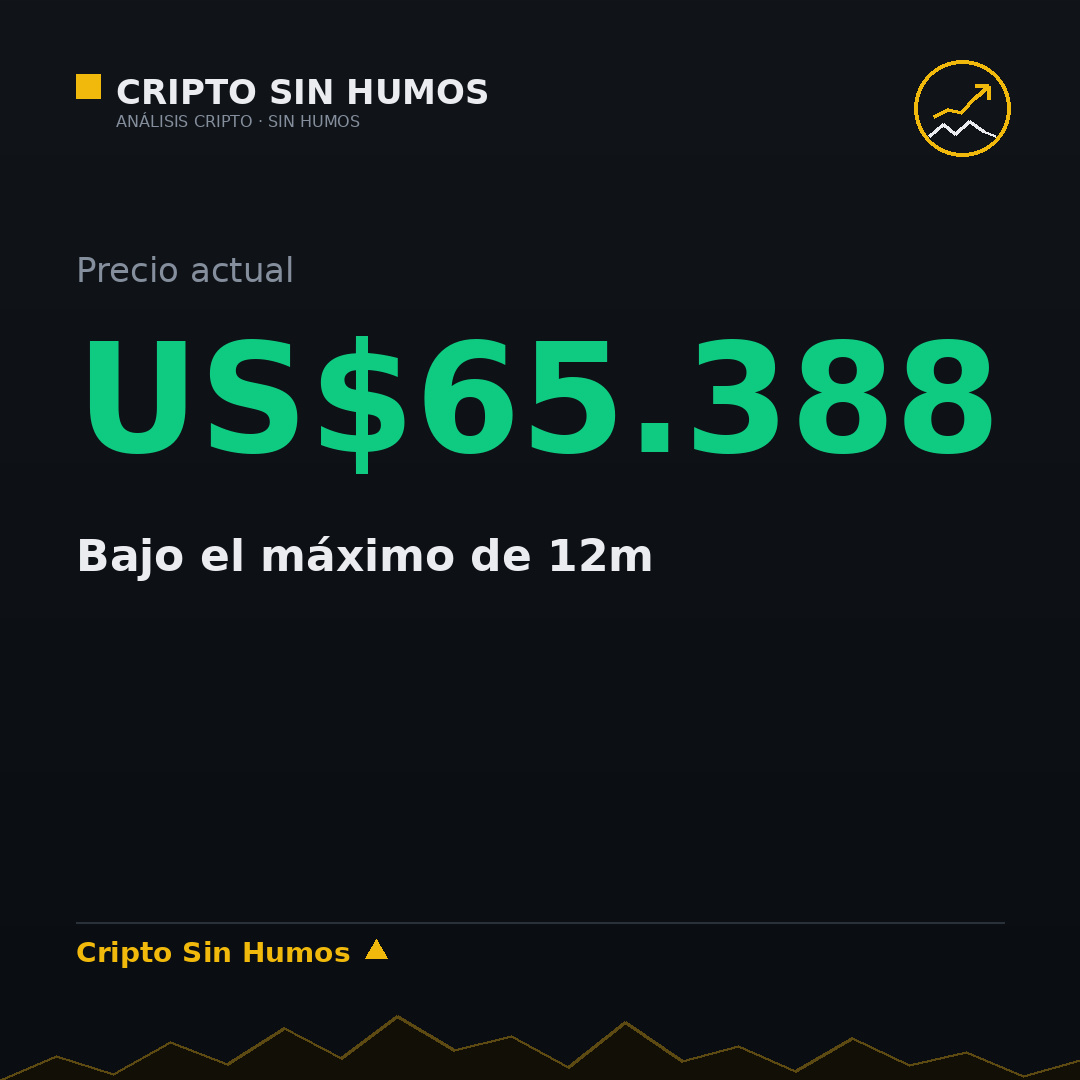
The price of $BTC is US$65,388, well below the 12-month high of US$87,396. This gap defines the current context. The thesis is clear: three metrics are enough to tell whether you're in a panic, range-bound, or euphoric. You don't need to analyze every candlestick. Extreme fear persists, suggesting the market is in a stress phase, not a euphoric one. My base case is that the price will remain range-bound until volatility metrics normalize. This is invalidated if two of the three key metrics move into extreme territory at the same time, which would indicate a regime shift. Which of the five do you watch?
This is not financial advice. Do your own research before investing.
Five metrics to check on Monday without drowning in candlesticks
The price of $BTC is US$65,388, well below the 12-month high of US$87,396. This gap defines the current context. The thesis is clear: three metrics are enough to tell whether you're in a panic, range-bound, or euphoric. You don't need to analyze every candlestick. Extreme fear persists, suggesting the market is in a stress phase, not a euphoric one. My base case is that the price will remain range-bound until volatility metrics normalize. This is invalidated if two of the three key metrics move into extreme territory at the same time, which would indicate a regime shift. Which of the five do you watch?
This is not financial advice. Do your own research before investing.
The price of $BTC is US$65,388, well below the 12-month high of US$87,396. This gap defines the current context. The thesis is clear: three metrics are enough to tell whether you're in a panic, range-bound, or euphoric. You don't need to analyze every candlestick. Extreme fear persists, suggesting the market is in a stress phase, not a euphoric one. My base case is that the price will remain range-bound until volatility metrics normalize. This is invalidated if two of the three key metrics move into extreme territory at the same time, which would indicate a regime shift. Which of the five do you watch?
This is not financial advice. Do your own research before investing.
154
Five lessons from the US$6.3 billion theft (and none is about Bitcoin)
US$6.3 billion was stolen, 98% has been recovered, and US$2.85 billion remains frozen.
This event does not affect the architecture of the Bitcoin network, whose price is trading at US$64,485, far below its 12-month high of US$87,396. The situation shows that users’ exposure depends on the quality of external custody, not on the underlying blockchain.
My base-case scenario is that the vulnerability lay in the company’s custody practices; this would be invalidated if a protocol failure were to emerge, which has not happened. In any case, the responsibility for protecting the funds lies with whoever controls the keys, and $BTC continues operating under its own rules.
What custody measures do you consider essential to prevent incidents of this magnitude?
This is not financial advice. Do your own research before investing.
Five lessons from the US$6.3 billion theft (and none is about Bitcoin)
US$6.3 billion was stolen, 98% has been recovered, and US$2.85 billion remains frozen.
This event does not affect the architecture of the Bitcoin network, whose price is trading at US$64,485, far below its 12-month high of US$87,396. The situation shows that users’ exposure depends on the quality of external custody, not on the underlying blockchain.
My base-case scenario is that the vulnerability lay in the company’s custody practices; this would be invalidated if a protocol failure were to emerge, which has not happened. In any case, the responsibility for protecting the funds lies with whoever controls the keys, and $BTC continues operating under its own rules.
What custody measures do you consider essential to prevent incidents of this magnitude?
This is not financial advice. Do your own research before investing.
US$6.3 billion was stolen, 98% has been recovered, and US$2.85 billion remains frozen.
This event does not affect the architecture of the Bitcoin network, whose price is trading at US$64,485, far below its 12-month high of US$87,396. The situation shows that users’ exposure depends on the quality of external custody, not on the underlying blockchain.
My base-case scenario is that the vulnerability lay in the company’s custody practices; this would be invalidated if a protocol failure were to emerge, which has not happened. In any case, the responsibility for protecting the funds lies with whoever controls the keys, and $BTC continues operating under its own rules.
What custody measures do you consider essential to prevent incidents of this magnitude?
This is not financial advice. Do your own research before investing.

108
Those who are in vs. those who aren’t (part two): the one waiting for the exact bottom
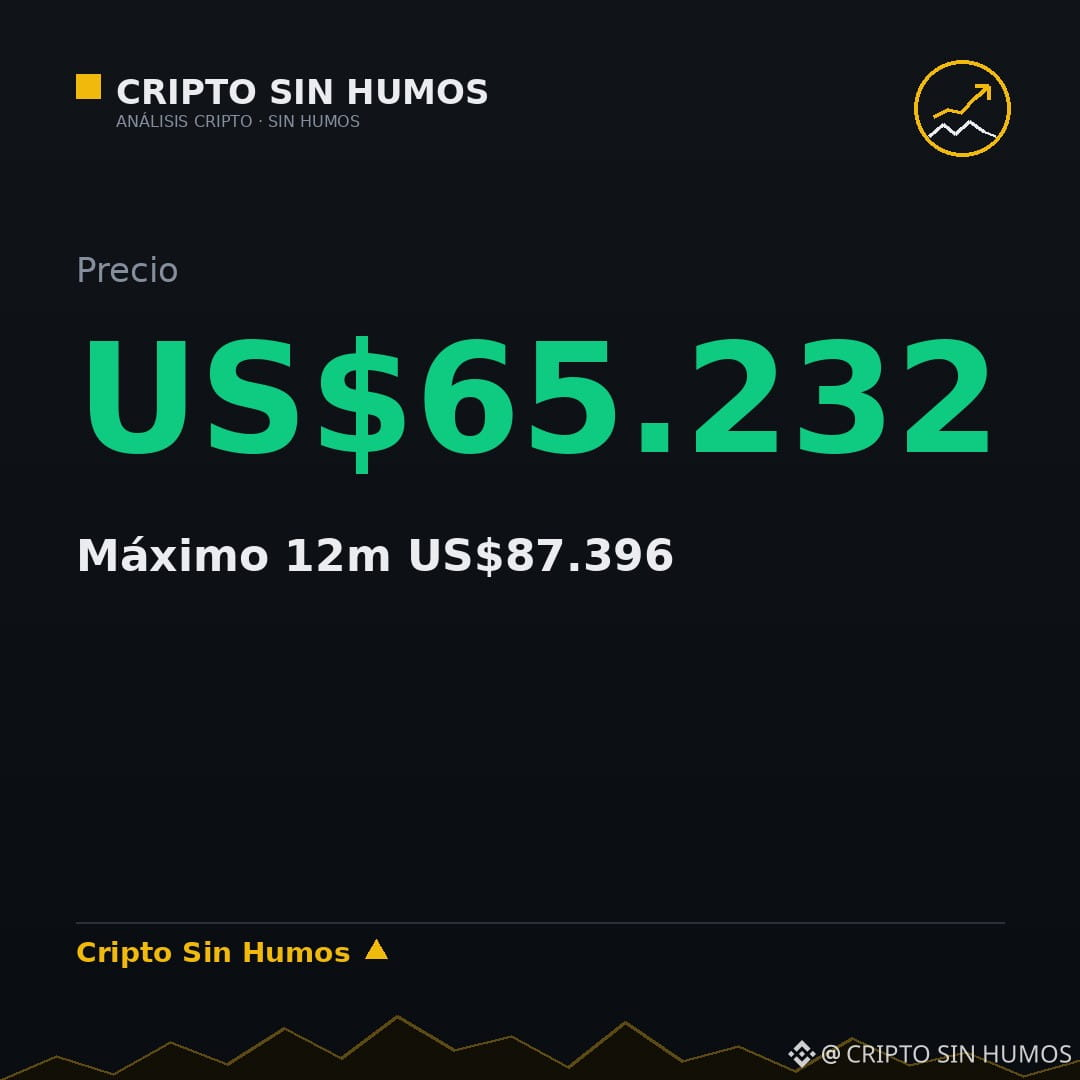
Five consecutive weeks of closing in the red mark the longest losing streak for $BTC. The current price is US$65,232, down 12.85% over the past seven days, with a high of US$87,396 reached in the past twelve months. This sustained decline suggests that the market remains under pressure and that buyers waiting for the “exact bottom” may be chasing a rebound that is no longer justified by recent fundamentals.
In this context, the expectation of a precise support level leads traders to enter buy positions during brief recoveries, often resulting in further losses when the price falls again. The lack of a clear bottom turns the strategy into a bet based more on hope than on objective data.
My base case is that someone waiting for the exact bottom usually buys a rebound they can no longer justify; this is invalidated if the piece is humorous. Do you think continuing to wait for a specific support level is still viable in a market with prolonged downward trends?
This is not financial advice. Do your own research before investing.
Those who are in vs. those who aren’t (part two): the one waiting for the exact bottom
Five consecutive weeks of closing in the red mark the longest losing streak for $BTC . The current price is US$65,232, down 12.85% over the past seven days, with a high of US$87,396 reached in the past twelve months. This sustained decline suggests that the market remains under pressure and that buyers waiting for the “exact bottom” may be chasing a rebound that is no longer justified by recent fundamentals.
In this context, the expectation of a precise support level leads traders to enter buy positions during brief recoveries, often resulting in further losses when the price falls again. The lack of a clear bottom turns the strategy into a bet based more on hope than on objective data.
My base case is that someone waiting for the exact bottom usually buys a rebound they can no longer justify; this is invalidated if the piece is humorous. Do you think continuing to wait for a specific support level is still viable in a market with prolonged downward trends?
This is not financial advice. Do your own research before investing.
Five consecutive weeks of closing in the red mark the longest losing streak for $BTC . The current price is US$65,232, down 12.85% over the past seven days, with a high of US$87,396 reached in the past twelve months. This sustained decline suggests that the market remains under pressure and that buyers waiting for the “exact bottom” may be chasing a rebound that is no longer justified by recent fundamentals.
In this context, the expectation of a precise support level leads traders to enter buy positions during brief recoveries, often resulting in further losses when the price falls again. The lack of a clear bottom turns the strategy into a bet based more on hope than on objective data.
My base case is that someone waiting for the exact bottom usually buys a rebound they can no longer justify; this is invalidated if the piece is humorous. Do you think continuing to wait for a specific support level is still viable in a market with prolonged downward trends?
This is not financial advice. Do your own research before investing.
250
If your bank shuts down its app on a Monday, how much of your money do you have outside it?
Ueno Bank has 3 million customers, and 97% of its balances are covered by insurance, but there is no set payment date. This means the protection exists on paper, but actual liquidity may take weeks or months. Meanwhile, the crypto market reflects the tension: the fear and greed index is at 10/100, an extreme fear level, and the price of $BTC stands at US$65,482, far below its 12-month high. My base case is that relying exclusively on traditional banking leaves an operational gap during a liquidity crisis; this scenario would be invalidated if the insurance pays the full amount in less than 30 days. What percentage of your assets do you currently keep outside the banking system?
This is not financial advice. Verify before investing.
If your bank shuts down its app on a Monday, how much of your money do you have outside it?
Ueno Bank has 3 million customers, and 97% of its balances are covered by insurance, but there is no set payment date. This means the protection exists on paper, but actual liquidity may take weeks or months. Meanwhile, the crypto market reflects the tension: the fear and greed index is at 10/100, an extreme fear level, and the price of $BTC stands at US$65,482, far below its 12-month high. My base case is that relying exclusively on traditional banking leaves an operational gap during a liquidity crisis; this scenario would be invalidated if the insurance pays the full amount in less than 30 days. What percentage of your assets do you currently keep outside the banking system?
This is not financial advice. Verify before investing.
Ueno Bank has 3 million customers, and 97% of its balances are covered by insurance, but there is no set payment date. This means the protection exists on paper, but actual liquidity may take weeks or months. Meanwhile, the crypto market reflects the tension: the fear and greed index is at 10/100, an extreme fear level, and the price of $BTC stands at US$65,482, far below its 12-month high. My base case is that relying exclusively on traditional banking leaves an operational gap during a liquidity crisis; this scenario would be invalidated if the insurance pays the full amount in less than 30 days. What percentage of your assets do you currently keep outside the banking system?
This is not financial advice. Verify before investing.

121
Six red weeks or a rebound: what the 200-day average at 73,240 says
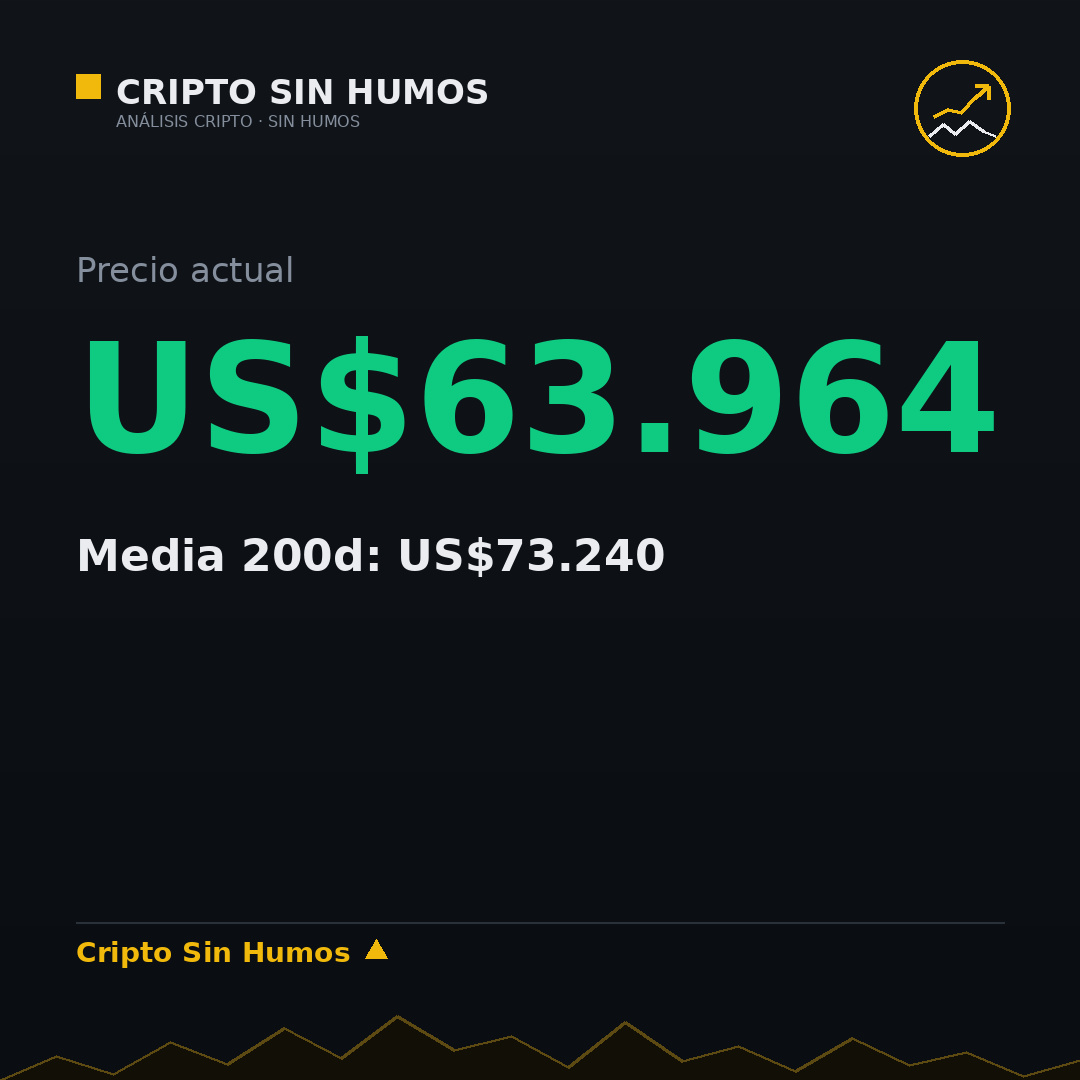
The current price of $BTC is US$63,964, far below the 200-day average of US$73,240. This distance defines the current technical picture. The thesis is clear: the range between 73,200 and 77,700 will determine the medium-term trend; any move outside that band is operational noise. My base case is that the asset will remain under downward pressure unless it recovers that level. This view is invalidated if there is a daily close below US$73,203, which would confirm the structural breakdown. The 15.69% decline over seven days reflects the strength of selling pressure. Do you think the price will manage to rebound toward the average before the end of the week?
This is not financial advice. Verify before investing.
Six red weeks or a rebound: what the 200-day average at 73,240 says
The current price of $BTC is US$63,964, far below the 200-day average of US$73,240. This distance defines the current technical picture. The thesis is clear: the range between 73,200 and 77,700 will determine the medium-term trend; any move outside that band is operational noise. My base case is that the asset will remain under downward pressure unless it recovers that level. This view is invalidated if there is a daily close below US$73,203, which would confirm the structural breakdown. The 15.69% decline over seven days reflects the strength of selling pressure. Do you think the price will manage to rebound toward the average before the end of the week?
This is not financial advice. Verify before investing.
The current price of $BTC is US$63,964, far below the 200-day average of US$73,240. This distance defines the current technical picture. The thesis is clear: the range between 73,200 and 77,700 will determine the medium-term trend; any move outside that band is operational noise. My base case is that the asset will remain under downward pressure unless it recovers that level. This view is invalidated if there is a daily close below US$73,203, which would confirm the structural breakdown. The 15.69% decline over seven days reflects the strength of selling pressure. Do you think the price will manage to rebound toward the average before the end of the week?
This is not financial advice. Verify before investing.
522
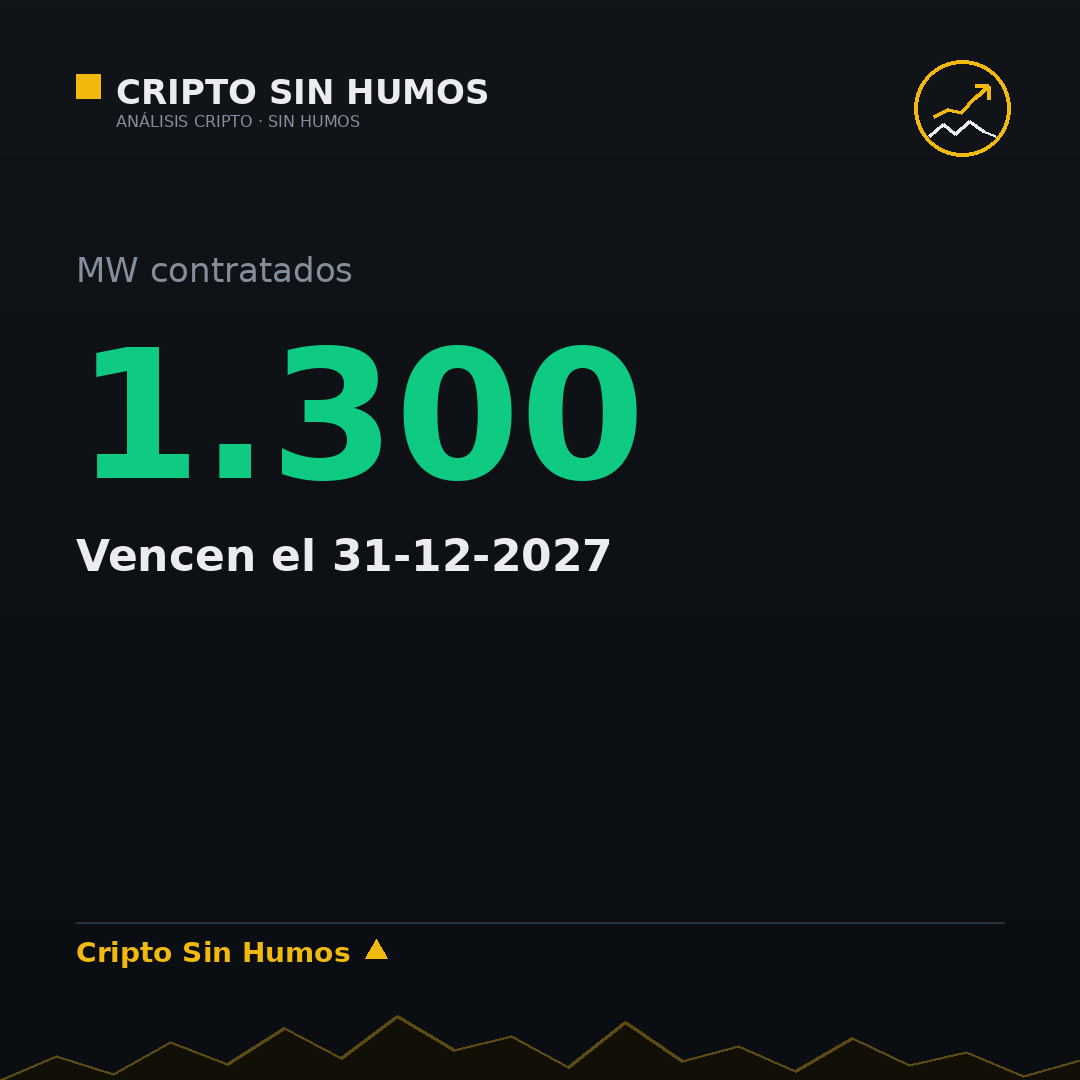
Paraguay and mining: 1,300 MW on the line
Paraguay has 1,300 MW contracted to the mining industry, and those contracts expire on December 31, 2027. The figure is concrete and the deadline is near. The global context isn't helping: $BTC is trading at US$67,271, far below the 12-month high of US$87,396. This price gap directly affects the profitability of mining operations in the region.
The Ueno crisis has increased fiscal pressure on the sector. With the asset's price falling, the margin for error is shrinking. Electricity rates are likely to be reviewed to protect state revenue. The local market is watching closely to see how the renewal of these contracts will be negotiated.
My base-case scenario is that the Paraguayan state will increase the tax burden or adjust rates before 2027. This scenario would be invalidated if ANDE renews the contracts for 10 years, allowing the hashrate to remain stable without structural changes to regulations. Do you think a rate adjustment is inevitable, or is there room to negotiate continued service?
This is not financial advice. Do your own research before investing.
Paraguay and mining: 1,300 MW on the line
Paraguay has 1,300 MW contracted to the mining industry, and those contracts expire on December 31, 2027. The figure is concrete and the deadline is near. The global context isn't helping: $BTC is trading at US$67,271, far below the 12-month high of US$87,396. This price gap directly affects the profitability of mining operations in the region.
The Ueno crisis has increased fiscal pressure on the sector. With the asset's price falling, the margin for error is shrinking. Electricity rates are likely to be reviewed to protect state revenue. The local market is watching closely to see how the renewal of these contracts will be negotiated.
My base-case scenario is that the Paraguayan state will increase the tax burden or adjust rates before 2027. This scenario would be invalidated if ANDE renews the contracts for 10 years, allowing the hashrate to remain stable without structural changes to regulations. Do you think a rate adjustment is inevitable, or is there room to negotiate continued service?
This is not financial advice. Do your own research before investing.
Paraguay has 1,300 MW contracted to the mining industry, and those contracts expire on December 31, 2027. The figure is concrete and the deadline is near. The global context isn't helping: $BTC is trading at US$67,271, far below the 12-month high of US$87,396. This price gap directly affects the profitability of mining operations in the region.
The Ueno crisis has increased fiscal pressure on the sector. With the asset's price falling, the margin for error is shrinking. Electricity rates are likely to be reviewed to protect state revenue. The local market is watching closely to see how the renewal of these contracts will be negotiated.
My base-case scenario is that the Paraguayan state will increase the tax burden or adjust rates before 2027. This scenario would be invalidated if ANDE renews the contracts for 10 years, allowing the hashrate to remain stable without structural changes to regulations. Do you think a rate adjustment is inevitable, or is there room to negotiate continued service?
This is not financial advice. Do your own research before investing.
123
Sixth week of losses: price falls below its 200-day average but remains above market cost
The price of $BTC trades at US$68,848, 9.22% below its level a week ago. This decline puts the asset 5.81% below its 200-day average, which marks the long-term trend at US$73,094. The technical picture is weak, but the fundamental data changes the context: the realized price, which represents the average cost at which each bitcoin moved over the past year, is US$53,905. This means that although the price is below its long-term average, it is still above the market’s average acquisition cost. The difference between the spot price and that level is what separates a technical adjustment from widespread losses. My base case is that the market is not in a structurally loss-making position, since the spot price maintains a safety cushion above realized cost. This view would be invalidated if the price falls below US$53,905, at which point the market average would move into loss. Do you think the current extreme fear is a sign of selling exhaustion, or just a correction within the downtrend?
This is not financial advice. Do your own research before investing.
Sixth week of losses: price falls below its 200-day average but remains above market cost
The price of $BTC trades at US$68,848, 9.22% below its level a week ago. This decline puts the asset 5.81% below its 200-day average, which marks the long-term trend at US$73,094. The technical picture is weak, but the fundamental data changes the context: the realized price, which represents the average cost at which each bitcoin moved over the past year, is US$53,905. This means that although the price is below its long-term average, it is still above the market’s average acquisition cost. The difference between the spot price and that level is what separates a technical adjustment from widespread losses. My base case is that the market is not in a structurally loss-making position, since the spot price maintains a safety cushion above realized cost. This view would be invalidated if the price falls below US$53,905, at which point the market average would move into loss. Do you think the current extreme fear is a sign of selling exhaustion, or just a correction within the downtrend?
This is not financial advice. Do your own research before investing.
The price of $BTC trades at US$68,848, 9.22% below its level a week ago. This decline puts the asset 5.81% below its 200-day average, which marks the long-term trend at US$73,094. The technical picture is weak, but the fundamental data changes the context: the realized price, which represents the average cost at which each bitcoin moved over the past year, is US$53,905. This means that although the price is below its long-term average, it is still above the market’s average acquisition cost. The difference between the spot price and that level is what separates a technical adjustment from widespread losses. My base case is that the market is not in a structurally loss-making position, since the spot price maintains a safety cushion above realized cost. This view would be invalidated if the price falls below US$53,905, at which point the market average would move into loss. Do you think the current extreme fear is a sign of selling exhaustion, or just a correction within the downtrend?
This is not financial advice. Do your own research before investing.

250
The price isn’t waiting for the Fed: it’s waiting for the US$430 million that flowed out of ETFs
On November 5, US$430.2 million in net outflows left spot $BTC ETFs, according to Farside data. This outflow occurred while the asset was trading at US$71,413, down 6.14% over the past seven days. Institutional selling pressure isn’t letting up because of macroeconomic noise or expectations of rate cuts; the market responds to the actual liquidity flowing into or out of investment vehicles. My base case is that without sustained positive flows, any technical rebound will be fragile and vulnerable to reversing at the slightest sign of weakness. This thesis would be invalidated if we saw three consecutive days of positive net inflows into ETFs, which would confirm a structural shift in demand. Do you think the price can hold without the support of institutional flows?
This is not financial advice. Do your own research before investing.
The price isn’t waiting for the Fed: it’s waiting for the US$430 million that flowed out of ETFs
On November 5, US$430.2 million in net outflows left spot $BTC ETFs, according to Farside data. This outflow occurred while the asset was trading at US$71,413, down 6.14% over the past seven days. Institutional selling pressure isn’t letting up because of macroeconomic noise or expectations of rate cuts; the market responds to the actual liquidity flowing into or out of investment vehicles. My base case is that without sustained positive flows, any technical rebound will be fragile and vulnerable to reversing at the slightest sign of weakness. This thesis would be invalidated if we saw three consecutive days of positive net inflows into ETFs, which would confirm a structural shift in demand. Do you think the price can hold without the support of institutional flows?
This is not financial advice. Do your own research before investing.
On November 5, US$430.2 million in net outflows left spot $BTC ETFs, according to Farside data. This outflow occurred while the asset was trading at US$71,413, down 6.14% over the past seven days. Institutional selling pressure isn’t letting up because of macroeconomic noise or expectations of rate cuts; the market responds to the actual liquidity flowing into or out of investment vehicles. My base case is that without sustained positive flows, any technical rebound will be fragile and vulnerable to reversing at the slightest sign of weakness. This thesis would be invalidated if we saw three consecutive days of positive net inflows into ETFs, which would confirm a structural shift in demand. Do you think the price can hold without the support of institutional flows?
This is not financial advice. Do your own research before investing.

92
MSCI decides today: why removing Strategy from the indexes matters more than the price
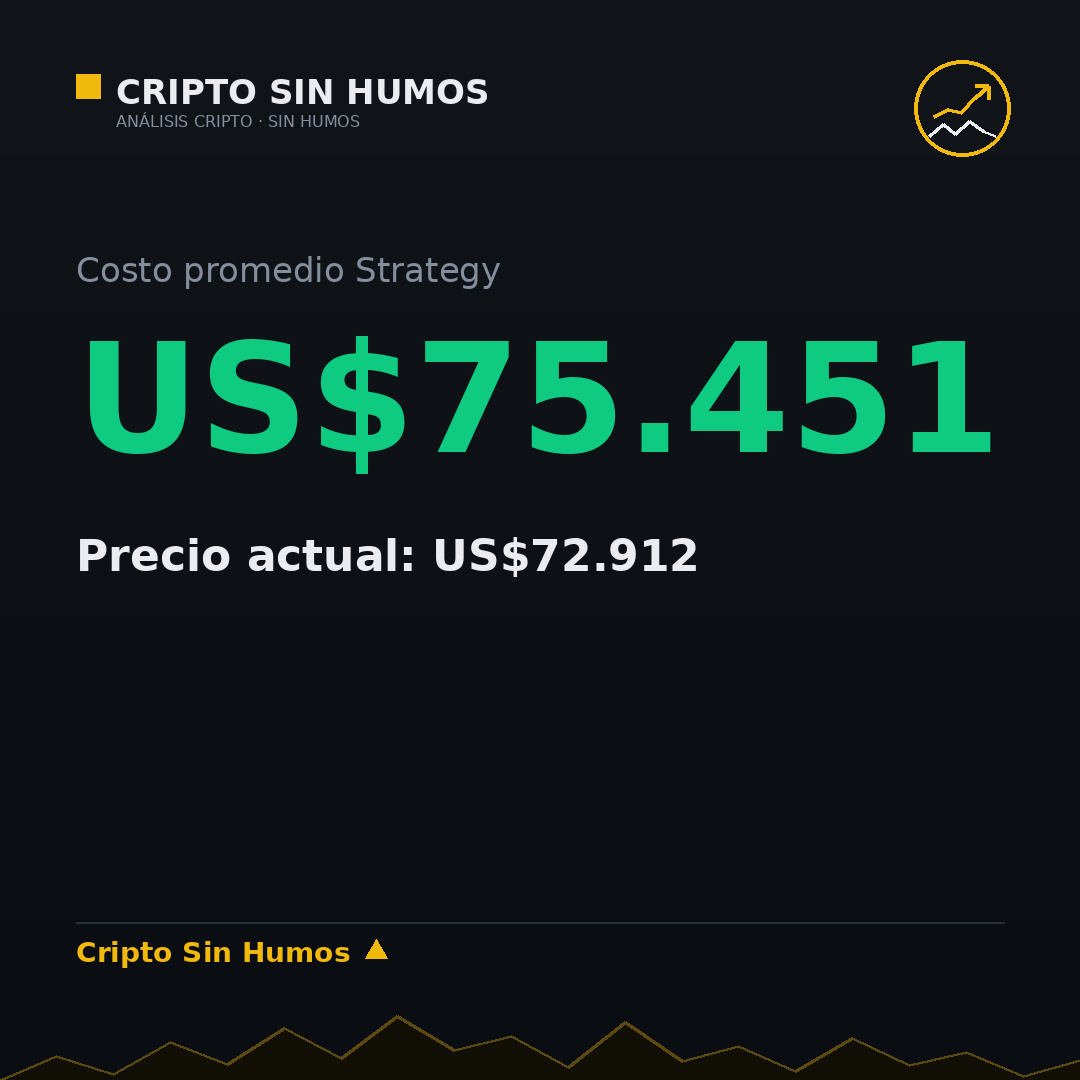
Strategy holds 849,327 BTC at an average cost of US$75,451. With the current price at US$72,912, the position is operating at an accounting loss. This is happening just as MSCI reviews its inclusion in global indexes on November 11. The key factor is not the spot price, but the gap between the acquisition cost and the market value. If passive flows depend on the profitability of the underlying asset, an accounting loss at the largest corporate holder could be seen as a structural risk. My base-case scenario is that MSCI will prioritize liquidity over immediate profitability and maintain the inclusion. This view would be invalidated if the committee decides that exposure to the volatility of $BTC exceeds the risk thresholds for institutional investors. In that case, a forced exit would create selling pressure that the market is not prepared to absorb. Do you consider Strategy's accounting loss a decisive factor in MSCI's decision?
This is not financial advice. Verify before investing.
MSCI decides today: why removing Strategy from the indexes matters more than the price
Strategy holds 849,327 BTC at an average cost of US$75,451. With the current price at US$72,912, the position is operating at an accounting loss. This is happening just as MSCI reviews its inclusion in global indexes on November 11. The key factor is not the spot price, but the gap between the acquisition cost and the market value. If passive flows depend on the profitability of the underlying asset, an accounting loss at the largest corporate holder could be seen as a structural risk. My base-case scenario is that MSCI will prioritize liquidity over immediate profitability and maintain the inclusion. This view would be invalidated if the committee decides that exposure to the volatility of $BTC exceeds the risk thresholds for institutional investors. In that case, a forced exit would create selling pressure that the market is not prepared to absorb. Do you consider Strategy's accounting loss a decisive factor in MSCI's decision?
This is not financial advice. Verify before investing.
Strategy holds 849,327 BTC at an average cost of US$75,451. With the current price at US$72,912, the position is operating at an accounting loss. This is happening just as MSCI reviews its inclusion in global indexes on November 11. The key factor is not the spot price, but the gap between the acquisition cost and the market value. If passive flows depend on the profitability of the underlying asset, an accounting loss at the largest corporate holder could be seen as a structural risk. My base-case scenario is that MSCI will prioritize liquidity over immediate profitability and maintain the inclusion. This view would be invalidated if the committee decides that exposure to the volatility of $BTC exceeds the risk thresholds for institutional investors. In that case, a forced exit would create selling pressure that the market is not prepared to absorb. Do you consider Strategy's accounting loss a decisive factor in MSCI's decision?
This is not financial advice. Verify before investing.
86
At what price would you sell your bitcoin: 85,000, 100,000, or not sell?
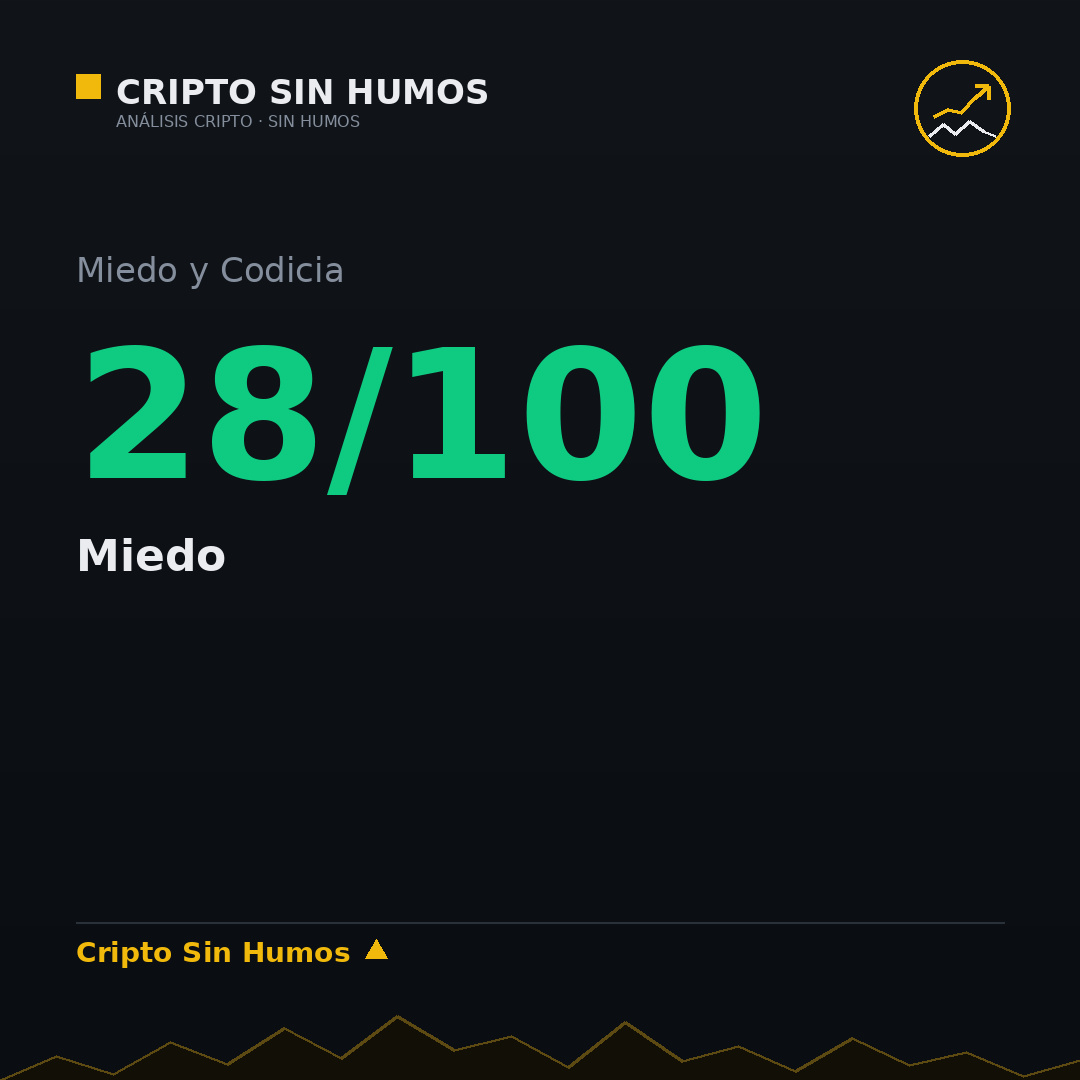
The Fear and Greed Index is at 28/100, compared with 29/100 yesterday. Meanwhile, $BTC is trading at US$73,735, down 3.09% over seven days. This scenario suggests that current fear does not necessarily signal a technical bottom, but rather a pause in market dynamics. My base case is that this fear, without extreme leverage, acts as consolidation rather than a breaking point. This thesis is invalidated if the index rises above 55 without the price recovering US$77,700. Would you sell at 85,000, wait for 100,000, or hold your position?
This is not financial advice. Do your own research before investing.
At what price would you sell your bitcoin: 85,000, 100,000, or not sell?
The Fear and Greed Index is at 28/100, compared with 29/100 yesterday. Meanwhile, $BTC is trading at US$73,735, down 3.09% over seven days. This scenario suggests that current fear does not necessarily signal a technical bottom, but rather a pause in market dynamics. My base case is that this fear, without extreme leverage, acts as consolidation rather than a breaking point. This thesis is invalidated if the index rises above 55 without the price recovering US$77,700. Would you sell at 85,000, wait for 100,000, or hold your position?
This is not financial advice. Do your own research before investing.
The Fear and Greed Index is at 28/100, compared with 29/100 yesterday. Meanwhile, $BTC is trading at US$73,735, down 3.09% over seven days. This scenario suggests that current fear does not necessarily signal a technical bottom, but rather a pause in market dynamics. My base case is that this fear, without extreme leverage, acts as consolidation rather than a breaking point. This thesis is invalidated if the index rises above 55 without the price recovering US$77,700. Would you sell at 85,000, wait for 100,000, or hold your position?
This is not financial advice. Do your own research before investing.
1
422
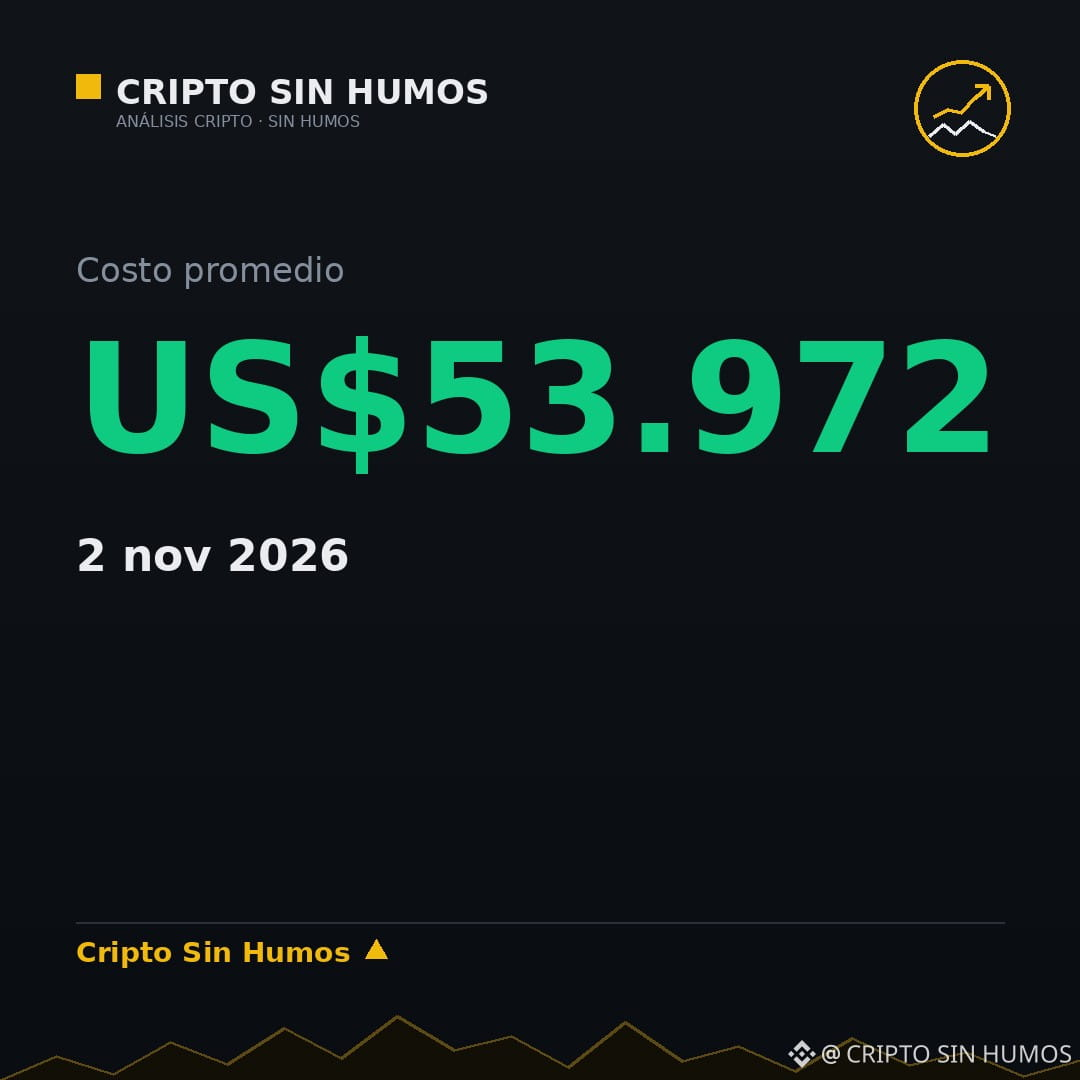
The market average cost is US$53.972: the floor almost no one watches
Realized price (market average cost): US$53.972 as of Nov 2, 2026.
Compared with the current price of US$74.158, the asset is trading around 27% above its average cost. This gap suggests that the recent move is a correction of the previous excess, rather than a signal of market capitulation.
My base case is that the market remains ~27% above its average cost, so this is a correction, not capitulation. This view would be invalidated if there is a daily close below the 200-day moving average (US$73.203).
Would you consider buying at this level, $BTC a, or are you waiting for a deeper drop?
This is not financial advice. Do your own research before investing.
The market average cost is US$53.972: the floor almost no one watches
Realized price (market average cost): US$53.972 as of Nov 2, 2026.
Compared with the current price of US$74.158, the asset is trading around 27% above its average cost. This gap suggests that the recent move is a correction of the previous excess, rather than a signal of market capitulation.
My base case is that the market remains ~27% above its average cost, so this is a correction, not capitulation. This view would be invalidated if there is a daily close below the 200-day moving average (US$73.203).
Would you consider buying at this level, $BTC a, or are you waiting for a deeper drop?
This is not financial advice. Do your own research before investing.
Realized price (market average cost): US$53.972 as of Nov 2, 2026.
Compared with the current price of US$74.158, the asset is trading around 27% above its average cost. This gap suggests that the recent move is a correction of the previous excess, rather than a signal of market capitulation.
My base case is that the market remains ~27% above its average cost, so this is a correction, not capitulation. This view would be invalidated if there is a daily close below the 200-day moving average (US$73.203).
Would you consider buying at this level, $BTC a, or are you waiting for a deeper drop?
This is not financial advice. Do your own research before investing.
87
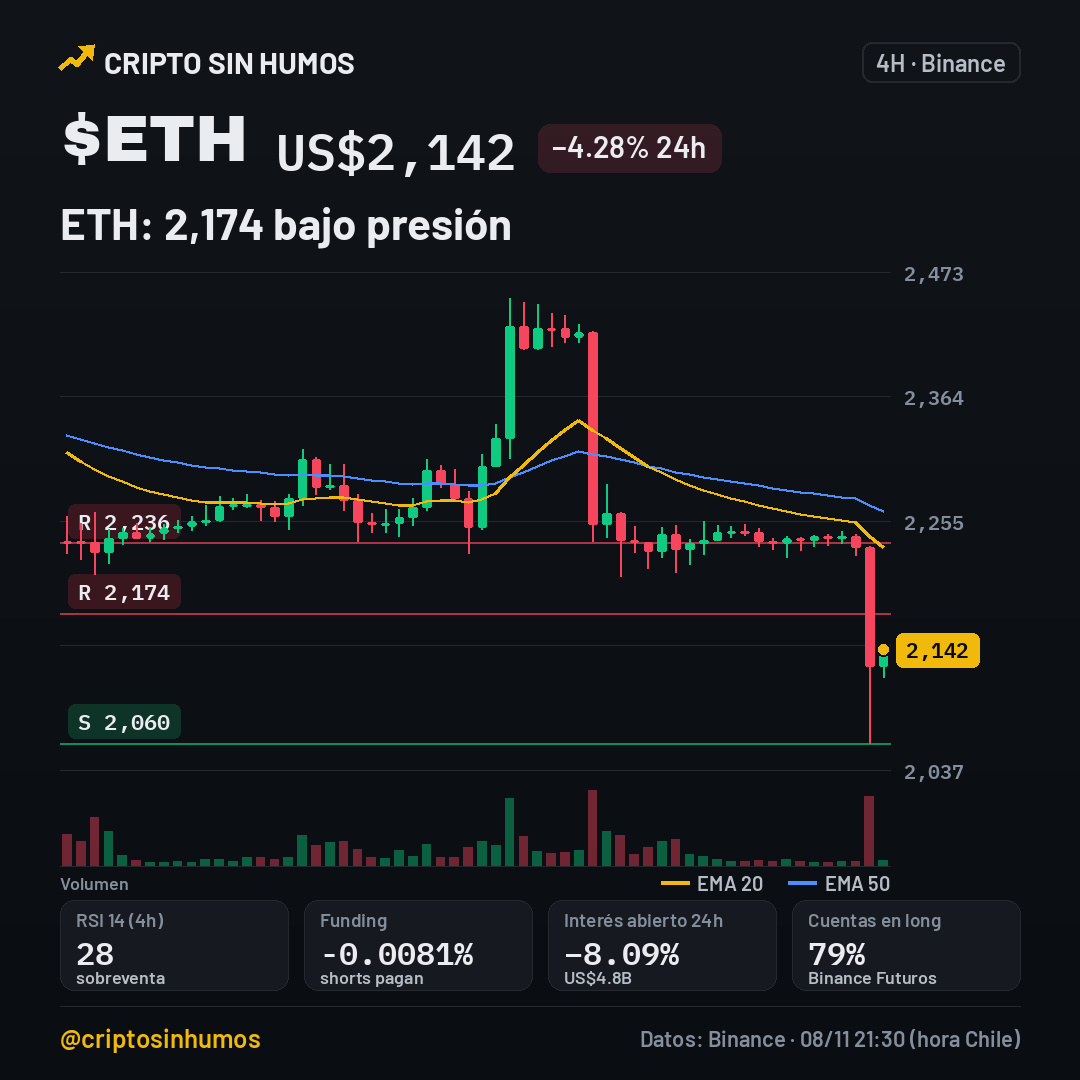
ETH at 2,174: breakout above resistance or back to support?
$ETH is mentioned on Cointelegraph: Vitalik ‘pivots’ ETH toward a store of value after the U.S. midterm results
My take: positioning ETH as a store of value sounds good, but the price is under pressure. The RSI is at 27.8 and the EMA20 (2,232) is below the EMA50 (2,264), confirming the downtrend on the 4h chart. $XRP (-3.6%) and $NEAR (-2.8%) are also moving.
Key levels: support at 2,060 and resistance at 2,174 and 2,236. If it breaks above 2,174, the bullish scenario points to 2,236; the breakout would invalidate the 2,060 support zone. If it falls below 2,060, the bearish scenario looks to test levels around 2,000, invalidating the 2,174 resistance.
Will it break above 2,174 or return to 2,060? 🟢/🔴
#Ethereum #StoreOfValue
This is not financial advice. Do your own research before investing.
ETH at 2,174: breakout above resistance or back to support?
$ETH is mentioned on Cointelegraph: Vitalik ‘pivots’ ETH toward a store of value after the U.S. midterm results
My take: positioning ETH as a store of value sounds good, but the price is under pressure. The RSI is at 27.8 and the EMA20 (2,232) is below the EMA50 (2,264), confirming the downtrend on the 4h chart. $XRP (-3.6%) and $NEAR (-2.8%) are also moving.
Key levels: support at 2,060 and resistance at 2,174 and 2,236. If it breaks above 2,174, the bullish scenario points to 2,236; the breakout would invalidate the 2,060 support zone. If it falls below 2,060, the bearish scenario looks to test levels around 2,000, invalidating the 2,174 resistance.
Will it break above 2,174 or return to 2,060? 🟢/🔴
#Ethereum #StoreOfValue
This is not financial advice. Do your own research before investing.
$ETH is mentioned on Cointelegraph: Vitalik ‘pivots’ ETH toward a store of value after the U.S. midterm results
My take: positioning ETH as a store of value sounds good, but the price is under pressure. The RSI is at 27.8 and the EMA20 (2,232) is below the EMA50 (2,264), confirming the downtrend on the 4h chart. $XRP (-3.6%) and $NEAR (-2.8%) are also moving.
Key levels: support at 2,060 and resistance at 2,174 and 2,236. If it breaks above 2,174, the bullish scenario points to 2,236; the breakout would invalidate the 2,060 support zone. If it falls below 2,060, the bearish scenario looks to test levels around 2,000, invalidating the 2,174 resistance.
Will it break above 2,174 or return to 2,060? 🟢/🔴
#Ethereum #StoreOfValue
This is not financial advice. Do your own research before investing.
104
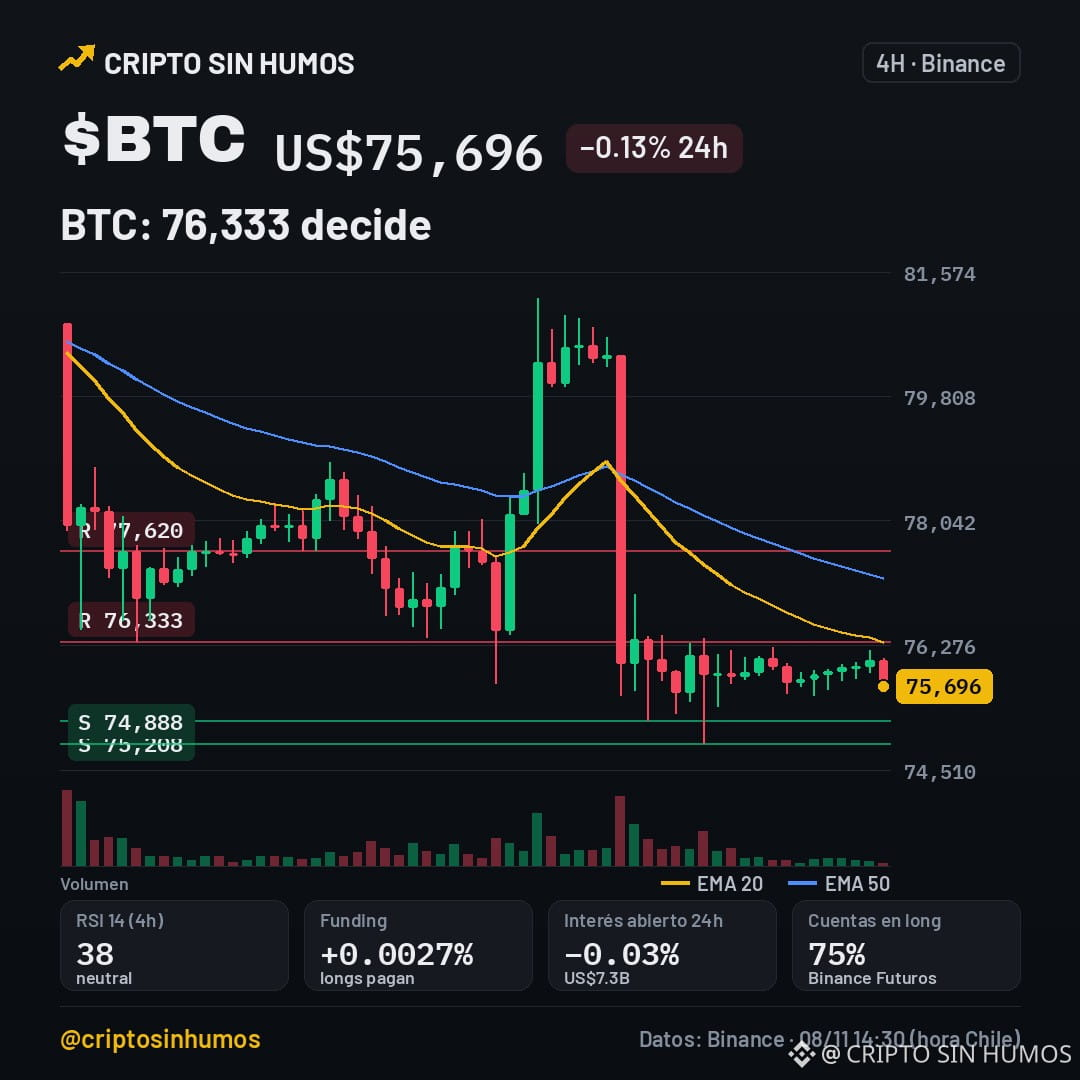
$BTC under pressure: break below 75,208 or rebound to 76,333?
$BTC is under scrutiny after Binance CFO's resignation, reported by The Block. $ZEC (-1.3%) and $ETH (-0.4%) are also moving.
Current price: US$75,696, down 0.13% in 24h and 2.70% in 7 days. The 24h range is between US$75,571 and US$76,200, and 24h volume reaches US$388 million.
My take: the CFO's departure, which comes nine days after the record-breaking hack, could create market uncertainty and put downward pressure on BTC, although there is no confirmation of a structural effect.
On the 4h chart, EMA20 is at 76,320 and EMA50 at 77,225, with a bearish trend and RSI at 38.4. Key support is at 75,208; if it breaks, the next downside level is 74,888. On the upside, resistance is at 76,333; breaking above it would invalidate the bearish scenario and open the way to 77,620.
Will it break 76,333 and target 77,620, or fall below 75,208? 🟢🔴
#BTC #Binance #CFO
This is not financial advice. Verify before investing.
$BTC under pressure: break below 75,208 or rebound to 76,333?
$BTC is under scrutiny after Binance CFO's resignation, reported by The Block. $ZEC (-1.3%) and $ETH (-0.4%) are also moving.
Current price: US$75,696, down 0.13% in 24h and 2.70% in 7 days. The 24h range is between US$75,571 and US$76,200, and 24h volume reaches US$388 million.
My take: the CFO's departure, which comes nine days after the record-breaking hack, could create market uncertainty and put downward pressure on BTC, although there is no confirmation of a structural effect.
On the 4h chart, EMA20 is at 76,320 and EMA50 at 77,225, with a bearish trend and RSI at 38.4. Key support is at 75,208; if it breaks, the next downside level is 74,888. On the upside, resistance is at 76,333; breaking above it would invalidate the bearish scenario and open the way to 77,620.
Will it break 76,333 and target 77,620, or fall below 75,208? 🟢🔴
#BTC #Binance #CFO
This is not financial advice. Verify before investing.
$BTC is under scrutiny after Binance CFO's resignation, reported by The Block. $ZEC (-1.3%) and $ETH (-0.4%) are also moving.
Current price: US$75,696, down 0.13% in 24h and 2.70% in 7 days. The 24h range is between US$75,571 and US$76,200, and 24h volume reaches US$388 million.
My take: the CFO's departure, which comes nine days after the record-breaking hack, could create market uncertainty and put downward pressure on BTC, although there is no confirmation of a structural effect.
On the 4h chart, EMA20 is at 76,320 and EMA50 at 77,225, with a bearish trend and RSI at 38.4. Key support is at 75,208; if it breaks, the next downside level is 74,888. On the upside, resistance is at 76,333; breaking above it would invalidate the bearish scenario and open the way to 77,620.
Will it break 76,333 and target 77,620, or fall below 75,208? 🟢🔴
#BTC #Binance #CFO
This is not financial advice. Verify before investing.
9
How to set an invalidation level (and not fall in love with your thesis)
Most people don’t lose because they get the direction wrong. They lose because they don’t know when they’ve already gotten it wrong.
An invalidation level is the price (or data point) that forces you to change your mind. It’s set BEFORE you enter, not afterward.
How to set one, in three steps:
1. Choose a level the market respects: a moving average, the week’s low, the average on-chain cost. Today for $BTC: 73,240 (200-day moving average).
2. Define what counts as a break: a daily close, not a 10-minute wick.
3. Write down what you’ll do if it happens: reduce, exit, or wait. No improvising.
With that in place, a drop stops being a tragedy and becomes information.
The classic mistake: moving the level when the price gets close. That’s not analysis; it’s stubbornness in disguise.
Do you have your level written down, or is it in your head?
#Bitcoin #Educacion #BinanceSquare
This is not financial advice. Do your own research before investing.
How to set an invalidation level (and not fall in love with your thesis)
Most people don’t lose because they get the direction wrong. They lose because they don’t know when they’ve already gotten it wrong.
An invalidation level is the price (or data point) that forces you to change your mind. It’s set BEFORE you enter, not afterward.
How to set one, in three steps:
1. Choose a level the market respects: a moving average, the week’s low, the average on-chain cost. Today for $BTC : 73,240 (200-day moving average).
2. Define what counts as a break: a daily close, not a 10-minute wick.
3. Write down what you’ll do if it happens: reduce, exit, or wait. No improvising.
With that in place, a drop stops being a tragedy and becomes information.
The classic mistake: moving the level when the price gets close. That’s not analysis; it’s stubbornness in disguise.
Do you have your level written down, or is it in your head?
#Bitcoin #Educacion #BinanceSquare
This is not financial advice. Do your own research before investing.
Most people don’t lose because they get the direction wrong. They lose because they don’t know when they’ve already gotten it wrong.
An invalidation level is the price (or data point) that forces you to change your mind. It’s set BEFORE you enter, not afterward.
How to set one, in three steps:
1. Choose a level the market respects: a moving average, the week’s low, the average on-chain cost. Today for $BTC : 73,240 (200-day moving average).
2. Define what counts as a break: a daily close, not a 10-minute wick.
3. Write down what you’ll do if it happens: reduce, exit, or wait. No improvising.
With that in place, a drop stops being a tragedy and becomes information.
The classic mistake: moving the level when the price gets close. That’s not analysis; it’s stubbornness in disguise.
Do you have your level written down, or is it in your head?
#Bitcoin #Educacion #BinanceSquare
This is not financial advice. Do your own research before investing.

5
Dollar at 102.3 and Bitcoin holding steady: the correlation that really matters
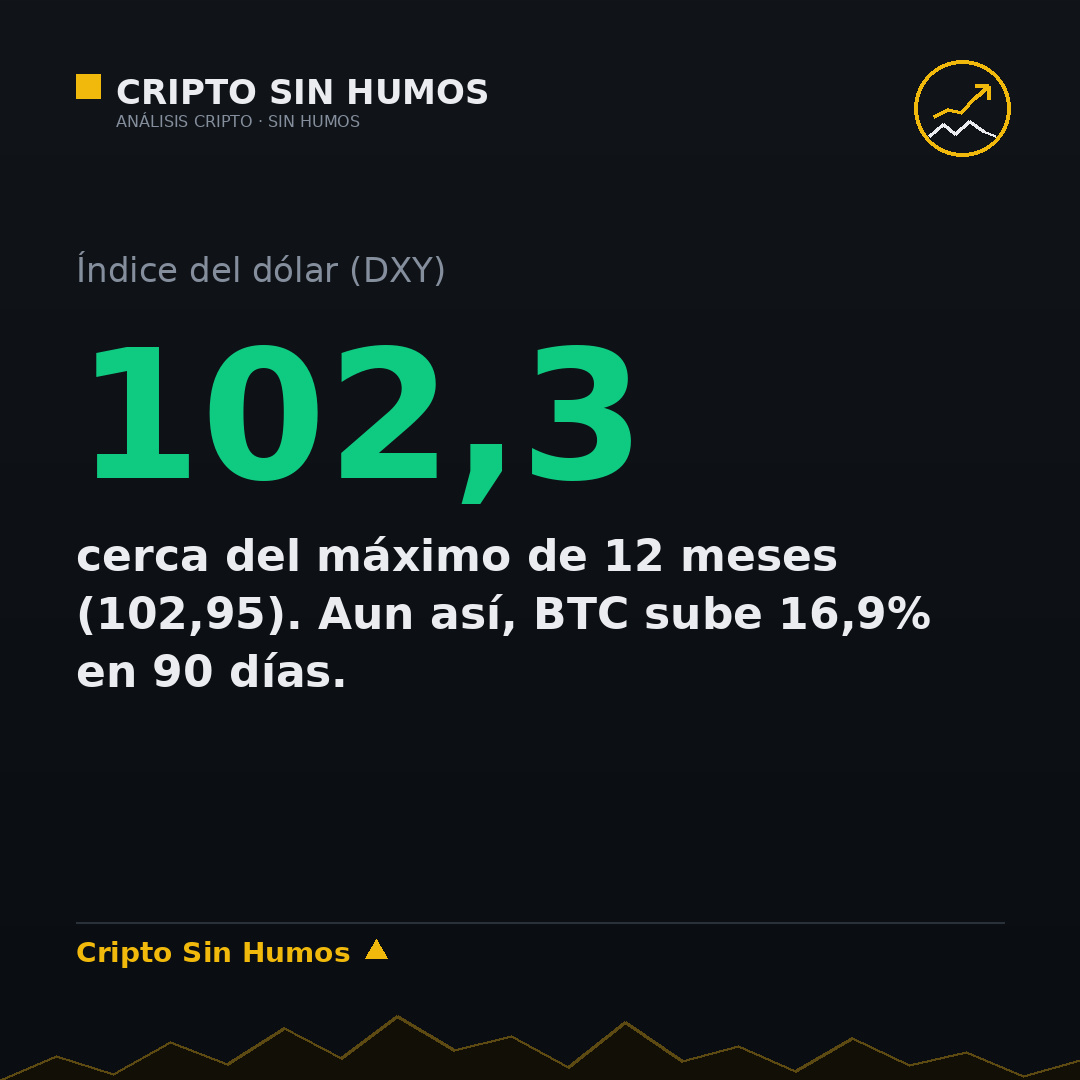
The US Dollar Index (DXY) is at 102.3, near its 12-month high (102.95). A strong dollar tends to weigh on risk assets, and Bitcoin is no exception.
But look at the figure almost no one mentions in the same breath: over the past 90 days, $BTC rose 16.9% with the dollar near its highs. It’s not the perfect inverse relationship many people keep repeating.
The reason: a strong dollar isn’t just “more dollars.” It means high interest rates, tight liquidity, and capital seeking safe havens. Bitcoin competes in that arena, sometimes as a risk asset and sometimes as a store of value.
What to watch: if the DXY breaks above 103, the baseline scenario for Bitcoin is a range-bound market or a correction. If the dollar weakens, the path to recovering 80,000 opens up more easily.
It’s not just crypto: it’s global liquidity by another name.
Do you think a strong dollar is Bitcoin’s ceiling this year?
#Bitcoin #Macro #BinanceSquare
This is not financial advice. Do your own research before investing.
Dollar at 102.3 and Bitcoin holding steady: the correlation that really matters
The US Dollar Index (DXY) is at 102.3, near its 12-month high (102.95). A strong dollar tends to weigh on risk assets, and Bitcoin is no exception.
But look at the figure almost no one mentions in the same breath: over the past 90 days, $BTC rose 16.9% with the dollar near its highs. It’s not the perfect inverse relationship many people keep repeating.
The reason: a strong dollar isn’t just “more dollars.” It means high interest rates, tight liquidity, and capital seeking safe havens. Bitcoin competes in that arena, sometimes as a risk asset and sometimes as a store of value.
What to watch: if the DXY breaks above 103, the baseline scenario for Bitcoin is a range-bound market or a correction. If the dollar weakens, the path to recovering 80,000 opens up more easily.
It’s not just crypto: it’s global liquidity by another name.
Do you think a strong dollar is Bitcoin’s ceiling this year?
#Bitcoin #Macro #BinanceSquare
This is not financial advice. Do your own research before investing.
The US Dollar Index (DXY) is at 102.3, near its 12-month high (102.95). A strong dollar tends to weigh on risk assets, and Bitcoin is no exception.
But look at the figure almost no one mentions in the same breath: over the past 90 days, $BTC rose 16.9% with the dollar near its highs. It’s not the perfect inverse relationship many people keep repeating.
The reason: a strong dollar isn’t just “more dollars.” It means high interest rates, tight liquidity, and capital seeking safe havens. Bitcoin competes in that arena, sometimes as a risk asset and sometimes as a store of value.
What to watch: if the DXY breaks above 103, the baseline scenario for Bitcoin is a range-bound market or a correction. If the dollar weakens, the path to recovering 80,000 opens up more easily.
It’s not just crypto: it’s global liquidity by another name.
Do you think a strong dollar is Bitcoin’s ceiling this year?
#Bitcoin #Macro #BinanceSquare
This is not financial advice. Do your own research before investing.
32
Paraguay Part 2: The 1,000 MW at stake in the future of mining
After the collapse of Ueno Bank, there’s another story in Paraguay that the crypto market should be watching.
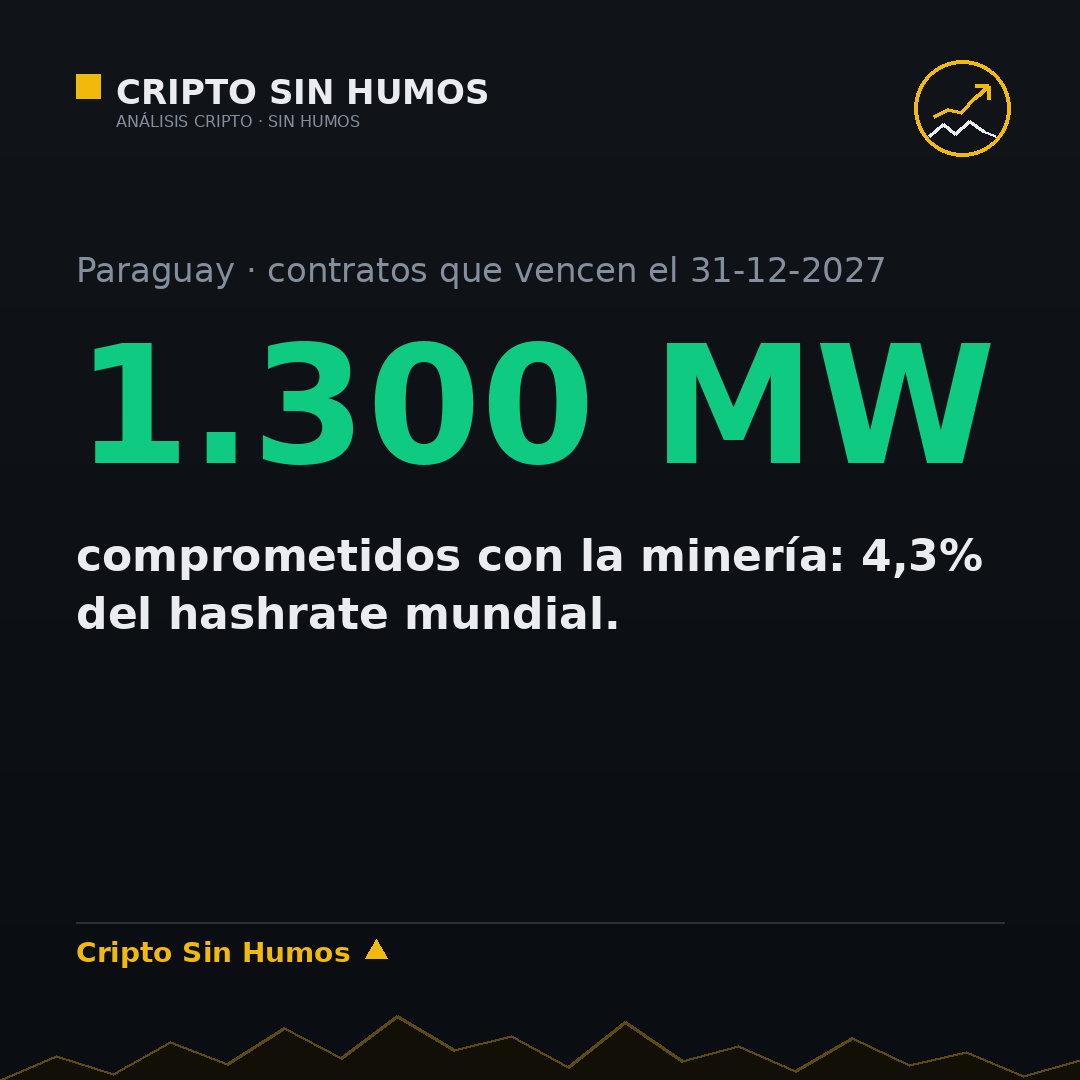
The country accounts for 4.3% of the global hashrate. ANDE, the state-owned power utility, has contracts with dozens of energy-intensive companies totaling 1,000 to 1,300 MW, with rates in US dollars and a non-extendable expiration date: December 31, 2027.
The sector pays around US$350 million a year. But the debate has shifted: there are proposals to cap mining at 700 MW and reserve energy for AI data centers, which pay more per MWh (US$48.91 compared with US$44 for mining), with a minimum rate of US$56 per MWh for the electricity-intensive sector.
For the global market, the question is what happens to 4.3% of the hashrate if those contracts aren’t renewed. For Paraguay, the question is whether it wants to be a mining country or a source of cheap energy for others.
Both answers affect energy prices and, in the long term, the cost of mining bitcoin.
What would you do: renew the contracts or raise the rate?
#Bitcoin #Mineria #BinanceSquare
This is not financial advice. Do your own research before investing.
Paraguay Part 2: The 1,000 MW at stake in the future of mining
After the collapse of Ueno Bank, there’s another story in Paraguay that the crypto market should be watching.
The country accounts for 4.3% of the global hashrate. ANDE, the state-owned power utility, has contracts with dozens of energy-intensive companies totaling 1,000 to 1,300 MW, with rates in US dollars and a non-extendable expiration date: December 31, 2027.
The sector pays around US$350 million a year. But the debate has shifted: there are proposals to cap mining at 700 MW and reserve energy for AI data centers, which pay more per MWh (US$48.91 compared with US$44 for mining), with a minimum rate of US$56 per MWh for the electricity-intensive sector.
For the global market, the question is what happens to 4.3% of the hashrate if those contracts aren’t renewed. For Paraguay, the question is whether it wants to be a mining country or a source of cheap energy for others.
Both answers affect energy prices and, in the long term, the cost of mining bitcoin.
What would you do: renew the contracts or raise the rate?
#Bitcoin #Mineria #BinanceSquare
This is not financial advice. Do your own research before investing.
After the collapse of Ueno Bank, there’s another story in Paraguay that the crypto market should be watching.
The country accounts for 4.3% of the global hashrate. ANDE, the state-owned power utility, has contracts with dozens of energy-intensive companies totaling 1,000 to 1,300 MW, with rates in US dollars and a non-extendable expiration date: December 31, 2027.
The sector pays around US$350 million a year. But the debate has shifted: there are proposals to cap mining at 700 MW and reserve energy for AI data centers, which pay more per MWh (US$48.91 compared with US$44 for mining), with a minimum rate of US$56 per MWh for the electricity-intensive sector.
For the global market, the question is what happens to 4.3% of the hashrate if those contracts aren’t renewed. For Paraguay, the question is whether it wants to be a mining country or a source of cheap energy for others.
Both answers affect energy prices and, in the long term, the cost of mining bitcoin.
What would you do: renew the contracts or raise the rate?
#Bitcoin #Mineria #BinanceSquare
This is not financial advice. Do your own research before investing.
350
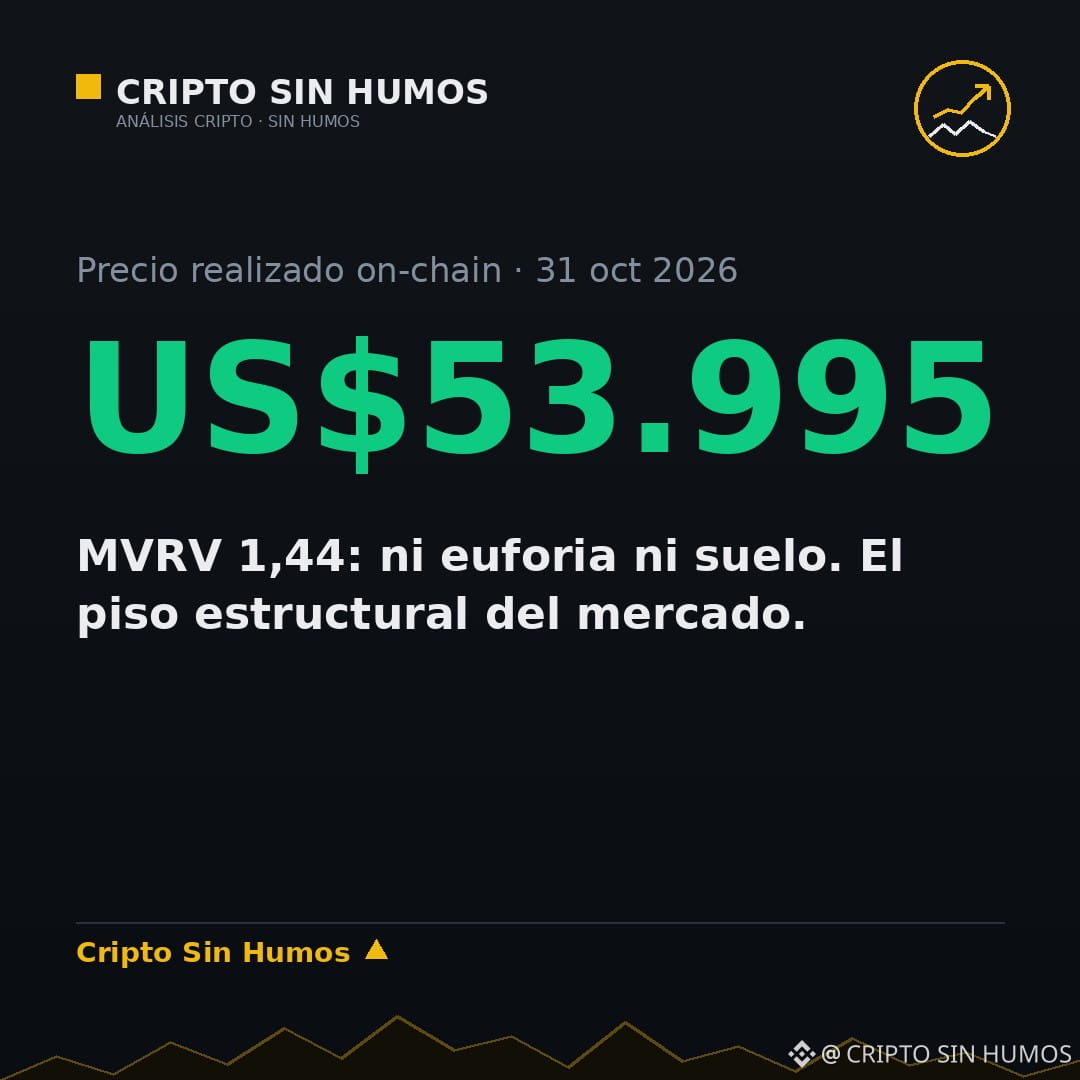
The floor almost nobody watches: realized price is $53,995
Realized price is the average cost at which each bitcoin last changed hands. Today it stands at $53,995, according to on-chain data.
Its use is simple: when the price falls below it, the market is at a loss on average. Historically, this has marked capitulation zones, not the beginning of a bear market.
Today, the price is 40% above that floor. MVRV (market value to realized value) is at 1.44: neither euphoria (above 3) nor a bottom (near 1).
In other words: no one is giving bitcoin away at cost. The market is uncomfortable, not broken.
What could happen: the price could visit the 200-day moving average (73,240) without touching realized price. That wouldn’t be a disaster; it would be a normal correction.
Do you watch realized price, or just the candlestick chart?
#Bitcoin #OnChain #BinanceSquare
This is not financial advice. Do your research before investing.
The floor almost nobody watches: realized price is $53,995
Realized price is the average cost at which each bitcoin last changed hands. Today it stands at $53,995, according to on-chain data.
Its use is simple: when the price falls below it, the market is at a loss on average. Historically, this has marked capitulation zones, not the beginning of a bear market.
Today, the price is 40% above that floor. MVRV (market value to realized value) is at 1.44: neither euphoria (above 3) nor a bottom (near 1).
In other words: no one is giving bitcoin away at cost. The market is uncomfortable, not broken.
What could happen: the price could visit the 200-day moving average (73,240) without touching realized price. That wouldn’t be a disaster; it would be a normal correction.
Do you watch realized price, or just the candlestick chart?
#Bitcoin #OnChain #BinanceSquare
This is not financial advice. Do your research before investing.
Realized price is the average cost at which each bitcoin last changed hands. Today it stands at $53,995, according to on-chain data.
Its use is simple: when the price falls below it, the market is at a loss on average. Historically, this has marked capitulation zones, not the beginning of a bear market.
Today, the price is 40% above that floor. MVRV (market value to realized value) is at 1.44: neither euphoria (above 3) nor a bottom (near 1).
In other words: no one is giving bitcoin away at cost. The market is uncomfortable, not broken.
What could happen: the price could visit the 200-day moving average (73,240) without touching realized price. That wouldn’t be a disaster; it would be a normal correction.
Do you watch realized price, or just the candlestick chart?
#Bitcoin #OnChain #BinanceSquare
This is not financial advice. Do your research before investing.
292
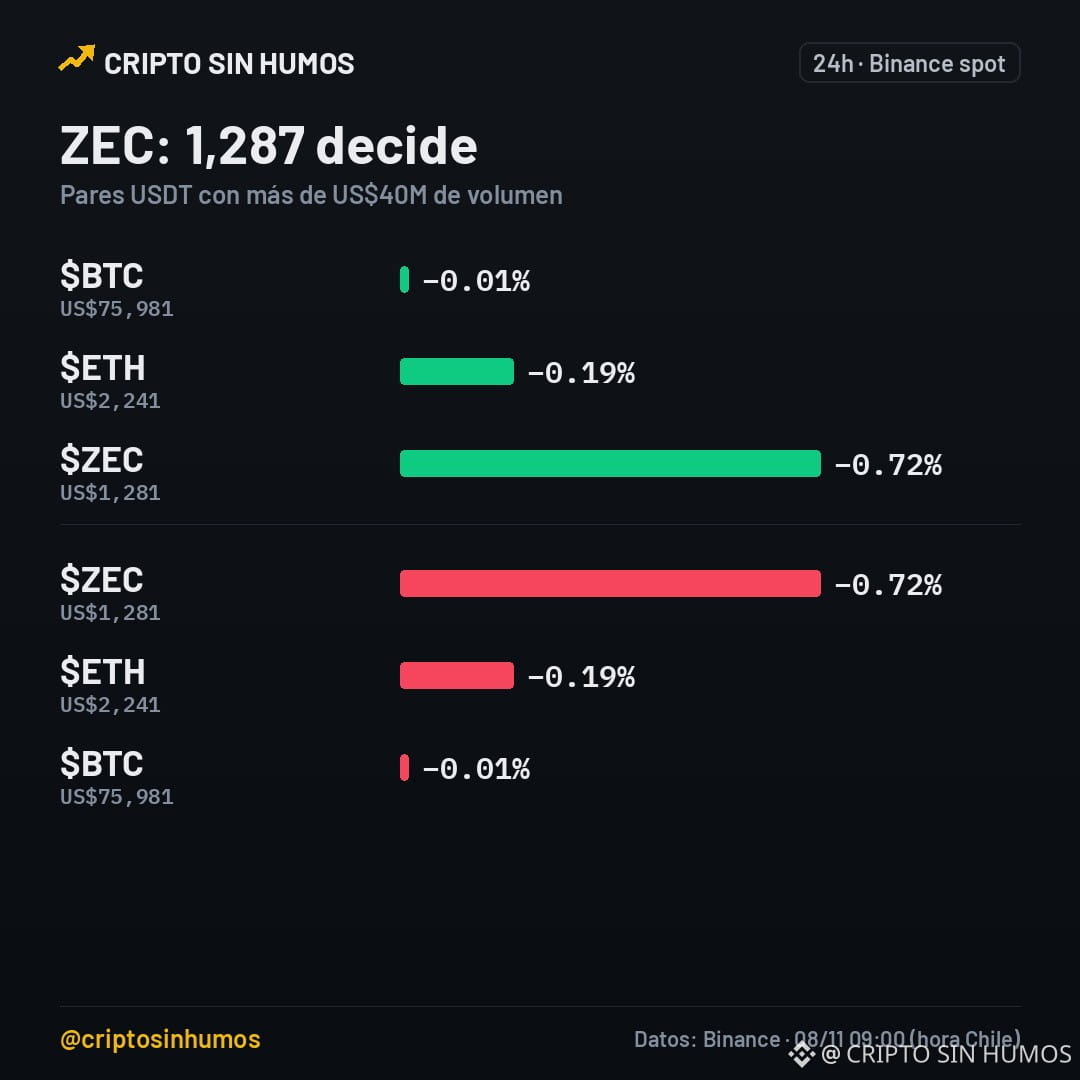
$ZEC 1,281: heading to 1,287 or a drop?
$ZEC is at US$1,281 and is down 0.76% over 24h. The morning radar highlights $ETH (-0.2%) and $BTC (-0.0%), with volumes of $132 M and $387 M, respectively. But the biggest move is in ZEC, which fell 0.72% and still has a volume of $108 M.
The 24h range is 1,237‑1,298, RSI is 50.6, and the 20/50 EMAs are at 1,281/1,268, indicating a sideways trend on the 4h chart. There’s no clear pressure, but the negative funding rate of -0.0089% suggests longs are paying.
Key support levels: 1,225 and 1,173. Resistance levels: 1,287 and 1,339. If the price breaks above 1,287, it invalidates the bearish scenario and opens the way to 1,339. If it breaks below 1,225, it breaks the bullish momentum and could fall to 1,173.
I wouldn’t enter now; it feels like a trap if it breaks 1,287 without volume confirmation. Better to wait for a retest of 1,225 or a bounce at 1,287 before taking a risk.
Will it break 1,287 or return to 1,225? 🟢/🔴
#zcash #privacy
This is not financial advice. Do your own research before investing.
$ZEC 1,281: heading to 1,287 or a drop?
$ZEC is at US$1,281 and is down 0.76% over 24h. The morning radar highlights $ETH (-0.2%) and $BTC (-0.0%), with volumes of $132 M and $387 M, respectively. But the biggest move is in ZEC, which fell 0.72% and still has a volume of $108 M.
The 24h range is 1,237‑1,298, RSI is 50.6, and the 20/50 EMAs are at 1,281/1,268, indicating a sideways trend on the 4h chart. There’s no clear pressure, but the negative funding rate of -0.0089% suggests longs are paying.
Key support levels: 1,225 and 1,173. Resistance levels: 1,287 and 1,339. If the price breaks above 1,287, it invalidates the bearish scenario and opens the way to 1,339. If it breaks below 1,225, it breaks the bullish momentum and could fall to 1,173.
I wouldn’t enter now; it feels like a trap if it breaks 1,287 without volume confirmation. Better to wait for a retest of 1,225 or a bounce at 1,287 before taking a risk.
Will it break 1,287 or return to 1,225? 🟢/🔴
#zcash #privacy
This is not financial advice. Do your own research before investing.
$ZEC is at US$1,281 and is down 0.76% over 24h. The morning radar highlights $ETH (-0.2%) and $BTC (-0.0%), with volumes of $132 M and $387 M, respectively. But the biggest move is in ZEC, which fell 0.72% and still has a volume of $108 M.
The 24h range is 1,237‑1,298, RSI is 50.6, and the 20/50 EMAs are at 1,281/1,268, indicating a sideways trend on the 4h chart. There’s no clear pressure, but the negative funding rate of -0.0089% suggests longs are paying.
Key support levels: 1,225 and 1,173. Resistance levels: 1,287 and 1,339. If the price breaks above 1,287, it invalidates the bearish scenario and opens the way to 1,339. If it breaks below 1,225, it breaks the bullish momentum and could fall to 1,173.
I wouldn’t enter now; it feels like a trap if it breaks 1,287 without volume confirmation. Better to wait for a retest of 1,225 or a bounce at 1,287 before taking a risk.
Will it break 1,287 or return to 1,225? 🟢/🔴
#zcash #privacy
This is not financial advice. Do your own research before investing.
53
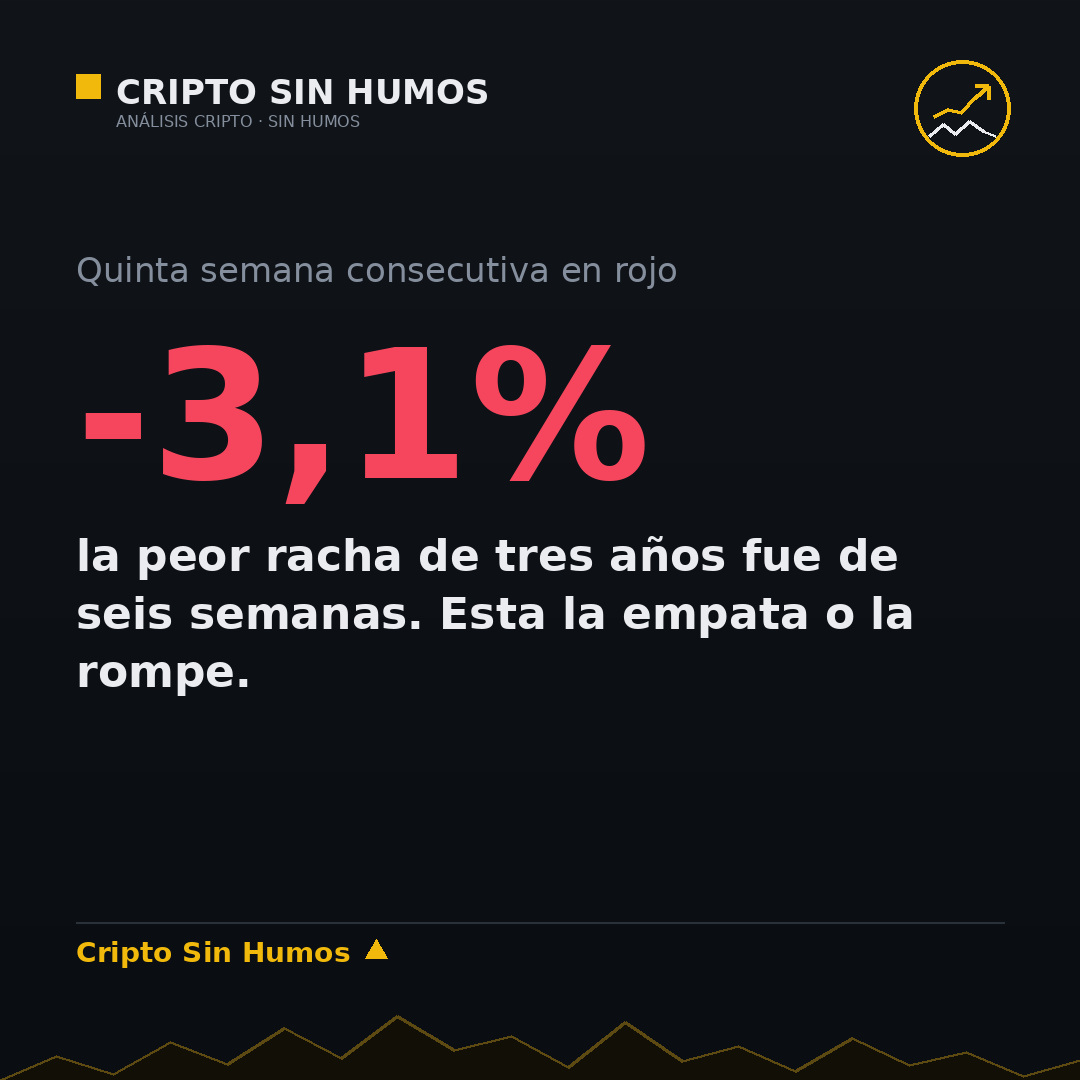
Five straight red weeks: the streak putting the thesis to the test
Weekly $BTC closes: 86,530 → 83,773 → 82,116 → 80,154 → 78,354 → 75,892. Five consecutive down weeks, with the latest down 3.1%.
The worst streak in the past three years was six weeks. The one starting now will determine whether we tie the record or the market catches its breath.
The interesting thing: this isn't a crash. It's an orderly erosion, with the 200-day average still below (73,240) and the on-chain cost basis much lower (53,995). This kind of decline is usually resolved with time, not with a single day of panic.
What to watch: if Monday closes above 77,700, the streak is broken. If it closes below 73,240, it becomes a trend.
Six weeks or a rebound?
#Bitcoin #Cripto #BinanceSquare
This is not financial advice. Do your own research before investing.
Five straight red weeks: the streak putting the thesis to the test
Weekly $BTC closes: 86,530 → 83,773 → 82,116 → 80,154 → 78,354 → 75,892. Five consecutive down weeks, with the latest down 3.1%.
The worst streak in the past three years was six weeks. The one starting now will determine whether we tie the record or the market catches its breath.
The interesting thing: this isn't a crash. It's an orderly erosion, with the 200-day average still below (73,240) and the on-chain cost basis much lower (53,995). This kind of decline is usually resolved with time, not with a single day of panic.
What to watch: if Monday closes above 77,700, the streak is broken. If it closes below 73,240, it becomes a trend.
Six weeks or a rebound?
#Bitcoin #Cripto #BinanceSquare
This is not financial advice. Do your own research before investing.
Weekly $BTC closes: 86,530 → 83,773 → 82,116 → 80,154 → 78,354 → 75,892. Five consecutive down weeks, with the latest down 3.1%.
The worst streak in the past three years was six weeks. The one starting now will determine whether we tie the record or the market catches its breath.
The interesting thing: this isn't a crash. It's an orderly erosion, with the 200-day average still below (73,240) and the on-chain cost basis much lower (53,995). This kind of decline is usually resolved with time, not with a single day of panic.
What to watch: if Monday closes above 77,700, the streak is broken. If it closes below 73,240, it becomes a trend.
Six weeks or a rebound?
#Bitcoin #Cripto #BinanceSquare
This is not financial advice. Do your own research before investing.
30
Log in to explore more content
Join global crypto users on Binance Square
⚡️ Get latest and useful information about crypto.
💬 Trusted by the world’s largest crypto exchange.
👍 Discover real insights from verified creators.
Email / Phone number
Trending Topics
NvidiaEarningsTonight:AIStocks’NextMove?
64,710 views
928 Discussing
Nvidia Earnings Day: Interim CEO's First Appearance — Can the AI Story Hold?
Binance News
·17 Likes
·7.9k views
A Packed Week of Earnings and Data Tests Markets
122,720 views
616 Discussing
AnthropicIPOTestsInvestorAppetiteForAI
270,943 views
2,633 Discussing