
Muhammad Asad 456
79 Posts

Muhammad Asad 456
Report
Block User
Crypto Analyst | Chart Breakdowns 📊 | Entry & Exit Strategies 🎯 | Exploring BTC, ETH, Altcoins 🚀 | Sharing insights for smart trading decisions 💡 | #Crypto
Open Trade
Frequent Trader
2.7 Years
128 Following
89 Followers
72 Liked
Posts
Portfolio
All
Quotes
SOL/USDT: Is Solana Finding its Bottom? The Massive Support Test🚀$SOL
The **SOL/USDT** monthly chart is painting a high-stakes picture for one of the most popular Layer 1 networks. Currently trading at **$84.55**, Solana is showing signs of a massive structural retest that could define its trajectory for the rest of 2026.
### **The Technical Landscape** 📊
Looking at the long-term timeframe, here is what the data tells us:
* **The "Double Top" Echo:** After peaking near **$295**, SOL has undergone a significant correction. We are currently seeing the price grapple with the aftermath of a massive volatile cycle.
* **Moving Averages (MA):** The **MA(7)** ($114.72) and **MA(25)** ($153.68) are currently acting as heavy overhead resistance. For a true bullish trend to resume, SOL needs to reclaim the **$115** level to flip the short-term sentiment.
* **Oversold Signals?** The **Stochastic RSI** is currently sitting at a rock-bottom level of **0.47**. Historically, when the monthly StochRSI bottoms out like this, it signals an "exhaustion" of sellers. We are in the deep value zone.
### **Why Solana Holders are Watching $80** 🛡️
The **$80 - $84** range is a critical historical pivot zone. If the bulls can hold this line, we are looking at a potential "higher low" structure compared to the 2022-2023 lows. A bounce from here would target a move back toward the **$150** psychological level.
### **Market Sentiment** 🌐
Despite the price drawdown, the Solana ecosystem remains a hub for meme coin activity, high-speed DeFi, and NFT innovation. On-chain volume on Binance continues to stay robust, with **142.45M USDT** in 24h volume, showing that liquidity and interest haven't faded.
### **The Bottom Line** 📈
Solana is in a "patience phase." While the monthly candles look bearish, the extreme oversold condition on the RSI suggests the "pain" might be nearing its end. Strategic traders are eyeing this area for long-term accumulation, keeping a close stop-loss below the **$75** mark.
**Key Levels to Watch:**
* **Resistance:** $114.72 (MA7)
* **Support:** $80.00 (Psychological Floor)
#solana #CryptoAnalysis #BinanceSquare #Layer1 #altcoins
$BTC
{spot}(BTCUSDT)
$SOL
{spot}(SOLUSDT)
SOL/USDT: Is Solana Finding its Bottom? The Massive Support Test🚀
$SOL
The **SOL/USDT** monthly chart is painting a high-stakes picture for one of the most popular Layer 1 networks. Currently trading at **$84.55**, Solana is showing signs of a massive structural retest that could define its trajectory for the rest of 2026.
### **The Technical Landscape** 📊
Looking at the long-term timeframe, here is what the data tells us:
* **The "Double Top" Echo:** After peaking near **$295**, SOL has undergone a significant correction. We are currently seeing the price grapple with the aftermath of a massive volatile cycle.
* **Moving Averages (MA):** The **MA(7)** ($114.72) and **MA(25)** ($153.68) are currently acting as heavy overhead resistance. For a true bullish trend to resume, SOL needs to reclaim the **$115** level to flip the short-term sentiment.
* **Oversold Signals?** The **Stochastic RSI** is currently sitting at a rock-bottom level of **0.47**. Historically, when the monthly StochRSI bottoms out like this, it signals an "exhaustion" of sellers. We are in the deep value zone.
### **Why Solana Holders are Watching $80** 🛡️
The **$80 - $84** range is a critical historical pivot zone. If the bulls can hold this line, we are looking at a potential "higher low" structure compared to the 2022-2023 lows. A bounce from here would target a move back toward the **$150** psychological level.
### **Market Sentiment** 🌐
Despite the price drawdown, the Solana ecosystem remains a hub for meme coin activity, high-speed DeFi, and NFT innovation. On-chain volume on Binance continues to stay robust, with **142.45M USDT** in 24h volume, showing that liquidity and interest haven't faded.
### **The Bottom Line** 📈
Solana is in a "patience phase." While the monthly candles look bearish, the extreme oversold condition on the RSI suggests the "pain" might be nearing its end. Strategic traders are eyeing this area for long-term accumulation, keeping a close stop-loss below the **$75** mark.
**Key Levels to Watch:**
* **Resistance:** $114.72 (MA7)
* **Support:** $80.00 (Psychological Floor)
#solana #CryptoAnalysis #BinanceSquare #Layer1 #altcoins
$BTC
$SOL
The **SOL/USDT** monthly chart is painting a high-stakes picture for one of the most popular Layer 1 networks. Currently trading at **$84.55**, Solana is showing signs of a massive structural retest that could define its trajectory for the rest of 2026.
### **The Technical Landscape** 📊
Looking at the long-term timeframe, here is what the data tells us:
* **The "Double Top" Echo:** After peaking near **$295**, SOL has undergone a significant correction. We are currently seeing the price grapple with the aftermath of a massive volatile cycle.
* **Moving Averages (MA):** The **MA(7)** ($114.72) and **MA(25)** ($153.68) are currently acting as heavy overhead resistance. For a true bullish trend to resume, SOL needs to reclaim the **$115** level to flip the short-term sentiment.
* **Oversold Signals?** The **Stochastic RSI** is currently sitting at a rock-bottom level of **0.47**. Historically, when the monthly StochRSI bottoms out like this, it signals an "exhaustion" of sellers. We are in the deep value zone.
### **Why Solana Holders are Watching $80** 🛡️
The **$80 - $84** range is a critical historical pivot zone. If the bulls can hold this line, we are looking at a potential "higher low" structure compared to the 2022-2023 lows. A bounce from here would target a move back toward the **$150** psychological level.
### **Market Sentiment** 🌐
Despite the price drawdown, the Solana ecosystem remains a hub for meme coin activity, high-speed DeFi, and NFT innovation. On-chain volume on Binance continues to stay robust, with **142.45M USDT** in 24h volume, showing that liquidity and interest haven't faded.
### **The Bottom Line** 📈
Solana is in a "patience phase." While the monthly candles look bearish, the extreme oversold condition on the RSI suggests the "pain" might be nearing its end. Strategic traders are eyeing this area for long-term accumulation, keeping a close stop-loss below the **$75** mark.
**Key Levels to Watch:**
* **Resistance:** $114.72 (MA7)
* **Support:** $80.00 (Psychological Floor)
#solana #CryptoAnalysis #BinanceSquare #Layer1 #altcoins
$BTC
$SOL
67
AAVE/USDT Technical Analysis: Bottoming Out or Just the Beginning?🚀$AAVE
The **AAVE/USDT** pair is currently at a critical crossroads. After a sustained downward trend from its January highs near **$207**, the price action suggests we are entering a definitive consolidation phase. As of April 29, 2026, AAVE is trading at **$96.52**, testing the psychological and technical floor.
### **The Technical Breakdown** 📊
* **Moving Averages (MA):** The chart shows a bearish alignment with the price below the **MA(99)** at **$112.93**. However, the short-term **MA(7)** ($95.70) is beginning to flatten, signaling that the aggressive selling pressure might be exhausting.
* **Support & Resistance:** Immediate support is locked at **$85.05**. A successful defense of this level is vital for any bullish reversal. On the flip side, a breakout above the **$112** zone (MA 99) would confirm a trend shift.
* **Stochastic RSI:** Sitting at **31.13**, the indicator is approaching the "oversold" territory. Historically, this level has preceded local bounces, making it a prime area for "buy the dip" hunters.
### **Market Sentiment & DeFi Outlook** 🌐
Despite the price lag, AAVE remains the undisputed king of DeFi. With the recent launch of **Aave V4** and the expansion of the **GHO stablecoin**, the protocol's fundamentals have never been stronger. Market analysts see 2026 as a "re-rating year" for blue-chip DeFi assets.
### **The Verdict** 📈
AAVE is currently in a "Value Zone." While the macro trend remains cautious, the proximity to the **$85** support offers a high-risk, high-reward entry for patient traders.
**Watch for:** A daily close above **$102** to signal the start of a recovery toward the **$145** mid-range target.
#AAVE #defi #CryptoAnalysis #BinanceSquare #TradingSignals
AAVE/USDT Technical Analysis: Bottoming Out or Just the Beginning?🚀
$AAVE
The **AAVE/USDT** pair is currently at a critical crossroads. After a sustained downward trend from its January highs near **$207**, the price action suggests we are entering a definitive consolidation phase. As of April 29, 2026, AAVE is trading at **$96.52**, testing the psychological and technical floor.
### **The Technical Breakdown** 📊
* **Moving Averages (MA):** The chart shows a bearish alignment with the price below the **MA(99)** at **$112.93**. However, the short-term **MA(7)** ($95.70) is beginning to flatten, signaling that the aggressive selling pressure might be exhausting.
* **Support & Resistance:** Immediate support is locked at **$85.05**. A successful defense of this level is vital for any bullish reversal. On the flip side, a breakout above the **$112** zone (MA 99) would confirm a trend shift.
* **Stochastic RSI:** Sitting at **31.13**, the indicator is approaching the "oversold" territory. Historically, this level has preceded local bounces, making it a prime area for "buy the dip" hunters.
### **Market Sentiment & DeFi Outlook** 🌐
Despite the price lag, AAVE remains the undisputed king of DeFi. With the recent launch of **Aave V4** and the expansion of the **GHO stablecoin**, the protocol's fundamentals have never been stronger. Market analysts see 2026 as a "re-rating year" for blue-chip DeFi assets.
### **The Verdict** 📈
AAVE is currently in a "Value Zone." While the macro trend remains cautious, the proximity to the **$85** support offers a high-risk, high-reward entry for patient traders.
**Watch for:** A daily close above **$102** to signal the start of a recovery toward the **$145** mid-range target.
#AAVE #defi #CryptoAnalysis #BinanceSquare #TradingSignals
The **AAVE/USDT** pair is currently at a critical crossroads. After a sustained downward trend from its January highs near **$207**, the price action suggests we are entering a definitive consolidation phase. As of April 29, 2026, AAVE is trading at **$96.52**, testing the psychological and technical floor.
### **The Technical Breakdown** 📊
* **Moving Averages (MA):** The chart shows a bearish alignment with the price below the **MA(99)** at **$112.93**. However, the short-term **MA(7)** ($95.70) is beginning to flatten, signaling that the aggressive selling pressure might be exhausting.
* **Support & Resistance:** Immediate support is locked at **$85.05**. A successful defense of this level is vital for any bullish reversal. On the flip side, a breakout above the **$112** zone (MA 99) would confirm a trend shift.
* **Stochastic RSI:** Sitting at **31.13**, the indicator is approaching the "oversold" territory. Historically, this level has preceded local bounces, making it a prime area for "buy the dip" hunters.
### **Market Sentiment & DeFi Outlook** 🌐
Despite the price lag, AAVE remains the undisputed king of DeFi. With the recent launch of **Aave V4** and the expansion of the **GHO stablecoin**, the protocol's fundamentals have never been stronger. Market analysts see 2026 as a "re-rating year" for blue-chip DeFi assets.
### **The Verdict** 📈
AAVE is currently in a "Value Zone." While the macro trend remains cautious, the proximity to the **$85** support offers a high-risk, high-reward entry for patient traders.
**Watch for:** A daily close above **$102** to signal the start of a recovery toward the **$145** mid-range target.
#AAVE #defi #CryptoAnalysis #BinanceSquare #TradingSignals
1
63
$BTC
{spot}(BTCUSDT)
has always been a cyclical beast 👀
2013: -87.06%
2017: -83.46%
2021: -78.57%
2025: people see one tiny bounce and immediately scream “TO THE MOON!” — then call me stupid for staying cautious. $ETH
{spot}(ETHUSDT)
Every cycle, I used to respond:
“Sure, maybe I’m dumb.”
But here’s the truth:
When the market pumps, nobody sends me their profits.
When it crashes, nobody apologizes.
So in 2025, my answer is simple:
Trade your conviction.
If you win — you keep it.
If you lose — you own it.
DYOR. Stay sharp. 🧠🚀
#downtrend #ETHBreaksATH #CFTCCryptoSprint
$BTC
has always been a cyclical beast 👀
2013: -87.06%
2017: -83.46%
2021: -78.57%
2025: people see one tiny bounce and immediately scream “TO THE MOON!” — then call me stupid for staying cautious. $ETH
Every cycle, I used to respond:
“Sure, maybe I’m dumb.”
But here’s the truth:
When the market pumps, nobody sends me their profits.
When it crashes, nobody apologizes.
So in 2025, my answer is simple:
Trade your conviction.
If you win — you keep it.
If you lose — you own it.
DYOR. Stay sharp. 🧠🚀
#downtrend #ETHBreaksATH #CFTCCryptoSprint
has always been a cyclical beast 👀
2013: -87.06%
2017: -83.46%
2021: -78.57%
2025: people see one tiny bounce and immediately scream “TO THE MOON!” — then call me stupid for staying cautious. $ETH
Every cycle, I used to respond:
“Sure, maybe I’m dumb.”
But here’s the truth:
When the market pumps, nobody sends me their profits.
When it crashes, nobody apologizes.
So in 2025, my answer is simple:
Trade your conviction.
If you win — you keep it.
If you lose — you own it.
DYOR. Stay sharp. 🧠🚀
#downtrend #ETHBreaksATH #CFTCCryptoSprint
5
I’m excited to share my thoughts on the innovation#ROBO
I’m excited to share my thoughts on the innovation behind @FabricFoundation and its powerful ecosystem token $ROBO. Built to drive real utility, $ROBO is more than just a digital asset — it fuels automation, smart infrastructure, and decentralized solutions designed for the future. The vision of @FabricFoundation focuses on scalable blockchain architecture, empowering developers and communities to build efficiently and securely.
With $ROBO at the core, users can access ecosystem rewards, governance participation, and advanced platform features. The integration of intelligent systems and blockchain transparency makes $ROBO a strong contender in the evolving Web3 space.
As adoption grows, #ROBO continues to gain attention for its practical use cases and long-term sustainability. I believe @FabricFoundation and $ROBO represent a forward-thinking movement combining innovation, utility, and community growth in one powerful ecosystem.
{spot}(ROBOUSDT)
#BTC☀️ #BTC走势分析 #Write2Earn
I’m excited to share my thoughts on the innovation
#ROBO
I’m excited to share my thoughts on the innovation behind @FabricFoundation and its powerful ecosystem token $ROBO . Built to drive real utility, $ROBO is more than just a digital asset — it fuels automation, smart infrastructure, and decentralized solutions designed for the future. The vision of @FabricFoundation focuses on scalable blockchain architecture, empowering developers and communities to build efficiently and securely.
With $ROBO at the core, users can access ecosystem rewards, governance participation, and advanced platform features. The integration of intelligent systems and blockchain transparency makes $ROBO a strong contender in the evolving Web3 space.
As adoption grows, #ROBO continues to gain attention for its practical use cases and long-term sustainability. I believe @FabricFoundation and $ROBO represent a forward-thinking movement combining innovation, utility, and community growth in one powerful ecosystem.
#BTC☀️ #BTC走势分析 #Write2Earn
I’m excited to share my thoughts on the innovation behind @FabricFoundation and its powerful ecosystem token $ROBO . Built to drive real utility, $ROBO is more than just a digital asset — it fuels automation, smart infrastructure, and decentralized solutions designed for the future. The vision of @FabricFoundation focuses on scalable blockchain architecture, empowering developers and communities to build efficiently and securely.
With $ROBO at the core, users can access ecosystem rewards, governance participation, and advanced platform features. The integration of intelligent systems and blockchain transparency makes $ROBO a strong contender in the evolving Web3 space.
As adoption grows, #ROBO continues to gain attention for its practical use cases and long-term sustainability. I believe @FabricFoundation and $ROBO represent a forward-thinking movement combining innovation, utility, and community growth in one powerful ecosystem.
#BTC☀️ #BTC走势分析 #Write2Earn
1
15
Robo Coin – Powering the Future of Automated Crypto 🤖$ROBO
Robo Coin is an emerging digital asset focused on AI-driven trading and smart DeFi solutions. Designed for speed, security, and low transaction costs, it aims to simplify crypto investing through automation. With a growing community and innovative vision, Robo Coin is positioning itself as a next-gen utility token in the evolving Web3 ecosystem. Stay tuned as this project continues to build momentum in the market!
#StockMarketCrash #GoldSilverOilSurge #Binance #bitcoin
Robo Coin – Powering the Future of Automated Crypto 🤖
$ROBO
Robo Coin is an emerging digital asset focused on AI-driven trading and smart DeFi solutions. Designed for speed, security, and low transaction costs, it aims to simplify crypto investing through automation. With a growing community and innovative vision, Robo Coin is positioning itself as a next-gen utility token in the evolving Web3 ecosystem. Stay tuned as this project continues to build momentum in the market!
#StockMarketCrash #GoldSilverOilSurge #Binance #bitcoin
Robo Coin is an emerging digital asset focused on AI-driven trading and smart DeFi solutions. Designed for speed, security, and low transaction costs, it aims to simplify crypto investing through automation. With a growing community and innovative vision, Robo Coin is positioning itself as a next-gen utility token in the evolving Web3 ecosystem. Stay tuned as this project continues to build momentum in the market!
#StockMarketCrash #GoldSilverOilSurge #Binance #bitcoin
10
·
--
Bullish
#robo $ROBO
{spot}(ROBOUSDT)
Robo Coin – The Future of Smart Crypto Trading! 🤖
Robo Coin is built to power automated, AI-driven trading solutions in the Web3 space. With fast transactions, low fees, and strong community backing, it aims to simplify crypto investing for everyone. As adoption grows, Robo Coin could become a key player in smart DeFi innovation.
Keep an eye on this rising project — the robots are just getting started! 🔥
#StockMarketCrash #GoldSilverOilSurge #XCryptoBanMistake #USCitizensMiddleEastEvacuation
#robo $ROBO
Robo Coin – The Future of Smart Crypto Trading! 🤖
Robo Coin is built to power automated, AI-driven trading solutions in the Web3 space. With fast transactions, low fees, and strong community backing, it aims to simplify crypto investing for everyone. As adoption grows, Robo Coin could become a key player in smart DeFi innovation.
Keep an eye on this rising project — the robots are just getting started! 🔥
#StockMarketCrash #GoldSilverOilSurge #XCryptoBanMistake #USCitizensMiddleEastEvacuation
Robo Coin – The Future of Smart Crypto Trading! 🤖
Robo Coin is built to power automated, AI-driven trading solutions in the Web3 space. With fast transactions, low fees, and strong community backing, it aims to simplify crypto investing for everyone. As adoption grows, Robo Coin could become a key player in smart DeFi innovation.
Keep an eye on this rising project — the robots are just getting started! 🔥
#StockMarketCrash #GoldSilverOilSurge #XCryptoBanMistake #USCitizensMiddleEastEvacuation
23

Article
BITCOIN has officially stepped into the LAST Bear Trap of this entire cycle.$BTC
And if you’re not paying attention right now, you’re going to miss the moment everyone else will swear was “obvious in hindsight.”
This pattern — the one on your screen — has never failed once.
It is perfectly mirroring the 2022 setup, down to the timing, and it’s screaming the same message:
A $BTC bottom is forming in the next 3–5 days.
Back in 2022, the crowd did exactly what they’re doing now:
They waited…
They hesitated…
They tried to buy after the breakout…
And they missed the bottom by a mile.
History isn’t repeating —
it’s copying and pasting.
You can ignore this signal if you want.
But don’t you dare say you we
ren’t warned.
#BlockAILayoffs #JaneStreet10AMDump #MarketRebound #StrategyBTCPurchase #BitcoinGoogleSearchesSurge
$BTC
{spot}(BTCUSDT)
BITCOIN has officially stepped into the LAST Bear Trap of this entire cycle.
$BTC
And if you’re not paying attention right now, you’re going to miss the moment everyone else will swear was “obvious in hindsight.”
This pattern — the one on your screen — has never failed once.
It is perfectly mirroring the 2022 setup, down to the timing, and it’s screaming the same message:
A $BTC bottom is forming in the next 3–5 days.
Back in 2022, the crowd did exactly what they’re doing now:
They waited…
They hesitated…
They tried to buy after the breakout…
And they missed the bottom by a mile.
History isn’t repeating —
it’s copying and pasting.
You can ignore this signal if you want.
But don’t you dare say you we
ren’t warned.
#BlockAILayoffs #JaneStreet10AMDump #MarketRebound #StrategyBTCPurchase #BitcoinGoogleSearchesSurge
$BTC
And if you’re not paying attention right now, you’re going to miss the moment everyone else will swear was “obvious in hindsight.”
This pattern — the one on your screen — has never failed once.
It is perfectly mirroring the 2022 setup, down to the timing, and it’s screaming the same message:
A $BTC bottom is forming in the next 3–5 days.
Back in 2022, the crowd did exactly what they’re doing now:
They waited…
They hesitated…
They tried to buy after the breakout…
And they missed the bottom by a mile.
History isn’t repeating —
it’s copying and pasting.
You can ignore this signal if you want.
But don’t you dare say you we
ren’t warned.
#BlockAILayoffs #JaneStreet10AMDump #MarketRebound #StrategyBTCPurchase #BitcoinGoogleSearchesSurge
$BTC
1
23
$SOL
{spot}(SOLUSDT)
how to get 10k$ without knowing analysis:
1. Buy 20 SOL at an average price of 170
2. Buy 10 SOL at an average price of 85
3. Buy 10 SOL at an average price of 60
4. Wait for SOL to rise to 260 and sell everything
Completed steps 1 and 2, close the app and wait for step 3 hehehe
We will lough later😁
#JaneStreet10AMDump #MarketRebound #AxiomMisconductInvestigation #TrumpStateoftheUnion #BitcoinGoogleSearchesSurge
$NVDAon
$SOL
how to get 10k$ without knowing analysis:
1. Buy 20 SOL at an average price of 170
2. Buy 10 SOL at an average price of 85
3. Buy 10 SOL at an average price of 60
4. Wait for SOL to rise to 260 and sell everything
Completed steps 1 and 2, close the app and wait for step 3 hehehe
We will lough later😁
#JaneStreet10AMDump #MarketRebound #AxiomMisconductInvestigation #TrumpStateoftheUnion #BitcoinGoogleSearchesSurge
$NVDAon
how to get 10k$ without knowing analysis:
1. Buy 20 SOL at an average price of 170
2. Buy 10 SOL at an average price of 85
3. Buy 10 SOL at an average price of 60
4. Wait for SOL to rise to 260 and sell everything
Completed steps 1 and 2, close the app and wait for step 3 hehehe
We will lough later😁
#JaneStreet10AMDump #MarketRebound #AxiomMisconductInvestigation #TrumpStateoftheUnion #BitcoinGoogleSearchesSurge
$NVDAon

2
369
·
--
Bearish

1
246

Article
Next Move Entry and Exit Analysis for ORDI/USDT on Binance $ORDI
The cryptocurrency market is known for its volatility, and ORDI/USDT, a popular trading pair on Binance Square, is no exception. As of October 25, 2025, at 8:44 PM PKT, the latest chart data provides valuable insights into potential entry and exit points for traders. This article analyzes the current price trends, technical indicators, and market sentiment to guide your next move in trading ORDI/USDT.Current Market OverviewThe ORDI/USDT pair is currently trading at $5.213, reflecting a modest 1.16% increase in the last 24 hours. However, the chart reveals a significant drop from a recent high of $8.963, indicating a bearish trend over the short term. The 24-hour trading volume stands at $511,560.76 for ORDI and $2.66M in USDT, suggesting moderate market activity. Key moving averages (MA) include MA(7) at $5.194, MA(25) at $5.147, and MA(99) at $5.504, with the price hovering near these levels.Technical AnalysisMoving Averages (MA): The price is closely aligned with the 7-day and 25-day MAs, suggesting a potential consolidation phase. However, the downward trajectory from the $8.963 peak indicates bearish momentum unless a strong reversal occurs.
Volume Spike: A notable volume spike at the $0.626 level corresponds with the sharp price drop, hinting at a significant sell-off. Current volume (104,236.60) is lower, indicating reduced selling pressure.
Support and Resistance Levels: The immediate support level appears around $5.103 (24h low), while resistance is near $5.285 (24h high). A break above $5.285 could signal a bullish move toward $5.5, whereas a drop below $5.103 might test lower supports at $3.877.
Long-Term Trend: The 1-year performance shows an -84.78% decline, reflecting a prolonged bear market. However, short-term gains (e.g., +0.68% today) suggest possible recovery attempts.
Entry PointsConservative Entry: Wait for a confirmed breakout above $5.285 with increased volume. This could indicate a shift to bullish momentum, offering a safer entry around $5.3-$5.4.
Aggressive Entry: For risk-tolerant traders, consider entering near the current price of $5.213 if it holds above $5.103 support. A stop-loss below $5.0 can mitigate downside risk.
Indicators to Watch: Look for a bullish crossover in the MACD or a rise above the 7-day EMA for confirmation.
Exit PointsProfit Target: Aim for an exit around $5.5-$5.7 if the price breaks resistance, aligning with the 99-day MA. This offers a reasonable 5-10% gain from the current level.
Stop-Loss: Set a stop-loss at $5.0 to protect against a potential drop to $3.877 if the bearish trend resumes.
Trailing Stop: Use a trailing stop of 2-3% to lock in profits if the price continues to rise post-breakout.
{spot}(ORDIUSDT)
#ORDI #MarketRebound #BinanceSquare #ordi $
Next Move Entry and Exit Analysis for ORDI/USDT on Binance
$ORDI
The cryptocurrency market is known for its volatility, and ORDI/USDT, a popular trading pair on Binance Square, is no exception. As of October 25, 2025, at 8:44 PM PKT, the latest chart data provides valuable insights into potential entry and exit points for traders. This article analyzes the current price trends, technical indicators, and market sentiment to guide your next move in trading ORDI/USDT.Current Market OverviewThe ORDI/USDT pair is currently trading at $5.213, reflecting a modest 1.16% increase in the last 24 hours. However, the chart reveals a significant drop from a recent high of $8.963, indicating a bearish trend over the short term. The 24-hour trading volume stands at $511,560.76 for ORDI and $2.66M in USDT, suggesting moderate market activity. Key moving averages (MA) include MA(7) at $5.194, MA(25) at $5.147, and MA(99) at $5.504, with the price hovering near these levels.Technical AnalysisMoving Averages (MA): The price is closely aligned with the 7-day and 25-day MAs, suggesting a potential consolidation phase. However, the downward trajectory from the $8.963 peak indicates bearish momentum unless a strong reversal occurs.
Volume Spike: A notable volume spike at the $0.626 level corresponds with the sharp price drop, hinting at a significant sell-off. Current volume (104,236.60) is lower, indicating reduced selling pressure.
Support and Resistance Levels: The immediate support level appears around $5.103 (24h low), while resistance is near $5.285 (24h high). A break above $5.285 could signal a bullish move toward $5.5, whereas a drop below $5.103 might test lower supports at $3.877.
Long-Term Trend: The 1-year performance shows an -84.78% decline, reflecting a prolonged bear market. However, short-term gains (e.g., +0.68% today) suggest possible recovery attempts.
Entry PointsConservative Entry: Wait for a confirmed breakout above $5.285 with increased volume. This could indicate a shift to bullish momentum, offering a safer entry around $5.3-$5.4.
Aggressive Entry: For risk-tolerant traders, consider entering near the current price of $5.213 if it holds above $5.103 support. A stop-loss below $5.0 can mitigate downside risk.
Indicators to Watch: Look for a bullish crossover in the MACD or a rise above the 7-day EMA for confirmation.
Exit PointsProfit Target: Aim for an exit around $5.5-$5.7 if the price breaks resistance, aligning with the 99-day MA. This offers a reasonable 5-10% gain from the current level.
Stop-Loss: Set a stop-loss at $5.0 to protect against a potential drop to $3.877 if the bearish trend resumes.
Trailing Stop: Use a trailing stop of 2-3% to lock in profits if the price continues to rise post-breakout.
#ORDI #MarketRebound #BinanceSquare #ordi $
The cryptocurrency market is known for its volatility, and ORDI/USDT, a popular trading pair on Binance Square, is no exception. As of October 25, 2025, at 8:44 PM PKT, the latest chart data provides valuable insights into potential entry and exit points for traders. This article analyzes the current price trends, technical indicators, and market sentiment to guide your next move in trading ORDI/USDT.Current Market OverviewThe ORDI/USDT pair is currently trading at $5.213, reflecting a modest 1.16% increase in the last 24 hours. However, the chart reveals a significant drop from a recent high of $8.963, indicating a bearish trend over the short term. The 24-hour trading volume stands at $511,560.76 for ORDI and $2.66M in USDT, suggesting moderate market activity. Key moving averages (MA) include MA(7) at $5.194, MA(25) at $5.147, and MA(99) at $5.504, with the price hovering near these levels.Technical AnalysisMoving Averages (MA): The price is closely aligned with the 7-day and 25-day MAs, suggesting a potential consolidation phase. However, the downward trajectory from the $8.963 peak indicates bearish momentum unless a strong reversal occurs.
Volume Spike: A notable volume spike at the $0.626 level corresponds with the sharp price drop, hinting at a significant sell-off. Current volume (104,236.60) is lower, indicating reduced selling pressure.
Support and Resistance Levels: The immediate support level appears around $5.103 (24h low), while resistance is near $5.285 (24h high). A break above $5.285 could signal a bullish move toward $5.5, whereas a drop below $5.103 might test lower supports at $3.877.
Long-Term Trend: The 1-year performance shows an -84.78% decline, reflecting a prolonged bear market. However, short-term gains (e.g., +0.68% today) suggest possible recovery attempts.
Entry PointsConservative Entry: Wait for a confirmed breakout above $5.285 with increased volume. This could indicate a shift to bullish momentum, offering a safer entry around $5.3-$5.4.
Aggressive Entry: For risk-tolerant traders, consider entering near the current price of $5.213 if it holds above $5.103 support. A stop-loss below $5.0 can mitigate downside risk.
Indicators to Watch: Look for a bullish crossover in the MACD or a rise above the 7-day EMA for confirmation.
Exit PointsProfit Target: Aim for an exit around $5.5-$5.7 if the price breaks resistance, aligning with the 99-day MA. This offers a reasonable 5-10% gain from the current level.
Stop-Loss: Set a stop-loss at $5.0 to protect against a potential drop to $3.877 if the bearish trend resumes.
Trailing Stop: Use a trailing stop of 2-3% to lock in profits if the price continues to rise post-breakout.
#ORDI #MarketRebound #BinanceSquare #ordi $
1
428
·
--
Bullish
$BTC
{spot}(BTCUSDT)
$ETH
{spot}(ETHUSDT)
$BNB
{spot}(BNBUSDT)
🚨 GERMANY UNLEASHES €400B — THE SLEEPING GIANT AWAKENS! 🇩🇪💥
After years of restraint, Germany just flipped the switch — launching a €400B investment plan to power defense, infrastructure, energy, and tech innovation. ⚡
This marks a historic shift from austerity to growth, hailed by ECB’s Lagarde as a “turning point” for Europe.
💶 Economists expect:
➡️ +1.6% GDP boost by 2030
➡️ Eurozone-wide growth wave
➡️ DAX heading for new highs 📈
Germany is betting big on resilience, innovation, and independence.
The age of caution is over — the engine of Europe is roaring back. 🇩🇪🔥
#Germany #eurozone
$BTC
$ETH
$BNB
🚨 GERMANY UNLEASHES €400B — THE SLEEPING GIANT AWAKENS! 🇩🇪💥
After years of restraint, Germany just flipped the switch — launching a €400B investment plan to power defense, infrastructure, energy, and tech innovation. ⚡
This marks a historic shift from austerity to growth, hailed by ECB’s Lagarde as a “turning point” for Europe.
💶 Economists expect:
➡️ +1.6% GDP boost by 2030
➡️ Eurozone-wide growth wave
➡️ DAX heading for new highs 📈
Germany is betting big on resilience, innovation, and independence.
The age of caution is over — the engine of Europe is roaring back. 🇩🇪🔥
#Germany #eurozone
$ETH
$BNB
🚨 GERMANY UNLEASHES €400B — THE SLEEPING GIANT AWAKENS! 🇩🇪💥
After years of restraint, Germany just flipped the switch — launching a €400B investment plan to power defense, infrastructure, energy, and tech innovation. ⚡
This marks a historic shift from austerity to growth, hailed by ECB’s Lagarde as a “turning point” for Europe.
💶 Economists expect:
➡️ +1.6% GDP boost by 2030
➡️ Eurozone-wide growth wave
➡️ DAX heading for new highs 📈
Germany is betting big on resilience, innovation, and independence.
The age of caution is over — the engine of Europe is roaring back. 🇩🇪🔥
#Germany #eurozone

3
·
--
Bullish
🇺🇸 White House Advisor Hassett says government shutdown likely to end sometime this week.
🇺🇸 White House Advisor Hassett says government shutdown likely to end sometime this week.
3

·
--
Bullish
$DOT
{spot}(DOTUSDT)
🚀 Polkadot (DOT): Powering the Future of Web3 Connectivity
🌐 What is Polkadot?
Polkadot is a next-generation blockchain protocol designed to connect multiple blockchains into one unified network. It enables seamless data and asset transfers between different chains — making true interoperability a reality in the crypto space.
⚙️ Why Polkadot Stands Out:
🧩 Interoperability: Bridges blockchains so they can share data and value effortlessly.
⚡ Scalability: Parallel chains (parachains) allow faster and more efficient transactions.
🛡️ Security: A shared security model keeps all connected chains safe.
🗳️ Governance: DOT holders shape the network’s future through on-chain governance.
💡 The Mission:
Polkadot aims to empower the decentralized internet (Web3) — where users, not corporations, control their data and digital identities.
📈 Why Traders Watch DOT:
With strong fundamentals, an expanding parachain ecosystem, and a growing developer community, DOT remains one of the most promising long-term projects in the crypto world.
DOT soon 50$
🔥 Join the Movement. Build. Connect. Grow.
#Polkadot #DOT #BinanceSquareFamily
$DOT
$DOT
🚀 Polkadot (DOT): Powering the Future of Web3 Connectivity
🌐 What is Polkadot?
Polkadot is a next-generation blockchain protocol designed to connect multiple blockchains into one unified network. It enables seamless data and asset transfers between different chains — making true interoperability a reality in the crypto space.
⚙️ Why Polkadot Stands Out:
🧩 Interoperability: Bridges blockchains so they can share data and value effortlessly.
⚡ Scalability: Parallel chains (parachains) allow faster and more efficient transactions.
🛡️ Security: A shared security model keeps all connected chains safe.
🗳️ Governance: DOT holders shape the network’s future through on-chain governance.
💡 The Mission:
Polkadot aims to empower the decentralized internet (Web3) — where users, not corporations, control their data and digital identities.
📈 Why Traders Watch DOT:
With strong fundamentals, an expanding parachain ecosystem, and a growing developer community, DOT remains one of the most promising long-term projects in the crypto world.
DOT soon 50$
🔥 Join the Movement. Build. Connect. Grow.
#Polkadot #DOT #BinanceSquareFamily
$DOT
🚀 Polkadot (DOT): Powering the Future of Web3 Connectivity
🌐 What is Polkadot?
Polkadot is a next-generation blockchain protocol designed to connect multiple blockchains into one unified network. It enables seamless data and asset transfers between different chains — making true interoperability a reality in the crypto space.
⚙️ Why Polkadot Stands Out:
🧩 Interoperability: Bridges blockchains so they can share data and value effortlessly.
⚡ Scalability: Parallel chains (parachains) allow faster and more efficient transactions.
🛡️ Security: A shared security model keeps all connected chains safe.
🗳️ Governance: DOT holders shape the network’s future through on-chain governance.
💡 The Mission:
Polkadot aims to empower the decentralized internet (Web3) — where users, not corporations, control their data and digital identities.
📈 Why Traders Watch DOT:
With strong fundamentals, an expanding parachain ecosystem, and a growing developer community, DOT remains one of the most promising long-term projects in the crypto world.
DOT soon 50$
🔥 Join the Movement. Build. Connect. Grow.
#Polkadot #DOT #BinanceSquareFamily
$DOT

105

Article
: ETH Eyes $4.5K: A Precision Guide for Your Next Move$ETH
{spot}(ETHUSDT)
The king of altcoins is making a decisive move. Ethereum is currently trading at **4,414.51 USDT**, boasting a strong +2.75% gain and pushing against key resistance levels. For traders looking to capitalize on this momentum, understanding the precise entry and exit points is crucial.
Let's break down the data from the charts to build a strategic plan.
### **🔍 Technical Snapshot & Key Levels:**
* **Current Price:** 4,414.51 USDT
* **24h High/Low:** 4,453.57 / 4,277.06
* **Key Resistance:** **4,453.57** (Today's High)
* **Key Support:** **4,357.30** (MA25) & **4,317.90** (MA99)
* **Trend:** Bullish above the critical moving average cluster (MA7, MA25, MA99).
The price is trading comfortably above all major moving averages (MA7, MA25, MA99), indicating a strong underlying bullish trend. The high volume of 451K ETH confirms genuine buyer interest.
### **🎯 Next Move: Entry & Exit Strategy**
#### **LONG Position (Bullish Scenario):**
* **Entry Zone 1 (Aggressive):** On a slight pullback to the **$4,370 - $4,390** area (near MA7 support). This offers a better risk-reward ratio.
* **Entry Zone 2 (Breakout Confirmation):** A decisive 4-hour candle close above the **$4,453** resistance.
* **Stop-Loss (SL):** A close below the **$4,317** (MA99) support. This protects against a false breakout.
* **Take-Profit Targets (TP):**
* **TP1:** $4,500 (Psychological Level)
* **TP2:** $4,550 - $4,600 (Next major resistance zone)
#### **SHORT Position (Cautionary Scenario):**
The overall trend is bullish, so shorts are counter-trend and riskier. Only consider if key support breaks.
* **Entry Trigger:** A decisive 4-hour candle close **below $4,317** (MA99).
* **Stop-Loss (SL):** Just above the MA25 level at **$4,370**.
* **Take-Profit Target:** Down towards the next support at **$4,250**.
$ETH
### **📊 Why This Setup?**
The chart shows a classic "bullish consolidation" pattern. After a strong run, ETH is taking a breather just below a local high. The moving averages are fanned out bullishly (MA7 > MA25 > MA99), and volume, while not explosive, remains healthy. A break above **$4,453** could trigger the next leg up.
### **⚠️ Risk Management is Key**
Always use stop-loss orders. The crypto market is volatile. Never risk more than 1-2% of your portfolio on a single trade. Protect your capital first; profits will follow.
**Like and Follow for more clear, data-driven trading setups!**
#Ethereum #BinanceSquare #TechnicalAnalysis #altcoins #Write2Earn
* **Action-Oriented Title:** "Next Move" and "Precision Guide" create urgency and promise value.
* **Data-Driven:** It directly references the provided screenshot data (price, MAs, high/low), establishing credibility.
* **Clear & Scannable:** Uses bullet points, bold text, and emojis to make complex information easy to digest quickly.
* **Actionable Strategy:** Provides specific price levels for entry, stop-loss, and take-profit, which is what traders are looking for.
* **Risk Management:** Includes a crucial section on managing risk, which builds trust and shows professionalism.
: ETH Eyes $4.5K: A Precision Guide for Your Next Move
$ETH
The king of altcoins is making a decisive move. Ethereum is currently trading at **4,414.51 USDT**, boasting a strong +2.75% gain and pushing against key resistance levels. For traders looking to capitalize on this momentum, understanding the precise entry and exit points is crucial.
Let's break down the data from the charts to build a strategic plan.
### **🔍 Technical Snapshot & Key Levels:**
* **Current Price:** 4,414.51 USDT
* **24h High/Low:** 4,453.57 / 4,277.06
* **Key Resistance:** **4,453.57** (Today's High)
* **Key Support:** **4,357.30** (MA25) & **4,317.90** (MA99)
* **Trend:** Bullish above the critical moving average cluster (MA7, MA25, MA99).
The price is trading comfortably above all major moving averages (MA7, MA25, MA99), indicating a strong underlying bullish trend. The high volume of 451K ETH confirms genuine buyer interest.
### **🎯 Next Move: Entry & Exit Strategy**
#### **LONG Position (Bullish Scenario):**
* **Entry Zone 1 (Aggressive):** On a slight pullback to the **$4,370 - $4,390** area (near MA7 support). This offers a better risk-reward ratio.
* **Entry Zone 2 (Breakout Confirmation):** A decisive 4-hour candle close above the **$4,453** resistance.
* **Stop-Loss (SL):** A close below the **$4,317** (MA99) support. This protects against a false breakout.
* **Take-Profit Targets (TP):**
* **TP1:** $4,500 (Psychological Level)
* **TP2:** $4,550 - $4,600 (Next major resistance zone)
#### **SHORT Position (Cautionary Scenario):**
The overall trend is bullish, so shorts are counter-trend and riskier. Only consider if key support breaks.
* **Entry Trigger:** A decisive 4-hour candle close **below $4,317** (MA99).
* **Stop-Loss (SL):** Just above the MA25 level at **$4,370**.
* **Take-Profit Target:** Down towards the next support at **$4,250**.
$ETH
### **📊 Why This Setup?**
The chart shows a classic "bullish consolidation" pattern. After a strong run, ETH is taking a breather just below a local high. The moving averages are fanned out bullishly (MA7 > MA25 > MA99), and volume, while not explosive, remains healthy. A break above **$4,453** could trigger the next leg up.
### **⚠️ Risk Management is Key**
Always use stop-loss orders. The crypto market is volatile. Never risk more than 1-2% of your portfolio on a single trade. Protect your capital first; profits will follow.
**Like and Follow for more clear, data-driven trading setups!**
#Ethereum #BinanceSquare #TechnicalAnalysis #altcoins #Write2Earn
* **Action-Oriented Title:** "Next Move" and "Precision Guide" create urgency and promise value.
* **Data-Driven:** It directly references the provided screenshot data (price, MAs, high/low), establishing credibility.
* **Clear & Scannable:** Uses bullet points, bold text, and emojis to make complex information easy to digest quickly.
* **Actionable Strategy:** Provides specific price levels for entry, stop-loss, and take-profit, which is what traders are looking for.
* **Risk Management:** Includes a crucial section on managing risk, which builds trust and shows professionalism.
The king of altcoins is making a decisive move. Ethereum is currently trading at **4,414.51 USDT**, boasting a strong +2.75% gain and pushing against key resistance levels. For traders looking to capitalize on this momentum, understanding the precise entry and exit points is crucial.
Let's break down the data from the charts to build a strategic plan.
### **🔍 Technical Snapshot & Key Levels:**
* **Current Price:** 4,414.51 USDT
* **24h High/Low:** 4,453.57 / 4,277.06
* **Key Resistance:** **4,453.57** (Today's High)
* **Key Support:** **4,357.30** (MA25) & **4,317.90** (MA99)
* **Trend:** Bullish above the critical moving average cluster (MA7, MA25, MA99).
The price is trading comfortably above all major moving averages (MA7, MA25, MA99), indicating a strong underlying bullish trend. The high volume of 451K ETH confirms genuine buyer interest.
### **🎯 Next Move: Entry & Exit Strategy**
#### **LONG Position (Bullish Scenario):**
* **Entry Zone 1 (Aggressive):** On a slight pullback to the **$4,370 - $4,390** area (near MA7 support). This offers a better risk-reward ratio.
* **Entry Zone 2 (Breakout Confirmation):** A decisive 4-hour candle close above the **$4,453** resistance.
* **Stop-Loss (SL):** A close below the **$4,317** (MA99) support. This protects against a false breakout.
* **Take-Profit Targets (TP):**
* **TP1:** $4,500 (Psychological Level)
* **TP2:** $4,550 - $4,600 (Next major resistance zone)
#### **SHORT Position (Cautionary Scenario):**
The overall trend is bullish, so shorts are counter-trend and riskier. Only consider if key support breaks.
* **Entry Trigger:** A decisive 4-hour candle close **below $4,317** (MA99).
* **Stop-Loss (SL):** Just above the MA25 level at **$4,370**.
* **Take-Profit Target:** Down towards the next support at **$4,250**.
$ETH
### **📊 Why This Setup?**
The chart shows a classic "bullish consolidation" pattern. After a strong run, ETH is taking a breather just below a local high. The moving averages are fanned out bullishly (MA7 > MA25 > MA99), and volume, while not explosive, remains healthy. A break above **$4,453** could trigger the next leg up.
### **⚠️ Risk Management is Key**
Always use stop-loss orders. The crypto market is volatile. Never risk more than 1-2% of your portfolio on a single trade. Protect your capital first; profits will follow.
**Like and Follow for more clear, data-driven trading setups!**
#Ethereum #BinanceSquare #TechnicalAnalysis #altcoins #Write2Earn
* **Action-Oriented Title:** "Next Move" and "Precision Guide" create urgency and promise value.
* **Data-Driven:** It directly references the provided screenshot data (price, MAs, high/low), establishing credibility.
* **Clear & Scannable:** Uses bullet points, bold text, and emojis to make complex information easy to digest quickly.
* **Actionable Strategy:** Provides specific price levels for entry, stop-loss, and take-profit, which is what traders are looking for.
* **Risk Management:** Includes a crucial section on managing risk, which builds trust and shows professionalism.
102

Article
ETH/USDT Analysis: Key Levels and Strategic Entry/Exit Points 📈$ETH
{spot}(ETHUSDT)
Ethereum (ETH) is currently trading at **4,580.99 USDT**, showing a notable increase of **+4.30%** over the past 24 hours. With a 24-hour high of 4,633.46 and a low of 4,373.19, the market is displaying signs of bullish momentum amid significant trading volume—747,830.72 ETH or approximately 3.37B USDT.
## 📊 Technical Indicators Overview
- **Moving Averages**:
- MA(7): 4,508.12
- MA(25): 4,638.91
- MA(99): 4,469.32
The price is currently trading above the MA(7) and MA(99) but below the MA(25), suggesting a mixed short-term sentiment with potential for consolidation.
- **Volume**:
The current volume is 66,629.27, significantly lower than the MA(5) (127,070.41) and MA(10) (150,359.81), indicating decreased participation which may precede a volatility expansion.
- **Support and Resistance**:
- Immediate Support: 4,373.19 (24h Low)
- Key Resistance: 4,633.46 (24h High)
- Next Major Resistance: 4,956.78
- Strong Support Zone: 4,040.15 - 4,370.74
$ETH
## 🎯 Trading Strategy: Entry and Exit Points
### **LONG Position Setup**
- **Entry**:
- Aggressive: Near 4,500 - 4,520 (above MA(7) and MA(99))
- Conservative: Wait for a pullback to 4,400 - 4,450 support zone
- **Stop-Loss**: Below 4,373 (24h Low)
- **Take-Profit Targets**:
- TP1: 4,633 (24h High)
- TP2: 4,700 - 4,750
- TP3: 4,956 (Next Resistance)
### **SHORT Position Setup**
- **Entry**:
- If price fails to break 4,633 and shows rejection
- Breakdown below 4,500 with increasing volume
- **Stop-Loss**: Above 4,650
- **Take-Profit Targets**:
- TP1: 4,450
- TP2: 4,373
- TP3: 4,200 (if momentum continues)
## 🔍 Market Sentiment and Upcoming Catalyst
The recent price action suggests buyers are attempting to push higher, but low volume calls for caution. A break above 4,633 with strong volume could trigger a move toward 4,700–4,950. Conversely, failure to hold 4,500 may lead to a retest of 4,373.
## ⚠️ Risk Management
Always use proper risk management. Do not risk more than 2-3% of your portfolio on a single trade. Consider using trailing stop-losses once in profit.
## ✅ Conclusion
ETH is at a critical juncture. Watch the 4,600–4,633 resistance zone for a potential breakout or reversal. Trade with the trend but remain adaptable to sudden volume shifts.
---
#ETH #BTC #CryptoNews #CryptoNews #BinanceSquare
Let’s see where the market takes us next! 🚀
Feel free to share your thoughts and strategies in the comments.
Like follow and share please thank you
$ETH
ETH/USDT Analysis: Key Levels and Strategic Entry/Exit Points 📈
$ETH
Ethereum (ETH) is currently trading at **4,580.99 USDT**, showing a notable increase of **+4.30%** over the past 24 hours. With a 24-hour high of 4,633.46 and a low of 4,373.19, the market is displaying signs of bullish momentum amid significant trading volume—747,830.72 ETH or approximately 3.37B USDT.
## 📊 Technical Indicators Overview
- **Moving Averages**:
- MA(7): 4,508.12
- MA(25): 4,638.91
- MA(99): 4,469.32
The price is currently trading above the MA(7) and MA(99) but below the MA(25), suggesting a mixed short-term sentiment with potential for consolidation.
- **Volume**:
The current volume is 66,629.27, significantly lower than the MA(5) (127,070.41) and MA(10) (150,359.81), indicating decreased participation which may precede a volatility expansion.
- **Support and Resistance**:
- Immediate Support: 4,373.19 (24h Low)
- Key Resistance: 4,633.46 (24h High)
- Next Major Resistance: 4,956.78
- Strong Support Zone: 4,040.15 - 4,370.74
$ETH
## 🎯 Trading Strategy: Entry and Exit Points
### **LONG Position Setup**
- **Entry**:
- Aggressive: Near 4,500 - 4,520 (above MA(7) and MA(99))
- Conservative: Wait for a pullback to 4,400 - 4,450 support zone
- **Stop-Loss**: Below 4,373 (24h Low)
- **Take-Profit Targets**:
- TP1: 4,633 (24h High)
- TP2: 4,700 - 4,750
- TP3: 4,956 (Next Resistance)
### **SHORT Position Setup**
- **Entry**:
- If price fails to break 4,633 and shows rejection
- Breakdown below 4,500 with increasing volume
- **Stop-Loss**: Above 4,650
- **Take-Profit Targets**:
- TP1: 4,450
- TP2: 4,373
- TP3: 4,200 (if momentum continues)
## 🔍 Market Sentiment and Upcoming Catalyst
The recent price action suggests buyers are attempting to push higher, but low volume calls for caution. A break above 4,633 with strong volume could trigger a move toward 4,700–4,950. Conversely, failure to hold 4,500 may lead to a retest of 4,373.
## ⚠️ Risk Management
Always use proper risk management. Do not risk more than 2-3% of your portfolio on a single trade. Consider using trailing stop-losses once in profit.
## ✅ Conclusion
ETH is at a critical juncture. Watch the 4,600–4,633 resistance zone for a potential breakout or reversal. Trade with the trend but remain adaptable to sudden volume shifts.
---
#ETH #BTC #CryptoNews #CryptoNews #BinanceSquare
Let’s see where the market takes us next! 🚀
Feel free to share your thoughts and strategies in the comments.
Like follow and share please thank you
$ETH
Ethereum (ETH) is currently trading at **4,580.99 USDT**, showing a notable increase of **+4.30%** over the past 24 hours. With a 24-hour high of 4,633.46 and a low of 4,373.19, the market is displaying signs of bullish momentum amid significant trading volume—747,830.72 ETH or approximately 3.37B USDT.
## 📊 Technical Indicators Overview
- **Moving Averages**:
- MA(7): 4,508.12
- MA(25): 4,638.91
- MA(99): 4,469.32
The price is currently trading above the MA(7) and MA(99) but below the MA(25), suggesting a mixed short-term sentiment with potential for consolidation.
- **Volume**:
The current volume is 66,629.27, significantly lower than the MA(5) (127,070.41) and MA(10) (150,359.81), indicating decreased participation which may precede a volatility expansion.
- **Support and Resistance**:
- Immediate Support: 4,373.19 (24h Low)
- Key Resistance: 4,633.46 (24h High)
- Next Major Resistance: 4,956.78
- Strong Support Zone: 4,040.15 - 4,370.74
$ETH
## 🎯 Trading Strategy: Entry and Exit Points
### **LONG Position Setup**
- **Entry**:
- Aggressive: Near 4,500 - 4,520 (above MA(7) and MA(99))
- Conservative: Wait for a pullback to 4,400 - 4,450 support zone
- **Stop-Loss**: Below 4,373 (24h Low)
- **Take-Profit Targets**:
- TP1: 4,633 (24h High)
- TP2: 4,700 - 4,750
- TP3: 4,956 (Next Resistance)
### **SHORT Position Setup**
- **Entry**:
- If price fails to break 4,633 and shows rejection
- Breakdown below 4,500 with increasing volume
- **Stop-Loss**: Above 4,650
- **Take-Profit Targets**:
- TP1: 4,450
- TP2: 4,373
- TP3: 4,200 (if momentum continues)
## 🔍 Market Sentiment and Upcoming Catalyst
The recent price action suggests buyers are attempting to push higher, but low volume calls for caution. A break above 4,633 with strong volume could trigger a move toward 4,700–4,950. Conversely, failure to hold 4,500 may lead to a retest of 4,373.
## ⚠️ Risk Management
Always use proper risk management. Do not risk more than 2-3% of your portfolio on a single trade. Consider using trailing stop-losses once in profit.
## ✅ Conclusion
ETH is at a critical juncture. Watch the 4,600–4,633 resistance zone for a potential breakout or reversal. Trade with the trend but remain adaptable to sudden volume shifts.
---
#ETH #BTC #CryptoNews #CryptoNews #BinanceSquare
Let’s see where the market takes us next! 🚀
Feel free to share your thoughts and strategies in the comments.
Like follow and share please thank you
$ETH
2
1.7k

Article
Article Title: BTC/USDT at a Crossroads: Key Levels to Watch for the Next Major Move$BTC
{spot}(BTCUSDT)
### **Executive Summary**
Bitcoin (BTC/USDT) is currently consolidating in a tight range after a recent pullback, trading at **114,982.75 USDT**. With the price caught between key moving averages and significant support, the market is poised for a decisive breakout. This analysis breaks down the critical technical levels to identify high-probability entry points for both bullish and bearish scenarios, complete with clear exit strategies.
### **Current Market Snapshot (As of Data Provided)**
* **Price:** 114,982.75 USDT
* **24h Change:** -0.88%
* **24h High/Low:** 116,034.53 / 114,560.00
* **Key Resistance:** 116,672.58 | 119,486.21
* **Key Support:** 114,560.00 (24h Low) | 111,684.79
### **Technical Analysis: The Battle of the Averages**
The chart reveals a tense battle between short-term and medium-term momentum, as defined by the Moving Averages (MAs):
* **MA(7): 115,216.17** - The price is trading just below this short-term average, indicating slight bearish pressure in the immediate term.
* **MA(25): 114,317.29** - This is the crucial **primary support level**. The price is holding above it, which is a mildly bullish sign. A decisive break below could trigger a sharper sell-off.
* **MA(99): 117,025.05** - This long-term average sits as a significant **resistance hurdle** overhead. A breakout above this level would be a strong bullish signal.
The convergence of these MAs creates a compression zone, meaning a powerful expansion in price (a volatile move) is highly likely.
$BTC
### **Trading Outlook & Scenarios**
#### **1. Bullish Scenario (Long Entry)**
For the bullish case to be validated, buyers need to reclaim control.
* **Entry Trigger:** A sustained 4-hour candle close **above the MA(7) at 115,216** and preferably **above the 116,672** level. This would signal a break of immediate resistance and open a path toward the MA(99) at **117,025**.
* **Confirmation:** Increasing volume on the upward move and a break above the MA(99) would confirm strength, targeting the next resistance zones at **119,486** and **122,299**.
* **Stop-Loss:** A logical stop-loss would be placed **below the key MA(25) support at 114,317**, for example, at **114,000**. This protects your capital if the support fails.
* **Take-Profit Targets:**
* **Target 1:** 117,025 (MA(99))
* **Target 2:** 119,486
* **Target 3:** 122,299
#### **2. Bearish Scenario (Short Entry)**
If selling pressure intensifies and key support breaks, a deeper correction is on the cards.
* **Entry Trigger:** A sustained 4-hour candle close **below the MA(25) support at 114,317**. This would be a critical breakdown, suggesting a shift in momentum to the downside.
* **Confirmation:** A break below the **24h Low of 114,560** would be the first warning sign. The move would be confirmed by high volume on the breakdown.
* **Stop-Loss:** A stop-loss should be placed just **above the MA(7) and the recent consolidation**, around **115,500**, to keep the risk-reward ratio favorable.
* **Take-Profit Targets:**
* **Target 1:** 111,684 (Next major support)
* **Target 2:** 111,045
### **Risk Management is Key**
Always remember the golden rule: **Never risk more than 1-2% of your trading capital on a single trade.** The crypto market is inherently volatile. Use the stop-loss levels defined above to manage your risk effectively.
### **Conclusion**
Bitcoin is at a critical juncture. The **114,317 - 115,216** range is the key battleground. Traders should wait for a confirmed breakout or breakdown from this zone with volume before committing capital. A move above **116,672** suggests a run toward **117k+**, while a break below **114,317** could see a test of **111.6k** support.
$BTC
**Trade safe and trade smart!**
#Bitcoin #TechnicalAnalysis #Binance #BinanceSquare #altcoins
### **SEO & Publishing Notes for Binance Square:**
* **Headline:** The title is designed to be compelling and keyword-rich ("BTC/USDT", "Next Major Move").
* **Structure:** Uses clear headings, bullet points, and bold text to improve readability on a social feed.
* **Keywords:** Integrates key terms like "BTC/USDT," "technical analysis," "support and resistance," "entry," "stop-loss," "take-profit," "Binance," and "moving averages" naturally throughout the text.
* **Hashtags:** A broad mix of popular and niche hashtags (#Bitcoin, #Trading, #BinanceSquare, #TechnicalAnalysis, #BTCUSDT) to maximize reach and engagement within the crypto community on Binance Square and beyond.
* **Call to Action:** The conclusion encourages engagement ("Trade safe and trade smart!").
* **Visuals:** This text would be posted alongside the provided chart image for maximum impact.
Like follow and share please thank you.
Article Title: BTC/USDT at a Crossroads: Key Levels to Watch for the Next Major Move
$BTC
### **Executive Summary**
Bitcoin (BTC/USDT) is currently consolidating in a tight range after a recent pullback, trading at **114,982.75 USDT**. With the price caught between key moving averages and significant support, the market is poised for a decisive breakout. This analysis breaks down the critical technical levels to identify high-probability entry points for both bullish and bearish scenarios, complete with clear exit strategies.
### **Current Market Snapshot (As of Data Provided)**
* **Price:** 114,982.75 USDT
* **24h Change:** -0.88%
* **24h High/Low:** 116,034.53 / 114,560.00
* **Key Resistance:** 116,672.58 | 119,486.21
* **Key Support:** 114,560.00 (24h Low) | 111,684.79
### **Technical Analysis: The Battle of the Averages**
The chart reveals a tense battle between short-term and medium-term momentum, as defined by the Moving Averages (MAs):
* **MA(7): 115,216.17** - The price is trading just below this short-term average, indicating slight bearish pressure in the immediate term.
* **MA(25): 114,317.29** - This is the crucial **primary support level**. The price is holding above it, which is a mildly bullish sign. A decisive break below could trigger a sharper sell-off.
* **MA(99): 117,025.05** - This long-term average sits as a significant **resistance hurdle** overhead. A breakout above this level would be a strong bullish signal.
The convergence of these MAs creates a compression zone, meaning a powerful expansion in price (a volatile move) is highly likely.
$BTC
### **Trading Outlook & Scenarios**
#### **1. Bullish Scenario (Long Entry)**
For the bullish case to be validated, buyers need to reclaim control.
* **Entry Trigger:** A sustained 4-hour candle close **above the MA(7) at 115,216** and preferably **above the 116,672** level. This would signal a break of immediate resistance and open a path toward the MA(99) at **117,025**.
* **Confirmation:** Increasing volume on the upward move and a break above the MA(99) would confirm strength, targeting the next resistance zones at **119,486** and **122,299**.
* **Stop-Loss:** A logical stop-loss would be placed **below the key MA(25) support at 114,317**, for example, at **114,000**. This protects your capital if the support fails.
* **Take-Profit Targets:**
* **Target 1:** 117,025 (MA(99))
* **Target 2:** 119,486
* **Target 3:** 122,299
#### **2. Bearish Scenario (Short Entry)**
If selling pressure intensifies and key support breaks, a deeper correction is on the cards.
* **Entry Trigger:** A sustained 4-hour candle close **below the MA(25) support at 114,317**. This would be a critical breakdown, suggesting a shift in momentum to the downside.
* **Confirmation:** A break below the **24h Low of 114,560** would be the first warning sign. The move would be confirmed by high volume on the breakdown.
* **Stop-Loss:** A stop-loss should be placed just **above the MA(7) and the recent consolidation**, around **115,500**, to keep the risk-reward ratio favorable.
* **Take-Profit Targets:**
* **Target 1:** 111,684 (Next major support)
* **Target 2:** 111,045
### **Risk Management is Key**
Always remember the golden rule: **Never risk more than 1-2% of your trading capital on a single trade.** The crypto market is inherently volatile. Use the stop-loss levels defined above to manage your risk effectively.
### **Conclusion**
Bitcoin is at a critical juncture. The **114,317 - 115,216** range is the key battleground. Traders should wait for a confirmed breakout or breakdown from this zone with volume before committing capital. A move above **116,672** suggests a run toward **117k+**, while a break below **114,317** could see a test of **111.6k** support.
$BTC
**Trade safe and trade smart!**
#Bitcoin #TechnicalAnalysis #Binance #BinanceSquare #altcoins
### **SEO & Publishing Notes for Binance Square:**
* **Headline:** The title is designed to be compelling and keyword-rich ("BTC/USDT", "Next Major Move").
* **Structure:** Uses clear headings, bullet points, and bold text to improve readability on a social feed.
* **Keywords:** Integrates key terms like "BTC/USDT," "technical analysis," "support and resistance," "entry," "stop-loss," "take-profit," "Binance," and "moving averages" naturally throughout the text.
* **Hashtags:** A broad mix of popular and niche hashtags (#Bitcoin, #Trading, #BinanceSquare, #TechnicalAnalysis, #BTCUSDT) to maximize reach and engagement within the crypto community on Binance Square and beyond.
* **Call to Action:** The conclusion encourages engagement ("Trade safe and trade smart!").
* **Visuals:** This text would be posted alongside the provided chart image for maximum impact.
Like follow and share please thank you.
### **Executive Summary**
Bitcoin (BTC/USDT) is currently consolidating in a tight range after a recent pullback, trading at **114,982.75 USDT**. With the price caught between key moving averages and significant support, the market is poised for a decisive breakout. This analysis breaks down the critical technical levels to identify high-probability entry points for both bullish and bearish scenarios, complete with clear exit strategies.
### **Current Market Snapshot (As of Data Provided)**
* **Price:** 114,982.75 USDT
* **24h Change:** -0.88%
* **24h High/Low:** 116,034.53 / 114,560.00
* **Key Resistance:** 116,672.58 | 119,486.21
* **Key Support:** 114,560.00 (24h Low) | 111,684.79
### **Technical Analysis: The Battle of the Averages**
The chart reveals a tense battle between short-term and medium-term momentum, as defined by the Moving Averages (MAs):
* **MA(7): 115,216.17** - The price is trading just below this short-term average, indicating slight bearish pressure in the immediate term.
* **MA(25): 114,317.29** - This is the crucial **primary support level**. The price is holding above it, which is a mildly bullish sign. A decisive break below could trigger a sharper sell-off.
* **MA(99): 117,025.05** - This long-term average sits as a significant **resistance hurdle** overhead. A breakout above this level would be a strong bullish signal.
The convergence of these MAs creates a compression zone, meaning a powerful expansion in price (a volatile move) is highly likely.
$BTC
### **Trading Outlook & Scenarios**
#### **1. Bullish Scenario (Long Entry)**
For the bullish case to be validated, buyers need to reclaim control.
* **Entry Trigger:** A sustained 4-hour candle close **above the MA(7) at 115,216** and preferably **above the 116,672** level. This would signal a break of immediate resistance and open a path toward the MA(99) at **117,025**.
* **Confirmation:** Increasing volume on the upward move and a break above the MA(99) would confirm strength, targeting the next resistance zones at **119,486** and **122,299**.
* **Stop-Loss:** A logical stop-loss would be placed **below the key MA(25) support at 114,317**, for example, at **114,000**. This protects your capital if the support fails.
* **Take-Profit Targets:**
* **Target 1:** 117,025 (MA(99))
* **Target 2:** 119,486
* **Target 3:** 122,299
#### **2. Bearish Scenario (Short Entry)**
If selling pressure intensifies and key support breaks, a deeper correction is on the cards.
* **Entry Trigger:** A sustained 4-hour candle close **below the MA(25) support at 114,317**. This would be a critical breakdown, suggesting a shift in momentum to the downside.
* **Confirmation:** A break below the **24h Low of 114,560** would be the first warning sign. The move would be confirmed by high volume on the breakdown.
* **Stop-Loss:** A stop-loss should be placed just **above the MA(7) and the recent consolidation**, around **115,500**, to keep the risk-reward ratio favorable.
* **Take-Profit Targets:**
* **Target 1:** 111,684 (Next major support)
* **Target 2:** 111,045
### **Risk Management is Key**
Always remember the golden rule: **Never risk more than 1-2% of your trading capital on a single trade.** The crypto market is inherently volatile. Use the stop-loss levels defined above to manage your risk effectively.
### **Conclusion**
Bitcoin is at a critical juncture. The **114,317 - 115,216** range is the key battleground. Traders should wait for a confirmed breakout or breakdown from this zone with volume before committing capital. A move above **116,672** suggests a run toward **117k+**, while a break below **114,317** could see a test of **111.6k** support.
$BTC
**Trade safe and trade smart!**
#Bitcoin #TechnicalAnalysis #Binance #BinanceSquare #altcoins
### **SEO & Publishing Notes for Binance Square:**
* **Headline:** The title is designed to be compelling and keyword-rich ("BTC/USDT", "Next Major Move").
* **Structure:** Uses clear headings, bullet points, and bold text to improve readability on a social feed.
* **Keywords:** Integrates key terms like "BTC/USDT," "technical analysis," "support and resistance," "entry," "stop-loss," "take-profit," "Binance," and "moving averages" naturally throughout the text.
* **Hashtags:** A broad mix of popular and niche hashtags (#Bitcoin, #Trading, #BinanceSquare, #TechnicalAnalysis, #BTCUSDT) to maximize reach and engagement within the crypto community on Binance Square and beyond.
* **Call to Action:** The conclusion encourages engagement ("Trade safe and trade smart!").
* **Visuals:** This text would be posted alongside the provided chart image for maximum impact.
Like follow and share please thank you.
1
200

Article
Article Title: BERA/USDT: Consolidation at Key Level – Is a Breakout Imminent? | Technical Analysis$BERA
### **Executive Summary**
BERA/USDT is trading at a critical juncture. After a significant rally from its Layer 1 launch lows, the price is now consolidating just above key moving averages. This analysis breaks down the current structure, identifies crucial support and resistance levels, and outlines high-probability entry and exit strategies for the next major move.
### **Current Market Snapshot (As of Chart Data)**
* **Price:** `2.625 USDT`
* **24h Change:** `-3.10%`
* **Key Resistance:** `2.654` (Local), `2.798` (24h High)
* **Key Support:** `2.550` (24h Low), `2.383` (MA25)
**Technical Analysis Deep Dive**
#### **1. Trend and Moving Average Analysis**
The Moving Averages are painting a bullish medium-term picture but suggest short-term indecision.
* **MA(7):** `2.624` - The price is trading almost exactly at the 7-period MA, indicating a moment of equilibrium between buyers and sellers.
* **MA(25):** `2.383` - The 25-period MA is significantly below the current price, acting as a strong support zone and confirming the recent upward trend is still intact.
* **MA(99):** `2.198` - The long-term average is far below, confirming the overall trend shift from bearish to bullish.
**Interpretation:** The price is healthy, taking a breather after its climb. The alignment (MA7 > MA25 > MA99) is bullish. A hold above the MA(25) is critical for the uptrend to continue.
#### **2. Key Support and Resistance Levels**
* **Resistance (Sell Zone):** The immediate ceiling is at **`2.654`**. A decisive break and close above this could trigger a move towards the next major resistance at **`2.798`** (the 24h high).
* **Support (Buy Zone):** The immediate floor is the **`2.550`** low. However, a more robust and high-confidence buy zone sits around the **`2.383`** level, which confluence with the MA25. A break below this could see a deeper retracement.
#### **3. Volume and Momentum**
* **24h Volume:** `24.46M USDT` - Solid volume indicates good interest in the asset.
* **Current Vol vs. MA:** The current volume (`238,114`) is significantly lower than its 5-period and 10-period averages. This low volume during consolidation is normal, but we need to see **expanding volume on the next breakout or breakdown** to confirm the move's validity.
$BERA
### **Next Move: Entry & Exit Strategy**
#### **Scenario 1: Bullish Breakout (LONG Entry)**
* **Trigger:** A decisive 4-hour candle close **above `2.654`** with increasing volume.
* **Entry:** Buy on a retest of the `2.654` level as new support, or on a small pullback after the breakout.
* **Stop-Loss:** Place stop-loss below the key support at **`2.383`** (MA25) to protect from a false breakout.
* **Take-Profit Targets:**
* **TP1:** `2.750` (Partial Profit)
* **TP2:** `2.798` (24h High - Major Resistance)
* **TP3:** `3.000+` (Psychological Level)
#### **Scenario 2: Bearish Rejection (SHORT Entry)**
* **Trigger:** A strong 4-hour candle close **below the MA25 support at `2.383`**.
* **Entry:** Sell/short on a retest of the broken `2.383` level as new resistance.
* **Stop-Loss:** Place stop-loss just above the local resistance at **`2.550`**.
* **Take-Profit Targets:**
* **TP1:** `2.200` (Near MA99 support)
* **TP2:** `2.122` (Lower Bollinger Band area from chart)
#### **Scenario 3: Range-Bound Trade**
* **Action:** If the price continues to chop between `2.550` and `2.654`, agile traders can **buy near support and sell near resistance**. Wait for the eventual breakout for a larger position.
### **Conclusion**
BERA is at a make-or-break level. The bullish structure remains intact as long as the **MA(25) at 2.383** holds. Traders should wait for a confirmed breakout with volume in either direction before committing significant capital. The higher probability trade leans bullish due to the positive moving average structure, but always respect the market's direction.
$BERA
{spot}(BERAUSDT)
**Trade safe, and always manage your risk!**
Like follow and share please thank you.
#BERA #Altcoin #BinanceSquare #Write2Earn #TradingSignals
Article Title: BERA/USDT: Consolidation at Key Level – Is a Breakout Imminent? | Technical Analysis
$BERA
### **Executive Summary**
BERA/USDT is trading at a critical juncture. After a significant rally from its Layer 1 launch lows, the price is now consolidating just above key moving averages. This analysis breaks down the current structure, identifies crucial support and resistance levels, and outlines high-probability entry and exit strategies for the next major move.
### **Current Market Snapshot (As of Chart Data)**
* **Price:** `2.625 USDT`
* **24h Change:** `-3.10%`
* **Key Resistance:** `2.654` (Local), `2.798` (24h High)
* **Key Support:** `2.550` (24h Low), `2.383` (MA25)
**Technical Analysis Deep Dive**
#### **1. Trend and Moving Average Analysis**
The Moving Averages are painting a bullish medium-term picture but suggest short-term indecision.
* **MA(7):** `2.624` - The price is trading almost exactly at the 7-period MA, indicating a moment of equilibrium between buyers and sellers.
* **MA(25):** `2.383` - The 25-period MA is significantly below the current price, acting as a strong support zone and confirming the recent upward trend is still intact.
* **MA(99):** `2.198` - The long-term average is far below, confirming the overall trend shift from bearish to bullish.
**Interpretation:** The price is healthy, taking a breather after its climb. The alignment (MA7 > MA25 > MA99) is bullish. A hold above the MA(25) is critical for the uptrend to continue.
#### **2. Key Support and Resistance Levels**
* **Resistance (Sell Zone):** The immediate ceiling is at **`2.654`**. A decisive break and close above this could trigger a move towards the next major resistance at **`2.798`** (the 24h high).
* **Support (Buy Zone):** The immediate floor is the **`2.550`** low. However, a more robust and high-confidence buy zone sits around the **`2.383`** level, which confluence with the MA25. A break below this could see a deeper retracement.
#### **3. Volume and Momentum**
* **24h Volume:** `24.46M USDT` - Solid volume indicates good interest in the asset.
* **Current Vol vs. MA:** The current volume (`238,114`) is significantly lower than its 5-period and 10-period averages. This low volume during consolidation is normal, but we need to see **expanding volume on the next breakout or breakdown** to confirm the move's validity.
$BERA
### **Next Move: Entry & Exit Strategy**
#### **Scenario 1: Bullish Breakout (LONG Entry)**
* **Trigger:** A decisive 4-hour candle close **above `2.654`** with increasing volume.
* **Entry:** Buy on a retest of the `2.654` level as new support, or on a small pullback after the breakout.
* **Stop-Loss:** Place stop-loss below the key support at **`2.383`** (MA25) to protect from a false breakout.
* **Take-Profit Targets:**
* **TP1:** `2.750` (Partial Profit)
* **TP2:** `2.798` (24h High - Major Resistance)
* **TP3:** `3.000+` (Psychological Level)
#### **Scenario 2: Bearish Rejection (SHORT Entry)**
* **Trigger:** A strong 4-hour candle close **below the MA25 support at `2.383`**.
* **Entry:** Sell/short on a retest of the broken `2.383` level as new resistance.
* **Stop-Loss:** Place stop-loss just above the local resistance at **`2.550`**.
* **Take-Profit Targets:**
* **TP1:** `2.200` (Near MA99 support)
* **TP2:** `2.122` (Lower Bollinger Band area from chart)
#### **Scenario 3: Range-Bound Trade**
* **Action:** If the price continues to chop between `2.550` and `2.654`, agile traders can **buy near support and sell near resistance**. Wait for the eventual breakout for a larger position.
### **Conclusion**
BERA is at a make-or-break level. The bullish structure remains intact as long as the **MA(25) at 2.383** holds. Traders should wait for a confirmed breakout with volume in either direction before committing significant capital. The higher probability trade leans bullish due to the positive moving average structure, but always respect the market's direction.
$BERA
**Trade safe, and always manage your risk!**
Like follow and share please thank you.
#BERA #Altcoin #BinanceSquare #Write2Earn #TradingSignals
### **Executive Summary**
BERA/USDT is trading at a critical juncture. After a significant rally from its Layer 1 launch lows, the price is now consolidating just above key moving averages. This analysis breaks down the current structure, identifies crucial support and resistance levels, and outlines high-probability entry and exit strategies for the next major move.
### **Current Market Snapshot (As of Chart Data)**
* **Price:** `2.625 USDT`
* **24h Change:** `-3.10%`
* **Key Resistance:** `2.654` (Local), `2.798` (24h High)
* **Key Support:** `2.550` (24h Low), `2.383` (MA25)
**Technical Analysis Deep Dive**
#### **1. Trend and Moving Average Analysis**
The Moving Averages are painting a bullish medium-term picture but suggest short-term indecision.
* **MA(7):** `2.624` - The price is trading almost exactly at the 7-period MA, indicating a moment of equilibrium between buyers and sellers.
* **MA(25):** `2.383` - The 25-period MA is significantly below the current price, acting as a strong support zone and confirming the recent upward trend is still intact.
* **MA(99):** `2.198` - The long-term average is far below, confirming the overall trend shift from bearish to bullish.
**Interpretation:** The price is healthy, taking a breather after its climb. The alignment (MA7 > MA25 > MA99) is bullish. A hold above the MA(25) is critical for the uptrend to continue.
#### **2. Key Support and Resistance Levels**
* **Resistance (Sell Zone):** The immediate ceiling is at **`2.654`**. A decisive break and close above this could trigger a move towards the next major resistance at **`2.798`** (the 24h high).
* **Support (Buy Zone):** The immediate floor is the **`2.550`** low. However, a more robust and high-confidence buy zone sits around the **`2.383`** level, which confluence with the MA25. A break below this could see a deeper retracement.
#### **3. Volume and Momentum**
* **24h Volume:** `24.46M USDT` - Solid volume indicates good interest in the asset.
* **Current Vol vs. MA:** The current volume (`238,114`) is significantly lower than its 5-period and 10-period averages. This low volume during consolidation is normal, but we need to see **expanding volume on the next breakout or breakdown** to confirm the move's validity.
$BERA
### **Next Move: Entry & Exit Strategy**
#### **Scenario 1: Bullish Breakout (LONG Entry)**
* **Trigger:** A decisive 4-hour candle close **above `2.654`** with increasing volume.
* **Entry:** Buy on a retest of the `2.654` level as new support, or on a small pullback after the breakout.
* **Stop-Loss:** Place stop-loss below the key support at **`2.383`** (MA25) to protect from a false breakout.
* **Take-Profit Targets:**
* **TP1:** `2.750` (Partial Profit)
* **TP2:** `2.798` (24h High - Major Resistance)
* **TP3:** `3.000+` (Psychological Level)
#### **Scenario 2: Bearish Rejection (SHORT Entry)**
* **Trigger:** A strong 4-hour candle close **below the MA25 support at `2.383`**.
* **Entry:** Sell/short on a retest of the broken `2.383` level as new resistance.
* **Stop-Loss:** Place stop-loss just above the local resistance at **`2.550`**.
* **Take-Profit Targets:**
* **TP1:** `2.200` (Near MA99 support)
* **TP2:** `2.122` (Lower Bollinger Band area from chart)
#### **Scenario 3: Range-Bound Trade**
* **Action:** If the price continues to chop between `2.550` and `2.654`, agile traders can **buy near support and sell near resistance**. Wait for the eventual breakout for a larger position.
### **Conclusion**
BERA is at a make-or-break level. The bullish structure remains intact as long as the **MA(25) at 2.383** holds. Traders should wait for a confirmed breakout with volume in either direction before committing significant capital. The higher probability trade leans bullish due to the positive moving average structure, but always respect the market's direction.
$BERA
**Trade safe, and always manage your risk!**
Like follow and share please thank you.
#BERA #Altcoin #BinanceSquare #Write2Earn #TradingSignals
2
984
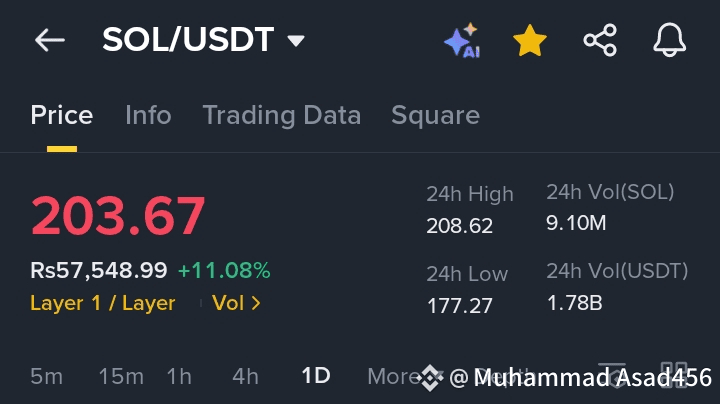
Article
SOL/USDT Analysis: Key Levels, Entry Strategy, and Profit-Taking Targets 🚀$SOL
{spot}(SOLUSDT)
The SOL/USDT pair is showing strong bullish momentum, trading at **203.67 USDT**, up **+11.08%** in the last 24 hours. With a 24-hour high of **208.62** and solid volume backing the move, SOL continues to outperform in the Layer 1 segment. Here’s a detailed analysis for your next trade:
### 📈 Technical Overview:
- **Current Price:** 203.67 USDT
- **24h High:** 208.62
- **24h Low:** 177.27
- **24h Volume (USDT):** 1.78B
- **Moving Averages:**
- MA(7): 188.96 ✅ Above
- MA(25): 180.33 ✅ Above
- MA(99): 166.23 ✅ Strong Uptrend
$SOL
### 🔍 Indicators:
- **MACD:** Bullish crossover with values at 95.26 (MACD) and 89.53 (Signal), indicating continued upward momentum.
- **Volume:** Current VOL is 3.35M, slightly below the MA(5) of 3.92M, but still healthy.
- **Support/Resistance:** Immediate resistance at **208.62** (24h high). Strong support near **188–190** (MA7 zone).
$SOL
### 🎯 Trading Plan:
**Entry Zone:**
- Ideal buy zone: **195–200 USDT** (dip toward MA7 support)
- Aggressive entry: Break and close above **209** with volume
**Take-Profit Targets:**
- TP1: **215 USDT**
- TP2: **225 USDT**
- TP3: **235 USDT** (if momentum holds)
**Stop Loss:**
- **188 USDT** (below MA7 and key support)
---
### ⚠️ Risk Note:
Always use proper risk management. The market is volatile—never invest more than you can afford to lose.
---
### ✅ Conclusion:
SOL remains in a strong uptrend with clear higher highs and higher lows. Use pullbacks to accumulate and watch for a break above 209 for continuation.
Let me know your thoughts in the comments! 👇
Follow like and share please
#SOL #TechnicalAnalysis #BinanceSquare #TradingSignals #Write2Earn
.
SOL/USDT Analysis: Key Levels, Entry Strategy, and Profit-Taking Targets 🚀
$SOL
The SOL/USDT pair is showing strong bullish momentum, trading at **203.67 USDT**, up **+11.08%** in the last 24 hours. With a 24-hour high of **208.62** and solid volume backing the move, SOL continues to outperform in the Layer 1 segment. Here’s a detailed analysis for your next trade:
### 📈 Technical Overview:
- **Current Price:** 203.67 USDT
- **24h High:** 208.62
- **24h Low:** 177.27
- **24h Volume (USDT):** 1.78B
- **Moving Averages:**
- MA(7): 188.96 ✅ Above
- MA(25): 180.33 ✅ Above
- MA(99): 166.23 ✅ Strong Uptrend
$SOL
### 🔍 Indicators:
- **MACD:** Bullish crossover with values at 95.26 (MACD) and 89.53 (Signal), indicating continued upward momentum.
- **Volume:** Current VOL is 3.35M, slightly below the MA(5) of 3.92M, but still healthy.
- **Support/Resistance:** Immediate resistance at **208.62** (24h high). Strong support near **188–190** (MA7 zone).
$SOL
### 🎯 Trading Plan:
**Entry Zone:**
- Ideal buy zone: **195–200 USDT** (dip toward MA7 support)
- Aggressive entry: Break and close above **209** with volume
**Take-Profit Targets:**
- TP1: **215 USDT**
- TP2: **225 USDT**
- TP3: **235 USDT** (if momentum holds)
**Stop Loss:**
- **188 USDT** (below MA7 and key support)
---
### ⚠️ Risk Note:
Always use proper risk management. The market is volatile—never invest more than you can afford to lose.
---
### ✅ Conclusion:
SOL remains in a strong uptrend with clear higher highs and higher lows. Use pullbacks to accumulate and watch for a break above 209 for continuation.
Let me know your thoughts in the comments! 👇
Follow like and share please
#SOL #TechnicalAnalysis #BinanceSquare #TradingSignals #Write2Earn
.
The SOL/USDT pair is showing strong bullish momentum, trading at **203.67 USDT**, up **+11.08%** in the last 24 hours. With a 24-hour high of **208.62** and solid volume backing the move, SOL continues to outperform in the Layer 1 segment. Here’s a detailed analysis for your next trade:
### 📈 Technical Overview:
- **Current Price:** 203.67 USDT
- **24h High:** 208.62
- **24h Low:** 177.27
- **24h Volume (USDT):** 1.78B
- **Moving Averages:**
- MA(7): 188.96 ✅ Above
- MA(25): 180.33 ✅ Above
- MA(99): 166.23 ✅ Strong Uptrend
$SOL
### 🔍 Indicators:
- **MACD:** Bullish crossover with values at 95.26 (MACD) and 89.53 (Signal), indicating continued upward momentum.
- **Volume:** Current VOL is 3.35M, slightly below the MA(5) of 3.92M, but still healthy.
- **Support/Resistance:** Immediate resistance at **208.62** (24h high). Strong support near **188–190** (MA7 zone).
$SOL
### 🎯 Trading Plan:
**Entry Zone:**
- Ideal buy zone: **195–200 USDT** (dip toward MA7 support)
- Aggressive entry: Break and close above **209** with volume
**Take-Profit Targets:**
- TP1: **215 USDT**
- TP2: **225 USDT**
- TP3: **235 USDT** (if momentum holds)
**Stop Loss:**
- **188 USDT** (below MA7 and key support)
---
### ⚠️ Risk Note:
Always use proper risk management. The market is volatile—never invest more than you can afford to lose.
---
### ✅ Conclusion:
SOL remains in a strong uptrend with clear higher highs and higher lows. Use pullbacks to accumulate and watch for a break above 209 for continuation.
Let me know your thoughts in the comments! 👇
Follow like and share please
#SOL #TechnicalAnalysis #BinanceSquare #TradingSignals #Write2Earn
.
3
1.4k

Article
🚀 LINK/USDT Analysis: Strong Bullish Momentum Building$LINK
Chainlink (**LINK/USDT**) has shown impressive strength, currently trading at **\$27.17**, marking a **+9.12% daily surge**. Over the past 7 days, LINK has gained **21.46%**, signaling strong institutional and retail interest.
### 🔹 Technical Overview
* **Moving Averages (MA):**
* MA(7) at **25.35** and MA(25) at **25.13** are both below the current price, confirming a short-term bullish trend.
* MA(99) at **22.60** is acting as a long-term support zone.
* **Volume Spike:** Increasing trading volume indicates strong buyer participation.
* **Key Support:** \$25.00 – \$25.30 zone.
* **Key Resistance:** \$27.80 – \$28.50 zone.
$LINK
### 📈 Next Move Strategy
* **Entry Zone:** Traders may look for fresh entries between **\$25.50 – \$26.20** on any healthy pullback.
* **Target 1:** \$28.50
* **Target 2:** \$30.00 (psychological resistance & next breakout level)
* **Stop-Loss:** Below **\$24.50** to minimize downside risk.
🔮 Market Sentiment
With LINK showing **149% yearly growth** and holding above crucial moving averages, the overall sentiment remains bullish. A confirmed breakout above **\$28.50** could trigger a rally toward **\$32 – \$35** in the mid-term.
## 📊 Conclusion
Chainlink is currently in a strong uptrend with solid fundamentals and technical backing. Short-term traders can look for pullbacks to re-enter, while long-term holders should watch the **\$28.50 resistance** closely.
LINK price analysis, LINK/USDT trading strategy, Chainlink crypto forecast, best crypto entry and exit levels, LINK Binance Square update.
#LINK #cryptotrading #Altcoins #BinanceSquare #BullRun2025
$LINK
{spot}(LINKUSDT)
🚀 LINK/USDT Analysis: Strong Bullish Momentum Building
$LINK
Chainlink (**LINK/USDT**) has shown impressive strength, currently trading at **\$27.17**, marking a **+9.12% daily surge**. Over the past 7 days, LINK has gained **21.46%**, signaling strong institutional and retail interest.
### 🔹 Technical Overview
* **Moving Averages (MA):**
* MA(7) at **25.35** and MA(25) at **25.13** are both below the current price, confirming a short-term bullish trend.
* MA(99) at **22.60** is acting as a long-term support zone.
* **Volume Spike:** Increasing trading volume indicates strong buyer participation.
* **Key Support:** \$25.00 – \$25.30 zone.
* **Key Resistance:** \$27.80 – \$28.50 zone.
$LINK
### 📈 Next Move Strategy
* **Entry Zone:** Traders may look for fresh entries between **\$25.50 – \$26.20** on any healthy pullback.
* **Target 1:** \$28.50
* **Target 2:** \$30.00 (psychological resistance & next breakout level)
* **Stop-Loss:** Below **\$24.50** to minimize downside risk.
🔮 Market Sentiment
With LINK showing **149% yearly growth** and holding above crucial moving averages, the overall sentiment remains bullish. A confirmed breakout above **\$28.50** could trigger a rally toward **\$32 – \$35** in the mid-term.
## 📊 Conclusion
Chainlink is currently in a strong uptrend with solid fundamentals and technical backing. Short-term traders can look for pullbacks to re-enter, while long-term holders should watch the **\$28.50 resistance** closely.
LINK price analysis, LINK/USDT trading strategy, Chainlink crypto forecast, best crypto entry and exit levels, LINK Binance Square update.
#LINK #cryptotrading #Altcoins #BinanceSquare #BullRun2025
$LINK
Chainlink (**LINK/USDT**) has shown impressive strength, currently trading at **\$27.17**, marking a **+9.12% daily surge**. Over the past 7 days, LINK has gained **21.46%**, signaling strong institutional and retail interest.
### 🔹 Technical Overview
* **Moving Averages (MA):**
* MA(7) at **25.35** and MA(25) at **25.13** are both below the current price, confirming a short-term bullish trend.
* MA(99) at **22.60** is acting as a long-term support zone.
* **Volume Spike:** Increasing trading volume indicates strong buyer participation.
* **Key Support:** \$25.00 – \$25.30 zone.
* **Key Resistance:** \$27.80 – \$28.50 zone.
$LINK
### 📈 Next Move Strategy
* **Entry Zone:** Traders may look for fresh entries between **\$25.50 – \$26.20** on any healthy pullback.
* **Target 1:** \$28.50
* **Target 2:** \$30.00 (psychological resistance & next breakout level)
* **Stop-Loss:** Below **\$24.50** to minimize downside risk.
🔮 Market Sentiment
With LINK showing **149% yearly growth** and holding above crucial moving averages, the overall sentiment remains bullish. A confirmed breakout above **\$28.50** could trigger a rally toward **\$32 – \$35** in the mid-term.
## 📊 Conclusion
Chainlink is currently in a strong uptrend with solid fundamentals and technical backing. Short-term traders can look for pullbacks to re-enter, while long-term holders should watch the **\$28.50 resistance** closely.
LINK price analysis, LINK/USDT trading strategy, Chainlink crypto forecast, best crypto entry and exit levels, LINK Binance Square update.
#LINK #cryptotrading #Altcoins #BinanceSquare #BullRun2025
$LINK
2
1.1k
Log in to explore more content
Join global crypto users on Binance Square
⚡️ Get latest and useful information about crypto.
💬 Trusted by the world’s largest crypto exchange.
👍 Discover real insights from verified creators.
Email / Phone number
Trending Topics
HuangExitNvidiaStrategyInFocus
38,150 views
649 Discussing
STOCKS | Nvidia’s Jensen Huang Resigns, Colette Kress Named as Interim CEO
Binance News
·16 Likes
·19.9k views
AnthropicRejectsIPODelayValuationinQuestion
611,995 views
4,982 Discussing
BitMineReports$6.3BNetLossForFiscal2026
4,504 views
84 Discussing