
MAYA_
40.7k Posts

MAYA_
 Square Verified+
Alhamdulillah always and forever.
Frequent Trader
3.9 Years
1.2K+ Following
42.7K+ Followers
199.0K+ Liked
Posts
All
Quotes
Videos
Live
The real question here is not how much will Iran-US tension increase.....
But how much has the market priced in this news?
US strike on Larak Island, then Iran's missile attack on a US base in Jordan..… and now Trump is directly saying, “We’re going to hit them hard. There will be a response.”
This place feels a little uncomfortable.
Because when geopolitical tension increases, the first reaction is usually the same - oil up, risk assets under pressure, and traders suddenly start looking for the safe side. Now Oil has already risen by more than 3% and gone above $90. 📈 Now I'm thinking..... If tension increases further from here, fears about inflation may come to the fore again. And inflation means a new calculation of rate expectations.
What will Crypto do then?
That's what I want to see.
Because it would not be right to assume that a major breakdown will start when BTC or other risk assets go down at the first blow. Sometimes headlines like this come out, everyone panics, liquidity is swept..... then the market turns in the opposite direction again. But if Oil goes higher and the Middle East situation really gets worse, then it won't just be a news reaction.
That's where the real risk lies.
So now I'm looking at every bounce on the chart with a little skepticism..... because sometimes the market is scared, and sometimes the fear starts with a really big move. ⚠️
Maybe the price will tell first which one will happen this time🤔🤔🤔
$CL $BTC
But how much has the market priced in this news?
US strike on Larak Island, then Iran's missile attack on a US base in Jordan..… and now Trump is directly saying, “We’re going to hit them hard. There will be a response.”
This place feels a little uncomfortable.
Because when geopolitical tension increases, the first reaction is usually the same - oil up, risk assets under pressure, and traders suddenly start looking for the safe side. Now Oil has already risen by more than 3% and gone above $90. 📈 Now I'm thinking..... If tension increases further from here, fears about inflation may come to the fore again. And inflation means a new calculation of rate expectations.
What will Crypto do then?
That's what I want to see.
Because it would not be right to assume that a major breakdown will start when BTC or other risk assets go down at the first blow. Sometimes headlines like this come out, everyone panics, liquidity is swept..... then the market turns in the opposite direction again. But if Oil goes higher and the Middle East situation really gets worse, then it won't just be a news reaction.
That's where the real risk lies.
So now I'm looking at every bounce on the chart with a little skepticism..... because sometimes the market is scared, and sometimes the fear starts with a really big move. ⚠️
Maybe the price will tell first which one will happen this time🤔🤔🤔
$CL $BTC

Now I have a question in my mind about $ZKP :
After getting rejected from the same resistance so many times, is anything really going to change this time ?
ZKP has been moving in a falling structure since late June. But one thing has been noticeable the whole time - the green support trendline has held every dip so far. That is, even though sellers have put pressure on it, buyers have not completely moved away. And now the price is again near the 0.0475 – 0.0495 resistance zone, currently around 0.04853. This is the real test. Because the price has rejected this ceiling 4–5 times in the last three months. So I don't see any reason to assume bullish just by touching the resistance. Rather, if the same thing happens again after so many rejections, then the falling structure will gain importance again. But on the other hand, if the 4H candle can close above 0.0500, then the picture will be quite different. Confirmation of the months-long resistance finally breaking will be found. In that case, there may be an opportunity to move towards the 0.0550, then 0.0600+ region. The interesting part for me is - on the one hand, the resistance that has been tested many times, on the other hand, the green trendline that has been defended repeatedly. The two forces have come to the same place. So, it is more logical for me to see confirmation than to rush here. Whether the 4H close above 0.0500 or not will probably write the next story.
If there is a breakout, the setup will be interesting. Otherwise, rejection again..... and then it might be better to wait and trade. Let's see.... 🤔
After getting rejected from the same resistance so many times, is anything really going to change this time ?
ZKP has been moving in a falling structure since late June. But one thing has been noticeable the whole time - the green support trendline has held every dip so far. That is, even though sellers have put pressure on it, buyers have not completely moved away. And now the price is again near the 0.0475 – 0.0495 resistance zone, currently around 0.04853. This is the real test. Because the price has rejected this ceiling 4–5 times in the last three months. So I don't see any reason to assume bullish just by touching the resistance. Rather, if the same thing happens again after so many rejections, then the falling structure will gain importance again. But on the other hand, if the 4H candle can close above 0.0500, then the picture will be quite different. Confirmation of the months-long resistance finally breaking will be found. In that case, there may be an opportunity to move towards the 0.0550, then 0.0600+ region. The interesting part for me is - on the one hand, the resistance that has been tested many times, on the other hand, the green trendline that has been defended repeatedly. The two forces have come to the same place. So, it is more logical for me to see confirmation than to rush here. Whether the 4H close above 0.0500 or not will probably write the next story.
If there is a breakout, the setup will be interesting. Otherwise, rejection again..... and then it might be better to wait and trade. Let's see.... 🤔
#bitcoin $BTC
Hmmm.... I mean -
Sometimes it seems like the hardest part of the market isn’t actually finding an entry: it’s waiting.
$BTC has rallied so quickly that many are now wondering if they’ve missed the train. But looking at the chart, I have a different question: is the fatigue that’s been showing after a big rally just normal breathing, or is there something deeper going on?
History has it that after a strong breakout, the market often comes back to test old demand areas. This is nothing new. In fact, this retest often determines whether the breakout was real or just excitement.
The $70K–$74K area that we’re talking about now isn’t just a price level. Interestingly, this area coincides with the summer accumulation phase of 2024. People weren’t too optimistic back then, but they weren’t completely disappointed either. A lot of big positions were probably created there. But there’s one thing I’m not entirely sure about yet. If this support holds, the pullback might just reset the market structure. Buyers could come back and the trend could continue. But if this area breaks with momentum, then the story will change a bit. Then the price might go towards the old range high that we recently broke out of. In fact, the market sometimes teaches us more about reaction than direction. Where the price is going is important. But how it behaves at a certain level - that is probably more important.
So for me, this pullback is not something to be afraid of. Rather, it might be the moment where the market itself will tell..... what the next chapter might be. Time will tell 👍
Hmmm.... I mean -
Sometimes it seems like the hardest part of the market isn’t actually finding an entry: it’s waiting.
$BTC has rallied so quickly that many are now wondering if they’ve missed the train. But looking at the chart, I have a different question: is the fatigue that’s been showing after a big rally just normal breathing, or is there something deeper going on?
History has it that after a strong breakout, the market often comes back to test old demand areas. This is nothing new. In fact, this retest often determines whether the breakout was real or just excitement.
The $70K–$74K area that we’re talking about now isn’t just a price level. Interestingly, this area coincides with the summer accumulation phase of 2024. People weren’t too optimistic back then, but they weren’t completely disappointed either. A lot of big positions were probably created there. But there’s one thing I’m not entirely sure about yet. If this support holds, the pullback might just reset the market structure. Buyers could come back and the trend could continue. But if this area breaks with momentum, then the story will change a bit. Then the price might go towards the old range high that we recently broke out of. In fact, the market sometimes teaches us more about reaction than direction. Where the price is going is important. But how it behaves at a certain level - that is probably more important.
So for me, this pullback is not something to be afraid of. Rather, it might be the moment where the market itself will tell..... what the next chapter might be. Time will tell 👍


BTR pumped.🚀
TAC pumped.🚀
ONG pumped.🚀
Seeing these moves makes me look at FOGO a little differently.
I’m not saying the same thing has to happen here. That would be too easy. But when several names start moving one after another, I usually pay more attention to what hasn’t moved yet.
FOGO is still sitting there.
Maybe it’s early. Maybe the market simply hasn’t rotated into it yet. Or maybe I’m reading too much into the sequence. Still, this is the kind of setup where I’d rather watch before the move than after it.
$BTR
✅
$TAC
✅
$ONG
✅
$FOGO ⏳
I’m long now.
Let’s see if the rotation continues.
TAC pumped.🚀
ONG pumped.🚀
Seeing these moves makes me look at FOGO a little differently.
I’m not saying the same thing has to happen here. That would be too easy. But when several names start moving one after another, I usually pay more attention to what hasn’t moved yet.
FOGO is still sitting there.
Maybe it’s early. Maybe the market simply hasn’t rotated into it yet. Or maybe I’m reading too much into the sequence. Still, this is the kind of setup where I’d rather watch before the move than after it.
$BTR
✅
$TAC
✅
$ONG
✅
$FOGO ⏳
I’m long now.
Let’s see if the rotation continues.
Verified
#SECSendsCryptoCustodyRuleToWhiteHouse
Something seems strange here.
Bank of America, Wells Fargo, Santander and more than a dozen other major banks are moving forward with stablecoins - the news is bullish, of course. But looking at the chart, I pause for a moment. Because the market often prices such news in advance. Then when everyone is looking in the same direction, where does the liquidity go? If the price is now stuck around the important Fibonacci level after a bounce, then this is where you have to be a little careful. Will it break out and go down again? Or is the structure really changing this time? There is a bit of deja vu. Good news comes, sentiment heats up, traders chase.... and then suddenly the move becomes a trap. So rather than getting too excited right now, I am watching how the reaction goes. Can the Fibonacci level be reclaimed cleanly, or will selling pressure come from here again. Because the news can be bullish, the narrative can be bullish, but in the end the chart tells us what the market really believes.
Maybe something really big is starting this time.
Or maybe the market is just trying to make us believe that.
Something seems strange here.
Bank of America, Wells Fargo, Santander and more than a dozen other major banks are moving forward with stablecoins - the news is bullish, of course. But looking at the chart, I pause for a moment. Because the market often prices such news in advance. Then when everyone is looking in the same direction, where does the liquidity go? If the price is now stuck around the important Fibonacci level after a bounce, then this is where you have to be a little careful. Will it break out and go down again? Or is the structure really changing this time? There is a bit of deja vu. Good news comes, sentiment heats up, traders chase.... and then suddenly the move becomes a trap. So rather than getting too excited right now, I am watching how the reaction goes. Can the Fibonacci level be reclaimed cleanly, or will selling pressure come from here again. Because the news can be bullish, the narrative can be bullish, but in the end the chart tells us what the market really believes.
Maybe something really big is starting this time.
Or maybe the market is just trying to make us believe that.
#bitcoin
Hmm..... One thing to note about Strategy’s Bitcoin position. Michael Saylor’s Strategy Inc. is back in profit with Bitcoin - it sounds easy, but the numbers are even more interesting.
The company now holds over 840,000 BTC. With such large holdings, even a small change in the price of Bitcoin can have a billion-dollar impact on their balance sheet. A few days ago, when BTC was down, their Bitcoin position temporarily went into unrealized loss. But that wasn’t a real cash loss, because they didn’t sell Bitcoin. The value of the account went down because the price was down. Now, with BTC back above $77,000, the situation has reversed. Their holdings are back in profit. But one thing to be clear here - this profit hasn’t reached $4 billion yet. It’s estimated to be somewhere around $1.4 to $1.6 billion.
What’s most interesting to me is how much market movement directly affects the balance sheet for such a large Bitcoin holder like Strategy.
If Bitcoin goes up further, profits will increase rapidly, but if there is a major correction, a large portion of those profits can easily be wiped out.
So just looking at “how much profit” doesn’t tell the whole story. The size of their Bitcoin exposure is what matters.
$BTC
Hmm..... One thing to note about Strategy’s Bitcoin position. Michael Saylor’s Strategy Inc. is back in profit with Bitcoin - it sounds easy, but the numbers are even more interesting.
The company now holds over 840,000 BTC. With such large holdings, even a small change in the price of Bitcoin can have a billion-dollar impact on their balance sheet. A few days ago, when BTC was down, their Bitcoin position temporarily went into unrealized loss. But that wasn’t a real cash loss, because they didn’t sell Bitcoin. The value of the account went down because the price was down. Now, with BTC back above $77,000, the situation has reversed. Their holdings are back in profit. But one thing to be clear here - this profit hasn’t reached $4 billion yet. It’s estimated to be somewhere around $1.4 to $1.6 billion.
What’s most interesting to me is how much market movement directly affects the balance sheet for such a large Bitcoin holder like Strategy.
If Bitcoin goes up further, profits will increase rapidly, but if there is a major correction, a large portion of those profits can easily be wiped out.
So just looking at “how much profit” doesn’t tell the whole story. The size of their Bitcoin exposure is what matters.
$BTC

#BitcoinRises23.6%Weekly
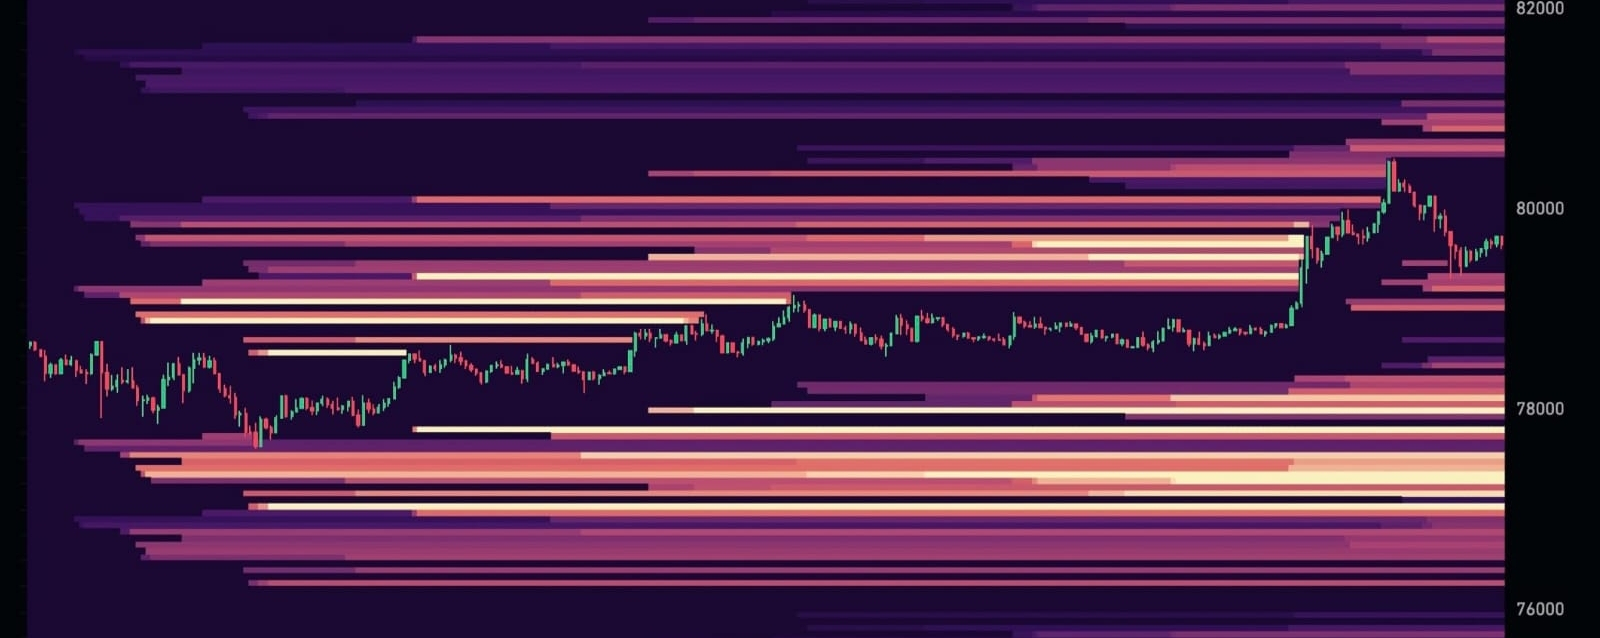
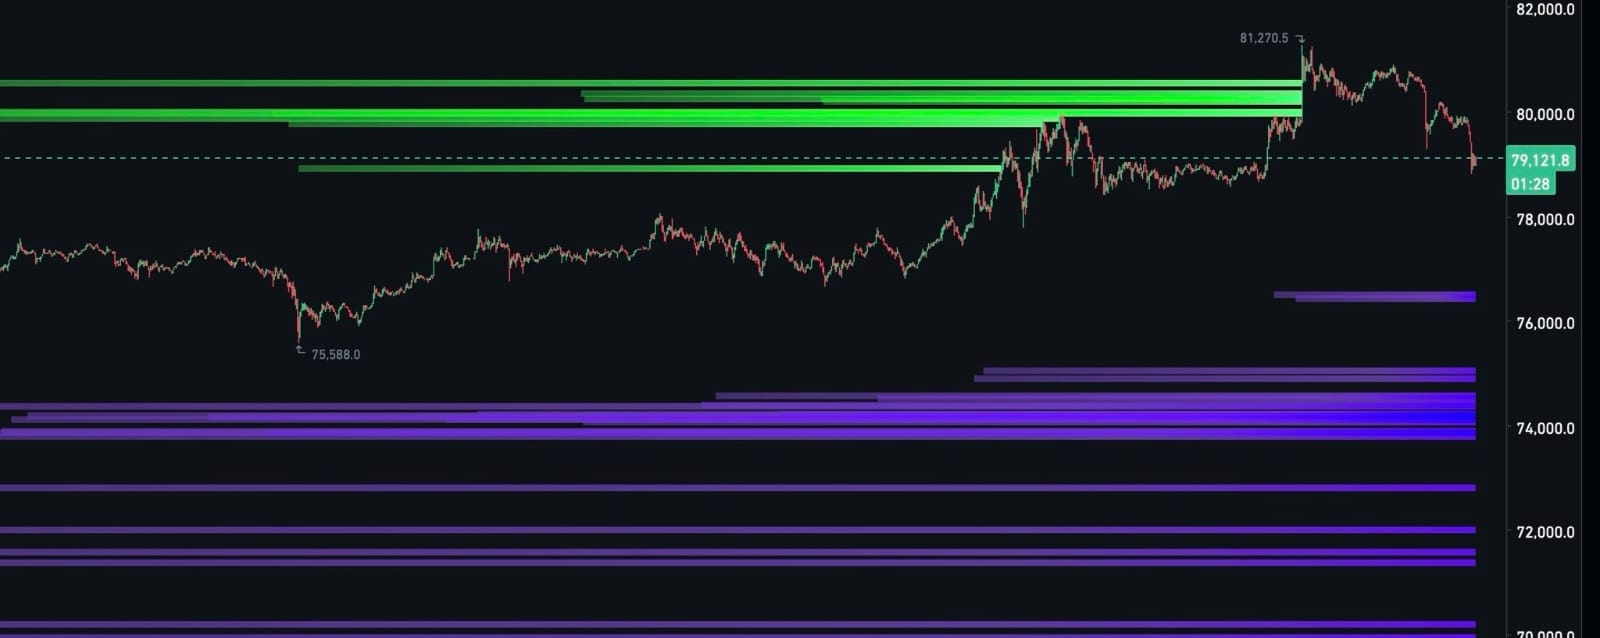
BTC is now 80K–82K: The real test is here
BTC is back near 80K. From the outside, it may seem like a strong move. But in my eyes, the most important area right now is this 80K–82K zone.
Because this same area acted as major resistance once in February and again in May. Both times, the price bounced back quite strongly from here. This is the third time BTC has reached this area. And this is where things get a little interesting. The third test usually shows how strong the previous sellers are. If the bulls can really keep up the pressure this time, a clear daily close above 82.5K could change a lot. Then there could be room for a move to 85K, then 88K. But I don’t want to assume bullishness just because it hits 80K. It’s more important for me to see the candle close than to chase it below resistance.
If there is another rejection from here, it would not be unusual to see a pullback towards 76K and 74K.
So the main question for me now is not where BTC is, but whether it can close daily above 82.5K.
One candle might change the whole picture. Let's see.. 👍
$BTC
BTC is now 80K–82K: The real test is here
BTC is back near 80K. From the outside, it may seem like a strong move. But in my eyes, the most important area right now is this 80K–82K zone.
Because this same area acted as major resistance once in February and again in May. Both times, the price bounced back quite strongly from here. This is the third time BTC has reached this area. And this is where things get a little interesting. The third test usually shows how strong the previous sellers are. If the bulls can really keep up the pressure this time, a clear daily close above 82.5K could change a lot. Then there could be room for a move to 85K, then 88K. But I don’t want to assume bullishness just because it hits 80K. It’s more important for me to see the candle close than to chase it below resistance.
If there is another rejection from here, it would not be unusual to see a pullback towards 76K and 74K.
So the main question for me now is not where BTC is, but whether it can close daily above 82.5K.
One candle might change the whole picture. Let's see.. 👍
$BTC
Log in to explore more content