

Jackson Liam
20k Posts

Jackson Liam
 Square Verified+
Report
Block User
Blockchain Storyteller • Exposing hidden gems • https://x.com/JACKSON_LIAM99
Open Trade
Occasional Trader
2 Years
78 Following
43.4K+ Followers
54.2K+ Liked
Posts
Portfolio
All
Quotes
Videos
Live
·
--
Bullish
🚨 BNB Chain is about to make a serious move.
CZ has confirmed plans for a brand-new high-speed Layer 1 that will run alongside BNB Smart Chain — not replace it.
And here’s the interesting part: there won’t be a new token.
BNB stays at the center.
The new EVM-compatible chain is designed for speed, with a target of 200ms blocks and around 20ms transaction pre-confirmations. That could make it especially useful for high-frequency trading, real-time payments, AI agents and other applications where every millisecond matters.
The network is also planned to connect with BNB Smart Chain through a native bridge, while BNB continues to handle gas, staking and governance.
CZ summed up the idea in one simple line:
“Multiple chains, one coins.”
The tech roadmap goes even further, with plans for:
⚡ Native account abstraction
⚡ Ultra-fast transaction pre-confirmations
⚡ Multi-lane reserved capacity
⚡ Onchain shielded privacy pools
⚡ Sub-second finality
⚡ EVM compatibility
An internal multi-validator devnet is already running, although the project is still under development and subject to changes. The public testnet is targeted for late 2026, with the mainnet planned for early 2027.
This is bigger than simply launching another chain.
BNB Chain is basically building a faster lane for applications that need near-instant execution — while keeping BNB as the common asset across the ecosystem.
Multiple chains. One BNB. One ecosystem.
Now the real question is: how much of this speed can BNB Chain actually deliver once it hits mainnet? 👀
@CZ
🚨 BNB Chain is about to make a serious move.
CZ has confirmed plans for a brand-new high-speed Layer 1 that will run alongside BNB Smart Chain — not replace it.
And here’s the interesting part: there won’t be a new token.
BNB stays at the center.
The new EVM-compatible chain is designed for speed, with a target of 200ms blocks and around 20ms transaction pre-confirmations. That could make it especially useful for high-frequency trading, real-time payments, AI agents and other applications where every millisecond matters.
The network is also planned to connect with BNB Smart Chain through a native bridge, while BNB continues to handle gas, staking and governance.
CZ summed up the idea in one simple line:
“Multiple chains, one coins.”
The tech roadmap goes even further, with plans for:
⚡ Native account abstraction
⚡ Ultra-fast transaction pre-confirmations
⚡ Multi-lane reserved capacity
⚡ Onchain shielded privacy pools
⚡ Sub-second finality
⚡ EVM compatibility
An internal multi-validator devnet is already running, although the project is still under development and subject to changes. The public testnet is targeted for late 2026, with the mainnet planned for early 2027.
This is bigger than simply launching another chain.
BNB Chain is basically building a faster lane for applications that need near-instant execution — while keeping BNB as the common asset across the ecosystem.
Multiple chains. One BNB. One ecosystem.
Now the real question is: how much of this speed can BNB Chain actually deliver once it hits mainnet? 👀
@CZ
CZ has confirmed plans for a brand-new high-speed Layer 1 that will run alongside BNB Smart Chain — not replace it.
And here’s the interesting part: there won’t be a new token.
BNB stays at the center.
The new EVM-compatible chain is designed for speed, with a target of 200ms blocks and around 20ms transaction pre-confirmations. That could make it especially useful for high-frequency trading, real-time payments, AI agents and other applications where every millisecond matters.
The network is also planned to connect with BNB Smart Chain through a native bridge, while BNB continues to handle gas, staking and governance.
CZ summed up the idea in one simple line:
“Multiple chains, one coins.”
The tech roadmap goes even further, with plans for:
⚡ Native account abstraction
⚡ Ultra-fast transaction pre-confirmations
⚡ Multi-lane reserved capacity
⚡ Onchain shielded privacy pools
⚡ Sub-second finality
⚡ EVM compatibility
An internal multi-validator devnet is already running, although the project is still under development and subject to changes. The public testnet is targeted for late 2026, with the mainnet planned for early 2027.
This is bigger than simply launching another chain.
BNB Chain is basically building a faster lane for applications that need near-instant execution — while keeping BNB as the common asset across the ecosystem.
Multiple chains. One BNB. One ecosystem.
Now the real question is: how much of this speed can BNB Chain actually deliver once it hits mainnet? 👀
@CZ


97
·
--
Bullish
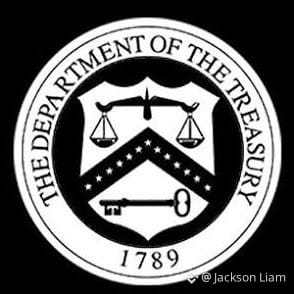
🇺🇸 BREAKING: The U.S. Treasury is stepping back into the bond market.
The Treasury is scheduled to conduct another buyback operation tomorrow, October 27, targeting long-term U.S. government debt.
The move could involve $4 billion or more in Treasury securities, with the focus on bonds maturing in roughly 20 to 30 years.
Why does this matter?
The government buying back its own bonds can help improve liquidity in the Treasury market and manage its debt portfolio. But with U.S. borrowing costs and long-term yields still under heavy attention, markets will be watching this move closely.
And here’s the bigger picture:
The U.S. national debt has now crossed $40 trillion, while interest costs and long-term borrowing pressures remain major concerns for investors.
So this isn’t just another routine bond-market headline.
Treasury buybacks, rising yields, huge government debt and upcoming decisions on future borrowing are all coming together at a very important moment for global markets.
One thing is clear:
The U.S. bond market is becoming impossible to ignore. 👀🇺🇸
🇺🇸 BREAKING: The U.S. Treasury is stepping back into the bond market.
The Treasury is scheduled to conduct another buyback operation tomorrow, October 27, targeting long-term U.S. government debt.
The move could involve $4 billion or more in Treasury securities, with the focus on bonds maturing in roughly 20 to 30 years.
Why does this matter?
The government buying back its own bonds can help improve liquidity in the Treasury market and manage its debt portfolio. But with U.S. borrowing costs and long-term yields still under heavy attention, markets will be watching this move closely.
And here’s the bigger picture:
The U.S. national debt has now crossed $40 trillion, while interest costs and long-term borrowing pressures remain major concerns for investors.
So this isn’t just another routine bond-market headline.
Treasury buybacks, rising yields, huge government debt and upcoming decisions on future borrowing are all coming together at a very important moment for global markets.
One thing is clear:
The U.S. bond market is becoming impossible to ignore. 👀🇺🇸
The Treasury is scheduled to conduct another buyback operation tomorrow, October 27, targeting long-term U.S. government debt.
The move could involve $4 billion or more in Treasury securities, with the focus on bonds maturing in roughly 20 to 30 years.
Why does this matter?
The government buying back its own bonds can help improve liquidity in the Treasury market and manage its debt portfolio. But with U.S. borrowing costs and long-term yields still under heavy attention, markets will be watching this move closely.
And here’s the bigger picture:
The U.S. national debt has now crossed $40 trillion, while interest costs and long-term borrowing pressures remain major concerns for investors.
So this isn’t just another routine bond-market headline.
Treasury buybacks, rising yields, huge government debt and upcoming decisions on future borrowing are all coming together at a very important moment for global markets.
One thing is clear:
The U.S. bond market is becoming impossible to ignore. 👀🇺🇸
311
·
--
Bullish
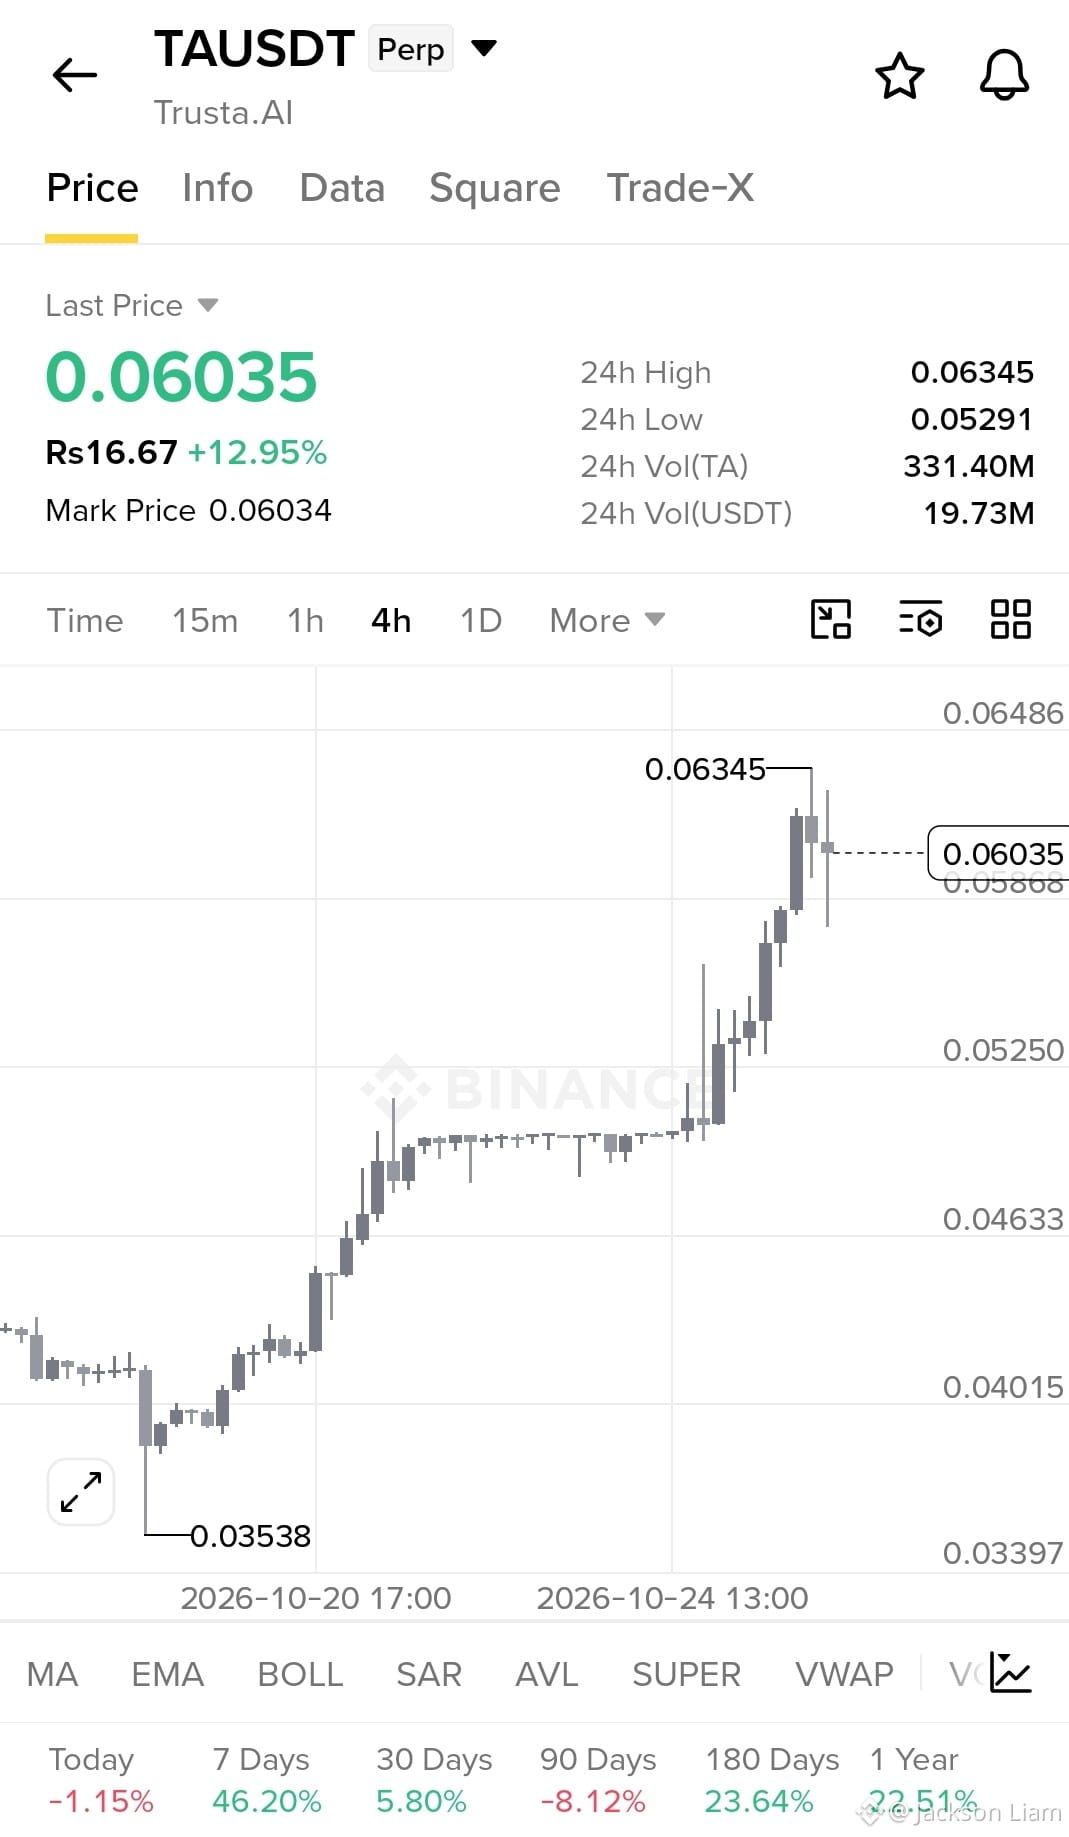
$TA
Buy Zone: 0.0578–0.0600
TP1: 0.0635
TP2: 0.0685
TP3: 0.0740
SL: 0.0548
EP: 0.0590
TP: 0.0635 / 0.0685 / 0.0740
SL: 0.0548
Strong 4H breakout with momentum. Price is cooling near the highs, so a clean retest of the buy zone gives the better setup. Above 0.0635, continuation can accelerate.
{future}(TAUSDT)
$TA
Buy Zone: 0.0578–0.0600
TP1: 0.0635
TP2: 0.0685
TP3: 0.0740
SL: 0.0548
EP: 0.0590
TP: 0.0635 / 0.0685 / 0.0740
SL: 0.0548
Strong 4H breakout with momentum. Price is cooling near the highs, so a clean retest of the buy zone gives the better setup. Above 0.0635, continuation can accelerate.
Buy Zone: 0.0578–0.0600
TP1: 0.0635
TP2: 0.0685
TP3: 0.0740
SL: 0.0548
EP: 0.0590
TP: 0.0635 / 0.0685 / 0.0740
SL: 0.0548
Strong 4H breakout with momentum. Price is cooling near the highs, so a clean retest of the buy zone gives the better setup. Above 0.0635, continuation can accelerate.
208
·
--
Bullish
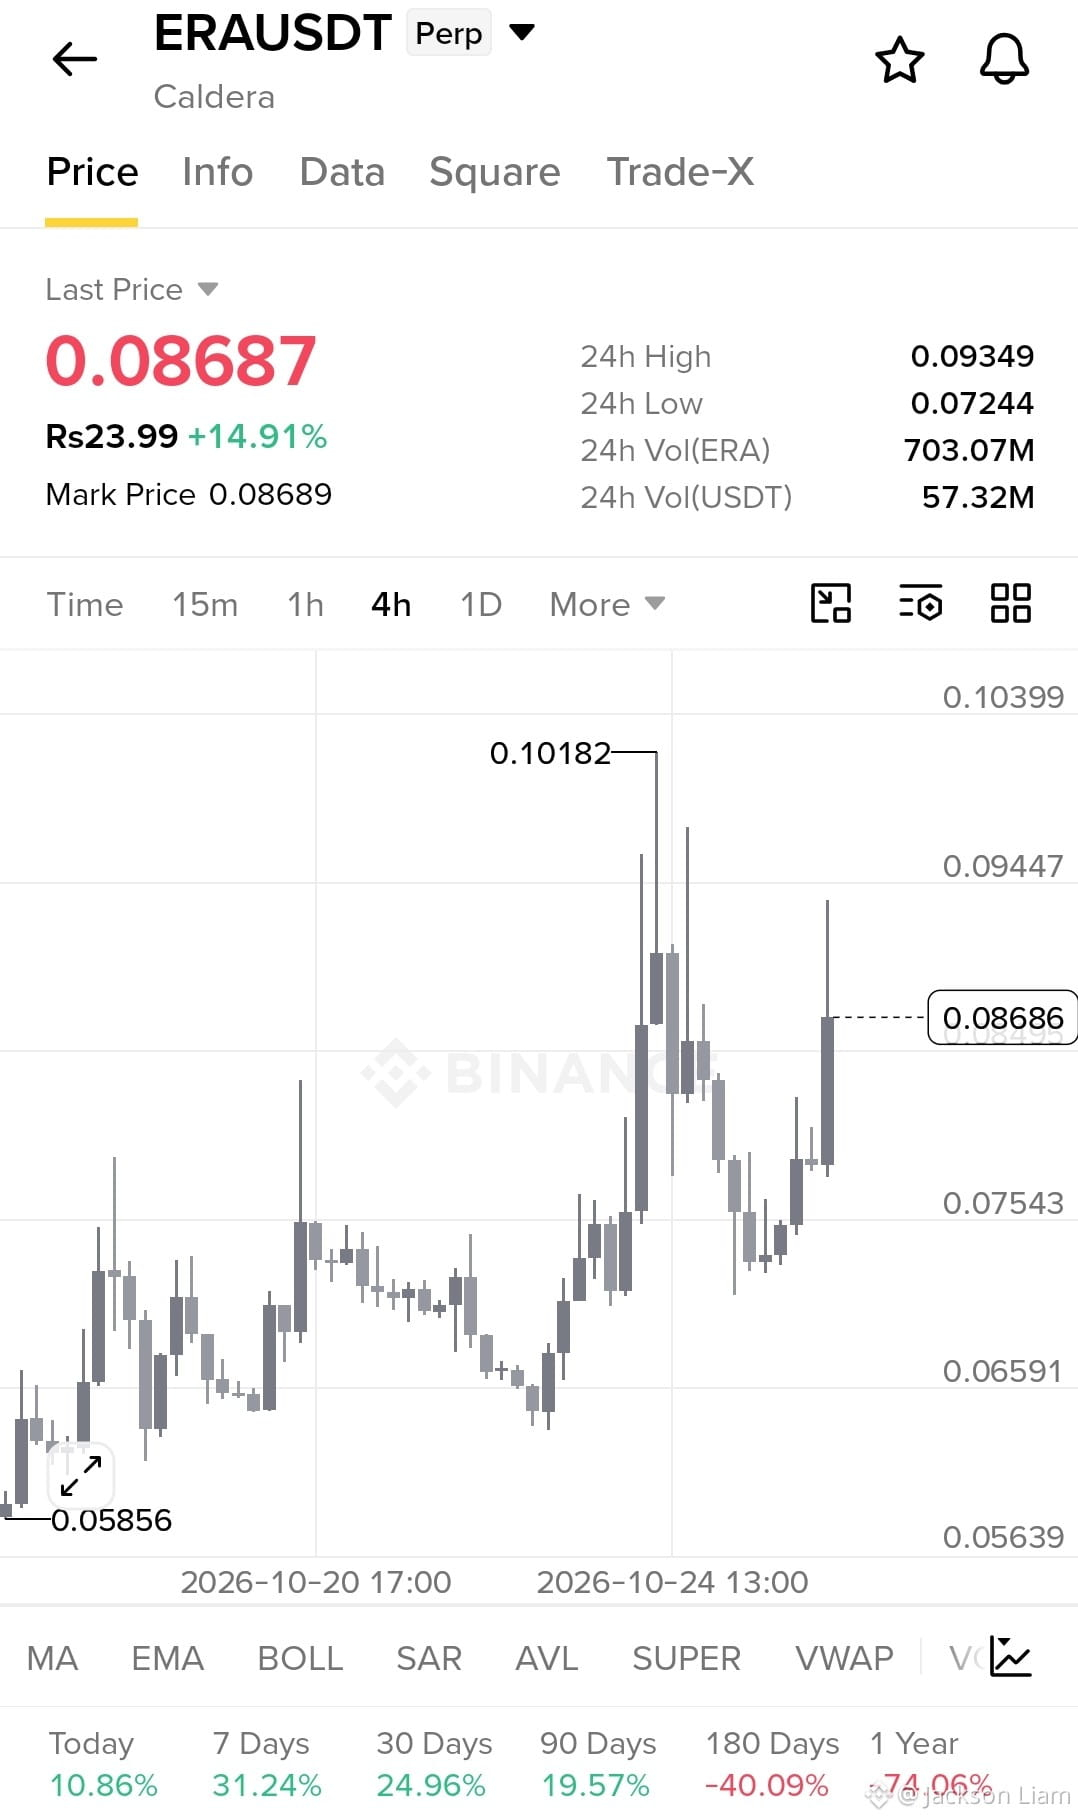
$ERA
Buy Zone: 0.0830–0.0860
TP1: 0.0945
TP2: 0.1018
TP3: 0.1100
SL: 0.0790
EP: 0.0850
TP: 0.0945 / 0.1018 / 0.1100
SL: 0.0790
Momentum is back after reclaiming 0.0754. A clean hold above 0.0860 can open the way toward the previous 0.1018 high.
{spot}(ERAUSDT)
$ERA
Buy Zone: 0.0830–0.0860
TP1: 0.0945
TP2: 0.1018
TP3: 0.1100
SL: 0.0790
EP: 0.0850
TP: 0.0945 / 0.1018 / 0.1100
SL: 0.0790
Momentum is back after reclaiming 0.0754. A clean hold above 0.0860 can open the way toward the previous 0.1018 high.
Buy Zone: 0.0830–0.0860
TP1: 0.0945
TP2: 0.1018
TP3: 0.1100
SL: 0.0790
EP: 0.0850
TP: 0.0945 / 0.1018 / 0.1100
SL: 0.0790
Momentum is back after reclaiming 0.0754. A clean hold above 0.0860 can open the way toward the previous 0.1018 high.
251
·
--
Bullish
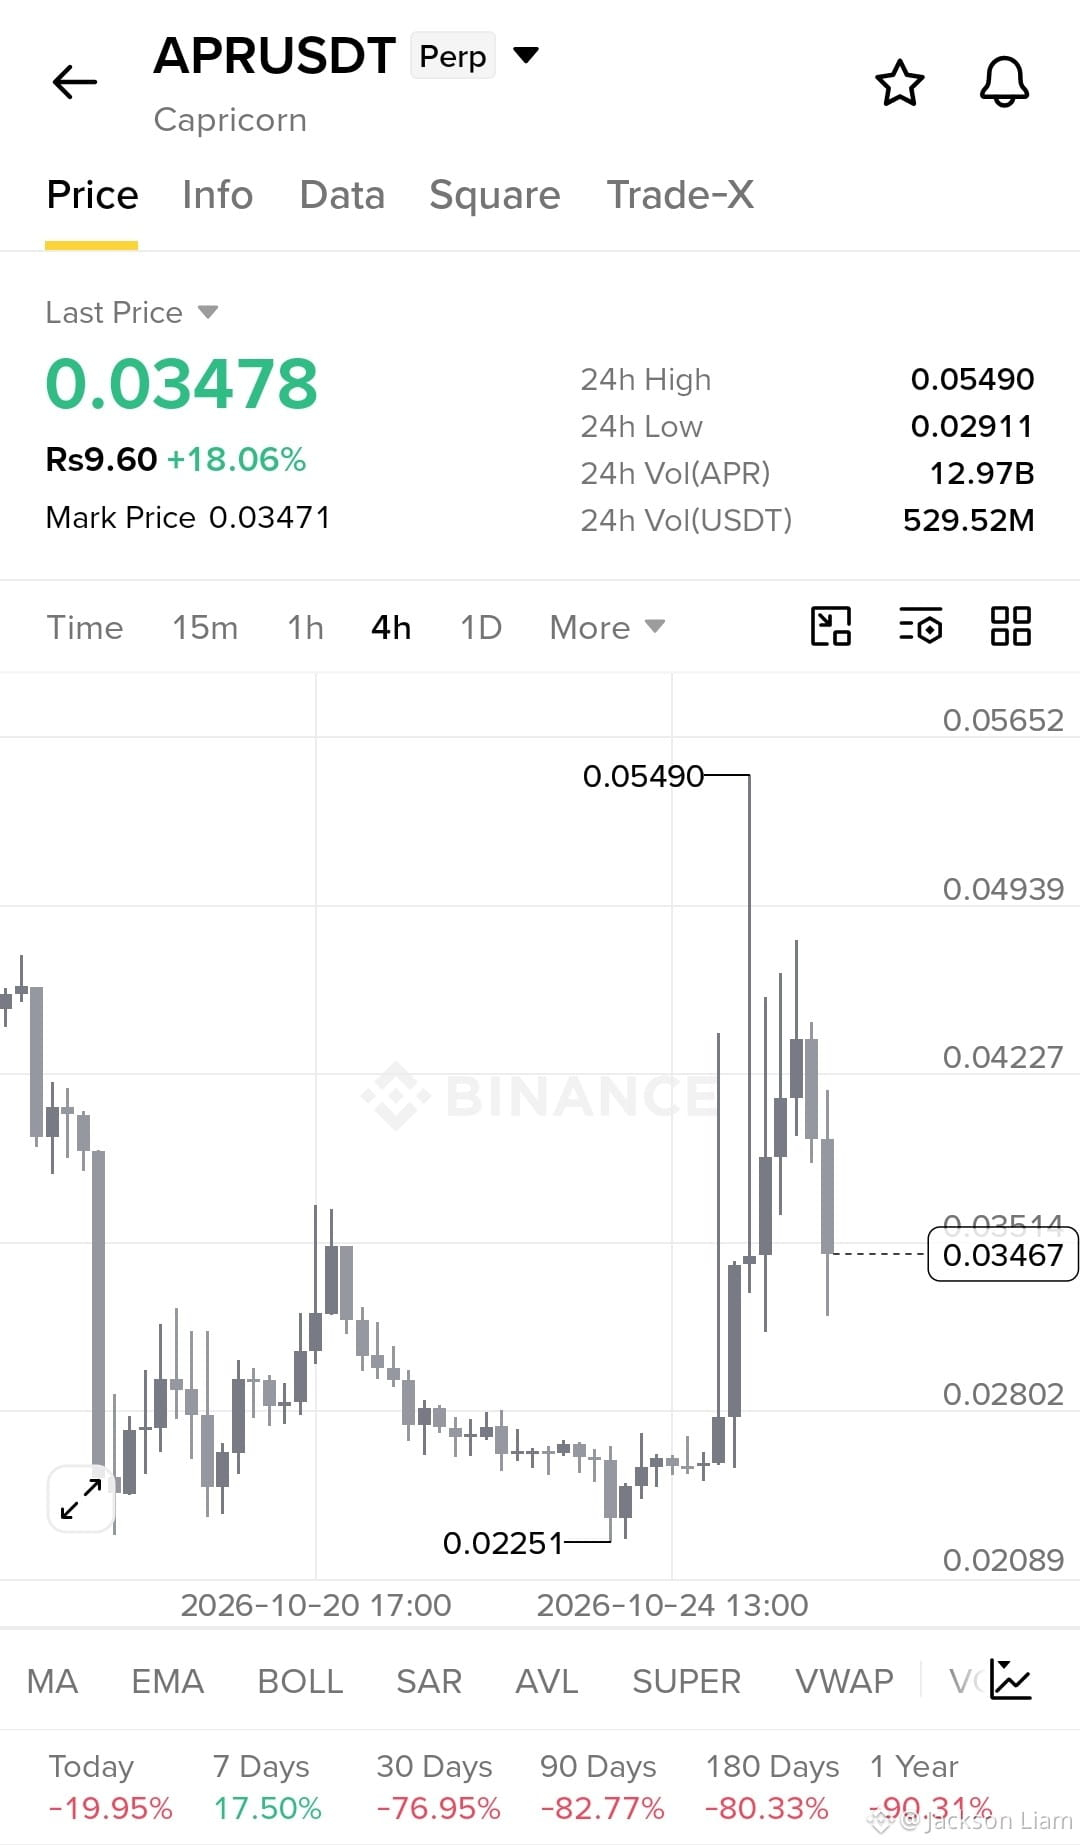
$APR
Buy Zone: 0.0325–0.0345
TP1: 0.0380
TP2: 0.0425
TP3: 0.0490
SL: 0.0290
EP: 0.0335
TP: 0.0380 / 0.0425 / 0.0490
SL: 0.0290
Breakout momentum is strong, but price is pulling back from 0.05490. Best setup is a controlled retest of the buy zone, not chasing the spike.
{future}(APRUSDT)
#DowDrops653Points #SouthKoreaPlansToRegulateStablecoinsUnderFXLaw #ElectrumFixesHighRiskExploitInVersionsBefore4.8.3 #SouthKoreaDelaysCryptoIncomeTax #USQ3GDPAndSeptemberPCEDueNextWeek
$APR
Buy Zone: 0.0325–0.0345
TP1: 0.0380
TP2: 0.0425
TP3: 0.0490
SL: 0.0290
EP: 0.0335
TP: 0.0380 / 0.0425 / 0.0490
SL: 0.0290
Breakout momentum is strong, but price is pulling back from 0.05490. Best setup is a controlled retest of the buy zone, not chasing the spike.
#DowDrops653Points #SouthKoreaPlansToRegulateStablecoinsUnderFXLaw #ElectrumFixesHighRiskExploitInVersionsBefore4.8.3 #SouthKoreaDelaysCryptoIncomeTax #USQ3GDPAndSeptemberPCEDueNextWeek
Buy Zone: 0.0325–0.0345
TP1: 0.0380
TP2: 0.0425
TP3: 0.0490
SL: 0.0290
EP: 0.0335
TP: 0.0380 / 0.0425 / 0.0490
SL: 0.0290
Breakout momentum is strong, but price is pulling back from 0.05490. Best setup is a controlled retest of the buy zone, not chasing the spike.
#DowDrops653Points #SouthKoreaPlansToRegulateStablecoinsUnderFXLaw #ElectrumFixesHighRiskExploitInVersionsBefore4.8.3 #SouthKoreaDelaysCryptoIncomeTax #USQ3GDPAndSeptemberPCEDueNextWeek
343
·
--
Bullish
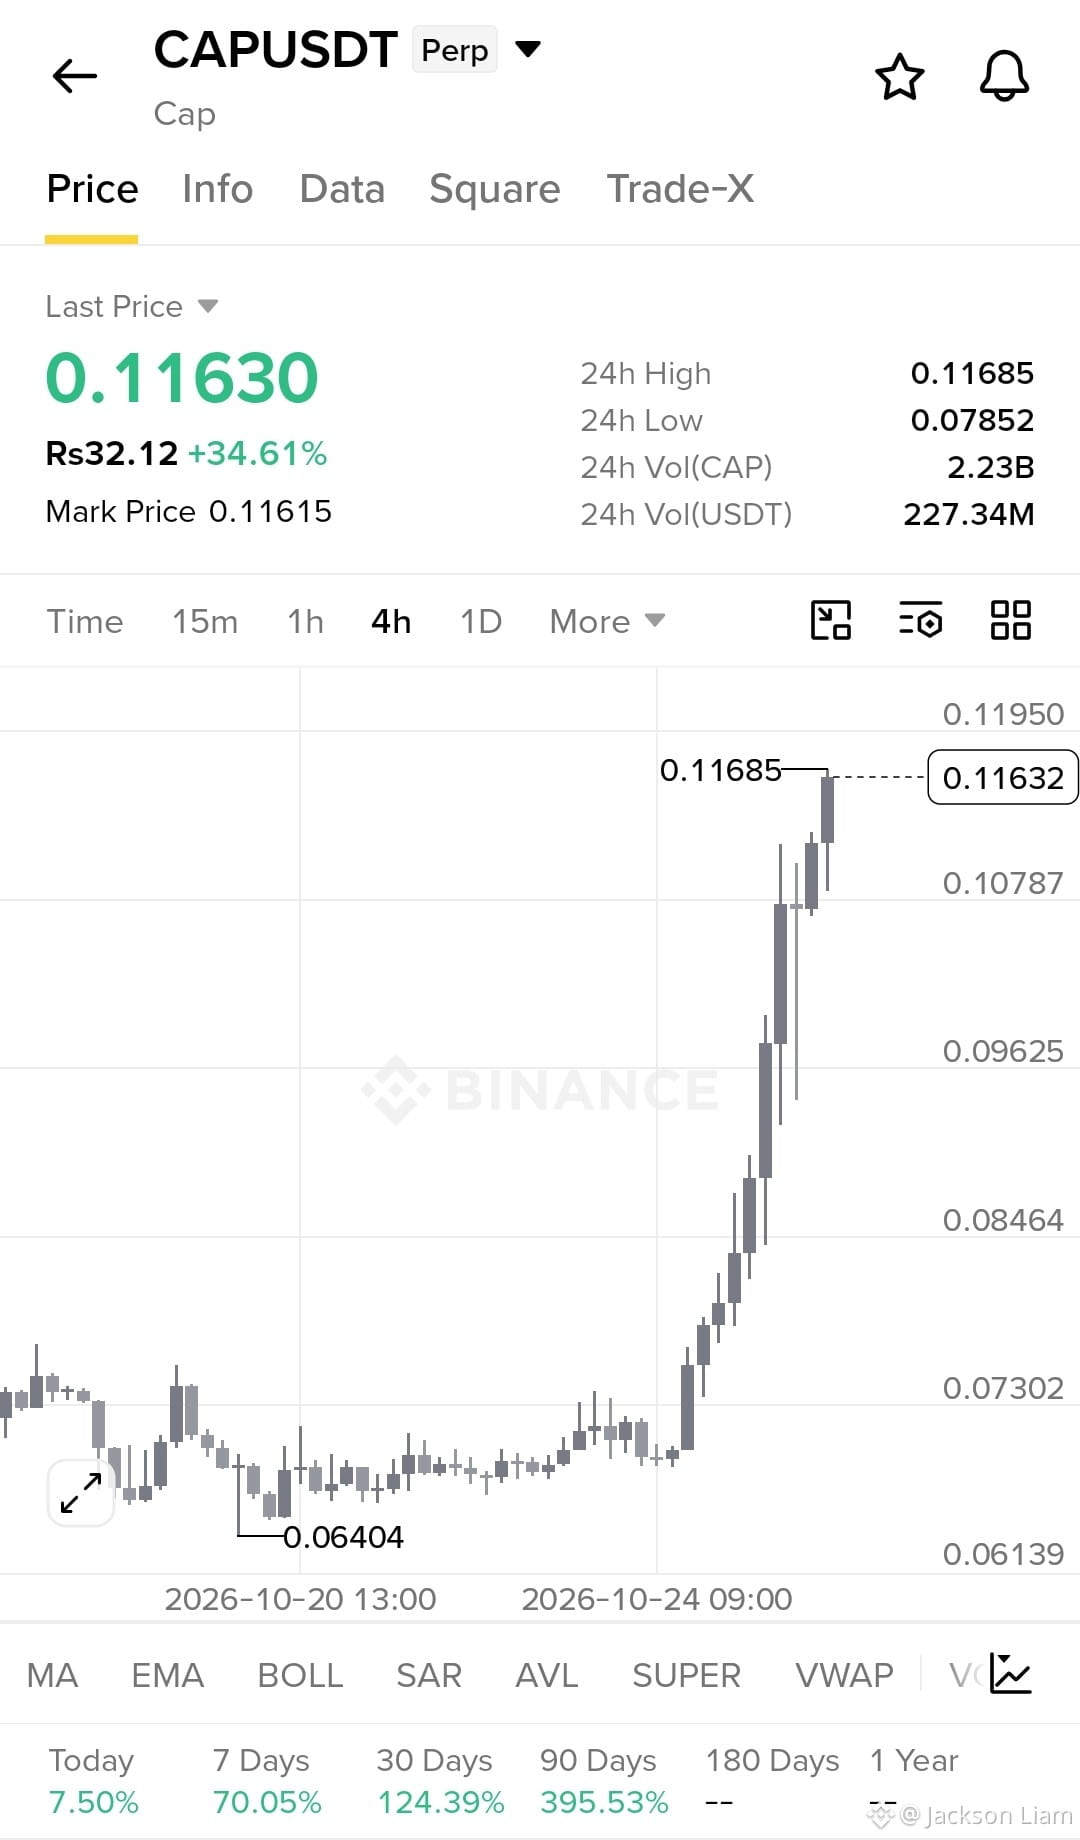
$CAP
Buy Zone: 0.1080–0.1130
TP1: 0.1195
TP2: 0.1250
TP3: 0.1320
SL: 0.1030
EP: 0.1100
TP: 0.1195 / 0.1250 / 0.1320
SL: 0.1030
Strong breakout with momentum. Wait for a pullback into the buy zone rather than chasing the spike. Invalidation below 0.1030.
let's go$CAP
{future}(CAPUSDT)
#BinancePick #EarningsSeason #SouthKoreaDelaysCryptoIncomeTax #DowDrops653Points #ElectrumFixesHighRiskExploitInVersionsBefore4.8.3
$CAP
Buy Zone: 0.1080–0.1130
TP1: 0.1195
TP2: 0.1250
TP3: 0.1320
SL: 0.1030
EP: 0.1100
TP: 0.1195 / 0.1250 / 0.1320
SL: 0.1030
Strong breakout with momentum. Wait for a pullback into the buy zone rather than chasing the spike. Invalidation below 0.1030.
let's go$CAP
#BinancePick #EarningsSeason #SouthKoreaDelaysCryptoIncomeTax #DowDrops653Points #ElectrumFixesHighRiskExploitInVersionsBefore4.8.3
Buy Zone: 0.1080–0.1130
TP1: 0.1195
TP2: 0.1250
TP3: 0.1320
SL: 0.1030
EP: 0.1100
TP: 0.1195 / 0.1250 / 0.1320
SL: 0.1030
Strong breakout with momentum. Wait for a pullback into the buy zone rather than chasing the spike. Invalidation below 0.1030.
let's go$CAP
#BinancePick #EarningsSeason #SouthKoreaDelaysCryptoIncomeTax #DowDrops653Points #ElectrumFixesHighRiskExploitInVersionsBefore4.8.3
351
·
--
Bullish
🚨 THIS IS A VERY STRANGE YEAR FOR BITCOIN AND GOLD.
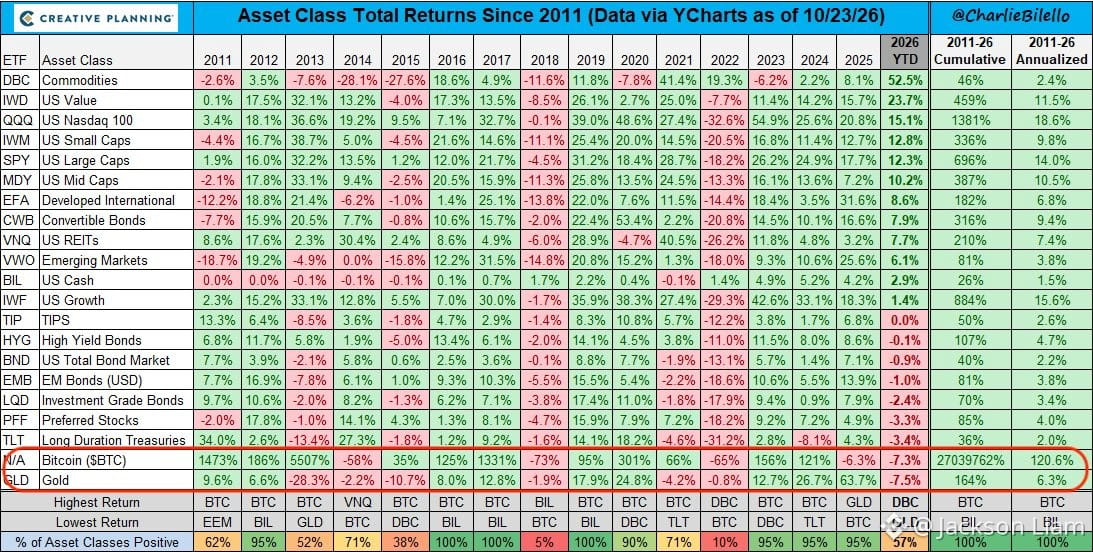
$BTC is down 7.3% in 2026.
$XAU is down 7.5%.
That makes them the TWO WORST-performing major asset classes so far this year.
And according to Chief Market Strategist Charlie Bilello of Creative Planning, this is a historic first.
What makes it even more surprising is their long-term record.
Since 2011, Bitcoin has delivered the highest annualized return among the tracked major assets, at an incredible 120.6%.
Gold, meanwhile, has returned about 6.3% annually over the same period.
Gold also had a huge run in 2025, surging 63.7%.
Now both Bitcoin and gold have suddenly moved in the opposite direction.
While stocks, bonds and even cash are outperforming them in 2026, two of the most talked-about stores of value are sitting at the bottom of the table.
The bigger question now:
Is this just a painful pause after years of strong performance…
or are Bitcoin and gold entering a completely different market cycle?
Either way, 2026 is turning into a year neither Bitcoin nor gold investors expected.
🚨 THIS IS A VERY STRANGE YEAR FOR BITCOIN AND GOLD.
$BTC is down 7.3% in 2026.
$XAU is down 7.5%.
That makes them the TWO WORST-performing major asset classes so far this year.
And according to Chief Market Strategist Charlie Bilello of Creative Planning, this is a historic first.
What makes it even more surprising is their long-term record.
Since 2011, Bitcoin has delivered the highest annualized return among the tracked major assets, at an incredible 120.6%.
Gold, meanwhile, has returned about 6.3% annually over the same period.
Gold also had a huge run in 2025, surging 63.7%.
Now both Bitcoin and gold have suddenly moved in the opposite direction.
While stocks, bonds and even cash are outperforming them in 2026, two of the most talked-about stores of value are sitting at the bottom of the table.
The bigger question now:
Is this just a painful pause after years of strong performance…
or are Bitcoin and gold entering a completely different market cycle?
Either way, 2026 is turning into a year neither Bitcoin nor gold investors expected.
$BTC is down 7.3% in 2026.
$XAU is down 7.5%.
That makes them the TWO WORST-performing major asset classes so far this year.
And according to Chief Market Strategist Charlie Bilello of Creative Planning, this is a historic first.
What makes it even more surprising is their long-term record.
Since 2011, Bitcoin has delivered the highest annualized return among the tracked major assets, at an incredible 120.6%.
Gold, meanwhile, has returned about 6.3% annually over the same period.
Gold also had a huge run in 2025, surging 63.7%.
Now both Bitcoin and gold have suddenly moved in the opposite direction.
While stocks, bonds and even cash are outperforming them in 2026, two of the most talked-about stores of value are sitting at the bottom of the table.
The bigger question now:
Is this just a painful pause after years of strong performance…
or are Bitcoin and gold entering a completely different market cycle?
Either way, 2026 is turning into a year neither Bitcoin nor gold investors expected.
382
·
--
Bullish
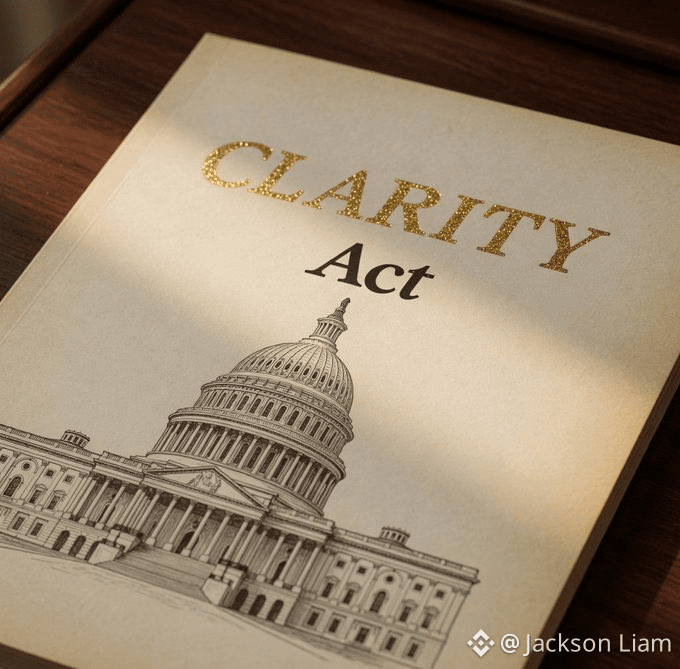
🇺🇸 JUST IN: The CLARITY Act is turning into a major political fight in Washington.
Senator Cynthia Lummis says Democrats voted against the very crypto rules they had pushed for to protect retail investors.
According to Lummis, Democrats asked for two changes:
• Cut the annual Regulation Crypto fundraising cap from $75 million to $50 million
• Add a $200 million lifetime limit
Lummis says Republicans agreed to both demands and added them to the CLARITY Act.
But when the bill reached a key Senate procedural vote on September 15, it failed.
Now the big question is simple:
If these changes were requested to protect retail investors, why did the bill still fail?
The crypto industry is watching closely.
And for everyday investors, the fight over the CLARITY Act could have a much bigger impact than just another political battle in Washington.
🇺🇸 JUST IN: The CLARITY Act is turning into a major political fight in Washington.
Senator Cynthia Lummis says Democrats voted against the very crypto rules they had pushed for to protect retail investors.
According to Lummis, Democrats asked for two changes:
• Cut the annual Regulation Crypto fundraising cap from $75 million to $50 million
• Add a $200 million lifetime limit
Lummis says Republicans agreed to both demands and added them to the CLARITY Act.
But when the bill reached a key Senate procedural vote on September 15, it failed.
Now the big question is simple:
If these changes were requested to protect retail investors, why did the bill still fail?
The crypto industry is watching closely.
And for everyday investors, the fight over the CLARITY Act could have a much bigger impact than just another political battle in Washington.
Senator Cynthia Lummis says Democrats voted against the very crypto rules they had pushed for to protect retail investors.
According to Lummis, Democrats asked for two changes:
• Cut the annual Regulation Crypto fundraising cap from $75 million to $50 million
• Add a $200 million lifetime limit
Lummis says Republicans agreed to both demands and added them to the CLARITY Act.
But when the bill reached a key Senate procedural vote on September 15, it failed.
Now the big question is simple:
If these changes were requested to protect retail investors, why did the bill still fail?
The crypto industry is watching closely.
And for everyday investors, the fight over the CLARITY Act could have a much bigger impact than just another political battle in Washington.

2
1
236
·
--
Bullish
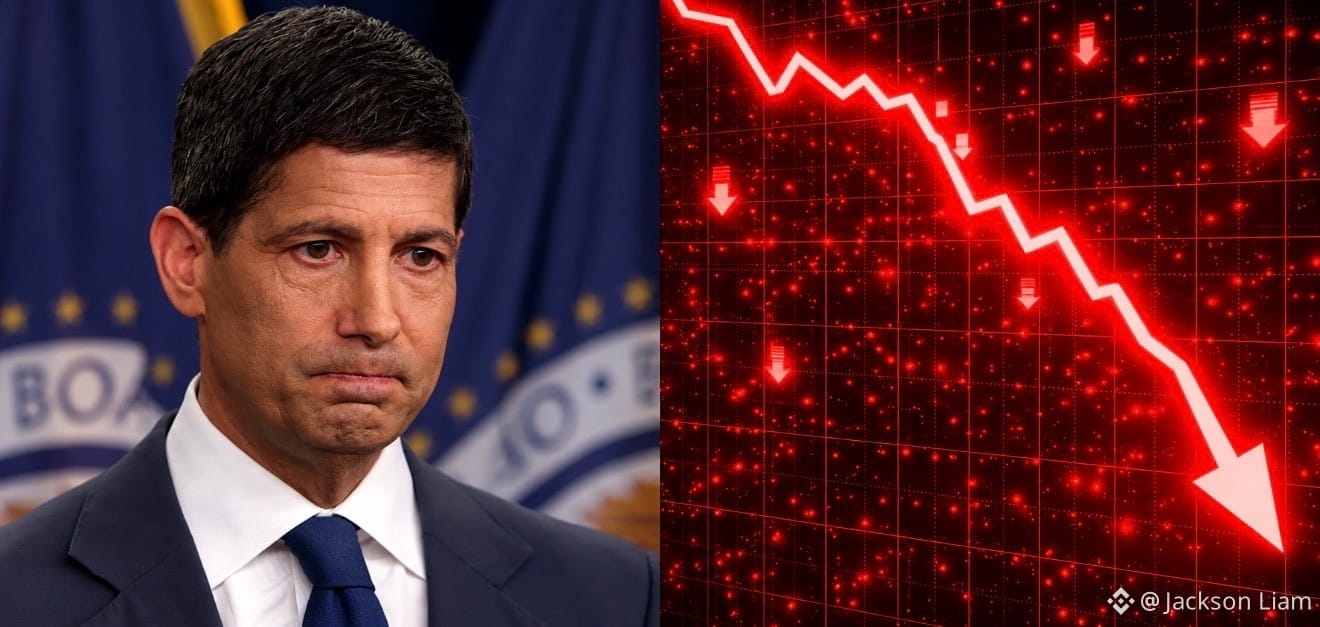
Kevin Warsh is walking into the FOMC meeting at one of the worst possible times.
The Fed meets on Wednesday, and honestly, there may be no easy way out.
Inflation is heating up again. CPI and PPI both came in hotter than expected, while core inflation is also moving higher.
Then there’s the U.S.-Iran war, which is pushing energy prices up and adding even more pressure to inflation.
But at the same time, the economy is starting to look weaker.
The housing market is struggling. Borrowing costs are still painfully high. Companies are cutting jobs.
So the Fed is stuck between two ugly problems:
🔥 Inflation is rising.
📉 The economy is weakening.
And every possible move comes with a risk.
If the Fed stays too relaxed on inflation, bond yields could rise as investors start worrying that inflation is getting out of control.
If the Fed turns hawkish, stocks and crypto could take a hit as markets price in higher rates and tighter financial conditions.
And if the Fed signals rate cuts, investors may ask the obvious question:
“Why is the Fed easing when inflation is still rising?”
That’s the real danger here.
The Fed needs inflation to cool without doing more damage to an already fragile economy.
But right now, we’re seeing inflation move higher while economic conditions are getting weaker.
That’s the ugly combination called stagflation.
And markets absolutely hate it.
One hawkish comment from Warsh could send stocks tumbling.
A dovish surprise could create a completely different problem — investors may fear that the Fed is falling behind the inflation curve, pushing bond yields higher.
Either way, Wednesday could get very interesting.
The Fed isn't just trying to make a rate decision.
It’s trying to convince markets that it still has control.
If that confidence breaks, this FOMC meeting could turn into one of the most volatile moments for global markets in a long time.
Kevin Warsh is walking into the FOMC meeting at one of the worst possible times.
The Fed meets on Wednesday, and honestly, there may be no easy way out.
Inflation is heating up again. CPI and PPI both came in hotter than expected, while core inflation is also moving higher.
Then there’s the U.S.-Iran war, which is pushing energy prices up and adding even more pressure to inflation.
But at the same time, the economy is starting to look weaker.
The housing market is struggling. Borrowing costs are still painfully high. Companies are cutting jobs.
So the Fed is stuck between two ugly problems:
🔥 Inflation is rising.
📉 The economy is weakening.
And every possible move comes with a risk.
If the Fed stays too relaxed on inflation, bond yields could rise as investors start worrying that inflation is getting out of control.
If the Fed turns hawkish, stocks and crypto could take a hit as markets price in higher rates and tighter financial conditions.
And if the Fed signals rate cuts, investors may ask the obvious question:
“Why is the Fed easing when inflation is still rising?”
That’s the real danger here.
The Fed needs inflation to cool without doing more damage to an already fragile economy.
But right now, we’re seeing inflation move higher while economic conditions are getting weaker.
That’s the ugly combination called stagflation.
And markets absolutely hate it.
One hawkish comment from Warsh could send stocks tumbling.
A dovish surprise could create a completely different problem — investors may fear that the Fed is falling behind the inflation curve, pushing bond yields higher.
Either way, Wednesday could get very interesting.
The Fed isn't just trying to make a rate decision.
It’s trying to convince markets that it still has control.
If that confidence breaks, this FOMC meeting could turn into one of the most volatile moments for global markets in a long time.
The Fed meets on Wednesday, and honestly, there may be no easy way out.
Inflation is heating up again. CPI and PPI both came in hotter than expected, while core inflation is also moving higher.
Then there’s the U.S.-Iran war, which is pushing energy prices up and adding even more pressure to inflation.
But at the same time, the economy is starting to look weaker.
The housing market is struggling. Borrowing costs are still painfully high. Companies are cutting jobs.
So the Fed is stuck between two ugly problems:
🔥 Inflation is rising.
📉 The economy is weakening.
And every possible move comes with a risk.
If the Fed stays too relaxed on inflation, bond yields could rise as investors start worrying that inflation is getting out of control.
If the Fed turns hawkish, stocks and crypto could take a hit as markets price in higher rates and tighter financial conditions.
And if the Fed signals rate cuts, investors may ask the obvious question:
“Why is the Fed easing when inflation is still rising?”
That’s the real danger here.
The Fed needs inflation to cool without doing more damage to an already fragile economy.
But right now, we’re seeing inflation move higher while economic conditions are getting weaker.
That’s the ugly combination called stagflation.
And markets absolutely hate it.
One hawkish comment from Warsh could send stocks tumbling.
A dovish surprise could create a completely different problem — investors may fear that the Fed is falling behind the inflation curve, pushing bond yields higher.
Either way, Wednesday could get very interesting.
The Fed isn't just trying to make a rate decision.
It’s trying to convince markets that it still has control.
If that confidence breaks, this FOMC meeting could turn into one of the most volatile moments for global markets in a long time.
4
321
·
--
Bullish
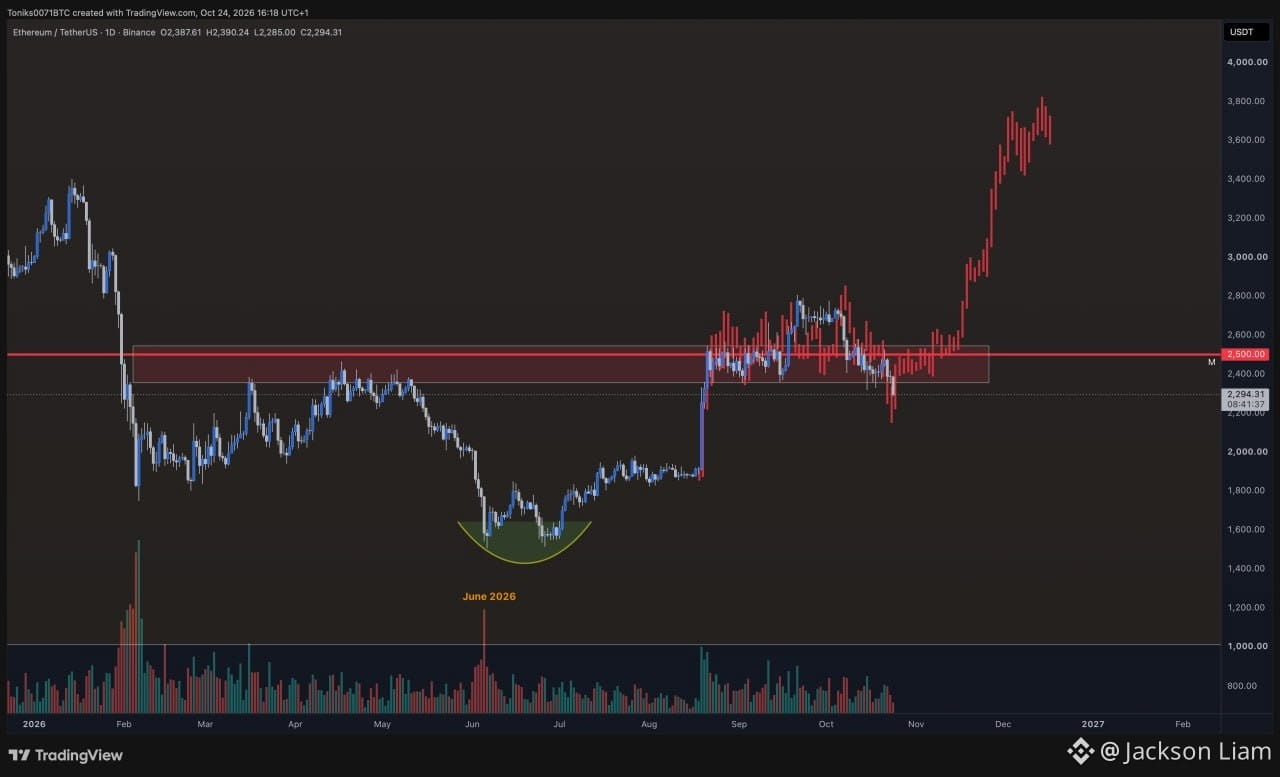
$ETH on the 1D timeframe, with a major breakout structure around the $2,500 area.
What the chart is showing
$2,500 is the key historical resistance/support zone. ETH spent a long period consolidating around roughly $2,350–$2,600 before breaking out.
The June 2026 rounded-bottom structure around $1,500–$1,900 suggests a larger accumulation phase.
ETH then pushed strongly through the $2,500 resistance, followed by consolidation/retesting.
The subsequent rally toward $3,600–$3,800 indicates that the breakout was significant.
The current candles at the right side show consolidation near the highs, rather than an obvious breakdown.
The important level
The red horizontal line at $2,500 is the major level to watch.
If ETH were to revisit it and hold above it, the chart would essentially be showing:
Accumulation → breakout → retest → continuation
That would make $2,500 a potentially important long-term support zone.
If ETH loses the broader $2,350–$2,400 area, however, the breakout structure would become much less convincing.
My read
The higher-timeframe structure is bullish, but the chart is already substantially extended from the breakout zone. I wouldn't interpret the move as “ETH must keep going straight up.” After a move from ~$2,500 toward ~$3,700+, a period of consolidation or pullback would be completely normal.
The cleanest bullish confirmation would be a successful hold above the breakout zone followed by a new higher high.
#ETH #BinancePick #EarningsSeason #SouthKoreaDelaysCryptoIncomeTax #DowDrops653Points
$ETH on the 1D timeframe, with a major breakout structure around the $2,500 area.
What the chart is showing
$2,500 is the key historical resistance/support zone. ETH spent a long period consolidating around roughly $2,350–$2,600 before breaking out.
The June 2026 rounded-bottom structure around $1,500–$1,900 suggests a larger accumulation phase.
ETH then pushed strongly through the $2,500 resistance, followed by consolidation/retesting.
The subsequent rally toward $3,600–$3,800 indicates that the breakout was significant.
The current candles at the right side show consolidation near the highs, rather than an obvious breakdown.
The important level
The red horizontal line at $2,500 is the major level to watch.
If ETH were to revisit it and hold above it, the chart would essentially be showing:
Accumulation → breakout → retest → continuation
That would make $2,500 a potentially important long-term support zone.
If ETH loses the broader $2,350–$2,400 area, however, the breakout structure would become much less convincing.
My read
The higher-timeframe structure is bullish, but the chart is already substantially extended from the breakout zone. I wouldn't interpret the move as “ETH must keep going straight up.” After a move from ~$2,500 toward ~$3,700+, a period of consolidation or pullback would be completely normal.
The cleanest bullish confirmation would be a successful hold above the breakout zone followed by a new higher high.
#ETH #BinancePick #EarningsSeason #SouthKoreaDelaysCryptoIncomeTax #DowDrops653Points
What the chart is showing
$2,500 is the key historical resistance/support zone. ETH spent a long period consolidating around roughly $2,350–$2,600 before breaking out.
The June 2026 rounded-bottom structure around $1,500–$1,900 suggests a larger accumulation phase.
ETH then pushed strongly through the $2,500 resistance, followed by consolidation/retesting.
The subsequent rally toward $3,600–$3,800 indicates that the breakout was significant.
The current candles at the right side show consolidation near the highs, rather than an obvious breakdown.
The important level
The red horizontal line at $2,500 is the major level to watch.
If ETH were to revisit it and hold above it, the chart would essentially be showing:
Accumulation → breakout → retest → continuation
That would make $2,500 a potentially important long-term support zone.
If ETH loses the broader $2,350–$2,400 area, however, the breakout structure would become much less convincing.
My read
The higher-timeframe structure is bullish, but the chart is already substantially extended from the breakout zone. I wouldn't interpret the move as “ETH must keep going straight up.” After a move from ~$2,500 toward ~$3,700+, a period of consolidation or pullback would be completely normal.
The cleanest bullish confirmation would be a successful hold above the breakout zone followed by a new higher high.
#ETH #BinancePick #EarningsSeason #SouthKoreaDelaysCryptoIncomeTax #DowDrops653Points
246
·
--
Bullish
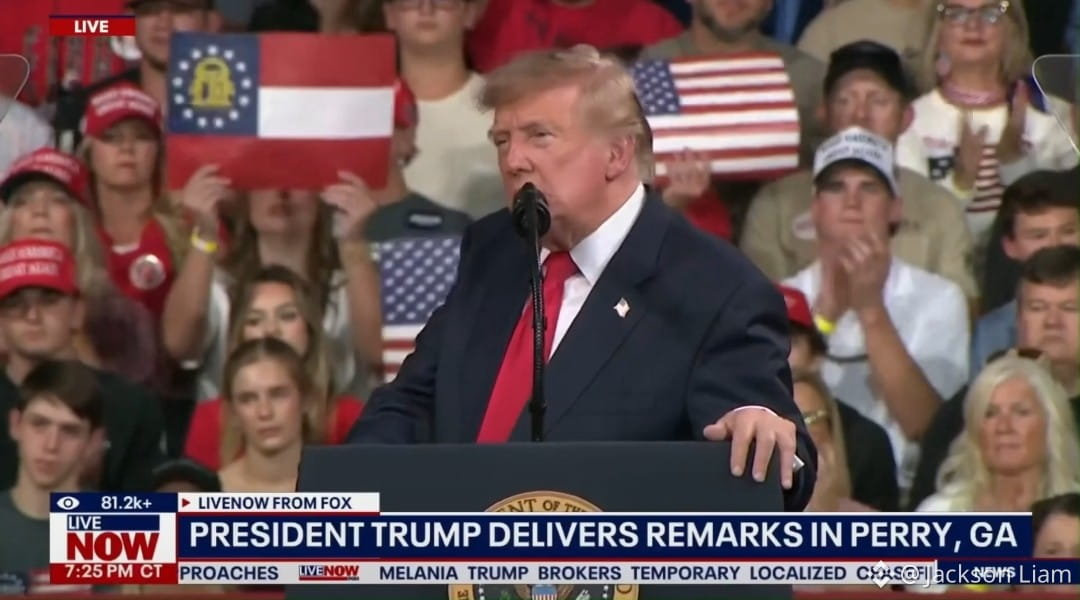
🇺🇸 Trump says the US is making a “freaking fortune” from the oil price surge.
His claim: the US is making “hundreds of billions of dollars” because of what’s happening in the Middle East.
The numbers are hard to ignore:
Brent crude before the Iran war: $72
Brent crude now: $117
That’s a jump of more than 60%.
Oil prices are surging, money is moving, and the Middle East is once again shaking global markets.
The big question now:
Is this a huge win for the US economy, or is $117 oil going to hurt consumers around the world?
#BinancePick #EarningsSeason #DowDrops653Points #MarketsPriceJust10%ChanceOfFedHikeNextWeek #USConsumerSentimentHoldsAtSecondLowestOnRecord
🇺🇸 Trump says the US is making a “freaking fortune” from the oil price surge.
His claim: the US is making “hundreds of billions of dollars” because of what’s happening in the Middle East.
The numbers are hard to ignore:
Brent crude before the Iran war: $72
Brent crude now: $117
That’s a jump of more than 60%.
Oil prices are surging, money is moving, and the Middle East is once again shaking global markets.
The big question now:
Is this a huge win for the US economy, or is $117 oil going to hurt consumers around the world?
#BinancePick #EarningsSeason #DowDrops653Points #MarketsPriceJust10%ChanceOfFedHikeNextWeek #USConsumerSentimentHoldsAtSecondLowestOnRecord
His claim: the US is making “hundreds of billions of dollars” because of what’s happening in the Middle East.
The numbers are hard to ignore:
Brent crude before the Iran war: $72
Brent crude now: $117
That’s a jump of more than 60%.
Oil prices are surging, money is moving, and the Middle East is once again shaking global markets.
The big question now:
Is this a huge win for the US economy, or is $117 oil going to hurt consumers around the world?
#BinancePick #EarningsSeason #DowDrops653Points #MarketsPriceJust10%ChanceOfFedHikeNextWeek #USConsumerSentimentHoldsAtSecondLowestOnRecord
1
280
·
--
Bullish
🚨 BREAKING: Audi is bringing its first-ever U.S. factory to Georgia.
President Trump announced the major investment as Audi plans to put around $4.2 billion into a new manufacturing plant near Macon, Georgia.
And the numbers are huge:
🏭 First Audi manufacturing plant in the U.S.
💰 About $4.2 billion investment
👷 Around 4,500 new jobs
🚙 Up to 200,000 vehicles produced every year
📍 Peach County, near Macon
🔧 Production expected to begin in the early 2030s
Audi says the plant will focus on its biggest and most premium SUVs, including the Q7, Q8 and Q9.
For Georgia, this is more than just another factory. It means thousands of new jobs, a bigger automotive supply chain and a major new presence for one of the world's best-known luxury car brands.
Audi is betting big on American customers — and Georgia is about to become a very important part of that story.
This is a massive move for Audi, Georgia and U.S. auto manufacturing. 🚘🇺🇸
🚨 BREAKING: Audi is bringing its first-ever U.S. factory to Georgia.
President Trump announced the major investment as Audi plans to put around $4.2 billion into a new manufacturing plant near Macon, Georgia.
And the numbers are huge:
🏭 First Audi manufacturing plant in the U.S.
💰 About $4.2 billion investment
👷 Around 4,500 new jobs
🚙 Up to 200,000 vehicles produced every year
📍 Peach County, near Macon
🔧 Production expected to begin in the early 2030s
Audi says the plant will focus on its biggest and most premium SUVs, including the Q7, Q8 and Q9.
For Georgia, this is more than just another factory. It means thousands of new jobs, a bigger automotive supply chain and a major new presence for one of the world's best-known luxury car brands.
Audi is betting big on American customers — and Georgia is about to become a very important part of that story.
This is a massive move for Audi, Georgia and U.S. auto manufacturing. 🚘🇺🇸
President Trump announced the major investment as Audi plans to put around $4.2 billion into a new manufacturing plant near Macon, Georgia.
And the numbers are huge:
🏭 First Audi manufacturing plant in the U.S.
💰 About $4.2 billion investment
👷 Around 4,500 new jobs
🚙 Up to 200,000 vehicles produced every year
📍 Peach County, near Macon
🔧 Production expected to begin in the early 2030s
Audi says the plant will focus on its biggest and most premium SUVs, including the Q7, Q8 and Q9.
For Georgia, this is more than just another factory. It means thousands of new jobs, a bigger automotive supply chain and a major new presence for one of the world's best-known luxury car brands.
Audi is betting big on American customers — and Georgia is about to become a very important part of that story.
This is a massive move for Audi, Georgia and U.S. auto manufacturing. 🚘🇺🇸

1.1k
·
--
Bullish
Qafila: A million reasons to be part of the journey. ✨
Some campaigns are about one big moment. Qafila feels more like a journey — one where every milestone adds something new.
With $1M in total rewards, Binance MENAT is bringing its community together through different activities and challenges. Depending on your market and eligibility, you can explore opportunities across trading, Earn, referrals, and more.
What I like most is the idea behind it: progress doesn’t have to happen alone. You can learn, participate, take on challenges, and celebrate the journey alongside the wider community. 🤝
So, if you’re curious about Qafila, take a look at the activities available in your market and see where your journey takes you.
The campaign runs from 20 October to 30 November 2026.
Activities, eligibility and rewards vary by market. Digital asset prices are subject to high market risk and price volatility. This is not financial advice. Please check the official Qafila campaign page for full details and Terms & Conditions.
#Qafila #Binance
Qafila: A million reasons to be part of the journey. ✨
Some campaigns are about one big moment. Qafila feels more like a journey — one where every milestone adds something new.
With $1M in total rewards, Binance MENAT is bringing its community together through different activities and challenges. Depending on your market and eligibility, you can explore opportunities across trading, Earn, referrals, and more.
What I like most is the idea behind it: progress doesn’t have to happen alone. You can learn, participate, take on challenges, and celebrate the journey alongside the wider community. 🤝
So, if you’re curious about Qafila, take a look at the activities available in your market and see where your journey takes you.
The campaign runs from 20 October to 30 November 2026.
Activities, eligibility and rewards vary by market. Digital asset prices are subject to high market risk and price volatility. This is not financial advice. Please check the official Qafila campaign page for full details and Terms & Conditions.
#Qafila #Binance
Some campaigns are about one big moment. Qafila feels more like a journey — one where every milestone adds something new.
With $1M in total rewards, Binance MENAT is bringing its community together through different activities and challenges. Depending on your market and eligibility, you can explore opportunities across trading, Earn, referrals, and more.
What I like most is the idea behind it: progress doesn’t have to happen alone. You can learn, participate, take on challenges, and celebrate the journey alongside the wider community. 🤝
So, if you’re curious about Qafila, take a look at the activities available in your market and see where your journey takes you.
The campaign runs from 20 October to 30 November 2026.
Activities, eligibility and rewards vary by market. Digital asset prices are subject to high market risk and price volatility. This is not financial advice. Please check the official Qafila campaign page for full details and Terms & Conditions.
#Qafila #Binance

1
1
1.1k
·
--
Bullish
🚨 Hyperliquid could be heading toward a much bigger U.S. story.
Hyperliquid founder Jeff Yan told Bloomberg that the goal should be to regulate the firms operating markets on the network — not treat the blockchain itself like a traditional exchange.
That distinction could be huge.
If regulators take this approach, firms running markets on Hyperliquid could have to meet regulatory requirements while the underlying blockchain remains outside the traditional exchange model.
And that could eventually open the door for Wall Street to access Hyperliquid in a more regulated way.
But there’s still an important line users need to understand.
Yan confirmed that Americans using VPNs to access Hyperliquid are violating the platform’s terms.
So this isn’t a green light for U.S. users just yet.
The bigger question is whether regulators, especially the CFTC, can create a clear framework for onchain trading.
If that clarity comes, Hyperliquid could become one of the most interesting bridges between crypto-native markets and traditional finance.
The next chapter may depend less on the blockchain itself — and more on how regulators decide to treat the businesses building markets on top of it.
🚨 Hyperliquid could be heading toward a much bigger U.S. story.
Hyperliquid founder Jeff Yan told Bloomberg that the goal should be to regulate the firms operating markets on the network — not treat the blockchain itself like a traditional exchange.
That distinction could be huge.
If regulators take this approach, firms running markets on Hyperliquid could have to meet regulatory requirements while the underlying blockchain remains outside the traditional exchange model.
And that could eventually open the door for Wall Street to access Hyperliquid in a more regulated way.
But there’s still an important line users need to understand.
Yan confirmed that Americans using VPNs to access Hyperliquid are violating the platform’s terms.
So this isn’t a green light for U.S. users just yet.
The bigger question is whether regulators, especially the CFTC, can create a clear framework for onchain trading.
If that clarity comes, Hyperliquid could become one of the most interesting bridges between crypto-native markets and traditional finance.
The next chapter may depend less on the blockchain itself — and more on how regulators decide to treat the businesses building markets on top of it.
Hyperliquid founder Jeff Yan told Bloomberg that the goal should be to regulate the firms operating markets on the network — not treat the blockchain itself like a traditional exchange.
That distinction could be huge.
If regulators take this approach, firms running markets on Hyperliquid could have to meet regulatory requirements while the underlying blockchain remains outside the traditional exchange model.
And that could eventually open the door for Wall Street to access Hyperliquid in a more regulated way.
But there’s still an important line users need to understand.
Yan confirmed that Americans using VPNs to access Hyperliquid are violating the platform’s terms.
So this isn’t a green light for U.S. users just yet.
The bigger question is whether regulators, especially the CFTC, can create a clear framework for onchain trading.
If that clarity comes, Hyperliquid could become one of the most interesting bridges between crypto-native markets and traditional finance.
The next chapter may depend less on the blockchain itself — and more on how regulators decide to treat the businesses building markets on top of it.


1
642
·
--
Bullish
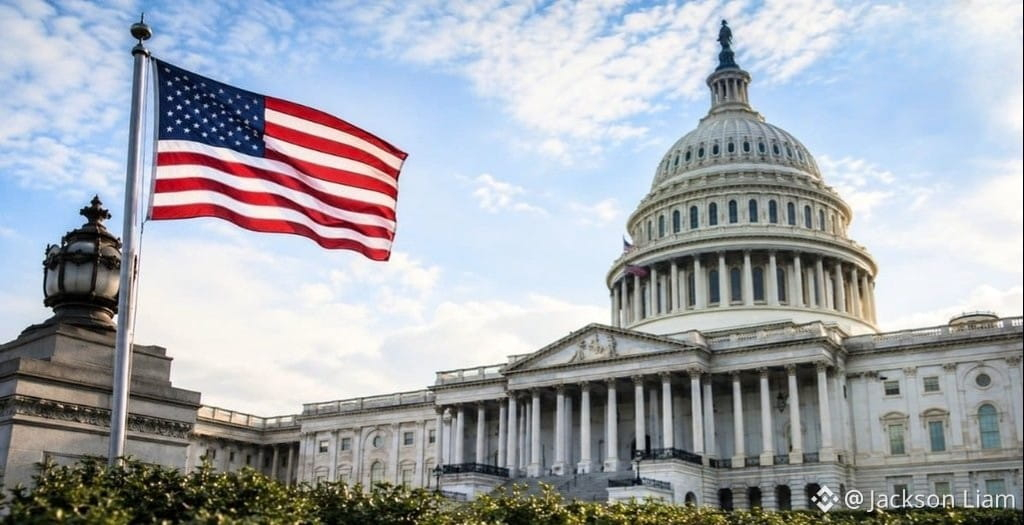
🚨 JPMORGAN JUST DROPPED A BIG WARNING FOR CRYPTO
The failure of the CLARITY Act may not be the end of the story — but it leaves the U.S. crypto market standing on shaky ground.
JPMorgan says recent moves from the SEC and CFTC have helped soften the blow.
The SEC is opening new doors for crypto innovation, while the CFTC is exploring ways to bring leveraged crypto trading onto regulated U.S. platforms.
That could mean more institutional money, deeper liquidity and more activity moving onshore.
But there’s a catch…
Without a clear law from Congress, crypto regulation is still being built piece by piece.
And JPMorgan’s biggest concern is POLITICAL RISK.
If a Democratic administration takes the White House in 2028, some of these agency-led policies could potentially be rolled back within just two years.
That means the industry could be gaining regulatory ground today… only to see parts of it changed tomorrow.
The message from JPMorgan is pretty simple:
Agency action can help crypto grow in the short term.
But only lasting legislation can give the industry real certainty.
For Bitcoin and the broader crypto market, this could become one of the biggest stories to watch over the next two years.
The battle isn’t just about prices anymore.
It’s about who gets to write the rules. ⚡
🚨 JPMORGAN JUST DROPPED A BIG WARNING FOR CRYPTO
The failure of the CLARITY Act may not be the end of the story — but it leaves the U.S. crypto market standing on shaky ground.
JPMorgan says recent moves from the SEC and CFTC have helped soften the blow.
The SEC is opening new doors for crypto innovation, while the CFTC is exploring ways to bring leveraged crypto trading onto regulated U.S. platforms.
That could mean more institutional money, deeper liquidity and more activity moving onshore.
But there’s a catch…
Without a clear law from Congress, crypto regulation is still being built piece by piece.
And JPMorgan’s biggest concern is POLITICAL RISK.
If a Democratic administration takes the White House in 2028, some of these agency-led policies could potentially be rolled back within just two years.
That means the industry could be gaining regulatory ground today… only to see parts of it changed tomorrow.
The message from JPMorgan is pretty simple:
Agency action can help crypto grow in the short term.
But only lasting legislation can give the industry real certainty.
For Bitcoin and the broader crypto market, this could become one of the biggest stories to watch over the next two years.
The battle isn’t just about prices anymore.
It’s about who gets to write the rules. ⚡
The failure of the CLARITY Act may not be the end of the story — but it leaves the U.S. crypto market standing on shaky ground.
JPMorgan says recent moves from the SEC and CFTC have helped soften the blow.
The SEC is opening new doors for crypto innovation, while the CFTC is exploring ways to bring leveraged crypto trading onto regulated U.S. platforms.
That could mean more institutional money, deeper liquidity and more activity moving onshore.
But there’s a catch…
Without a clear law from Congress, crypto regulation is still being built piece by piece.
And JPMorgan’s biggest concern is POLITICAL RISK.
If a Democratic administration takes the White House in 2028, some of these agency-led policies could potentially be rolled back within just two years.
That means the industry could be gaining regulatory ground today… only to see parts of it changed tomorrow.
The message from JPMorgan is pretty simple:
Agency action can help crypto grow in the short term.
But only lasting legislation can give the industry real certainty.
For Bitcoin and the broader crypto market, this could become one of the biggest stories to watch over the next two years.
The battle isn’t just about prices anymore.
It’s about who gets to write the rules. ⚡
3
2.6k
·
--
Bullish
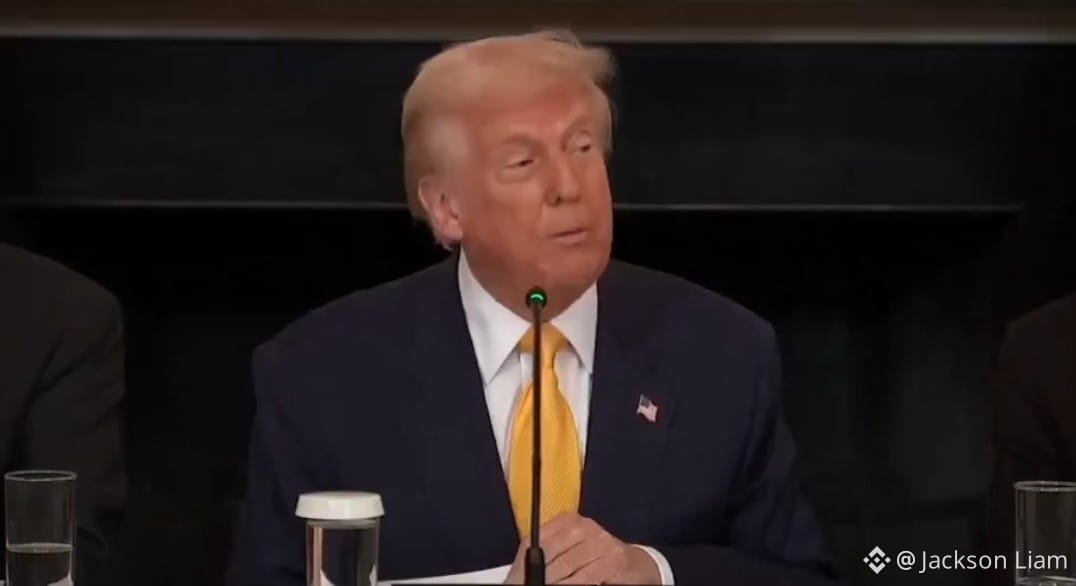
🚨 THIS IS BIG FOR BITCOIN 🇺🇸₿
President Donald Trump made his position crystal clear:
The U.S. government sold tens of thousands of Bitcoin in recent years — Bitcoin that would be worth billions today.
And Trump’s message going forward?
“Never sell your Bitcoin.”
That one line says a lot.
The U.S. is no longer treating Bitcoin like just another asset sitting on the sidelines. Trump has pushed for America to build a strategic Bitcoin reserve and has argued that the country should keep the Bitcoin it holds rather than sell it.
Think about the bigger picture:
🇺🇸 The U.S. wants to strengthen its position in crypto
₿ Bitcoin is being discussed as a strategic asset
🏦 Government Bitcoin holdings are getting more attention
💰 And the old “sell the $BTC ” mindset is being challenged
For years, Bitcoiners have repeated one simple rule:
Never sell your Bitcoin.
Now those words are coming from the White House.
Whether you’re bullish or bearish, one thing is becoming harder to ignore:
Bitcoin is no longer a conversation happening only inside the crypto community.
The biggest institutions and governments are paying attention.
And the game is changing. ⚡₿
🚨 THIS IS BIG FOR BITCOIN 🇺🇸₿
President Donald Trump made his position crystal clear:
The U.S. government sold tens of thousands of Bitcoin in recent years — Bitcoin that would be worth billions today.
And Trump’s message going forward?
“Never sell your Bitcoin.”
That one line says a lot.
The U.S. is no longer treating Bitcoin like just another asset sitting on the sidelines. Trump has pushed for America to build a strategic Bitcoin reserve and has argued that the country should keep the Bitcoin it holds rather than sell it.
Think about the bigger picture:
🇺🇸 The U.S. wants to strengthen its position in crypto
₿ Bitcoin is being discussed as a strategic asset
🏦 Government Bitcoin holdings are getting more attention
💰 And the old “sell the $BTC ” mindset is being challenged
For years, Bitcoiners have repeated one simple rule:
Never sell your Bitcoin.
Now those words are coming from the White House.
Whether you’re bullish or bearish, one thing is becoming harder to ignore:
Bitcoin is no longer a conversation happening only inside the crypto community.
The biggest institutions and governments are paying attention.
And the game is changing. ⚡₿
President Donald Trump made his position crystal clear:
The U.S. government sold tens of thousands of Bitcoin in recent years — Bitcoin that would be worth billions today.
And Trump’s message going forward?
“Never sell your Bitcoin.”
That one line says a lot.
The U.S. is no longer treating Bitcoin like just another asset sitting on the sidelines. Trump has pushed for America to build a strategic Bitcoin reserve and has argued that the country should keep the Bitcoin it holds rather than sell it.
Think about the bigger picture:
🇺🇸 The U.S. wants to strengthen its position in crypto
₿ Bitcoin is being discussed as a strategic asset
🏦 Government Bitcoin holdings are getting more attention
💰 And the old “sell the $BTC ” mindset is being challenged
For years, Bitcoiners have repeated one simple rule:
Never sell your Bitcoin.
Now those words are coming from the White House.
Whether you’re bullish or bearish, one thing is becoming harder to ignore:
Bitcoin is no longer a conversation happening only inside the crypto community.
The biggest institutions and governments are paying attention.
And the game is changing. ⚡₿
1
1
10
5.5k
·
--
Bullish
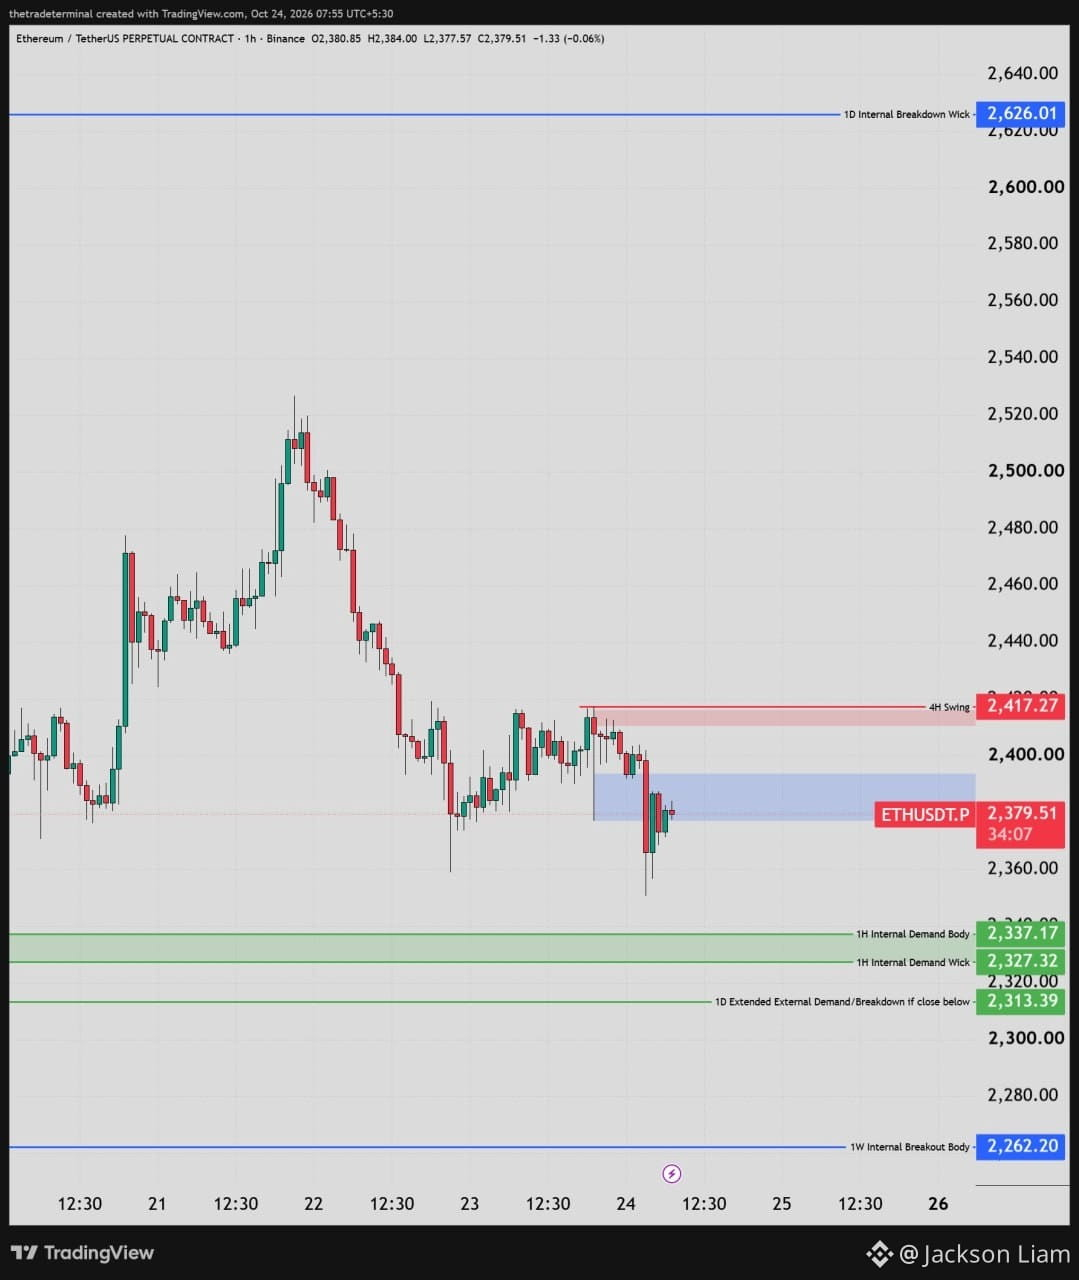
I can see the $ETH / 1-hour chart. The key levels shown are:
Current price: ~2,379.5
Resistance: 2,417.27
1H demand: 2,337.17–2,327.32
Lower breakdown level: 2,313.39
Major lower level: 2,262.20
Upper target/resistance: 2,626.01
Price is currently below the marked 1H supply/resistance area around 2,417, so that level is important for a bullish recovery. The 2,337–2,327 demand zone is the nearest major support visible on your chart.
#ETH #BinancePick #EarningsSeason #PepeJumps14%ToLeadAltcoinRebound #IRSPlansLowerTaxDisclosurePenaltiesForCryptoCases
I can see the $ETH / 1-hour chart. The key levels shown are:
Current price: ~2,379.5
Resistance: 2,417.27
1H demand: 2,337.17–2,327.32
Lower breakdown level: 2,313.39
Major lower level: 2,262.20
Upper target/resistance: 2,626.01
Price is currently below the marked 1H supply/resistance area around 2,417, so that level is important for a bullish recovery. The 2,337–2,327 demand zone is the nearest major support visible on your chart.
#ETH #BinancePick #EarningsSeason #PepeJumps14%ToLeadAltcoinRebound #IRSPlansLowerTaxDisclosurePenaltiesForCryptoCases
Current price: ~2,379.5
Resistance: 2,417.27
1H demand: 2,337.17–2,327.32
Lower breakdown level: 2,313.39
Major lower level: 2,262.20
Upper target/resistance: 2,626.01
Price is currently below the marked 1H supply/resistance area around 2,417, so that level is important for a bullish recovery. The 2,337–2,327 demand zone is the nearest major support visible on your chart.
#ETH #BinancePick #EarningsSeason #PepeJumps14%ToLeadAltcoinRebound #IRSPlansLowerTaxDisclosurePenaltiesForCryptoCases
134
·
--
Bullish
Verified
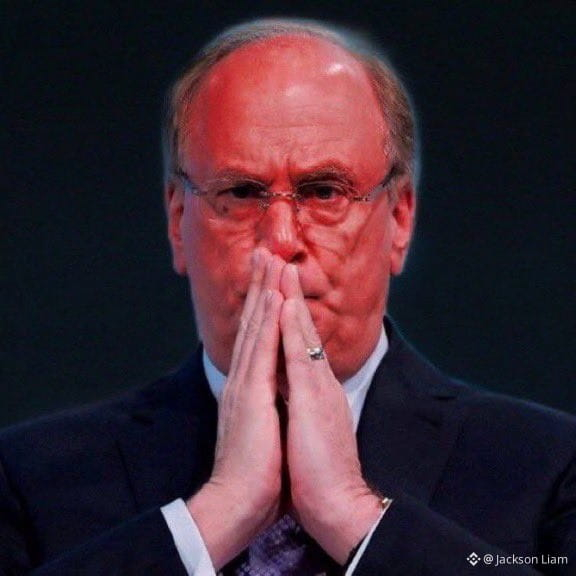
🚨 BREAKING: BlackRock’s Bitcoin ETF is facing serious selling pressure.
Around $115 million worth of Bitcoin is being talked about in connection with BlackRock’s ETF activity, putting the market on alert.
And this matters.
BlackRock’s iShares Bitcoin Trust (IBIT) is one of the biggest spot Bitcoin ETFs in the world. When money moves out of a fund this large, traders immediately start asking one question:
Is Wall Street taking some money off the table?
Recent data already shows IBIT has been hit by major outflows, including about $165.4 million for the week ending October 16.
But here’s the important part:
One big outflow does not automatically mean BlackRock is abandoning Bitcoin.
ETF flows can change because of profit-taking, investor withdrawals, portfolio rebalancing, or normal market activity.
Still, the message is clear:
Big money is moving.
Now all eyes are on Bitcoin.
Will this selling pressure push $BTC lower?
Or will buyers step in and absorb the supply?
The next few trading sessions could get very interesting. 👀
Bitcoin is no longer just a crypto story.
Wall Street is watching. And when Wall Street moves, the entire market feels it.
🚨 BREAKING: BlackRock’s Bitcoin ETF is facing serious selling pressure.
Around $115 million worth of Bitcoin is being talked about in connection with BlackRock’s ETF activity, putting the market on alert.
And this matters.
BlackRock’s iShares Bitcoin Trust (IBIT) is one of the biggest spot Bitcoin ETFs in the world. When money moves out of a fund this large, traders immediately start asking one question:
Is Wall Street taking some money off the table?
Recent data already shows IBIT has been hit by major outflows, including about $165.4 million for the week ending October 16.
But here’s the important part:
One big outflow does not automatically mean BlackRock is abandoning Bitcoin.
ETF flows can change because of profit-taking, investor withdrawals, portfolio rebalancing, or normal market activity.
Still, the message is clear:
Big money is moving.
Now all eyes are on Bitcoin.
Will this selling pressure push $BTC lower?
Or will buyers step in and absorb the supply?
The next few trading sessions could get very interesting. 👀
Bitcoin is no longer just a crypto story.
Wall Street is watching. And when Wall Street moves, the entire market feels it.
Around $115 million worth of Bitcoin is being talked about in connection with BlackRock’s ETF activity, putting the market on alert.
And this matters.
BlackRock’s iShares Bitcoin Trust (IBIT) is one of the biggest spot Bitcoin ETFs in the world. When money moves out of a fund this large, traders immediately start asking one question:
Is Wall Street taking some money off the table?
Recent data already shows IBIT has been hit by major outflows, including about $165.4 million for the week ending October 16.
But here’s the important part:
One big outflow does not automatically mean BlackRock is abandoning Bitcoin.
ETF flows can change because of profit-taking, investor withdrawals, portfolio rebalancing, or normal market activity.
Still, the message is clear:
Big money is moving.
Now all eyes are on Bitcoin.
Will this selling pressure push $BTC lower?
Or will buyers step in and absorb the supply?
The next few trading sessions could get very interesting. 👀
Bitcoin is no longer just a crypto story.
Wall Street is watching. And when Wall Street moves, the entire market feels it.
3
3
1k
·
--
Bullish
ORDER
Breakout momentum is strong, but don’t chase the spike. Wait for the pullback and confirmation.
Buy Zone: 0.0740 – 0.0800
EP: 0.0770
TP1: 0.0905
TP2: 0.1032
TP3: 0.1150
SL: 0.0690
Let’s go $ORDER
{future}(ORDERUSDT)
$IRYS
{future}(IRYSUSDT)
$BIRB
{future}(BIRBUSDT)
ORDER
Breakout momentum is strong, but don’t chase the spike. Wait for the pullback and confirmation.
Buy Zone: 0.0740 – 0.0800
EP: 0.0770
TP1: 0.0905
TP2: 0.1032
TP3: 0.1150
SL: 0.0690
Let’s go $ORDER
$IRYS
$BIRB
Breakout momentum is strong, but don’t chase the spike. Wait for the pullback and confirmation.
Buy Zone: 0.0740 – 0.0800
EP: 0.0770
TP1: 0.0905
TP2: 0.1032
TP3: 0.1150
SL: 0.0690
Let’s go $ORDER
$IRYS
$BIRB
🚀 Buy the pullback
72%
🔥 Chase the breakout
0%
🎯 Wait for confirmation
14%
🛑 Stay out
14%
7 votes • Voting closed
1
810
·
--
Article
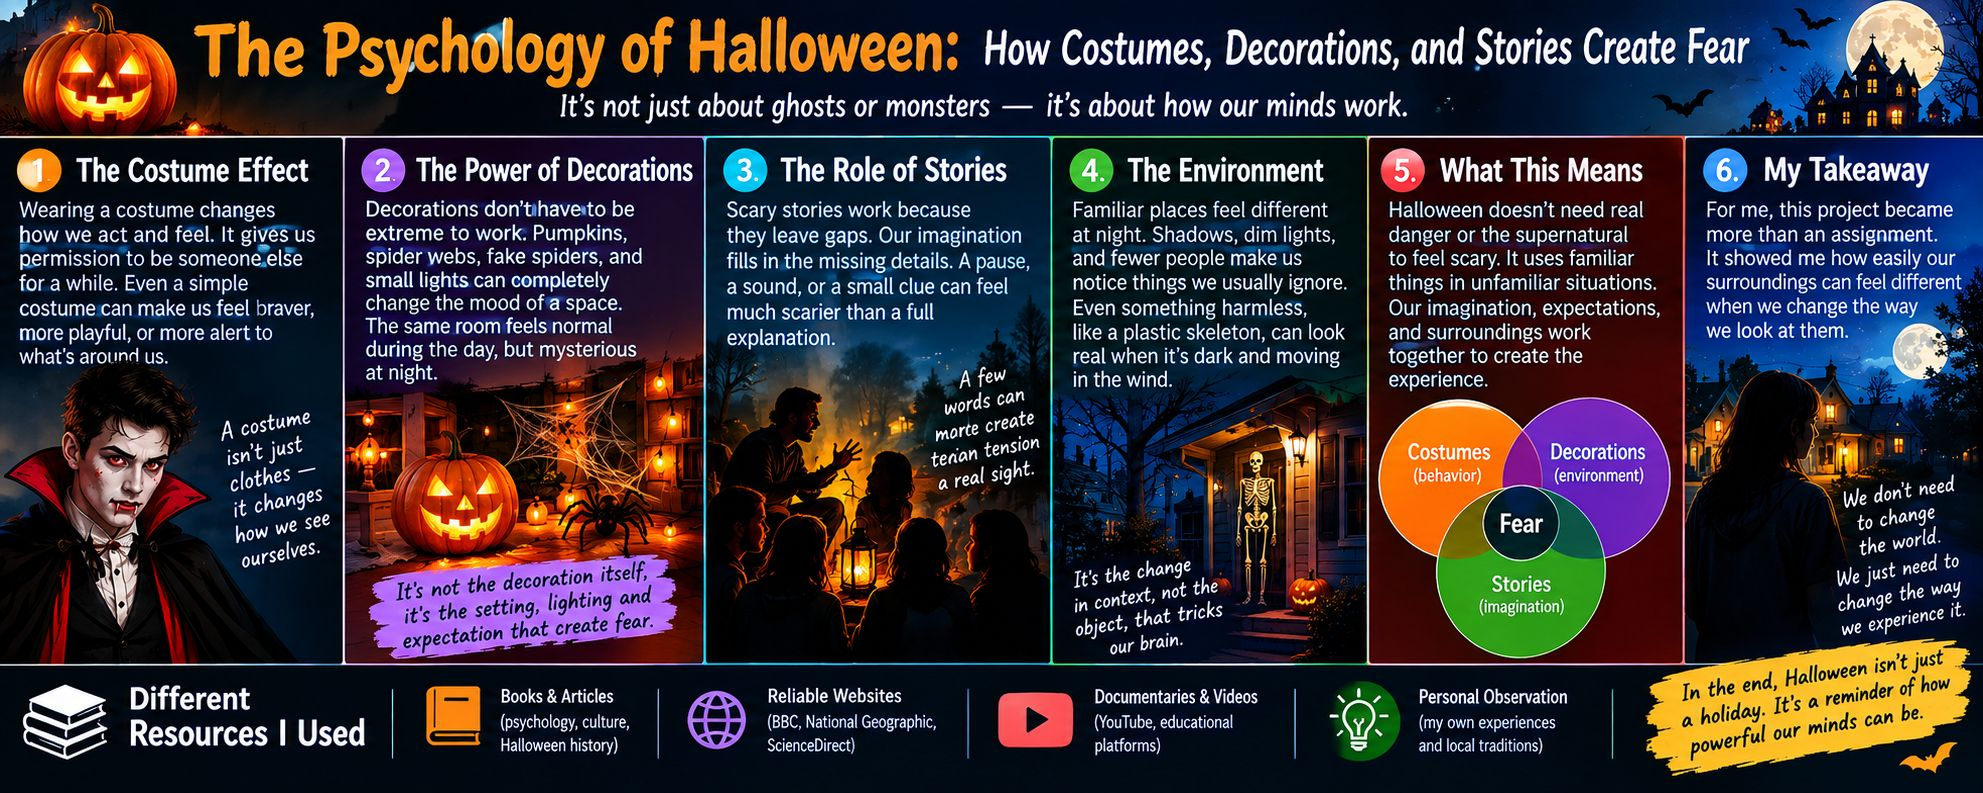
The Psychology of Halloween How Costumes, Decorations, and Stories Create FearI’ve been thinking about Halloween for this project, and I keep coming back to how different an ordinary evening can feel when everything around you is changed just a little. Halloween is usually associated with costumes, decorations, sweets, and scary stories, but when I started paying closer attention, I realized that the most interesting part is the atmosphere these things create together.
For my Halloween experience, I decided to focus on a simple vampire costume. I chose it because it was easy to put together but still had the traditional Halloween feeling. I wore dark clothes, a cape, pale makeup, and added a small amount of fake blood to make the costume look more realistic. I remember spending quite a bit of time getting the details right. At first, I was mainly interested in how the costume looked, but later I realized that dressing up changes the way a person behaves too. Wearing a costume makes it easier to act differently, joke around, and become part of the Halloween atmosphere.
Decorating was another important part of my project. I did not need expensive or complicated decorations. I used pumpkins, paper bats, artificial spider webs, and small lights. These simple things were enough to make familiar rooms look different. During the day, the decorations looked ordinary and sometimes even funny. Once it became dark, however, they created a completely different feeling.
This made me think about why decorations can seem scary even though we know they are not real. A fake spider is not frightening when it is sitting in a bright room where everyone can see it clearly. Put the same spider in a dark corner, and a person may react differently. The object has not changed. What has changed is the setting and the person's expectations. That was one of the most interesting things I noticed while working on this project.
The evening itself became more enjoyable as it got darker. People were dressed in different costumes, and the decorations outside made the familiar surroundings look unusual. Houses that normally looked almost identical seemed to have their own personalities. Some had pumpkins near the doors, while others had hanging decorations or lights around the windows.
I also noticed how much darkness affected the way I experienced the neighborhood. I knew the streets and houses well, so there was nothing genuinely unfamiliar about them. Still, shadows looked longer, small sounds seemed louder, and places that normally felt completely safe suddenly seemed mysterious. I knew there was usually a simple explanation for everything, but that did not stop my imagination from creating possibilities.
One of my favorite parts of Halloween was listening to spooky stories. We sat together and shared stories about strange noises, empty houses, mysterious people, and unexplained events. Most of the stories were obviously made up, but they were still fun to hear. What made them effective was not necessarily the story itself. It was the way the story was told.
A pause at the right moment could make everyone quiet. A strange sound from another room could suddenly become part of the experience. Even when we knew that something was probably ordinary, we still wondered about it for a moment. I found this interesting because it showed how easily imagination can influence our perception.
There was one small moment that I remember particularly well. I saw a plastic skeleton hanging outside a house. Earlier in the evening, it had looked completely fake and harmless. Later, when it was dark, the skeleton moved slightly in the wind. Only part of it was visible under the light near the entrance. For a few seconds, it looked surprisingly realistic. I knew exactly what it was, but I still looked at it twice.
That moment helped me understand something important about Halloween. It does not need real ghosts or supernatural events to create suspense. Instead, it takes ordinary things and places them in unusual surroundings. Darkness, costumes, decorations, and stories work together to make familiar things seem unfamiliar.
By the end of the night, everything returned to normal. The costume came off, the lights were turned back on, and the house looked like it always did. The decorations were still there, but they no longer had the same effect. What had seemed mysterious a few hours earlier was now completely ordinary.
Working on this project made me realize that my favorite part of Halloween is not necessarily the frightening side of it. It is the creativity and imagination behind it. People can take simple materials, ordinary clothes, and familiar surroundings and turn them into something different for one evening.
That is what I wanted my project to show. Halloween is not only about trying to scare people. It is also about creating an atmosphere, sharing experiences, and seeing familiar things from a different perspective. Sometimes nothing around us actually changes. We simply look at it differently, and that can be enough to make an ordinary night memorable.
#SEAPumpkinFrenzy #Binance #BinanceSquare #Halloween #CryptoCommunity
$IRYS $BIRB $IN
The Psychology of Halloween How Costumes, Decorations, and Stories Create Fear
I’ve been thinking about Halloween for this project, and I keep coming back to how different an ordinary evening can feel when everything around you is changed just a little. Halloween is usually associated with costumes, decorations, sweets, and scary stories, but when I started paying closer attention, I realized that the most interesting part is the atmosphere these things create together.
For my Halloween experience, I decided to focus on a simple vampire costume. I chose it because it was easy to put together but still had the traditional Halloween feeling. I wore dark clothes, a cape, pale makeup, and added a small amount of fake blood to make the costume look more realistic. I remember spending quite a bit of time getting the details right. At first, I was mainly interested in how the costume looked, but later I realized that dressing up changes the way a person behaves too. Wearing a costume makes it easier to act differently, joke around, and become part of the Halloween atmosphere.
Decorating was another important part of my project. I did not need expensive or complicated decorations. I used pumpkins, paper bats, artificial spider webs, and small lights. These simple things were enough to make familiar rooms look different. During the day, the decorations looked ordinary and sometimes even funny. Once it became dark, however, they created a completely different feeling.
This made me think about why decorations can seem scary even though we know they are not real. A fake spider is not frightening when it is sitting in a bright room where everyone can see it clearly. Put the same spider in a dark corner, and a person may react differently. The object has not changed. What has changed is the setting and the person's expectations. That was one of the most interesting things I noticed while working on this project.
The evening itself became more enjoyable as it got darker. People were dressed in different costumes, and the decorations outside made the familiar surroundings look unusual. Houses that normally looked almost identical seemed to have their own personalities. Some had pumpkins near the doors, while others had hanging decorations or lights around the windows.
I also noticed how much darkness affected the way I experienced the neighborhood. I knew the streets and houses well, so there was nothing genuinely unfamiliar about them. Still, shadows looked longer, small sounds seemed louder, and places that normally felt completely safe suddenly seemed mysterious. I knew there was usually a simple explanation for everything, but that did not stop my imagination from creating possibilities.
One of my favorite parts of Halloween was listening to spooky stories. We sat together and shared stories about strange noises, empty houses, mysterious people, and unexplained events. Most of the stories were obviously made up, but they were still fun to hear. What made them effective was not necessarily the story itself. It was the way the story was told.
A pause at the right moment could make everyone quiet. A strange sound from another room could suddenly become part of the experience. Even when we knew that something was probably ordinary, we still wondered about it for a moment. I found this interesting because it showed how easily imagination can influence our perception.
There was one small moment that I remember particularly well. I saw a plastic skeleton hanging outside a house. Earlier in the evening, it had looked completely fake and harmless. Later, when it was dark, the skeleton moved slightly in the wind. Only part of it was visible under the light near the entrance. For a few seconds, it looked surprisingly realistic. I knew exactly what it was, but I still looked at it twice.
That moment helped me understand something important about Halloween. It does not need real ghosts or supernatural events to create suspense. Instead, it takes ordinary things and places them in unusual surroundings. Darkness, costumes, decorations, and stories work together to make familiar things seem unfamiliar.
By the end of the night, everything returned to normal. The costume came off, the lights were turned back on, and the house looked like it always did. The decorations were still there, but they no longer had the same effect. What had seemed mysterious a few hours earlier was now completely ordinary.
Working on this project made me realize that my favorite part of Halloween is not necessarily the frightening side of it. It is the creativity and imagination behind it. People can take simple materials, ordinary clothes, and familiar surroundings and turn them into something different for one evening.
That is what I wanted my project to show. Halloween is not only about trying to scare people. It is also about creating an atmosphere, sharing experiences, and seeing familiar things from a different perspective. Sometimes nothing around us actually changes. We simply look at it differently, and that can be enough to make an ordinary night memorable.
#SEAPumpkinFrenzy #Binance #BinanceSquare #Halloween #CryptoCommunity
$IRYS $BIRB $IN
For my Halloween experience, I decided to focus on a simple vampire costume. I chose it because it was easy to put together but still had the traditional Halloween feeling. I wore dark clothes, a cape, pale makeup, and added a small amount of fake blood to make the costume look more realistic. I remember spending quite a bit of time getting the details right. At first, I was mainly interested in how the costume looked, but later I realized that dressing up changes the way a person behaves too. Wearing a costume makes it easier to act differently, joke around, and become part of the Halloween atmosphere.
Decorating was another important part of my project. I did not need expensive or complicated decorations. I used pumpkins, paper bats, artificial spider webs, and small lights. These simple things were enough to make familiar rooms look different. During the day, the decorations looked ordinary and sometimes even funny. Once it became dark, however, they created a completely different feeling.
This made me think about why decorations can seem scary even though we know they are not real. A fake spider is not frightening when it is sitting in a bright room where everyone can see it clearly. Put the same spider in a dark corner, and a person may react differently. The object has not changed. What has changed is the setting and the person's expectations. That was one of the most interesting things I noticed while working on this project.
The evening itself became more enjoyable as it got darker. People were dressed in different costumes, and the decorations outside made the familiar surroundings look unusual. Houses that normally looked almost identical seemed to have their own personalities. Some had pumpkins near the doors, while others had hanging decorations or lights around the windows.
I also noticed how much darkness affected the way I experienced the neighborhood. I knew the streets and houses well, so there was nothing genuinely unfamiliar about them. Still, shadows looked longer, small sounds seemed louder, and places that normally felt completely safe suddenly seemed mysterious. I knew there was usually a simple explanation for everything, but that did not stop my imagination from creating possibilities.
One of my favorite parts of Halloween was listening to spooky stories. We sat together and shared stories about strange noises, empty houses, mysterious people, and unexplained events. Most of the stories were obviously made up, but they were still fun to hear. What made them effective was not necessarily the story itself. It was the way the story was told.
A pause at the right moment could make everyone quiet. A strange sound from another room could suddenly become part of the experience. Even when we knew that something was probably ordinary, we still wondered about it for a moment. I found this interesting because it showed how easily imagination can influence our perception.
There was one small moment that I remember particularly well. I saw a plastic skeleton hanging outside a house. Earlier in the evening, it had looked completely fake and harmless. Later, when it was dark, the skeleton moved slightly in the wind. Only part of it was visible under the light near the entrance. For a few seconds, it looked surprisingly realistic. I knew exactly what it was, but I still looked at it twice.
That moment helped me understand something important about Halloween. It does not need real ghosts or supernatural events to create suspense. Instead, it takes ordinary things and places them in unusual surroundings. Darkness, costumes, decorations, and stories work together to make familiar things seem unfamiliar.
By the end of the night, everything returned to normal. The costume came off, the lights were turned back on, and the house looked like it always did. The decorations were still there, but they no longer had the same effect. What had seemed mysterious a few hours earlier was now completely ordinary.
Working on this project made me realize that my favorite part of Halloween is not necessarily the frightening side of it. It is the creativity and imagination behind it. People can take simple materials, ordinary clothes, and familiar surroundings and turn them into something different for one evening.
That is what I wanted my project to show. Halloween is not only about trying to scare people. It is also about creating an atmosphere, sharing experiences, and seeing familiar things from a different perspective. Sometimes nothing around us actually changes. We simply look at it differently, and that can be enough to make an ordinary night memorable.
#SEAPumpkinFrenzy #Binance #BinanceSquare #Halloween #CryptoCommunity
$IRYS $BIRB $IN
41
25
2k
Log in to explore more content
Join global crypto users on Binance Square
⚡️ Get latest and useful information about crypto.
💬 Trusted by the world’s largest crypto exchange.
👍 Discover real insights from verified creators.
Email / Phone number
Trending Topics
BinancePick
2.6M views
141,579 Discussing
Join #EarningsSeason: Predict Earnings on Binance Pick, Share Your Take on Binance Square!
Binance Square Official
·401 Likes
·338.5k views
EarningsSeason
5M views
24,354 Discussing
FranklinTempletonFilesForTwoDividendToBitcoinETFs
1,564 views
93 Discussing