

Number 4
32 Posts

Number 4
Report
Block User
6 Following
8 Followers
47 Liked
Posts
All
Quotes
·
--
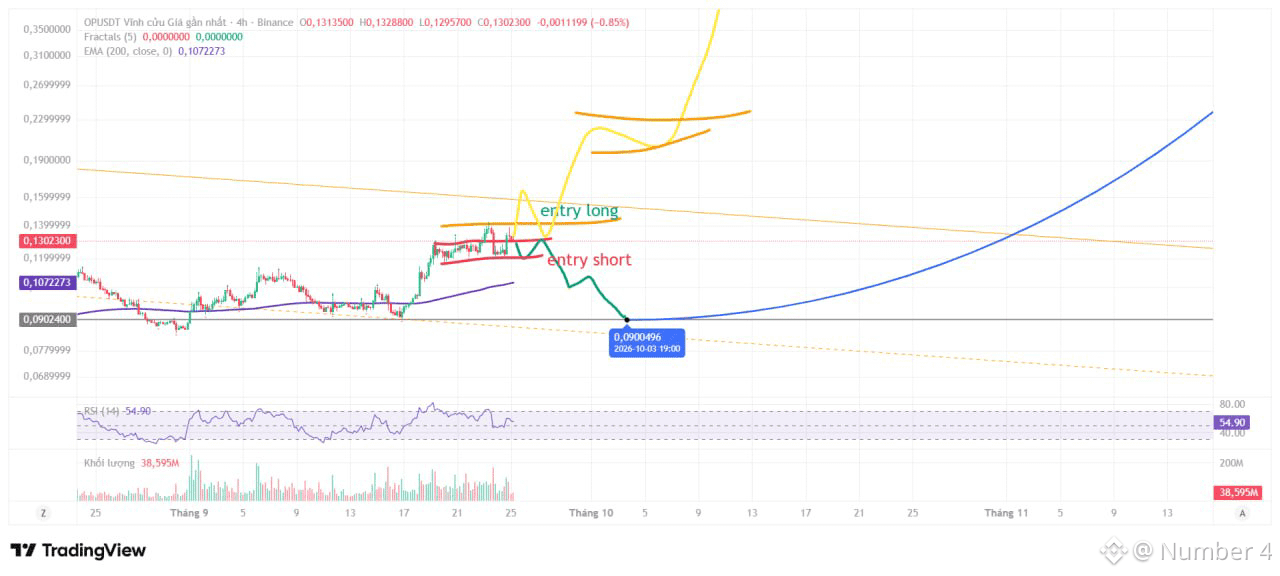
$OP Here are 2 detailed trading scenarios under specific price-action conditions:
1. Short Scenario (Trade the breakdown / Breakdown)
Confirmation condition: Wait for the price to execute a breakdown through key support zones, then reverse after a failed retest (not holding the price zone below).
Short Entry Zone: Enter when the price rejects at retracement rebounds that fail to produce a successful retest.
Target (TP): Directly target the liquidity zone below at the $0.09 mark.
Stop Loss (SL): Place immediately above the nearest resistance/retest zone.
2. Long Scenario (Follow the main trend / Trend Following)
Confirmation condition: Be patient and wait for a clear breakout that pushes up into the 0.16xx zone, then have a pullback retracing back to a successful retest at 0.13.
Long Entry Zone: Buy when the price retests the $0.13 zone and provides a hold signal, then turns back upward following the trend.
Target (TP): Expand the move toward higher resistance zones on the medium term.
Stop Loss (SL): Place immediately below the 0.13 retest support zone to protect capital.
📌 Trading discipline: The market is always right—we only react according to the market. Don’t FOMO chase the price when there hasn’t been a successful retest confirmation!
What do you think about this technical setup? Let’s discuss in the comments below!
#OP OP #BinanceSquare #CryptoTradingInsights #PriceActionAnalysis #TrendFollowing
$OP Here are 2 detailed trading scenarios under specific price-action conditions:
1. Short Scenario (Trade the breakdown / Breakdown)
Confirmation condition: Wait for the price to execute a breakdown through key support zones, then reverse after a failed retest (not holding the price zone below).
Short Entry Zone: Enter when the price rejects at retracement rebounds that fail to produce a successful retest.
Target (TP): Directly target the liquidity zone below at the $0.09 mark.
Stop Loss (SL): Place immediately above the nearest resistance/retest zone.
2. Long Scenario (Follow the main trend / Trend Following)
Confirmation condition: Be patient and wait for a clear breakout that pushes up into the 0.16xx zone, then have a pullback retracing back to a successful retest at 0.13.
Long Entry Zone: Buy when the price retests the $0.13 zone and provides a hold signal, then turns back upward following the trend.
Target (TP): Expand the move toward higher resistance zones on the medium term.
Stop Loss (SL): Place immediately below the 0.13 retest support zone to protect capital.
📌 Trading discipline: The market is always right—we only react according to the market. Don’t FOMO chase the price when there hasn’t been a successful retest confirmation!
What do you think about this technical setup? Let’s discuss in the comments below!
#OP OP #BinanceSquare #CryptoTradingInsights #PriceActionAnalysis #TrendFollowing
1. Short Scenario (Trade the breakdown / Breakdown)
Confirmation condition: Wait for the price to execute a breakdown through key support zones, then reverse after a failed retest (not holding the price zone below).
Short Entry Zone: Enter when the price rejects at retracement rebounds that fail to produce a successful retest.
Target (TP): Directly target the liquidity zone below at the $0.09 mark.
Stop Loss (SL): Place immediately above the nearest resistance/retest zone.
2. Long Scenario (Follow the main trend / Trend Following)
Confirmation condition: Be patient and wait for a clear breakout that pushes up into the 0.16xx zone, then have a pullback retracing back to a successful retest at 0.13.
Long Entry Zone: Buy when the price retests the $0.13 zone and provides a hold signal, then turns back upward following the trend.
Target (TP): Expand the move toward higher resistance zones on the medium term.
Stop Loss (SL): Place immediately below the 0.13 retest support zone to protect capital.
📌 Trading discipline: The market is always right—we only react according to the market. Don’t FOMO chase the price when there hasn’t been a successful retest confirmation!
What do you think about this technical setup? Let’s discuss in the comments below!
#OP OP #BinanceSquare #CryptoTradingInsights #PriceActionAnalysis #TrendFollowing
1
361
·
--
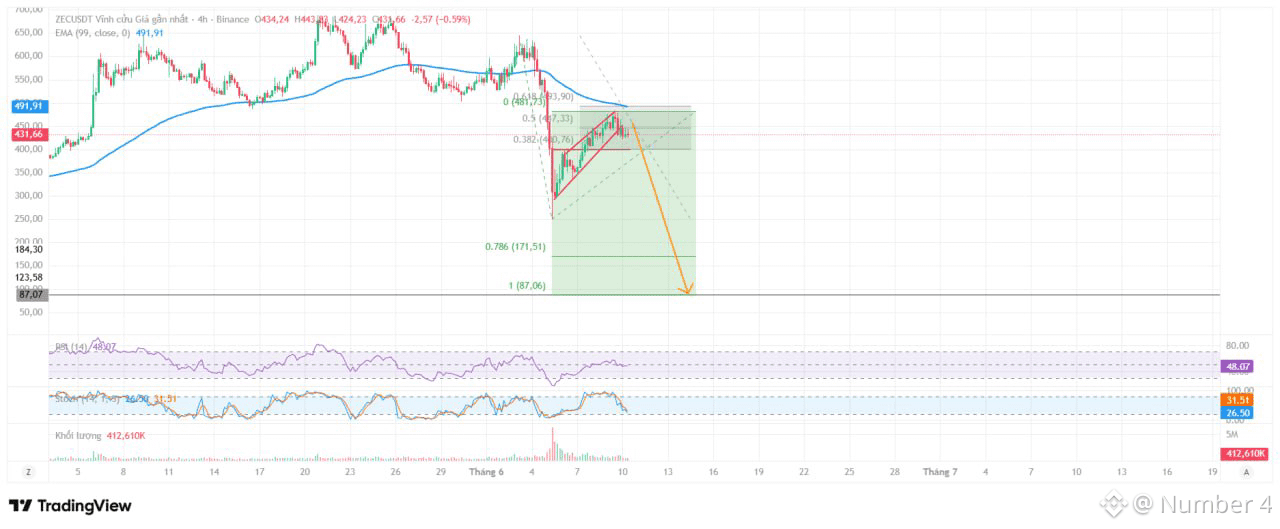
$ZEC What's happening with the price structure?
After hitting a short-term peak at $481, ZEC is correcting and approaching a crucial support zone around $400.
This is the convergence area of:
✅ Important horizontal support
✅ Fibonacci 0.382 at $400.76
✅ Support line from the recovery structure since the bottom at $250
In other words, $400 is the most critical frontline for the bulls.
When is the bearish scenario confirmed?
📉 A clear 4H candlestick closing below $400 with increased volume will be a notable signal.
If that happens:
The current recovery structure is at risk of breaking down.
The Rising Wedge pattern will complete its breakdown.
Lower High at $481 will be confirmed.
Technical targets below
🎯 Target 1: $171 (Fib 0.786)
🎯 Target 2: $87 (Fib Extension 1.0)
These are the technical levels derived from the entire previous downtrend and will only be considered if the $400 zone is lost.
⚠️ The bearish scenario will weaken if ZEC regains the $456 - $481 zone and maintains above this area.
Currently, the market is at a crucial point: $481 has seen selling pressure, while $400 is the deciding zone for whether this is just a correction or the starting point for a deeper drop.
#ZEC #BinanceSquare #CryptoAnalysis #TechnicalAnalysis #ALTCOİNS
$ZEC What's happening with the price structure?
After hitting a short-term peak at $481, ZEC is correcting and approaching a crucial support zone around $400.
This is the convergence area of:
✅ Important horizontal support
✅ Fibonacci 0.382 at $400.76
✅ Support line from the recovery structure since the bottom at $250
In other words, $400 is the most critical frontline for the bulls.
When is the bearish scenario confirmed?
📉 A clear 4H candlestick closing below $400 with increased volume will be a notable signal.
If that happens:
The current recovery structure is at risk of breaking down.
The Rising Wedge pattern will complete its breakdown.
Lower High at $481 will be confirmed.
Technical targets below
🎯 Target 1: $171 (Fib 0.786)
🎯 Target 2: $87 (Fib Extension 1.0)
These are the technical levels derived from the entire previous downtrend and will only be considered if the $400 zone is lost.
⚠️ The bearish scenario will weaken if ZEC regains the $456 - $481 zone and maintains above this area.
Currently, the market is at a crucial point: $481 has seen selling pressure, while $400 is the deciding zone for whether this is just a correction or the starting point for a deeper drop.
#ZEC #BinanceSquare #CryptoAnalysis #TechnicalAnalysis #ALTCOİNS
After hitting a short-term peak at $481, ZEC is correcting and approaching a crucial support zone around $400.
This is the convergence area of:
✅ Important horizontal support
✅ Fibonacci 0.382 at $400.76
✅ Support line from the recovery structure since the bottom at $250
In other words, $400 is the most critical frontline for the bulls.
When is the bearish scenario confirmed?
📉 A clear 4H candlestick closing below $400 with increased volume will be a notable signal.
If that happens:
The current recovery structure is at risk of breaking down.
The Rising Wedge pattern will complete its breakdown.
Lower High at $481 will be confirmed.
Technical targets below
🎯 Target 1: $171 (Fib 0.786)
🎯 Target 2: $87 (Fib Extension 1.0)
These are the technical levels derived from the entire previous downtrend and will only be considered if the $400 zone is lost.
⚠️ The bearish scenario will weaken if ZEC regains the $456 - $481 zone and maintains above this area.
Currently, the market is at a crucial point: $481 has seen selling pressure, while $400 is the deciding zone for whether this is just a correction or the starting point for a deeper drop.
#ZEC #BinanceSquare #CryptoAnalysis #TechnicalAnalysis #ALTCOİNS
1
320
·
--
Article
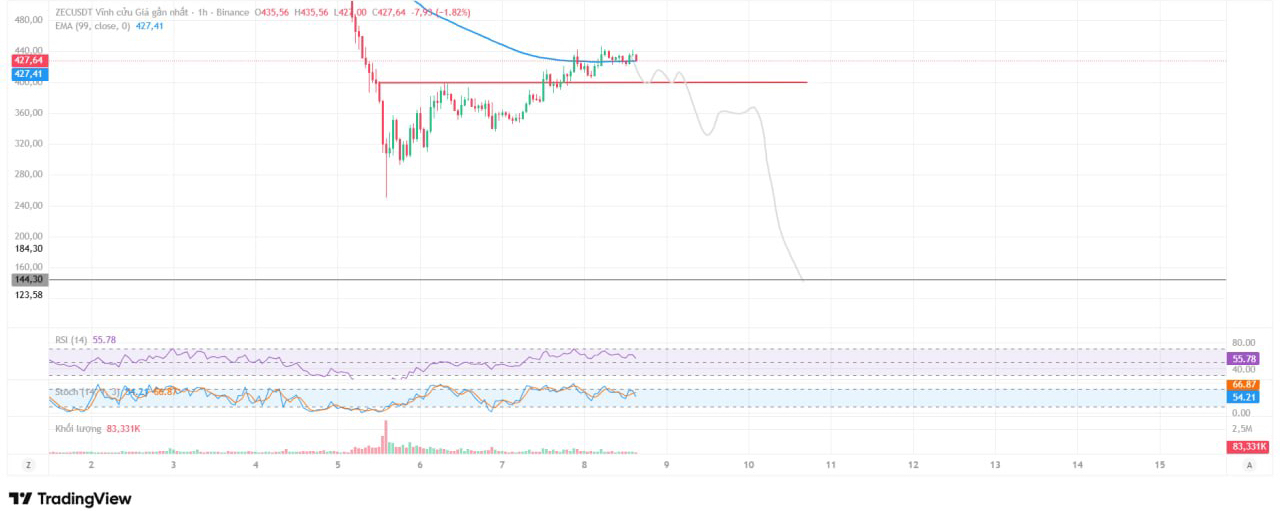
$Zec dead cat bounce?$ZEC ⚠️ Is ZEC forming a Dead Cat Bounce before diving down to 144 USD?
After a heavy drop that saw ZEC lose over half its value in a short span, the bulls staged a notable comeback, pushing the price up from the lows to nearly 446 USD. However, this recovery is showing clear signs of weakness, raising a big question: is this the start of a new bullish trend, or just a Dead Cat Bounce before the downtrend resumes?
$Zec dead cat bounce?
$ZEC ⚠️ Is ZEC forming a Dead Cat Bounce before diving down to 144 USD?
After a heavy drop that saw ZEC lose over half its value in a short span, the bulls staged a notable comeback, pushing the price up from the lows to nearly 446 USD. However, this recovery is showing clear signs of weakness, raising a big question: is this the start of a new bullish trend, or just a Dead Cat Bounce before the downtrend resumes?
After a heavy drop that saw ZEC lose over half its value in a short span, the bulls staged a notable comeback, pushing the price up from the lows to nearly 446 USD. However, this recovery is showing clear signs of weakness, raising a big question: is this the start of a new bullish trend, or just a Dead Cat Bounce before the downtrend resumes?
1
394
·
--
Bearish
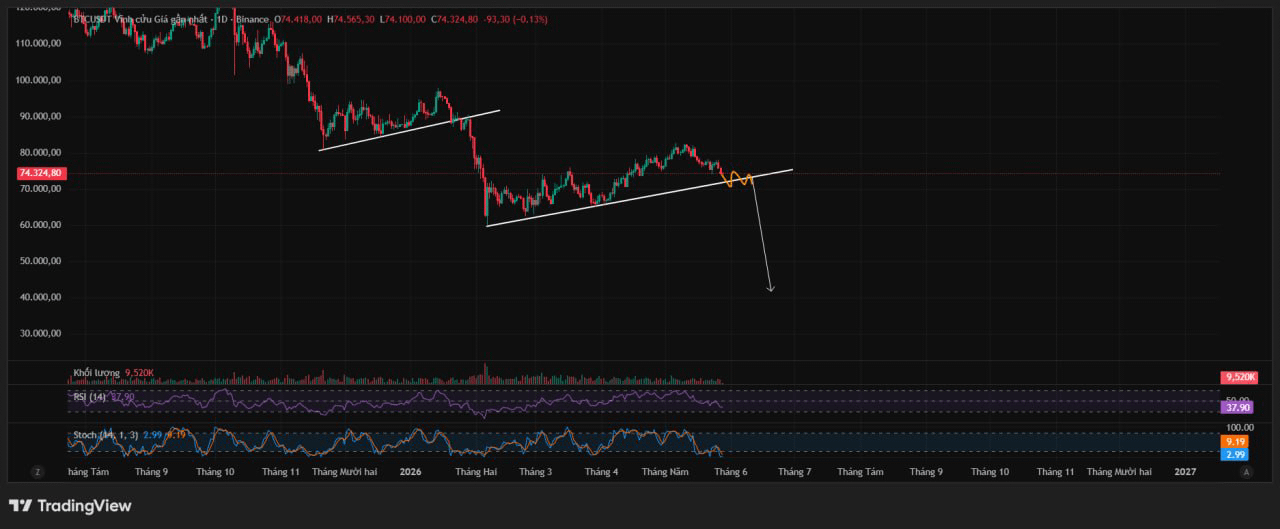
Finally, #BTC has decisively chosen a direction. If we break through 60k, the scenario of a deeper drop, as shown in the chart, will be almost certain. Let’s watch the reaction at this last support level!
Finally, #BTC has decisively chosen a direction. If we break through 60k, the scenario of a deeper drop, as shown in the chart, will be almost certain. Let’s watch the reaction at this last support level!
Number 4
·
--
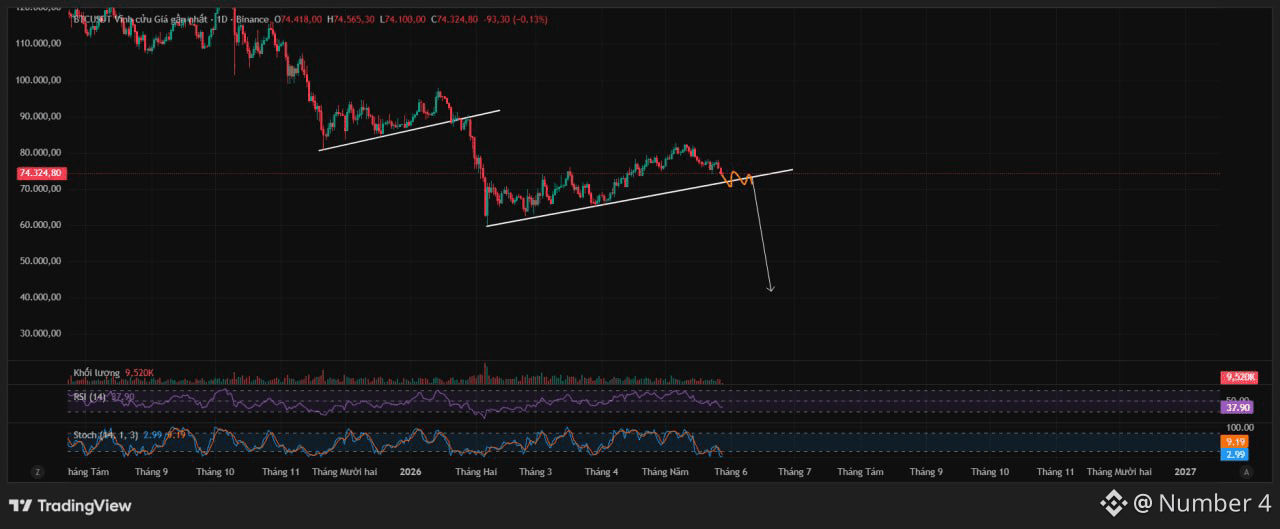
Bearish$BTC is recreating the same pattern before the massive drop earlier this year? 👀
Last time, BTC broke down from a rising wedge and plummeted from ~90k to ~60k.
Currently, a similar structure is forming on the D1 chart:
🔹 Higher lows but weak recovery
🔹 RSI hovering around 37 → momentum still bearish
🔹 Stoch RSI in the lower zone
🔹 Volume decreasing during the bounce
🔹 Price is testing the lower edge of the support trendline
If this trendline gets broken, the likelihood is high that we will see:
⚠️ Long squeeze
⚠️ Panic sell
⚠️ Strong breakdown into lower liquidity zones
The bulls are only truly safe if BTC reclaims the 76k–78k zone with strong volume.
In your opinion, is this:
🐂 A fake breakdown
or
🐻 The start of the next dump?
👇 Comment your views.
🔔 Follow for daily BTC setup updates.#CreatorpadVN #BTCUSDT #crypto #trading #TechnicalAnalysis
Last time, BTC broke down from a rising wedge and plummeted from ~90k to ~60k.
Currently, a similar structure is forming on the D1 chart:
🔹 Higher lows but weak recovery
🔹 RSI hovering around 37 → momentum still bearish
🔹 Stoch RSI in the lower zone
🔹 Volume decreasing during the bounce
🔹 Price is testing the lower edge of the support trendline
If this trendline gets broken, the likelihood is high that we will see:
⚠️ Long squeeze
⚠️ Panic sell
⚠️ Strong breakdown into lower liquidity zones
The bulls are only truly safe if BTC reclaims the 76k–78k zone with strong volume.
In your opinion, is this:
🐂 A fake breakdown
or
🐻 The start of the next dump?
👇 Comment your views.
🔔 Follow for daily BTC setup updates.#CreatorpadVN #BTCUSDT #crypto #trading #TechnicalAnalysis
1
323
·
--
Bearish
$BTC is recreating the same pattern before the massive drop earlier this year? 👀
Last time, BTC broke down from a rising wedge and plummeted from ~90k to ~60k.
Currently, a similar structure is forming on the D1 chart:
🔹 Higher lows but weak recovery
🔹 RSI hovering around 37 → momentum still bearish
🔹 Stoch RSI in the lower zone
🔹 Volume decreasing during the bounce
🔹 Price is testing the lower edge of the support trendline
If this trendline gets broken, the likelihood is high that we will see:
⚠️ Long squeeze
⚠️ Panic sell
⚠️ Strong breakdown into lower liquidity zones
The bulls are only truly safe if BTC reclaims the 76k–78k zone with strong volume.
In your opinion, is this:
🐂 A fake breakdown
or
🐻 The start of the next dump?
👇 Comment your views.
🔔 Follow for daily BTC setup updates.#CreatorpadVN #BTCUSDT #crypto #trading #TechnicalAnalysis
$BTC is recreating the same pattern before the massive drop earlier this year? 👀
Last time, BTC broke down from a rising wedge and plummeted from ~90k to ~60k.
Currently, a similar structure is forming on the D1 chart:
🔹 Higher lows but weak recovery
🔹 RSI hovering around 37 → momentum still bearish
🔹 Stoch RSI in the lower zone
🔹 Volume decreasing during the bounce
🔹 Price is testing the lower edge of the support trendline
If this trendline gets broken, the likelihood is high that we will see:
⚠️ Long squeeze
⚠️ Panic sell
⚠️ Strong breakdown into lower liquidity zones
The bulls are only truly safe if BTC reclaims the 76k–78k zone with strong volume.
In your opinion, is this:
🐂 A fake breakdown
or
🐻 The start of the next dump?
👇 Comment your views.
🔔 Follow for daily BTC setup updates.#CreatorpadVN #BTCUSDT #crypto #trading #TechnicalAnalysis
Last time, BTC broke down from a rising wedge and plummeted from ~90k to ~60k.
Currently, a similar structure is forming on the D1 chart:
🔹 Higher lows but weak recovery
🔹 RSI hovering around 37 → momentum still bearish
🔹 Stoch RSI in the lower zone
🔹 Volume decreasing during the bounce
🔹 Price is testing the lower edge of the support trendline
If this trendline gets broken, the likelihood is high that we will see:
⚠️ Long squeeze
⚠️ Panic sell
⚠️ Strong breakdown into lower liquidity zones
The bulls are only truly safe if BTC reclaims the 76k–78k zone with strong volume.
In your opinion, is this:
🐂 A fake breakdown
or
🐻 The start of the next dump?
👇 Comment your views.
🔔 Follow for daily BTC setup updates.#CreatorpadVN #BTCUSDT #crypto #trading #TechnicalAnalysis
1
1
1
364
·
--
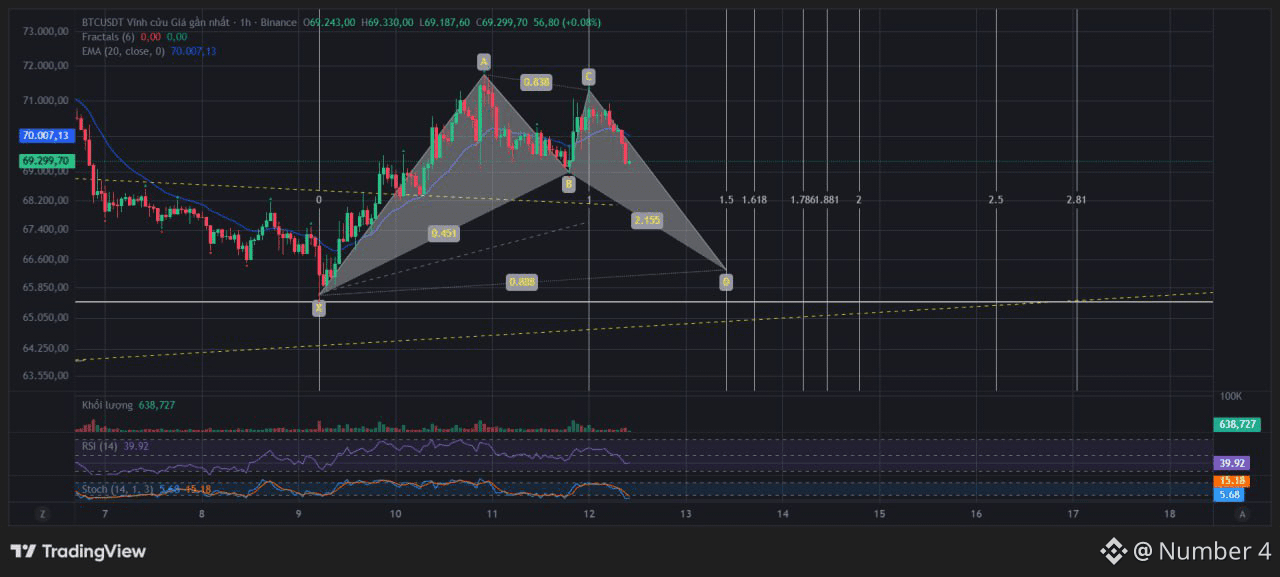
$BTC 1. Definition: This is the Bearish Bat pattern (Bear Bat) standard technical model?
Let's look at the "golden" ratios
Point B (0.451): This is the key. In the Bat pattern, point B must be within the range of 0.382 to 0.50 of segment XA. The number 0.451 is right in the middle of the target center. This completely rules out the possibility of Gartley (which requires point B to reach 0.618).
Point C (0.838): Within the allowable range (0.382 - 0.886). This peak C is lower than peak A, confirming the bearish structure.
Point D (0.888): the mark 0.888 (almost coinciding with the standard level of 0.886 of the theory). This is the strongest potential reversal zone (PRZ) of the Bat family.
2. Probability of success
Based on the current technical data on the H1 price chart, the probability of success for this model is very high (around 75-80%) for the following reasons:
Consensus of RSI & Stoch: * Stoch (5.68): Currently in the extreme oversold zone and has begun to cross.
RSI (39.92): Has broken the 50 threshold and is plummeting, indicating very strong downward momentum.
Confirmation from EMA 20: The price (69.299) is clearly below the EMA 20 line (70.007). This EMA line currently acts as a "cap" halting any recovery efforts.
Target D ($65,850): Point D is marked around the $65.8xx area coinciding with the dashed golden trendline below. This is a multi-layer support zone where the Bears will take profit and the Bulls will be waiting.
3. Standard Target Scenario
According to the Bat model on H1, the price trajectory will be as follows:
Target 1 (TP1): Area $67,400 (corresponding to time frame 1.5 on the chart).
Target 2 (TP2 - Point D): Area $65,850. This is the "best landing" point of this Bat.
$BTC 1. Definition: This is the Bearish Bat pattern (Bear Bat) standard technical model?
Let's look at the "golden" ratios
Point B (0.451): This is the key. In the Bat pattern, point B must be within the range of 0.382 to 0.50 of segment XA. The number 0.451 is right in the middle of the target center. This completely rules out the possibility of Gartley (which requires point B to reach 0.618).
Point C (0.838): Within the allowable range (0.382 - 0.886). This peak C is lower than peak A, confirming the bearish structure.
Point D (0.888): the mark 0.888 (almost coinciding with the standard level of 0.886 of the theory). This is the strongest potential reversal zone (PRZ) of the Bat family.
2. Probability of success
Based on the current technical data on the H1 price chart, the probability of success for this model is very high (around 75-80%) for the following reasons:
Consensus of RSI & Stoch: * Stoch (5.68): Currently in the extreme oversold zone and has begun to cross.
RSI (39.92): Has broken the 50 threshold and is plummeting, indicating very strong downward momentum.
Confirmation from EMA 20: The price (69.299) is clearly below the EMA 20 line (70.007). This EMA line currently acts as a "cap" halting any recovery efforts.
Target D ($65,850): Point D is marked around the $65.8xx area coinciding with the dashed golden trendline below. This is a multi-layer support zone where the Bears will take profit and the Bulls will be waiting.
3. Standard Target Scenario
According to the Bat model on H1, the price trajectory will be as follows:
Target 1 (TP1): Area $67,400 (corresponding to time frame 1.5 on the chart).
Target 2 (TP2 - Point D): Area $65,850. This is the "best landing" point of this Bat.
Let's look at the "golden" ratios
Point B (0.451): This is the key. In the Bat pattern, point B must be within the range of 0.382 to 0.50 of segment XA. The number 0.451 is right in the middle of the target center. This completely rules out the possibility of Gartley (which requires point B to reach 0.618).
Point C (0.838): Within the allowable range (0.382 - 0.886). This peak C is lower than peak A, confirming the bearish structure.
Point D (0.888): the mark 0.888 (almost coinciding with the standard level of 0.886 of the theory). This is the strongest potential reversal zone (PRZ) of the Bat family.
2. Probability of success
Based on the current technical data on the H1 price chart, the probability of success for this model is very high (around 75-80%) for the following reasons:
Consensus of RSI & Stoch: * Stoch (5.68): Currently in the extreme oversold zone and has begun to cross.
RSI (39.92): Has broken the 50 threshold and is plummeting, indicating very strong downward momentum.
Confirmation from EMA 20: The price (69.299) is clearly below the EMA 20 line (70.007). This EMA line currently acts as a "cap" halting any recovery efforts.
Target D ($65,850): Point D is marked around the $65.8xx area coinciding with the dashed golden trendline below. This is a multi-layer support zone where the Bears will take profit and the Bulls will be waiting.
3. Standard Target Scenario
According to the Bat model on H1, the price trajectory will be as follows:
Target 1 (TP1): Area $67,400 (corresponding to time frame 1.5 on the chart).
Target 2 (TP2 - Point D): Area $65,850. This is the "best landing" point of this Bat.
1
183
·
--
Bearish
#ETH Waiting for a reaction in the break down zone 195xx!
If the zone 1950-1960 firmly rejects. There is a possibility of a deep flush to the 1.8kxx range.
Capital management is of utmost importance.
Safety trade, guys!
#ETH Waiting for a reaction in the break down zone 195xx!
If the zone 1950-1960 firmly rejects. There is a possibility of a deep flush to the 1.8kxx range.
Capital management is of utmost importance.
Safety trade, guys!
If the zone 1950-1960 firmly rejects. There is a possibility of a deep flush to the 1.8kxx range.
Capital management is of utmost importance.
Safety trade, guys!
Quoted content has been removed
1
1
194
·
--
Bearish
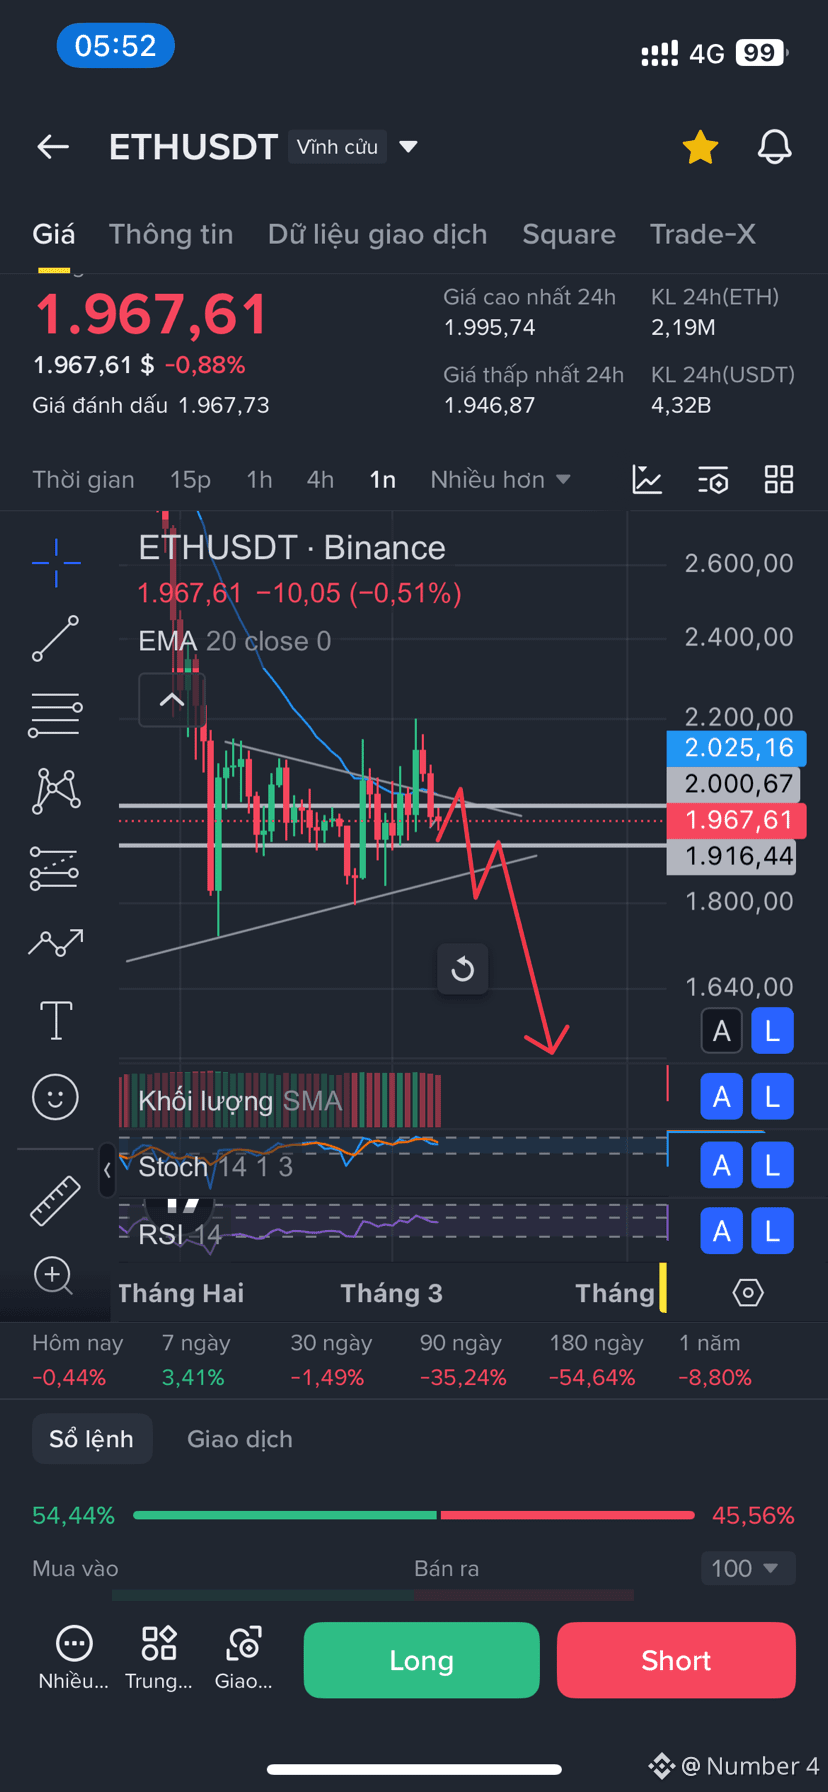
$ETH Testing an extremely important support zone in the uptrend structure!
ETH is right at the edge of the important support zone of 1k9 on the technical chart, buying pressure seems to be weakening as the rebounds get shorter and selling volume starts to increase. With the current structure, just a clear break below the support zone could trigger a strong breakdown, leading to many liquidation orders in a short time. In crypto, such moments often create rapid fluctuations in just a few candles. Many traders are closely watching ETH on Binance to see if the price zone of 1k9 can hold. Will the next movement of ETH confirm the scenario?
Do you think #Eth can hold 1k9?
$ETH Testing an extremely important support zone in the uptrend structure!
ETH is right at the edge of the important support zone of 1k9 on the technical chart, buying pressure seems to be weakening as the rebounds get shorter and selling volume starts to increase. With the current structure, just a clear break below the support zone could trigger a strong breakdown, leading to many liquidation orders in a short time. In crypto, such moments often create rapid fluctuations in just a few candles. Many traders are closely watching ETH on Binance to see if the price zone of 1k9 can hold. Will the next movement of ETH confirm the scenario?
Do you think #Eth can hold 1k9?
ETH is right at the edge of the important support zone of 1k9 on the technical chart, buying pressure seems to be weakening as the rebounds get shorter and selling volume starts to increase. With the current structure, just a clear break below the support zone could trigger a strong breakdown, leading to many liquidation orders in a short time. In crypto, such moments often create rapid fluctuations in just a few candles. Many traders are closely watching ETH on Binance to see if the price zone of 1k9 can hold. Will the next movement of ETH confirm the scenario?
Do you think #Eth can hold 1k9?
2
274
·
--
View results, accuracy
View results, accuracy
Number 4
·
--
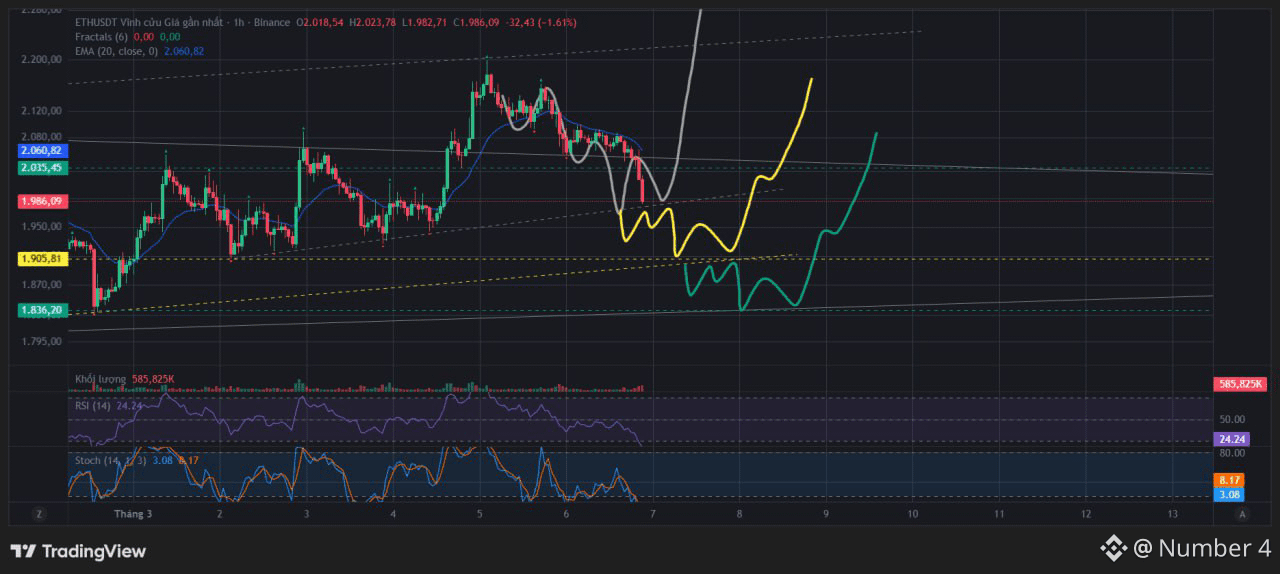
Bullish$ETH Choose, my love, I will accommodate any style.
1
262
·
--
Bullish
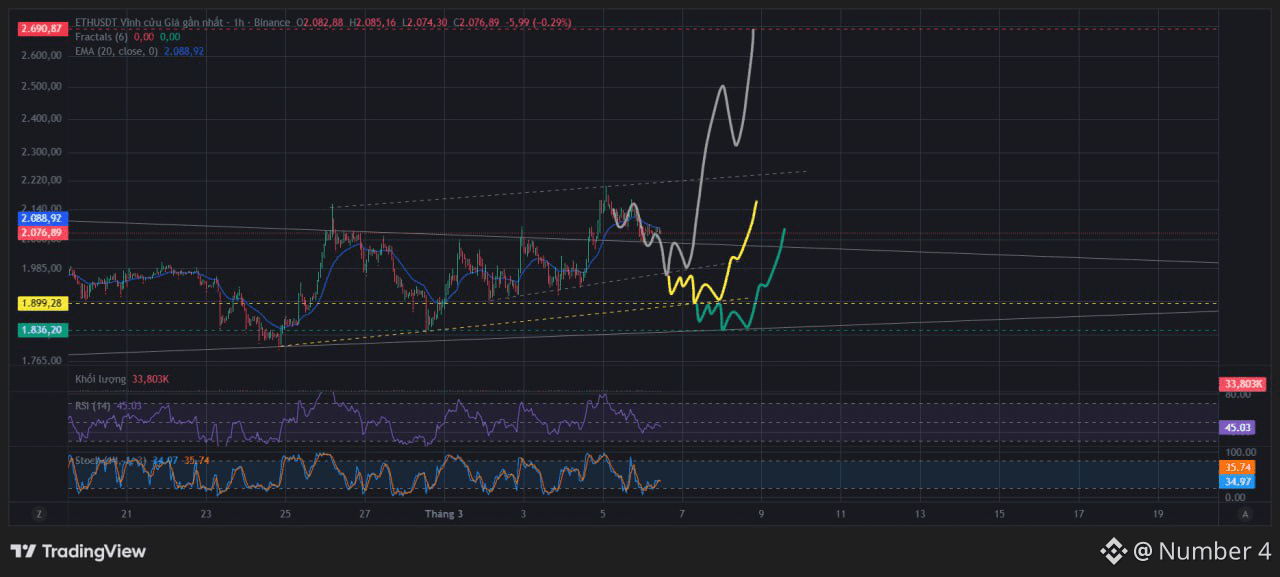
$ETH Choose, my love, I will accommodate any style.
$ETH Choose, my love, I will accommodate any style.
1
2
200
·
--
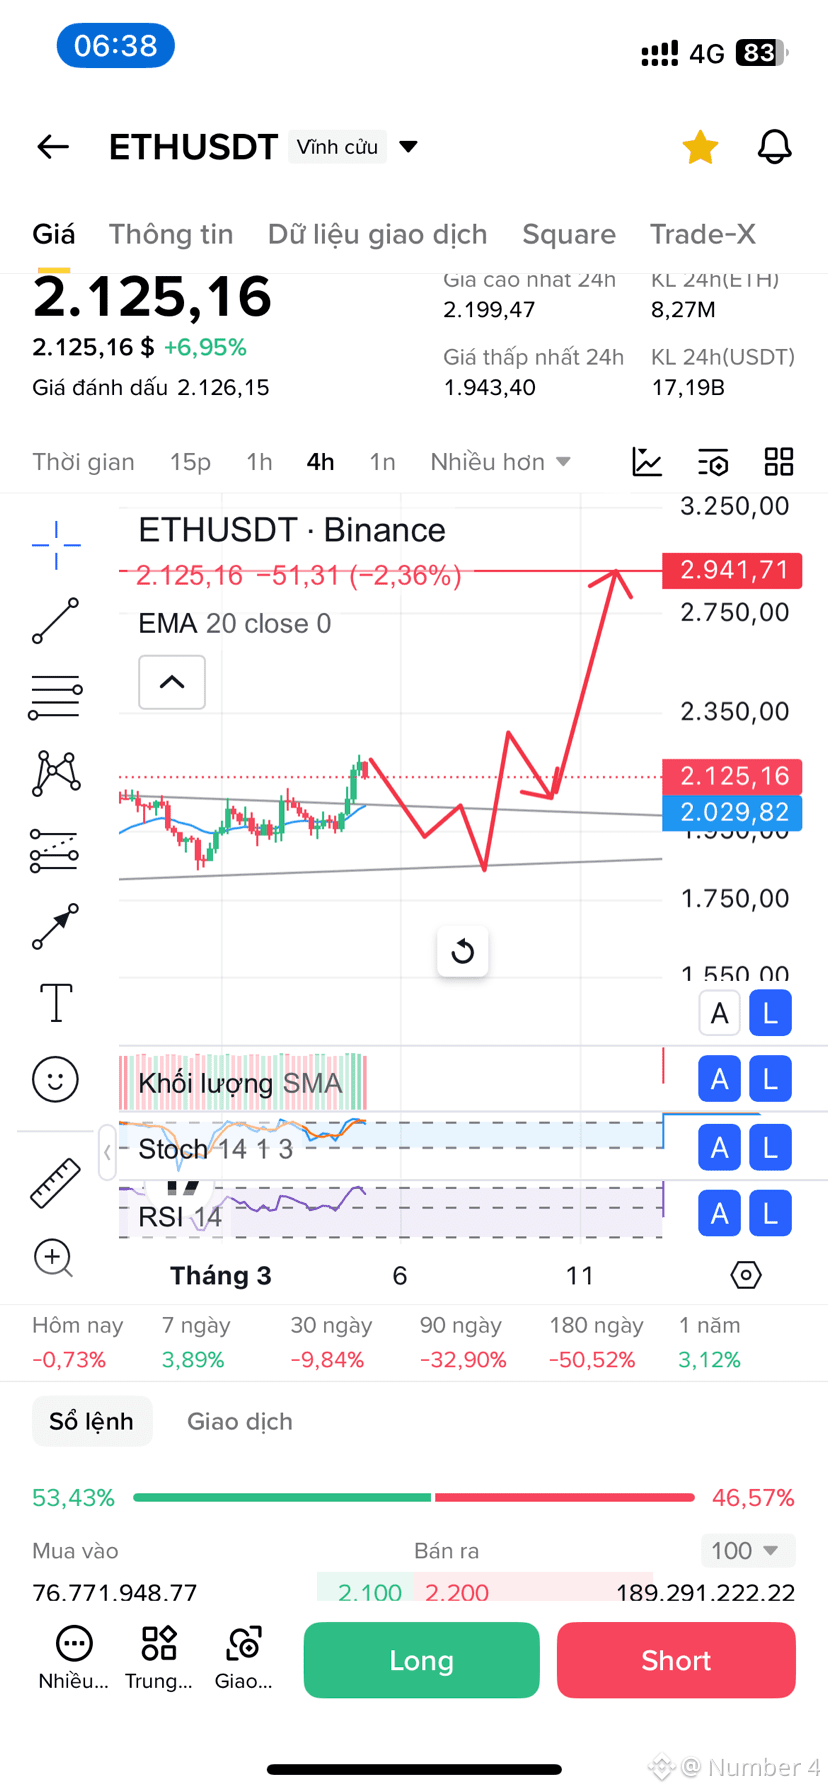
$ETH follow the arrow and play, good luck, wish you all a big win
$ETH follow the arrow and play, good luck, wish you all a big win
2
511
·
--
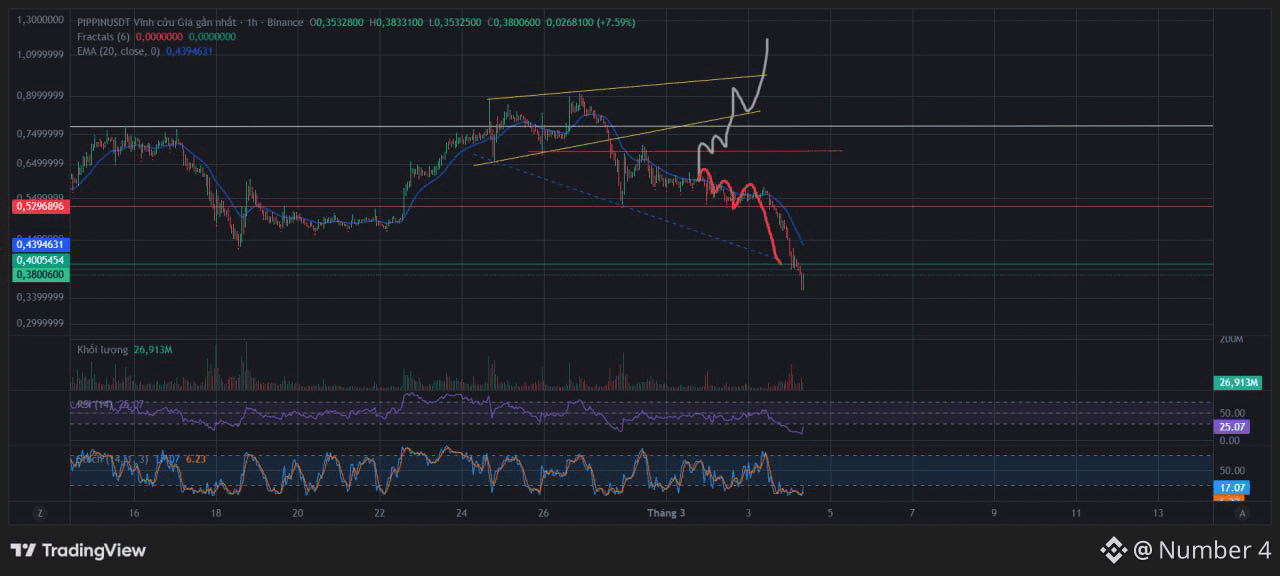
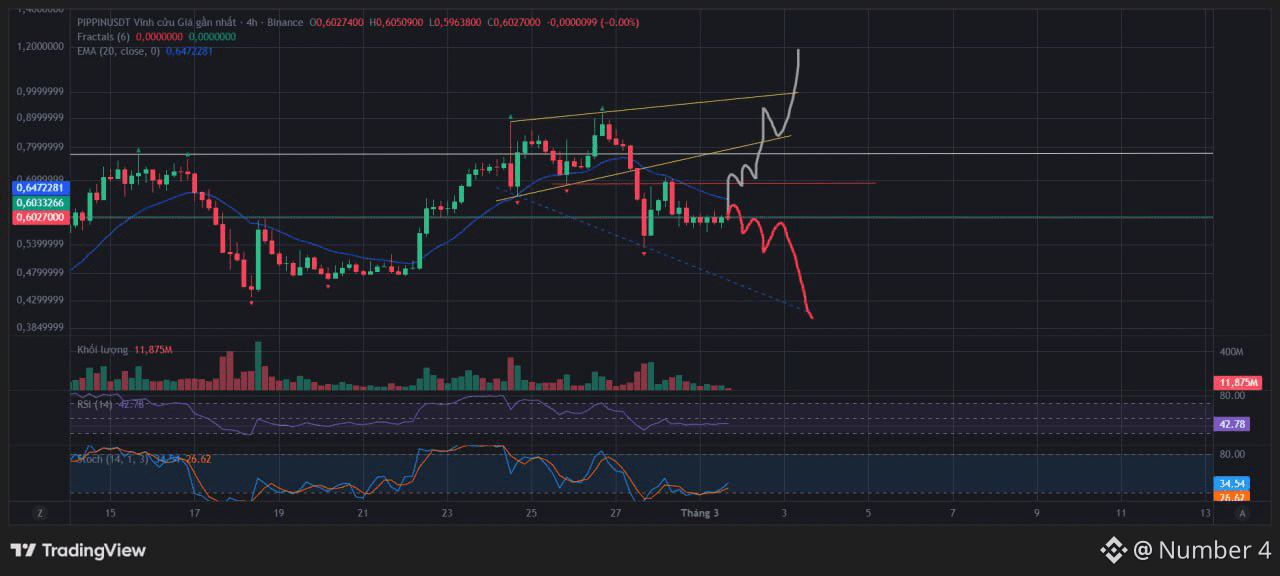
$PIPPIN Choose a direction, just choose it, dear
$PIPPIN Choose a direction, just choose it, dear
4
1
1
576
Log in to explore more content
Join global crypto users on Binance Square
⚡️ Get latest and useful information about crypto.
💬 Trusted by the world’s largest crypto exchange.
👍 Discover real insights from verified creators.
Email / Phone number
Trending Topics
QNTRises39%
34,700 views
1,068 Discussing
#qntrises39%
QNT just pulled off a rocket jump of 39% 🚀 But are we headed to Mars, or are we just falling off the bed? 😂
Looking at the chart, QNT reached a juicy peak at $105 and now this big red candle is pointing straight down toward $75. Is the party officially over, or is it just taking a breath? 📉
If you’re trading right now, don’t panic and buy the top! Watch the support levels, lock in your profits, or wait for a bounce. Remember, this is not financial advice—always do your own research DYOR!
Follow-up, please
Trade $QNTB
$NOM
$TAKE
#qntrises39% #QuantNetwork #CryptoTrading #Altcoins
Shamika Metting
·2 Likes
·3.1k views
EthereumBreaksAbove$2700
3,120 views
106 Discussing
BitgetBreachForgedRequestsNotStolenKeys
32,339 views
841 Discussing