
ForXtrade
158 Posts

ForXtrade
Report
Block User
Your Guide to Market Trends - Insights Expert for Smarter Investments|
Occasional Trader
4.6 Years
0 Following
259 Followers
355 Liked
Posts
All
Quotes
·
--
Bearish
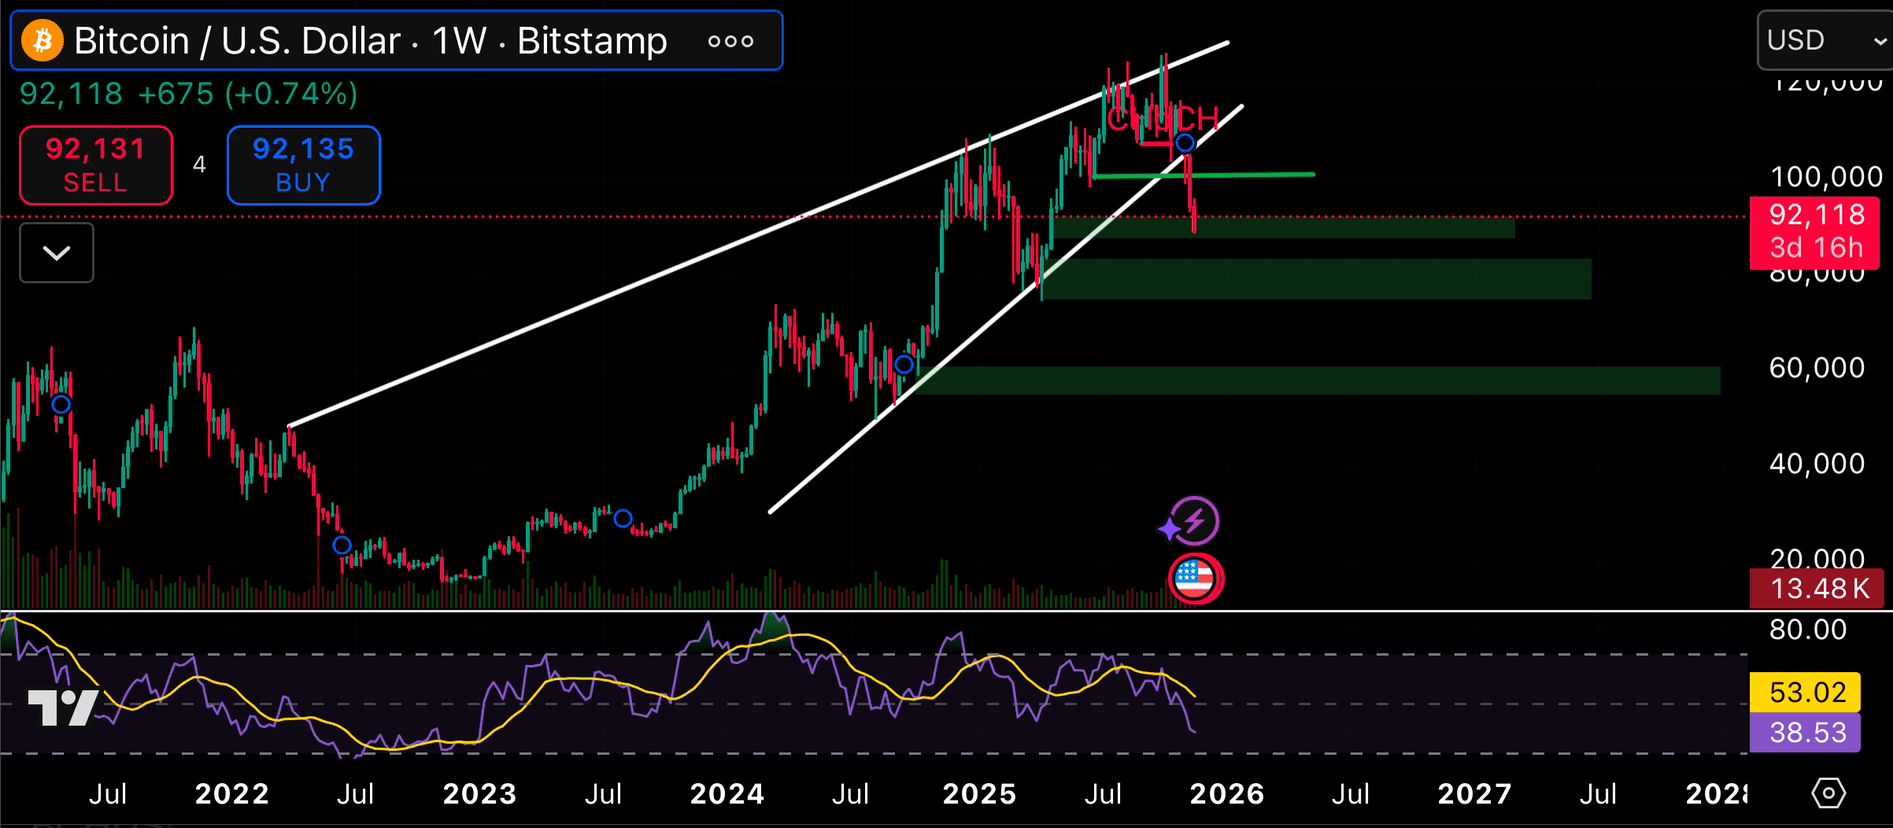
🙅🏻♀️14 hours before when I shared this analysis, no one believed me and now the support I Marked in the chart the exact support got hit #btc #BTCVolatility #analises #Binance #TrumpTariffs $BTC
{spot}(BTCUSDT)
🙅🏻♀️14 hours before when I shared this analysis, no one believed me and now the support I Marked in the chart the exact support got hit #btc #BTCVolatility #analises #Binance #TrumpTariffs $BTC
ForXtrade
·
--
Bullish⚡ If You Understand This Chart, You’ll Understand the Next Big Move.😳
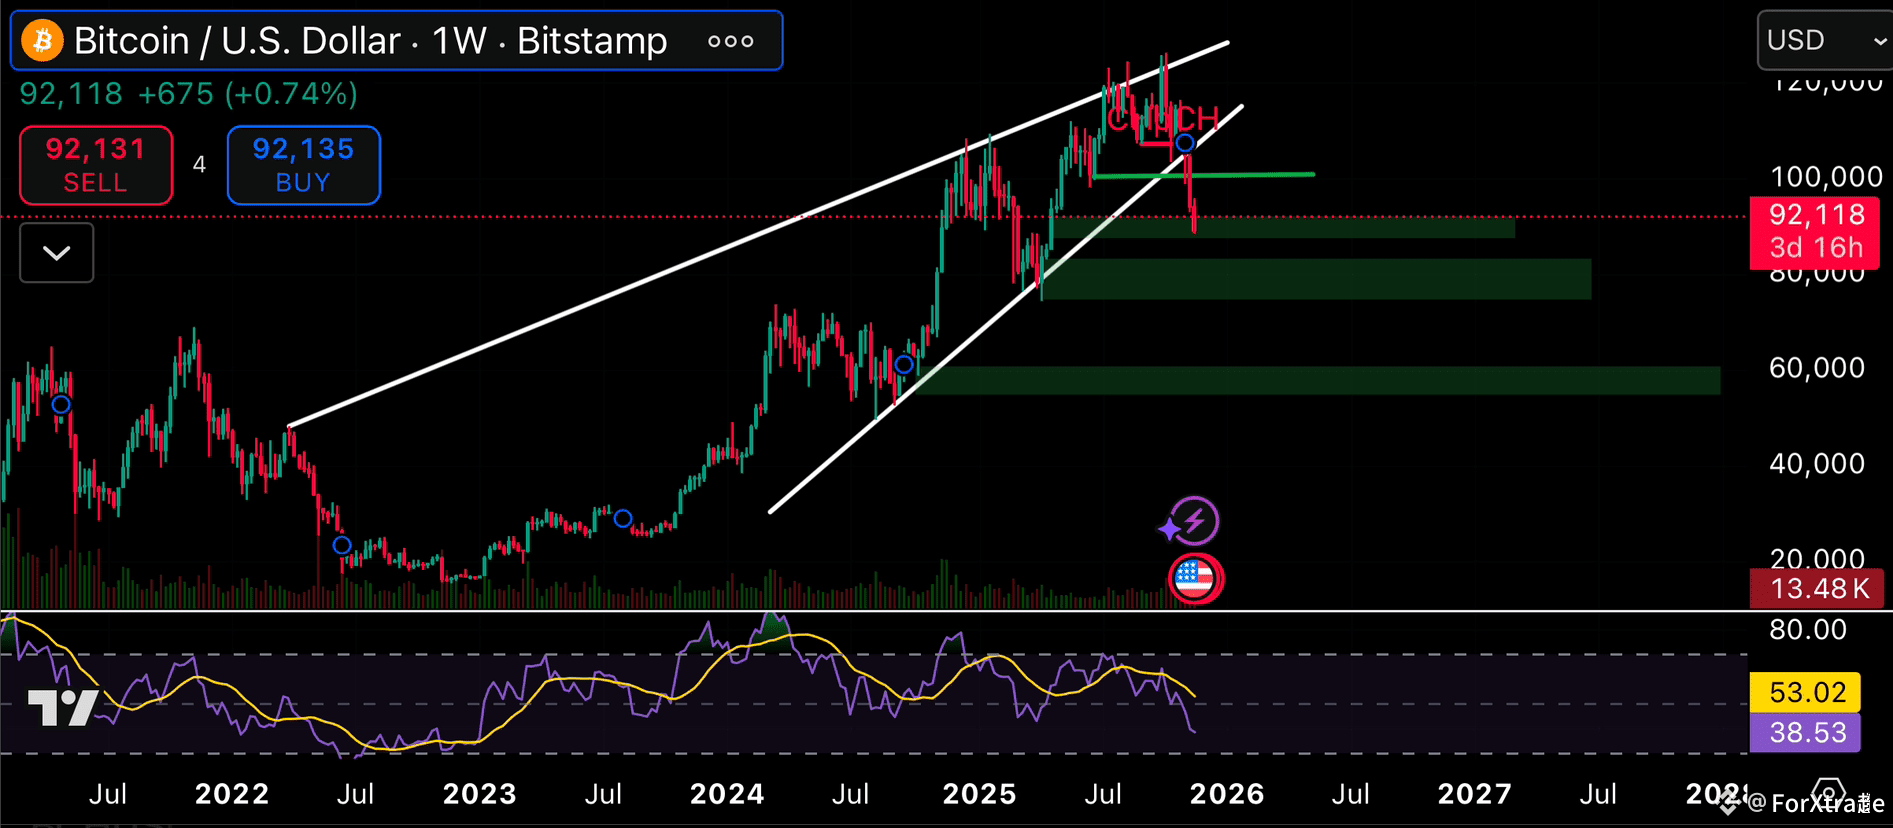
Bitcoin just broke down from the weekly rising wedge, and that’s the first real structural weakness we’ve seen in months.
This isn’t doom — it’s a normal macro correction — but it does mean the easy long entries are gone for now.
Price has slipped under local support, so BTC will likely hunt one of the major weekly demand zones next:
• $88K–90K → first reaction zone
• $78K–82K → strong weekly demand
• $60K–65K → macro retest level if correction deepens
RSI on the weekly is rolling down without touching oversold, which usually signals the correction isn’t fully complete yet.
cooldown phase after a major wedge break.
If $BTC reclaims $94K–95K, momentum flips back bullish.
If $82K breaks, the market opens room for $65K.
#BTC90kBreakingPoint #MarketPullback #Binance #StrategyBTCPurchase #BTC走势分析
Bitcoin just broke down from the weekly rising wedge, and that’s the first real structural weakness we’ve seen in months.
This isn’t doom — it’s a normal macro correction — but it does mean the easy long entries are gone for now.
Price has slipped under local support, so BTC will likely hunt one of the major weekly demand zones next:
• $88K–90K → first reaction zone
• $78K–82K → strong weekly demand
• $60K–65K → macro retest level if correction deepens
RSI on the weekly is rolling down without touching oversold, which usually signals the correction isn’t fully complete yet.
cooldown phase after a major wedge break.
If $BTC reclaims $94K–95K, momentum flips back bullish.
If $82K breaks, the market opens room for $65K.
#BTC90kBreakingPoint #MarketPullback #Binance #StrategyBTCPurchase #BTC走势分析
2
94
·
--
Bullish
⚡ If You Understand This Chart, You’ll Understand the Next Big Move.😳
Bitcoin just broke down from the weekly rising wedge, and that’s the first real structural weakness we’ve seen in months.
This isn’t doom — it’s a normal macro correction — but it does mean the easy long entries are gone for now.
Price has slipped under local support, so BTC will likely hunt one of the major weekly demand zones next:
• $88K–90K → first reaction zone
• $78K–82K → strong weekly demand
• $60K–65K → macro retest level if correction deepens
RSI on the weekly is rolling down without touching oversold, which usually signals the correction isn’t fully complete yet.
cooldown phase after a major wedge break.
If $BTC reclaims $94K–95K, momentum flips back bullish.
If $82K breaks, the market opens room for $65K.
{spot}(BTCUSDT)
#BTC90kBreakingPoint #MarketPullback #Binance #StrategyBTCPurchase #BTC走势分析
⚡ If You Understand This Chart, You’ll Understand the Next Big Move.😳
Bitcoin just broke down from the weekly rising wedge, and that’s the first real structural weakness we’ve seen in months.
This isn’t doom — it’s a normal macro correction — but it does mean the easy long entries are gone for now.
Price has slipped under local support, so BTC will likely hunt one of the major weekly demand zones next:
• $88K–90K → first reaction zone
• $78K–82K → strong weekly demand
• $60K–65K → macro retest level if correction deepens
RSI on the weekly is rolling down without touching oversold, which usually signals the correction isn’t fully complete yet.
cooldown phase after a major wedge break.
If $BTC reclaims $94K–95K, momentum flips back bullish.
If $82K breaks, the market opens room for $65K.
#BTC90kBreakingPoint #MarketPullback #Binance #StrategyBTCPurchase #BTC走势分析
Bitcoin just broke down from the weekly rising wedge, and that’s the first real structural weakness we’ve seen in months.
This isn’t doom — it’s a normal macro correction — but it does mean the easy long entries are gone for now.
Price has slipped under local support, so BTC will likely hunt one of the major weekly demand zones next:
• $88K–90K → first reaction zone
• $78K–82K → strong weekly demand
• $60K–65K → macro retest level if correction deepens
RSI on the weekly is rolling down without touching oversold, which usually signals the correction isn’t fully complete yet.
cooldown phase after a major wedge break.
If $BTC reclaims $94K–95K, momentum flips back bullish.
If $82K breaks, the market opens room for $65K.
#BTC90kBreakingPoint #MarketPullback #Binance #StrategyBTCPurchase #BTC走势分析
1
1
75
·
--
Bearish
$IMX – CISD Break & Retest Setup ⚠️🚨
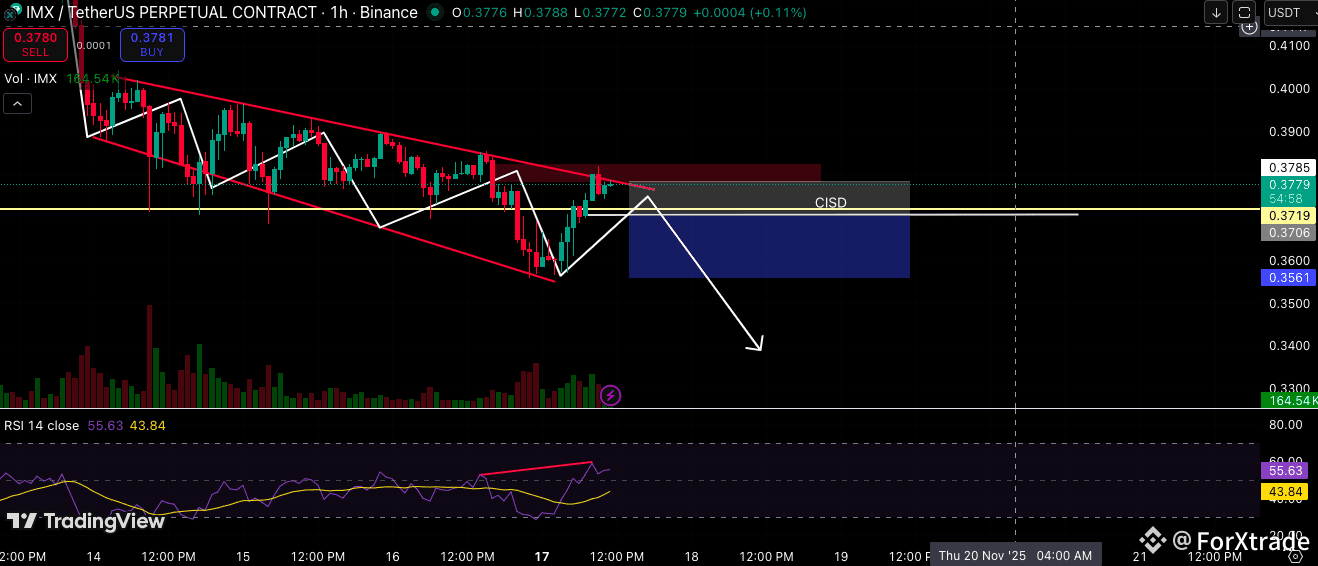
IMX has broken below the CISD level and is now retesting it from the underside. The descending channel, weakening momentum, and RSI divergence still support downside continuation as long as price remains below the zone.
Entry: 0.3709 (after CISD break + retest)
Stop-Loss: 0.3825
Take-Profit: 0.3561
{future}(IMXUSDT)
$IMX – CISD Break & Retest Setup ⚠️🚨
IMX has broken below the CISD level and is now retesting it from the underside. The descending channel, weakening momentum, and RSI divergence still support downside continuation as long as price remains below the zone.
Entry: 0.3709 (after CISD break + retest)
Stop-Loss: 0.3825
Take-Profit: 0.3561
IMX has broken below the CISD level and is now retesting it from the underside. The descending channel, weakening momentum, and RSI divergence still support downside continuation as long as price remains below the zone.
Entry: 0.3709 (after CISD break + retest)
Stop-Loss: 0.3825
Take-Profit: 0.3561
1
2
107
·
--
Bearish
🚨 $BTC 1D Reality Check — $93K Support
BTC is hovering near a structurally critical zone at $93,000:
• Historical demand and liquidity cluster align here.
• Volume profile under this level is thin → any move below could accelerate quickly.
• Momentum indicators (RSI, MACD) are flattening — market is indecisive and waiting for a catalyst.
• Smart money activity is neutral; no clear directional bias.
Reality Check:
$93K is a key inflection point on the daily chart. Keep an eye on daily closes, liquidity zones, and market structure — the next move will likely be explosive. ⚡
#Bitcoin #BTC #Crypto #Binance #CryptoTrading
{spot}(BTCUSDT)
🚨 $BTC 1D Reality Check — $93K Support
BTC is hovering near a structurally critical zone at $93,000:
• Historical demand and liquidity cluster align here.
• Volume profile under this level is thin → any move below could accelerate quickly.
• Momentum indicators (RSI, MACD) are flattening — market is indecisive and waiting for a catalyst.
• Smart money activity is neutral; no clear directional bias.
Reality Check:
$93K is a key inflection point on the daily chart. Keep an eye on daily closes, liquidity zones, and market structure — the next move will likely be explosive. ⚡
#Bitcoin #BTC #Crypto #Binance #CryptoTrading
BTC is hovering near a structurally critical zone at $93,000:
• Historical demand and liquidity cluster align here.
• Volume profile under this level is thin → any move below could accelerate quickly.
• Momentum indicators (RSI, MACD) are flattening — market is indecisive and waiting for a catalyst.
• Smart money activity is neutral; no clear directional bias.
Reality Check:
$93K is a key inflection point on the daily chart. Keep an eye on daily closes, liquidity zones, and market structure — the next move will likely be explosive. ⚡
#Bitcoin #BTC #Crypto #Binance #CryptoTrading
1
40
·
--
Bullish
🔥 $ZEN Heating Up!
The move we’ve been waiting for is here! 💥
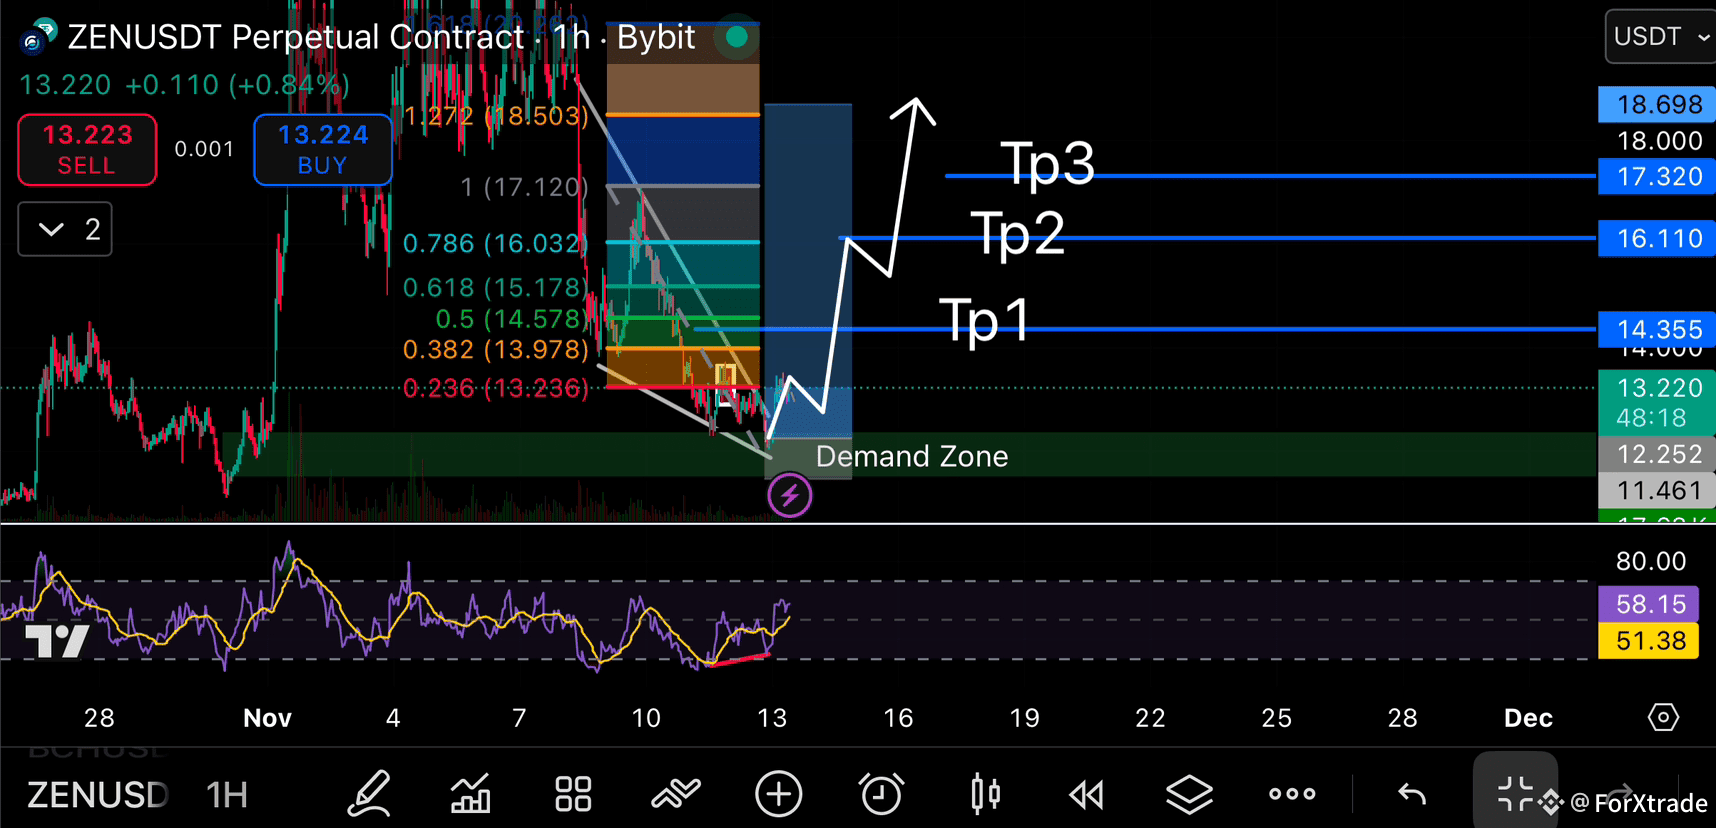
Price is bouncing from the demand zone and sitting in the golden pocket — prime entry zone before liftoff 🚀
RSI confirms bullish divergence, and momentum’s building fast!
First target 🎯 14.35 (TP1) — once it breaks, sky’s open toward 16.11 and 17.32! 🌕
⚡ Don’t sleep on this setup — this could be the next big breakout!
#Binance #AltcoinSeason #CryptoBreakout #BullishSetup #horizen
{spot}(ZENUSDT)
🔥 $ZEN Heating Up!
The move we’ve been waiting for is here! 💥
Price is bouncing from the demand zone and sitting in the golden pocket — prime entry zone before liftoff 🚀
RSI confirms bullish divergence, and momentum’s building fast!
First target 🎯 14.35 (TP1) — once it breaks, sky’s open toward 16.11 and 17.32! 🌕
⚡ Don’t sleep on this setup — this could be the next big breakout!
#Binance #AltcoinSeason #CryptoBreakout #BullishSetup #horizen
The move we’ve been waiting for is here! 💥
Price is bouncing from the demand zone and sitting in the golden pocket — prime entry zone before liftoff 🚀
RSI confirms bullish divergence, and momentum’s building fast!
First target 🎯 14.35 (TP1) — once it breaks, sky’s open toward 16.11 and 17.32! 🌕
⚡ Don’t sleep on this setup — this could be the next big breakout!
#Binance #AltcoinSeason #CryptoBreakout #BullishSetup #horizen
1
1
22
·
--
Bearish
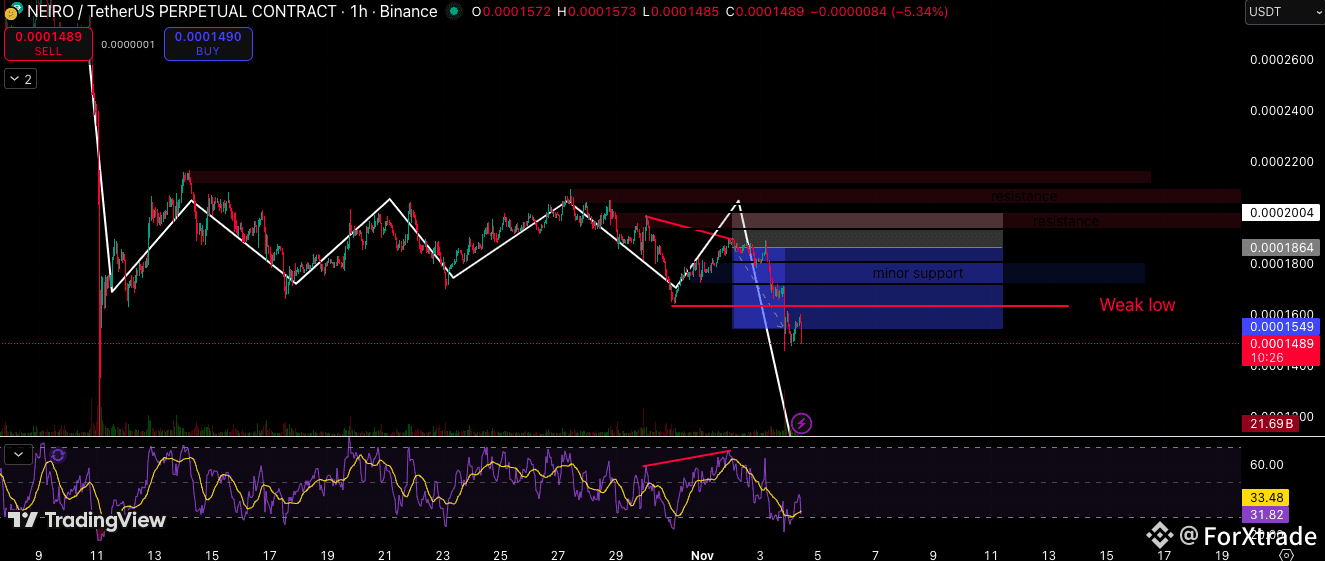
🧠 $NEIRO played out exactly as planned!
Last week’s bearish setup hit perfectly — resistance got respected, RSI divergence confirmed, and price broke below the minor support and weak low right on target. 📉
Patience + structure = results 🔥
Now watching how price reacts around 0.0001549 for the next move 👀
#NEIROUSDT #NEIRO #CryptoTrading #Binance #PriceAction
{future}(NEIROUSDT)
🧠 $NEIRO played out exactly as planned!
Last week’s bearish setup hit perfectly — resistance got respected, RSI divergence confirmed, and price broke below the minor support and weak low right on target. 📉
Patience + structure = results 🔥
Now watching how price reacts around 0.0001549 for the next move 👀
#NEIROUSDT #NEIRO #CryptoTrading #Binance #PriceAction
Last week’s bearish setup hit perfectly — resistance got respected, RSI divergence confirmed, and price broke below the minor support and weak low right on target. 📉
Patience + structure = results 🔥
Now watching how price reacts around 0.0001549 for the next move 👀
#NEIROUSDT #NEIRO #CryptoTrading #Binance #PriceAction
ForXtrade
·
--
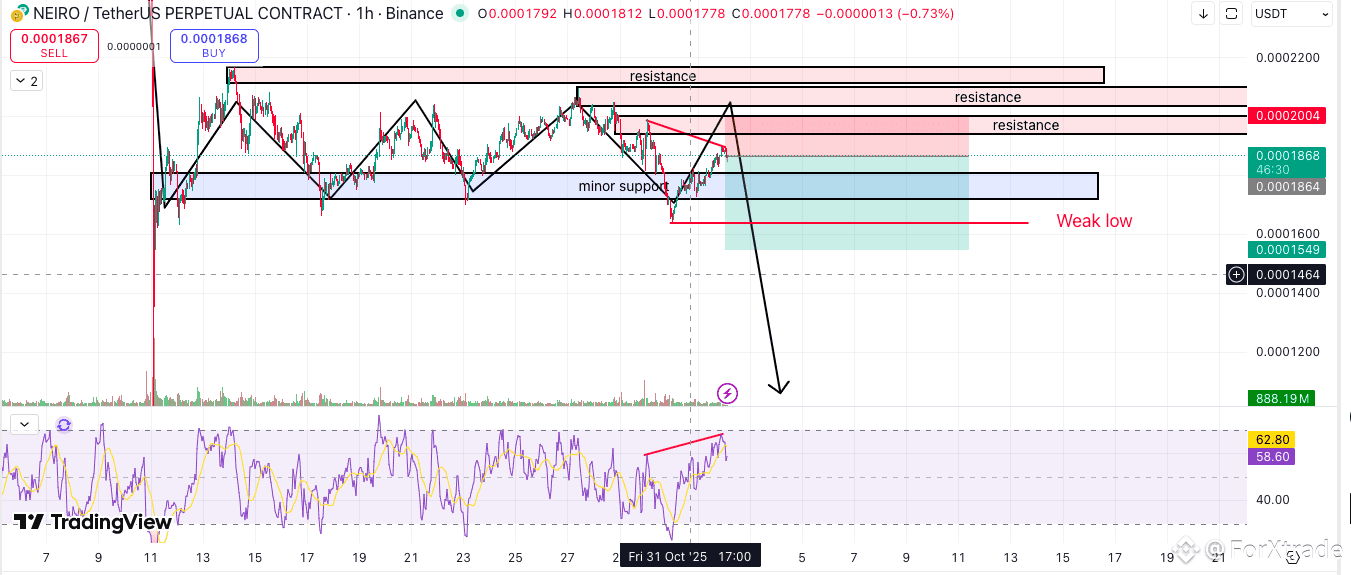
BearishHello Binancians 👋
$NEIRO is trading near $0.00057 with a market cap around $85M and a 420B supply 🪙
Price is forming a distribution pattern right under strong resistance (0.00020–0.00022) — classic sign of weakening momentum ⚠️
RSI shows bearish divergence, and if 0.0001860 support breaks, a drop toward 0.0001550 is likely 📉
Still 90% below its ATH ($0.003), so volatility stays extreme.
Stay alert, traders — pattern is setting up for the next big move ⚡
#NEIRO #CryptoAnalysis #BinanceFeed #MarketPullback #bearish $BTC $NEIRO
$NEIRO is trading near $0.00057 with a market cap around $85M and a 420B supply 🪙
Price is forming a distribution pattern right under strong resistance (0.00020–0.00022) — classic sign of weakening momentum ⚠️
RSI shows bearish divergence, and if 0.0001860 support breaks, a drop toward 0.0001550 is likely 📉
Still 90% below its ATH ($0.003), so volatility stays extreme.
Stay alert, traders — pattern is setting up for the next big move ⚡
#NEIRO #CryptoAnalysis #BinanceFeed #MarketPullback #bearish $BTC $NEIRO
3
538
·
--
Ever been eating while watching candles move 0.1% like it’s a Netflix thriller? 🍿📉📈
Bro I swear crypto turns every snack into a suspense movie. 😭😂 #Binancians #CryptoLife #FutureTarding #BORED #Binance
Ever been eating while watching candles move 0.1% like it’s a Netflix thriller? 🍿📉📈
Bro I swear crypto turns every snack into a suspense movie. 😭😂 #Binancians #CryptoLife #FutureTarding #BORED #Binance
Bro I swear crypto turns every snack into a suspense movie. 😭😂 #Binancians #CryptoLife #FutureTarding #BORED #Binance

2
28
·
--
Bearish
Hello Binancians 👋
$NEIRO is trading near $0.00057 with a market cap around $85M and a 420B supply 🪙
Price is forming a distribution pattern right under strong resistance (0.00020–0.00022) — classic sign of weakening momentum ⚠️
RSI shows bearish divergence, and if 0.0001860 support breaks, a drop toward 0.0001550 is likely 📉
Still 90% below its ATH ($0.003), so volatility stays extreme.
Stay alert, traders — pattern is setting up for the next big move ⚡
#NEIRO #CryptoAnalysis #BinanceFeed #MarketPullback #bearish $BTC $NEIRO
{future}(NEIROUSDT)
Hello Binancians 👋
$NEIRO is trading near $0.00057 with a market cap around $85M and a 420B supply 🪙
Price is forming a distribution pattern right under strong resistance (0.00020–0.00022) — classic sign of weakening momentum ⚠️
RSI shows bearish divergence, and if 0.0001860 support breaks, a drop toward 0.0001550 is likely 📉
Still 90% below its ATH ($0.003), so volatility stays extreme.
Stay alert, traders — pattern is setting up for the next big move ⚡
#NEIRO #CryptoAnalysis #BinanceFeed #MarketPullback #bearish $BTC $NEIRO
$NEIRO is trading near $0.00057 with a market cap around $85M and a 420B supply 🪙
Price is forming a distribution pattern right under strong resistance (0.00020–0.00022) — classic sign of weakening momentum ⚠️
RSI shows bearish divergence, and if 0.0001860 support breaks, a drop toward 0.0001550 is likely 📉
Still 90% below its ATH ($0.003), so volatility stays extreme.
Stay alert, traders — pattern is setting up for the next big move ⚡
#NEIRO #CryptoAnalysis #BinanceFeed #MarketPullback #bearish $BTC $NEIRO
1
1
285
·
--
Bearish
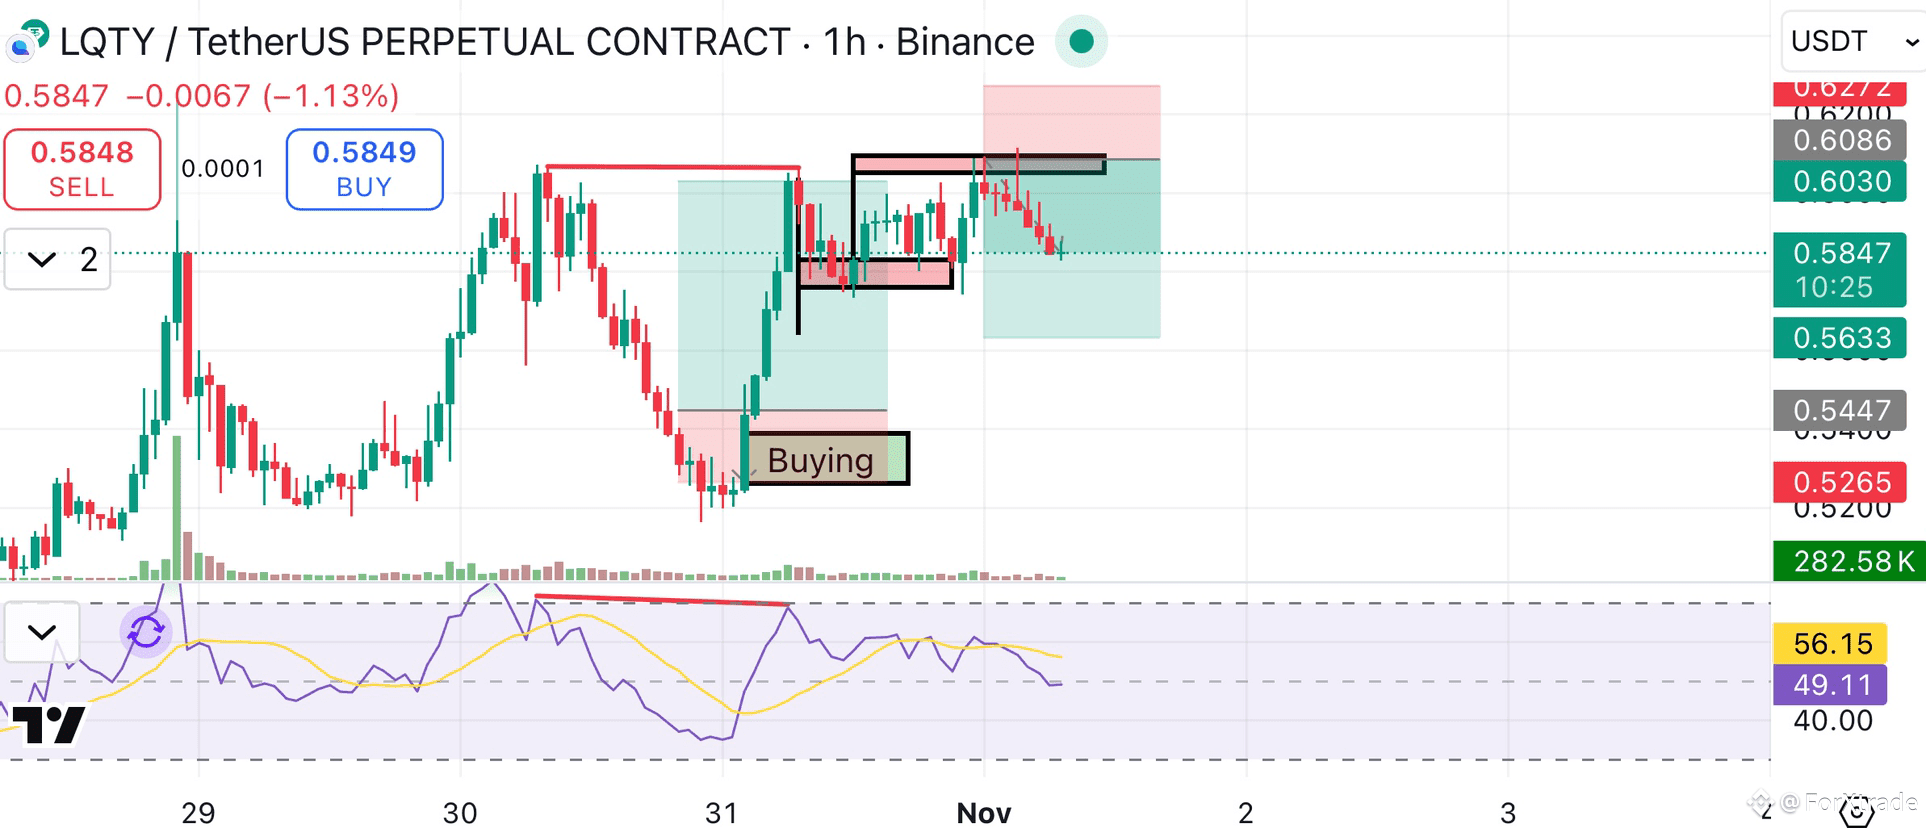
LQTY/USDT😭
Missed my entry on this one, even though the setup was perfect.
Had my reversal zone marked, RSI was showing clear divergence — everything lined up.
Price tapped the zone and dropped exactly how I expected 😅
#LQTYUSDT #Binance #PriceAction #MarketPullback #TradingView $LQTY
{future}(LQTYUSDT)
LQTY/USDT😭
Missed my entry on this one, even though the setup was perfect.
Had my reversal zone marked, RSI was showing clear divergence — everything lined up.
Price tapped the zone and dropped exactly how I expected 😅
#LQTYUSDT #Binance #PriceAction #MarketPullback #TradingView $LQTY
Missed my entry on this one, even though the setup was perfect.
Had my reversal zone marked, RSI was showing clear divergence — everything lined up.
Price tapped the zone and dropped exactly how I expected 😅
#LQTYUSDT #Binance #PriceAction #MarketPullback #TradingView $LQTY
ForXtrade
·
--
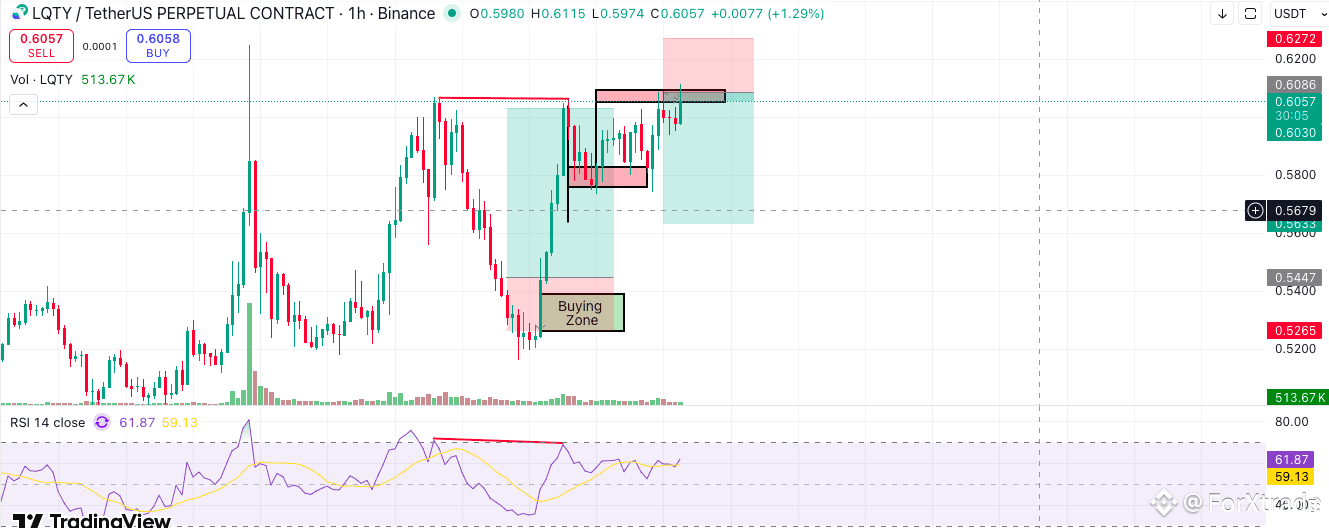
BearishLQTYUSDT
Who joining me ?
#Binance #CryptoAnalysis #PriceAction #TradingView $LQTY
Who joining me ?
#Binance #CryptoAnalysis #PriceAction #TradingView $LQTY
1
96
·
--
Bearish
1
1
73
·
--
Bearish
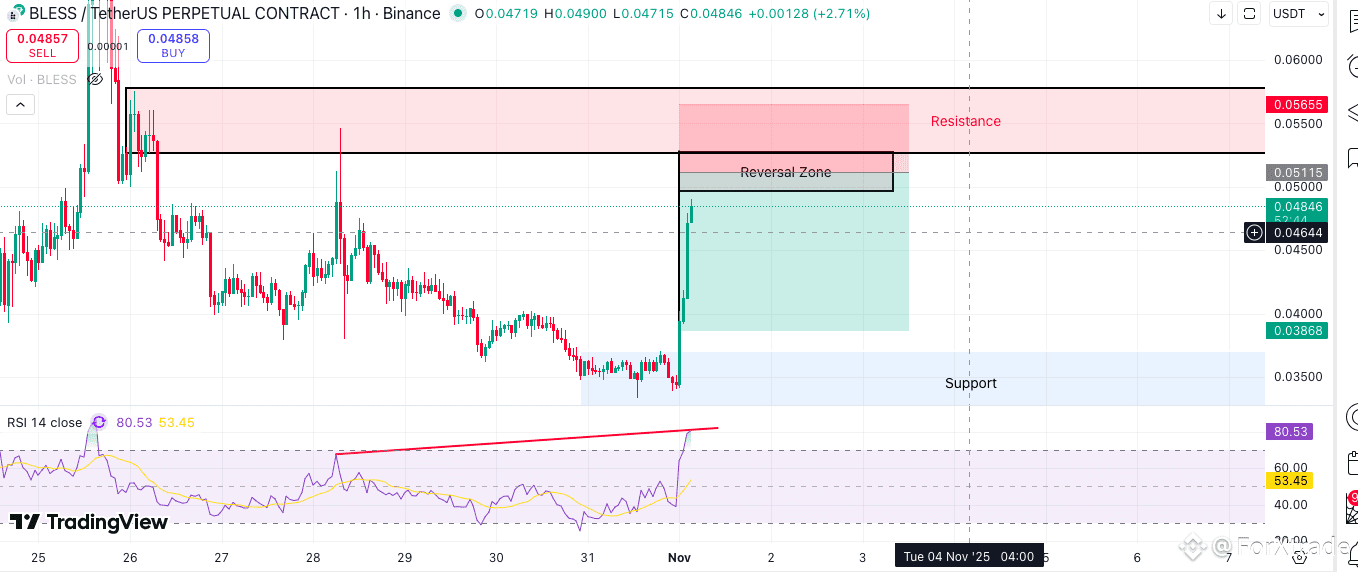
📊 BLESS/USDT – Technical Analysis (1H Chart)
BLESS has entered a key resistance zone between 0.0550 and 0.0566 after a strong impulsive move.
Momentum indicators suggest exhaustion — RSI at 80+ with visible bearish divergence, hinting at a potential short-term reversal.
Market Structure:
• 🔴 Resistance: 0.0550 – 0.0566
• ⚫ Reversal Zone: 0.0500 – 0.0510
• 🟢 Support: 0.0340 – 0.0390
Scenario Outlook:
• A rejection from the reversal zone could trigger a correction toward the 0.038 area.
• A confirmed breakout above 0.0566 would invalidate the bearish setup and indicate continuation momentum.
Risk–Reward Ratio: ≈ 1:2.5
Bias: Bearish near resistance until structure or momentum confirms otherwise.
#USDT #Binance #TechnicalAnalysis #CryptoMarkets #Priceaction $BLESS $BLESS
{alpha}(560x7c8217517ed4711fe2deccdfeffe8d906b9ae11f)
📊 BLESS/USDT – Technical Analysis (1H Chart)
BLESS has entered a key resistance zone between 0.0550 and 0.0566 after a strong impulsive move.
Momentum indicators suggest exhaustion — RSI at 80+ with visible bearish divergence, hinting at a potential short-term reversal.
Market Structure:
• 🔴 Resistance: 0.0550 – 0.0566
• ⚫ Reversal Zone: 0.0500 – 0.0510
• 🟢 Support: 0.0340 – 0.0390
Scenario Outlook:
• A rejection from the reversal zone could trigger a correction toward the 0.038 area.
• A confirmed breakout above 0.0566 would invalidate the bearish setup and indicate continuation momentum.
Risk–Reward Ratio: ≈ 1:2.5
Bias: Bearish near resistance until structure or momentum confirms otherwise.
#USDT #Binance #TechnicalAnalysis #CryptoMarkets #Priceaction $BLESS $BLESS
BLESS has entered a key resistance zone between 0.0550 and 0.0566 after a strong impulsive move.
Momentum indicators suggest exhaustion — RSI at 80+ with visible bearish divergence, hinting at a potential short-term reversal.
Market Structure:
• 🔴 Resistance: 0.0550 – 0.0566
• ⚫ Reversal Zone: 0.0500 – 0.0510
• 🟢 Support: 0.0340 – 0.0390
Scenario Outlook:
• A rejection from the reversal zone could trigger a correction toward the 0.038 area.
• A confirmed breakout above 0.0566 would invalidate the bearish setup and indicate continuation momentum.
Risk–Reward Ratio: ≈ 1:2.5
Bias: Bearish near resistance until structure or momentum confirms otherwise.
#USDT #Binance #TechnicalAnalysis #CryptoMarkets #Priceaction $BLESS $BLESS
5
558
·
--
Bullish
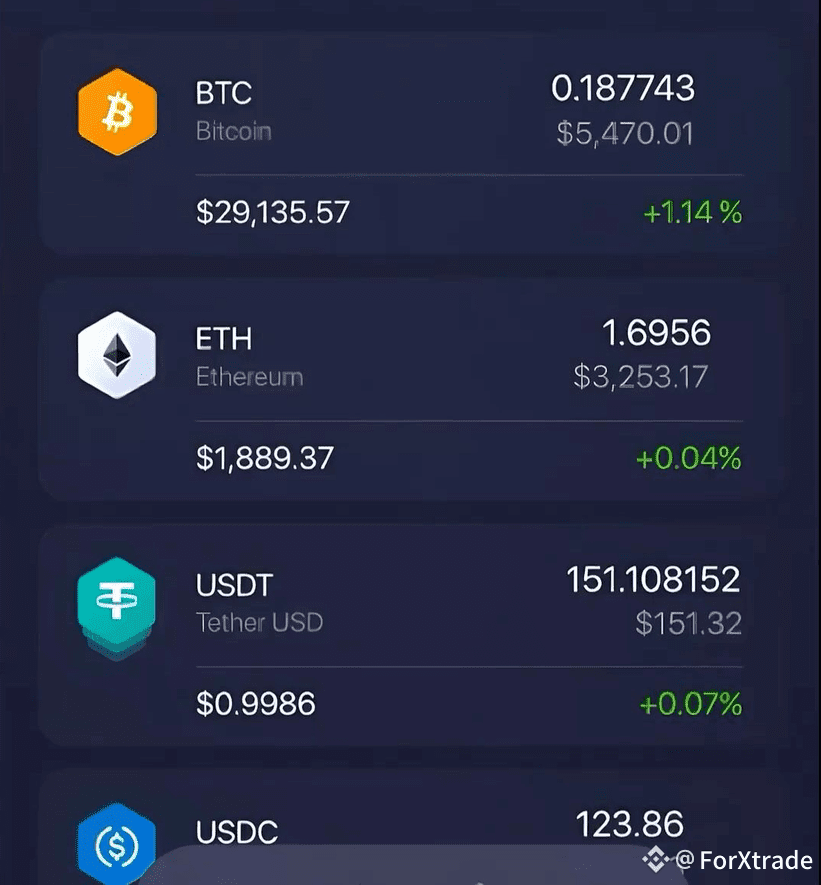
Missing Old days ? Sorry gold days😭
$BTC $ETH
Missing Old days ? Sorry gold days😭
$BTC $ETH
$BTC $ETH
2
35
·
--
Bullish
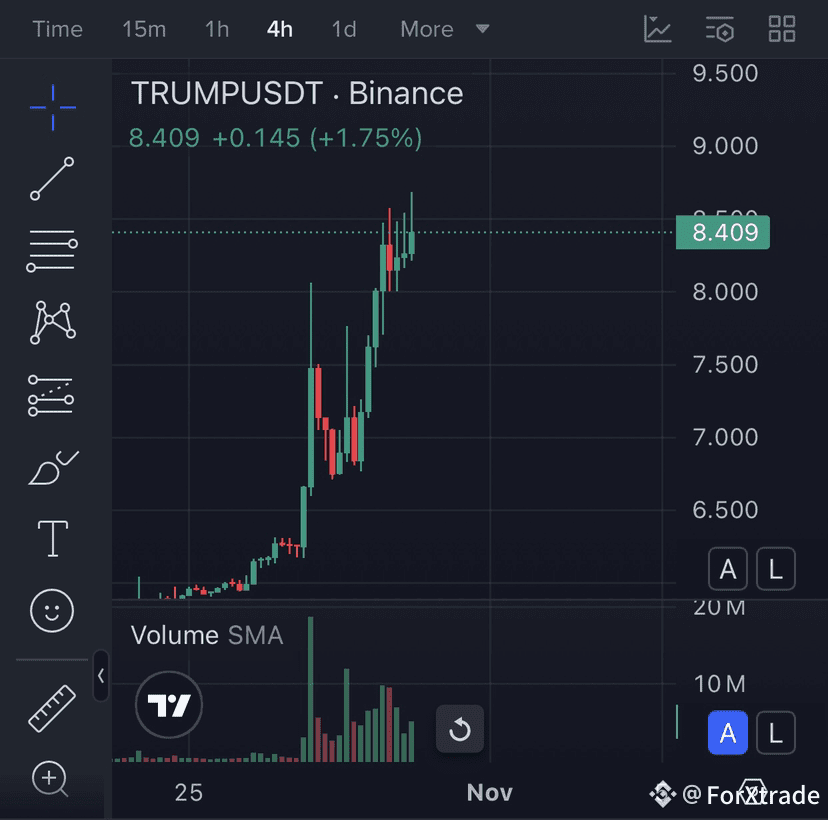
🔥 “Trading Season Shift” Check-in: TRUMPUSDT on the Radar! 🇺🇸
Markets just moved out of summer lull — now we’re in that “all-eyes on hype” phase. Enter TRUMP/USDT: sitting at ~$8.4-8.6, squaring off with resistance.
📍 If it pops above $8.70, we could be looking at a quick sprint to $9-$10.
📉 If it fails and breaks ~$8.10, the cool-off could hit hard.
$TRUMP $BTC
{spot}(BTCUSDT)
{future}(TRUMPUSDT)
🔥 “Trading Season Shift” Check-in: TRUMPUSDT on the Radar! 🇺🇸
Markets just moved out of summer lull — now we’re in that “all-eyes on hype” phase. Enter TRUMP/USDT: sitting at ~$8.4-8.6, squaring off with resistance.
📍 If it pops above $8.70, we could be looking at a quick sprint to $9-$10.
📉 If it fails and breaks ~$8.10, the cool-off could hit hard.
$TRUMP $BTC
🔥 “Trading Season Shift” Check-in: TRUMPUSDT on the Radar! 🇺🇸
Markets just moved out of summer lull — now we’re in that “all-eyes on hype” phase. Enter TRUMP/USDT: sitting at ~$8.4-8.6, squaring off with resistance.
📍 If it pops above $8.70, we could be looking at a quick sprint to $9-$10.
📉 If it fails and breaks ~$8.10, the cool-off could hit hard.
$TRUMP $BTC
2
191
·
--
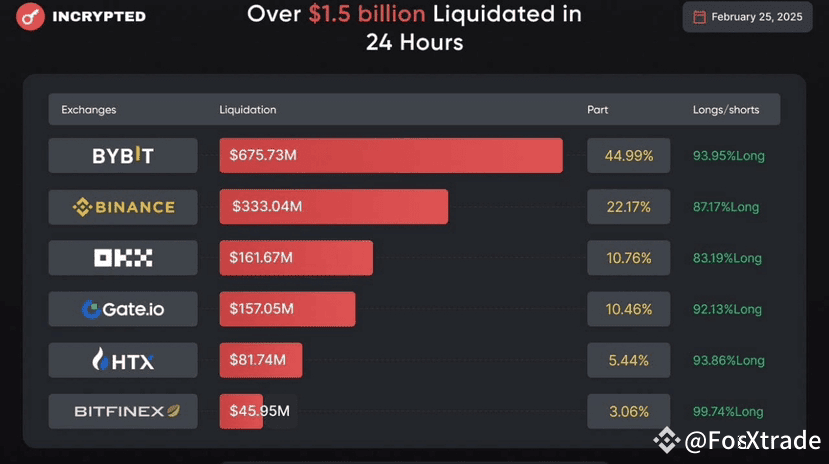
Bybit got hacked and lost a ton of money, so all the exchanges jumped in to help. Then $BTC crashed like never before. The whales’ outflow was a calculated move—just look at how much Bybit made from small and medium traders. Tragic. This was the worst manipulation ever, all to save Bybit.
#BinanceAlphaAlert #bybit #BybitLaunchpool #hack
Bybit got hacked and lost a ton of money, so all the exchanges jumped in to help. Then $BTC crashed like never before. The whales’ outflow was a calculated move—just look at how much Bybit made from small and medium traders. Tragic. This was the worst manipulation ever, all to save Bybit.
#BinanceAlphaAlert #bybit #BybitLaunchpool #hack
#BinanceAlphaAlert #bybit #BybitLaunchpool #hack
1
423
·
--
Bullish
FREE SPOT SIGNAL⚡️
#BNB/USDT
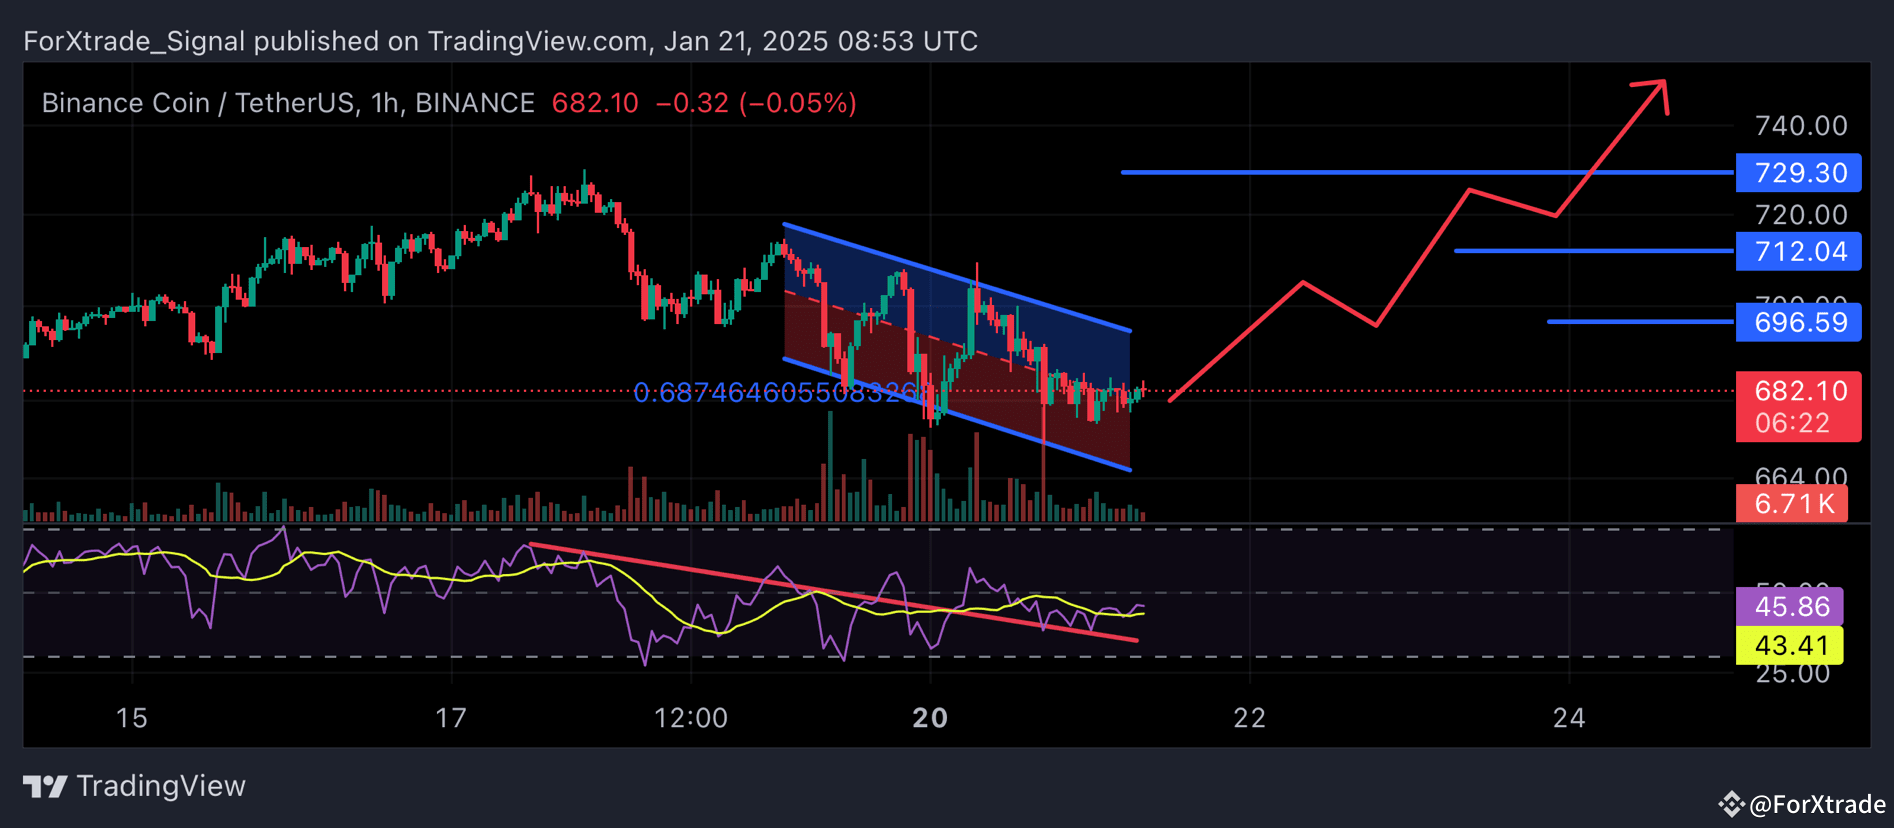
The price is moving in a
descending channel on the 1-hour timeframe and sticking to it well
We have a bounce from the lower limit of the descending channel, this support is at 670
We have a downtrend on the RSI indicator that is about to break, which supports the rise
We have a trend to stabilize above the moving average 100
Entry price 682
First target 696
Second target 710
Third target 730
$BNB
{spot}(BNBUSDT)
#btc #TrumpMarketInsights #nextpump #analysis
FREE SPOT SIGNAL⚡️
#BNB/USDT
The price is moving in a
descending channel on the 1-hour timeframe and sticking to it well
We have a bounce from the lower limit of the descending channel, this support is at 670
We have a downtrend on the RSI indicator that is about to break, which supports the rise
We have a trend to stabilize above the moving average 100
Entry price 682
First target 696
Second target 710
Third target 730
$BNB
#btc #TrumpMarketInsights #nextpump #analysis
#BNB/USDT
The price is moving in a
descending channel on the 1-hour timeframe and sticking to it well
We have a bounce from the lower limit of the descending channel, this support is at 670
We have a downtrend on the RSI indicator that is about to break, which supports the rise
We have a trend to stabilize above the moving average 100
Entry price 682
First target 696
Second target 710
Third target 730
$BNB
#btc #TrumpMarketInsights #nextpump #analysis
1
386
·
--
Bullish
Where Are you Guys Ready For Signal? I will gonna Drop if you guys like this post 😊❤️ #Binance #cryptouniverseofficial #BTC100KTrumpEffect
Where Are you Guys Ready For Signal? I will gonna Drop if you guys like this post 😊❤️ #Binance #cryptouniverseofficial #BTC100KTrumpEffect
3
101
Log in to explore more content
Join global crypto users on Binance Square
⚡️ Get latest and useful information about crypto.
💬 Trusted by the world’s largest crypto exchange.
👍 Discover real insights from verified creators.
Email / Phone number
Trending Topics
HuangExitNvidiaStrategyInFocus
38,150 views
649 Discussing
STOCKS | Nvidia’s Jensen Huang Resigns, Colette Kress Named as Interim CEO
Binance News
·16 Likes
·19.9k views
AnthropicRejectsIPODelayValuationinQuestion
611,995 views
4,982 Discussing
BitMineReports$6.3BNetLossForFiscal2026
4,504 views
84 Discussing