

交易员顾景辞
2.9k Posts

交易员顾景辞
Report
Block User
趋势中长线为主,波段操作 微博:分析师顾景辞
2 Following
6.5K+ Followers
13.7K+ Liked
2 Badges
Posts
All
Quotes
Videos
Live
PINNED
·
--
[Binance can directly add me as a friend to chat directly]
Type “chat room” in the search bar
Click the plus sign in the top-right corner to add a friend
Click “Add Contact” or scan my QR code
Search my Binance ID: 715918693
That’s it—you can invite me to be your friend
Add me and you can chat with me directly on Binance to discuss market trends in real time #chat room
[Binance can directly add me as a friend to chat directly]
Type “chat room” in the search bar
Click the plus sign in the top-right corner to add a friend
Click “Add Contact” or scan my QR code
Search my Binance ID: 715918693
That’s it—you can invite me to be your friend
Add me and you can chat with me directly on Binance to discuss market trends in real time #chat room
Type “chat room” in the search bar
Click the plus sign in the top-right corner to add a friend
Click “Add Contact” or scan my QR code
Search my Binance ID: 715918693
That’s it—you can invite me to be your friend
Add me and you can chat with me directly on Binance to discuss market trends in real time #chat room

6
1.4k
·
--
Bitcoin and Ethereum are currently in a weak, choppy market after retreating from elevated levels. Ethereum continues to underperform Bitcoin, while repeated outflows from ETFs are the most direct force weighing on prices. The market’s greatest uncertainties stem from expectations for Federal Reserve monetary policy and geopolitical conflicts. If negative news gains momentum, it could easily trigger a cascade of liquidations.#股票财报季 #阿根廷法院驳回米莱LIBRA案 #SK海力士据报拟派特别股息
Bitcoin and Ethereum are currently in a weak, choppy market after retreating from elevated levels. Ethereum continues to underperform Bitcoin, while repeated outflows from ETFs are the most direct force weighing on prices. The market’s greatest uncertainties stem from expectations for Federal Reserve monetary policy and geopolitical conflicts. If negative news gains momentum, it could easily trigger a cascade of liquidations.#股票财报季 #阿根廷法院驳回米莱LIBRA案 #SK海力士据报拟派特别股息
2
805
·
--
Trader Gu Jingci: 10.26 Bitcoin/Ethereum Trading Strategy and Market Analysis
After falling earlier, Bitcoin and Ethereum continued to move sideways near their lows. The pullback long positions we opened again last night rose to around 2,365 and 80,900 in the early hours, offering decent upside overall. The market pulled back and fell again this morning, reaching lows of around 79,350 and 2,295. Pay close attention to the recent daily lows and support around 79,000 and 2,280. A quick break below these lows followed by a rebound cannot be ruled out. The overall trend remains bearish. After the sharp earlier decline, the rebound has been weak; if prices briefly break below 79,000 and 2,280, watch to see whether they can quickly recover. On the daily chart, prices have also reached the lower Bollinger Band, so we continue to look for a rebound and recovery after the decline. Above, keep an eye on resistance around 82,000 and 2,400, where support and resistance may switch.
Trading suggestions: Go long on Bitcoin around 79,000–79,500, targeting around 81,000; go long on Ethereum around 2,280–2,300, targeting around 2,360. This analysis and these strategies are for reference only; trade at your own risk. Articles are reviewed and published with a time delay, so please refer to real-time market conditions! #股票财报季 #阿根廷法院驳回米莱LIBRA案 #SK海力士据报拟派特别股息
Trader Gu Jingci: 10.26 Bitcoin/Ethereum Trading Strategy and Market Analysis
After falling earlier, Bitcoin and Ethereum continued to move sideways near their lows. The pullback long positions we opened again last night rose to around 2,365 and 80,900 in the early hours, offering decent upside overall. The market pulled back and fell again this morning, reaching lows of around 79,350 and 2,295. Pay close attention to the recent daily lows and support around 79,000 and 2,280. A quick break below these lows followed by a rebound cannot be ruled out. The overall trend remains bearish. After the sharp earlier decline, the rebound has been weak; if prices briefly break below 79,000 and 2,280, watch to see whether they can quickly recover. On the daily chart, prices have also reached the lower Bollinger Band, so we continue to look for a rebound and recovery after the decline. Above, keep an eye on resistance around 82,000 and 2,400, where support and resistance may switch.
Trading suggestions: Go long on Bitcoin around 79,000–79,500, targeting around 81,000; go long on Ethereum around 2,280–2,300, targeting around 2,360. This analysis and these strategies are for reference only; trade at your own risk. Articles are reviewed and published with a time delay, so please refer to real-time market conditions! #股票财报季 #阿根廷法院驳回米莱LIBRA案 #SK海力士据报拟派特别股息
After falling earlier, Bitcoin and Ethereum continued to move sideways near their lows. The pullback long positions we opened again last night rose to around 2,365 and 80,900 in the early hours, offering decent upside overall. The market pulled back and fell again this morning, reaching lows of around 79,350 and 2,295. Pay close attention to the recent daily lows and support around 79,000 and 2,280. A quick break below these lows followed by a rebound cannot be ruled out. The overall trend remains bearish. After the sharp earlier decline, the rebound has been weak; if prices briefly break below 79,000 and 2,280, watch to see whether they can quickly recover. On the daily chart, prices have also reached the lower Bollinger Band, so we continue to look for a rebound and recovery after the decline. Above, keep an eye on resistance around 82,000 and 2,400, where support and resistance may switch.
Trading suggestions: Go long on Bitcoin around 79,000–79,500, targeting around 81,000; go long on Ethereum around 2,280–2,300, targeting around 2,360. This analysis and these strategies are for reference only; trade at your own risk. Articles are reviewed and published with a time delay, so please refer to real-time market conditions! #股票财报季 #阿根廷法院驳回米莱LIBRA案 #SK海力士据报拟派特别股息
1
492
·
--
Trader Gu Jingci: 10.25 A new week is about to begin, and the market is likely to see another period of significant volatility
The overall setup for Bitcoin and Ethereum this week is clear, with plenty of room for price movement. After dipping, the market is now moving sideways near the lows, and the overall trend is weak. Pay particular attention over the next two days to whether prices break below the lows around 79,000 and 2,280, and to the areas around 82,000 and 2,400 where a failed rally could trigger a reversal. If prices repeatedly fail to break above 82,000 and 2,400, they are highly likely to fall further. On the weekly chart, there is still room to move lower, with the next levels around 76,000 and 2,150. However, do not treat it as a confirmed breakdown until those levels are breached. For tonight, we can first look for a rebound and monitor its strength; if the rebound is weak, prices are likely to resume their decline afterward.
Trading suggestions for tonight: Buy Bitcoin around 79,800–80,200, with a target near 81,500; buy Ethereum around 2,305–2,325, with a target near 2,380. This analysis and these strategies are for reference only; you assume all risks. Articles are reviewed and published without guaranteed timeliness. Please rely on real-time conditions! #股票财报季 #美国下周将公布Q3GDP和9月PCE #韩国推迟加密货币所得税
Trader Gu Jingci: 10.25 A new week is about to begin, and the market is likely to see another period of significant volatility
The overall setup for Bitcoin and Ethereum this week is clear, with plenty of room for price movement. After dipping, the market is now moving sideways near the lows, and the overall trend is weak. Pay particular attention over the next two days to whether prices break below the lows around 79,000 and 2,280, and to the areas around 82,000 and 2,400 where a failed rally could trigger a reversal. If prices repeatedly fail to break above 82,000 and 2,400, they are highly likely to fall further. On the weekly chart, there is still room to move lower, with the next levels around 76,000 and 2,150. However, do not treat it as a confirmed breakdown until those levels are breached. For tonight, we can first look for a rebound and monitor its strength; if the rebound is weak, prices are likely to resume their decline afterward.
Trading suggestions for tonight: Buy Bitcoin around 79,800–80,200, with a target near 81,500; buy Ethereum around 2,305–2,325, with a target near 2,380. This analysis and these strategies are for reference only; you assume all risks. Articles are reviewed and published without guaranteed timeliness. Please rely on real-time conditions! #股票财报季 #美国下周将公布Q3GDP和9月PCE #韩国推迟加密货币所得税
The overall setup for Bitcoin and Ethereum this week is clear, with plenty of room for price movement. After dipping, the market is now moving sideways near the lows, and the overall trend is weak. Pay particular attention over the next two days to whether prices break below the lows around 79,000 and 2,280, and to the areas around 82,000 and 2,400 where a failed rally could trigger a reversal. If prices repeatedly fail to break above 82,000 and 2,400, they are highly likely to fall further. On the weekly chart, there is still room to move lower, with the next levels around 76,000 and 2,150. However, do not treat it as a confirmed breakdown until those levels are breached. For tonight, we can first look for a rebound and monitor its strength; if the rebound is weak, prices are likely to resume their decline afterward.
Trading suggestions for tonight: Buy Bitcoin around 79,800–80,200, with a target near 81,500; buy Ethereum around 2,305–2,325, with a target near 2,380. This analysis and these strategies are for reference only; you assume all risks. Articles are reviewed and published without guaranteed timeliness. Please rely on real-time conditions! #股票财报季 #美国下周将公布Q3GDP和9月PCE #韩国推迟加密货币所得税
2
1.4k
·
--
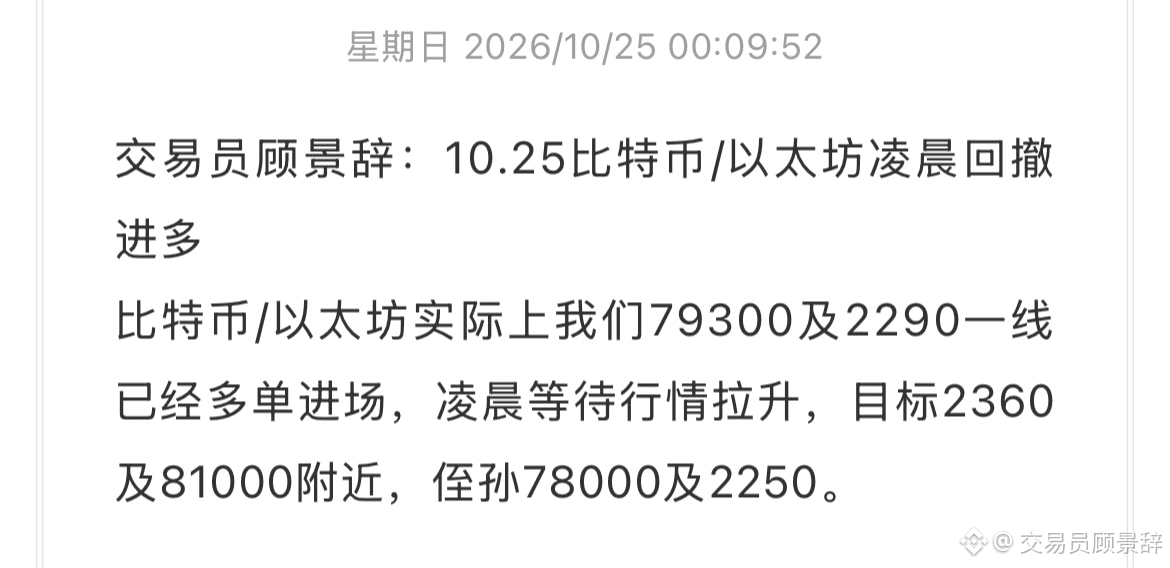
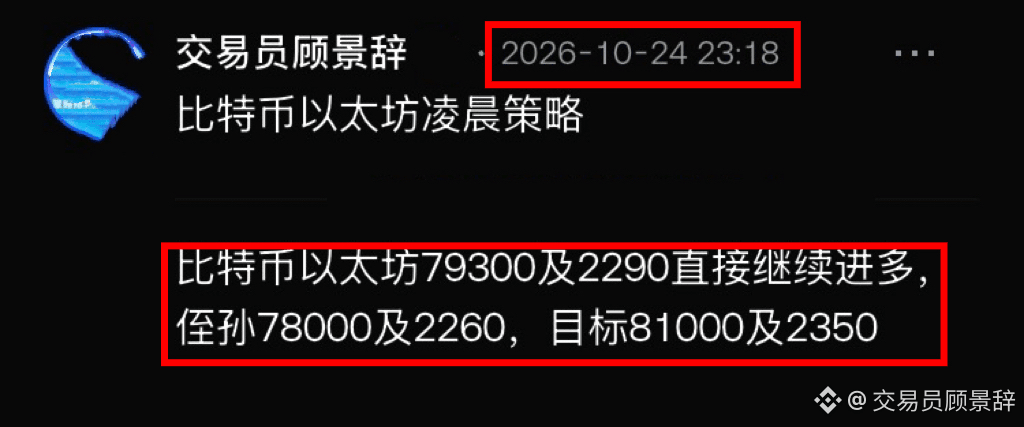
Trader Gu Jingci: Bitcoin/Ethereum and SOL spot-price long positions scored another win last night
During last night's Bitcoin/Ethereum pullback, I again reminded everyone to consider long positions near 79,300 and 2,290. After dipping, the market rebounded and rallied. It has now reached around 80,900 and 2,360, respectively, giving those long positions plenty of room to profit. Congratulations to everyone who followed the strategy! #股票财报季 #英国算法加密交易应用或需FCA授权 #道指下跌653点
Trader Gu Jingci: Bitcoin/Ethereum and SOL spot-price long positions scored another win last night
During last night's Bitcoin/Ethereum pullback, I again reminded everyone to consider long positions near 79,300 and 2,290. After dipping, the market rebounded and rallied. It has now reached around 80,900 and 2,360, respectively, giving those long positions plenty of room to profit. Congratulations to everyone who followed the strategy! #股票财报季 #英国算法加密交易应用或需FCA授权 #道指下跌653点
During last night's Bitcoin/Ethereum pullback, I again reminded everyone to consider long positions near 79,300 and 2,290. After dipping, the market rebounded and rallied. It has now reached around 80,900 and 2,360, respectively, giving those long positions plenty of room to profit. Congratulations to everyone who followed the strategy! #股票财报季 #英国算法加密交易应用或需FCA授权 #道指下跌653点
2
2
737
·
--
Trader Gu Jingci: Buy the early-morning pullback in Bitcoin/Ethereum on 10.25
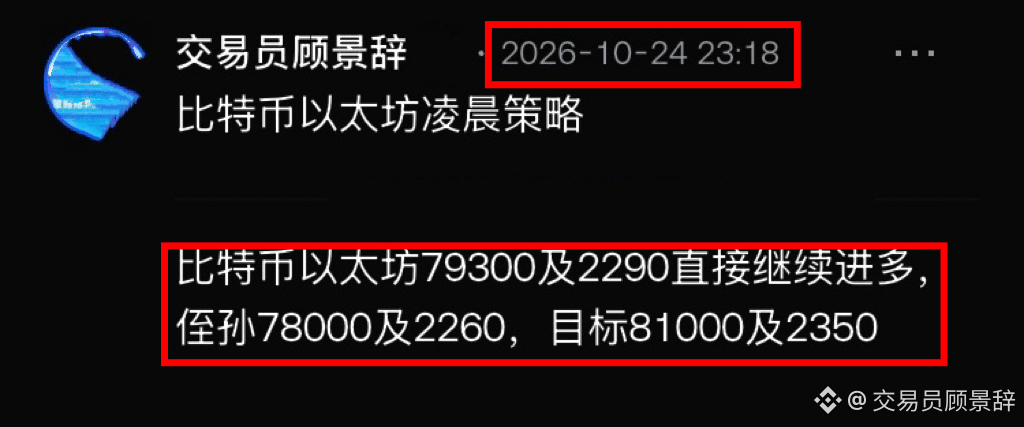
We have already entered long positions in Bitcoin/Ethereum around 79,300 and 2,290, respectively. We’ll wait for prices to rally overnight, with targets near 81,000 and 2,360, and stop-losses at 78,000 and 2,250. #币安神算子 #股票财报季 #英国算法加密交易应用或需FCA授权
Trader Gu Jingci: Buy the early-morning pullback in Bitcoin/Ethereum on 10.25
We have already entered long positions in Bitcoin/Ethereum around 79,300 and 2,290, respectively. We’ll wait for prices to rally overnight, with targets near 81,000 and 2,360, and stop-losses at 78,000 and 2,250. #币安神算子 #股票财报季 #英国算法加密交易应用或需FCA授权
We have already entered long positions in Bitcoin/Ethereum around 79,300 and 2,290, respectively. We’ll wait for prices to rally overnight, with targets near 81,000 and 2,360, and stop-losses at 78,000 and 2,250. #币安神算子 #股票财报季 #英国算法加密交易应用或需FCA授权
2
1.9k
·
--
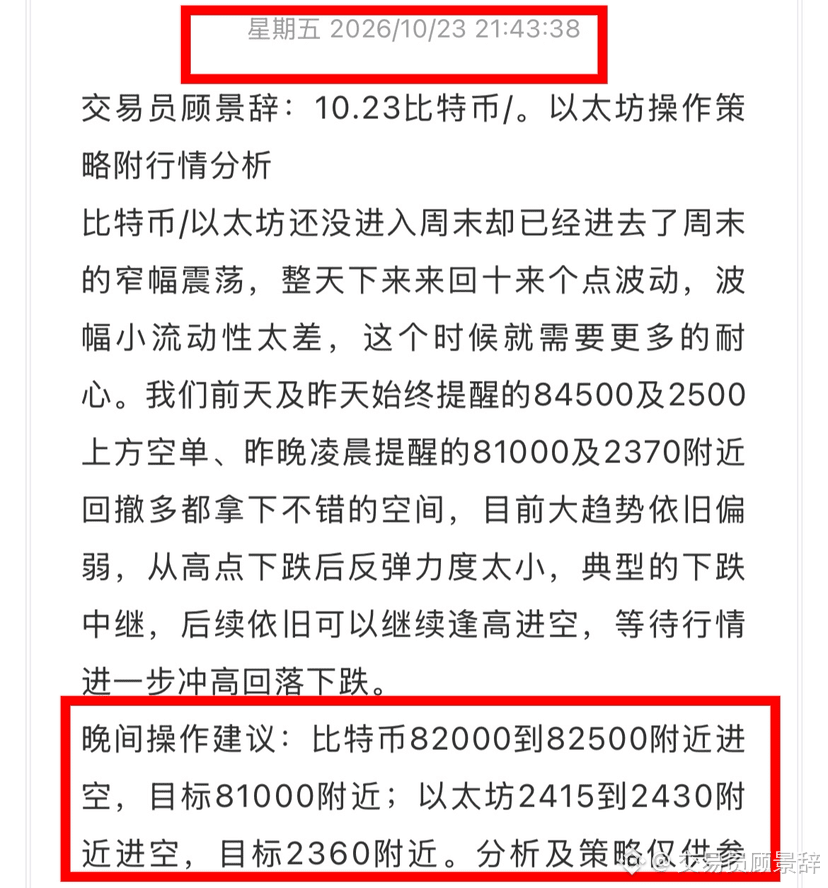
Trader Gu Jingci: Bitcoin and Ethereum short trades hit the target again
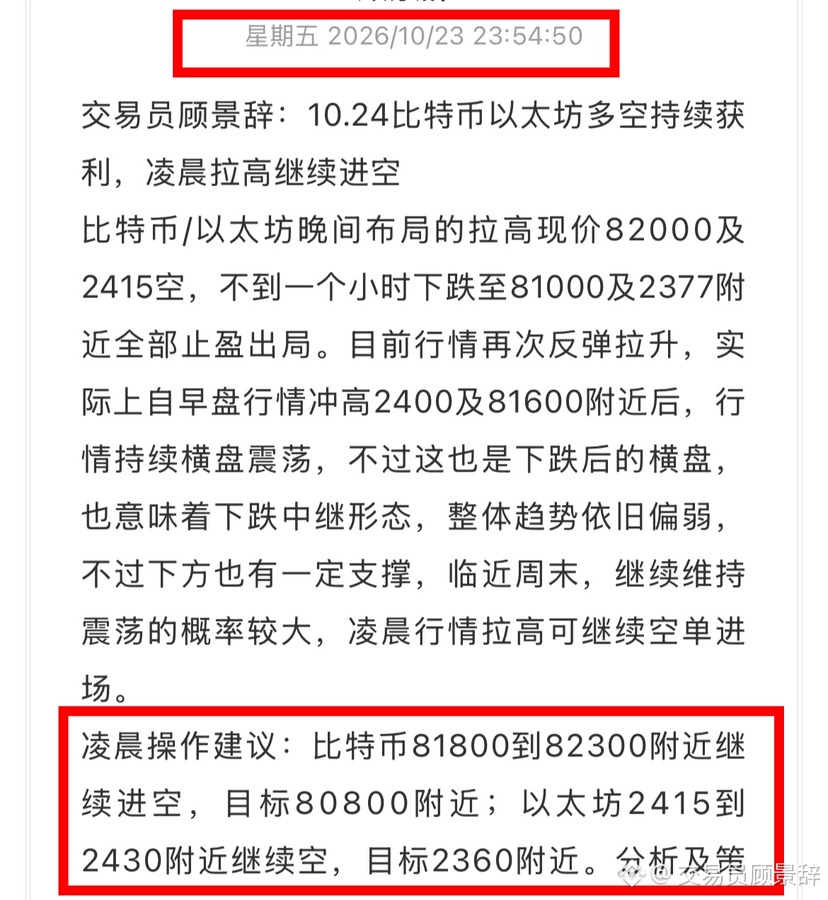
The short-trade setups for Bitcoin and Ethereum that I shared twice last night: the first entries were at 82,000 and 2,415, and in less than an hour, prices fell to around 81,000 and 2,377. Then, during the rally in the early hours, I reminded everyone to enter short positions again near 82,000 and 2,415. Prices quickly dropped to around 80,500 and 2,350, securing another 1,500 points and 60 points on the short trades. Across both trades, we successfully captured 2,500 points and 100 points. Congratulations to everyone who followed the setup. #币安神算子 #股票财报季 #IRS拟降低加密案件税务披露罚款
Trader Gu Jingci: Bitcoin and Ethereum short trades hit the target again
The short-trade setups for Bitcoin and Ethereum that I shared twice last night: the first entries were at 82,000 and 2,415, and in less than an hour, prices fell to around 81,000 and 2,377. Then, during the rally in the early hours, I reminded everyone to enter short positions again near 82,000 and 2,415. Prices quickly dropped to around 80,500 and 2,350, securing another 1,500 points and 60 points on the short trades. Across both trades, we successfully captured 2,500 points and 100 points. Congratulations to everyone who followed the setup. #币安神算子 #股票财报季 #IRS拟降低加密案件税务披露罚款
The short-trade setups for Bitcoin and Ethereum that I shared twice last night: the first entries were at 82,000 and 2,415, and in less than an hour, prices fell to around 81,000 and 2,377. Then, during the rally in the early hours, I reminded everyone to enter short positions again near 82,000 and 2,415. Prices quickly dropped to around 80,500 and 2,350, securing another 1,500 points and 60 points on the short trades. Across both trades, we successfully captured 2,500 points and 100 points. Congratulations to everyone who followed the setup. #币安神算子 #股票财报季 #IRS拟降低加密案件税务披露罚款
3
711
·
--
Trader Gu Jingci: Our strategic positioning paid off; successful trading depends on following the market in real time
The market was volatile and unpredictable this week. We planned our overall positioning in advance, our strategy played out as intended, and we achieved solid results. Markets can change in an instant, so a static strategy can rarely stay aligned with price action for long. That’s why real-time monitoring matters.
Many publicly available strategies lag behind: by the time their conclusions appear, the market move is already over, making it hard to seize opportunities in the moment. Monitoring the market in real time throughout allows us to adapt our approach as conditions change—holding on to profits when a trend emerges and adjusting promptly when the market turns, so we don’t miss out on swing-trading opportunities.
Trading isn’t about betting on a single direction; it’s about continuously reading the market’s signals. By going with the trend and staying engaged in real time, we can keep pace with the market.#币安神算子 #股票财报季 #Pepe上涨14%领涨山寨币反弹
Trader Gu Jingci: Our strategic positioning paid off; successful trading depends on following the market in real time
The market was volatile and unpredictable this week. We planned our overall positioning in advance, our strategy played out as intended, and we achieved solid results. Markets can change in an instant, so a static strategy can rarely stay aligned with price action for long. That’s why real-time monitoring matters.
Many publicly available strategies lag behind: by the time their conclusions appear, the market move is already over, making it hard to seize opportunities in the moment. Monitoring the market in real time throughout allows us to adapt our approach as conditions change—holding on to profits when a trend emerges and adjusting promptly when the market turns, so we don’t miss out on swing-trading opportunities.
Trading isn’t about betting on a single direction; it’s about continuously reading the market’s signals. By going with the trend and staying engaged in real time, we can keep pace with the market.#币安神算子 #股票财报季 #Pepe上涨14%领涨山寨币反弹
The market was volatile and unpredictable this week. We planned our overall positioning in advance, our strategy played out as intended, and we achieved solid results. Markets can change in an instant, so a static strategy can rarely stay aligned with price action for long. That’s why real-time monitoring matters.
Many publicly available strategies lag behind: by the time their conclusions appear, the market move is already over, making it hard to seize opportunities in the moment. Monitoring the market in real time throughout allows us to adapt our approach as conditions change—holding on to profits when a trend emerges and adjusting promptly when the market turns, so we don’t miss out on swing-trading opportunities.
Trading isn’t about betting on a single direction; it’s about continuously reading the market’s signals. By going with the trend and staying engaged in real time, we can keep pace with the market.#币安神算子 #股票财报季 #Pepe上涨14%领涨山寨币反弹
1
1k
·
--
Trader Gu Jingci: Continued profits from long and short trades in Bitcoin and Ethereum on 10/24; short again after the early-morning spike
The Bitcoin and Ethereum short positions entered after prices spiked in the evening—at 82,000 and 2,415, respectively—were both closed for profit in less than an hour, as prices fell to around 81,000 and 2,377. The market has rebounded and risen again. In fact, after reaching highs of around 2,400 and 81,600 earlier today, prices have continued to move sideways. However, this consolidation comes after a decline and may indicate a continuation pattern within the downtrend. The overall trend remains weak, although there is some support below. With the weekend approaching, the market is more likely to remain range-bound. If prices spike in the early hours, consider entering short positions again.
Early-morning trading plan: Continue shorting Bitcoin around 81,800–82,300, targeting around 80,800; continue shorting Ethereum around 2,415–2,430, targeting around 2,360. This analysis and these strategies are for reference only; trade at your own risk. Articles are reviewed before publication and may not be timely. Please refer to real-time market conditions! #股票财报季 #Pepe上涨14%领涨山寨币反弹 #黄金自7月以来首次跌破4000美元
Trader Gu Jingci: Continued profits from long and short trades in Bitcoin and Ethereum on 10/24; short again after the early-morning spike
The Bitcoin and Ethereum short positions entered after prices spiked in the evening—at 82,000 and 2,415, respectively—were both closed for profit in less than an hour, as prices fell to around 81,000 and 2,377. The market has rebounded and risen again. In fact, after reaching highs of around 2,400 and 81,600 earlier today, prices have continued to move sideways. However, this consolidation comes after a decline and may indicate a continuation pattern within the downtrend. The overall trend remains weak, although there is some support below. With the weekend approaching, the market is more likely to remain range-bound. If prices spike in the early hours, consider entering short positions again.
Early-morning trading plan: Continue shorting Bitcoin around 81,800–82,300, targeting around 80,800; continue shorting Ethereum around 2,415–2,430, targeting around 2,360. This analysis and these strategies are for reference only; trade at your own risk. Articles are reviewed before publication and may not be timely. Please refer to real-time market conditions! #股票财报季 #Pepe上涨14%领涨山寨币反弹 #黄金自7月以来首次跌破4000美元
The Bitcoin and Ethereum short positions entered after prices spiked in the evening—at 82,000 and 2,415, respectively—were both closed for profit in less than an hour, as prices fell to around 81,000 and 2,377. The market has rebounded and risen again. In fact, after reaching highs of around 2,400 and 81,600 earlier today, prices have continued to move sideways. However, this consolidation comes after a decline and may indicate a continuation pattern within the downtrend. The overall trend remains weak, although there is some support below. With the weekend approaching, the market is more likely to remain range-bound. If prices spike in the early hours, consider entering short positions again.
Early-morning trading plan: Continue shorting Bitcoin around 81,800–82,300, targeting around 80,800; continue shorting Ethereum around 2,415–2,430, targeting around 2,360. This analysis and these strategies are for reference only; trade at your own risk. Articles are reviewed before publication and may not be timely. Please refer to real-time market conditions! #股票财报季 #Pepe上涨14%领涨山寨币反弹 #黄金自7月以来首次跌破4000美元
3
538
·
--
Trader Gu Jingci: 10.23 Bitcoin/Ethereum Trading Strategy and Market Analysis
Bitcoin and Ethereum haven't even reached the weekend, but they're already trading in the narrow range typical of a weekend. After fluctuating by around ten points throughout the day, volatility is low and liquidity is poor, so more patience is needed at this point. The short positions above 84,500 and 2,500 that we've consistently highlighted over the past two days, as well as the long positions on pullbacks near 81,000 and 2,370 that we mentioned early this morning, have all captured solid gains. The overall trend remains weak. The rebound after the drop from the highs has been too small—a classic continuation pattern in a downtrend. Going forward, we can continue to look for opportunities to short on rallies, waiting for the market to rise further before pulling back and falling.
Evening trading suggestions: Short Bitcoin around 82,000–82,500, targeting around 81,000; short Ethereum around 2,415–2,430, targeting around 2,360. This analysis and these strategies are for reference only; you assume all risks. Articles are subject to review before publication and may not be timely. Please refer to real-time conditions! #股票财报季 #Pepe上涨14%领涨山寨币反弹 #Gold falls below $4,000 for the first time since July
Trader Gu Jingci: 10.23 Bitcoin/Ethereum Trading Strategy and Market Analysis
Bitcoin and Ethereum haven't even reached the weekend, but they're already trading in the narrow range typical of a weekend. After fluctuating by around ten points throughout the day, volatility is low and liquidity is poor, so more patience is needed at this point. The short positions above 84,500 and 2,500 that we've consistently highlighted over the past two days, as well as the long positions on pullbacks near 81,000 and 2,370 that we mentioned early this morning, have all captured solid gains. The overall trend remains weak. The rebound after the drop from the highs has been too small—a classic continuation pattern in a downtrend. Going forward, we can continue to look for opportunities to short on rallies, waiting for the market to rise further before pulling back and falling.
Evening trading suggestions: Short Bitcoin around 82,000–82,500, targeting around 81,000; short Ethereum around 2,415–2,430, targeting around 2,360. This analysis and these strategies are for reference only; you assume all risks. Articles are subject to review before publication and may not be timely. Please refer to real-time conditions! #股票财报季 #Pepe上涨14%领涨山寨币反弹 #Gold falls below $4,000 for the first time since July
Bitcoin and Ethereum haven't even reached the weekend, but they're already trading in the narrow range typical of a weekend. After fluctuating by around ten points throughout the day, volatility is low and liquidity is poor, so more patience is needed at this point. The short positions above 84,500 and 2,500 that we've consistently highlighted over the past two days, as well as the long positions on pullbacks near 81,000 and 2,370 that we mentioned early this morning, have all captured solid gains. The overall trend remains weak. The rebound after the drop from the highs has been too small—a classic continuation pattern in a downtrend. Going forward, we can continue to look for opportunities to short on rallies, waiting for the market to rise further before pulling back and falling.
Evening trading suggestions: Short Bitcoin around 82,000–82,500, targeting around 81,000; short Ethereum around 2,415–2,430, targeting around 2,360. This analysis and these strategies are for reference only; you assume all risks. Articles are subject to review before publication and may not be timely. Please refer to real-time conditions! #股票财报季 #Pepe上涨14%领涨山寨币反弹 #Gold falls below $4,000 for the first time since July
1
798
·
--
Trader Gu Jingci: Bitcoin/Ethereum fell as expected on 10/23, with an analysis of early-morning trading strategies
The short positions in Bitcoin/Ethereum that I repeatedly mentioned last night and during today's daytime session should have brought over 3,000 points and 100 points of gains, respectively, for those who followed the strategy. After sharing multiple trade setups this week, the overall gains on Ethereum alone have reached at least 300 points. Since breaking below 82,000 and 2,400 this afternoon, the market has been weak overall, with only a feeble rebound. The 4-hour chart has recently seen a sharp decline accompanied by high trading volume, indicating strong selling pressure. The latest candlestick has a small body and extremely low volume, suggesting that the market is hesitating or consolidating in the short term.
On the daily chart, the rally ended with a large bearish candlestick on elevated trading volume, confirming strong short-term bearish sentiment and wiping out the gains of the previous two days. Among the technical indicators, the 4-hour DIF line has crossed below the DEA line, and both lines are below the zero axis. The MACD histogram is negative and continues to expand, clearly indicating a strong downtrend. Going forward, focus on support around 79,500 and 2,300 below, and resistance around 84,000 and 2,480 above.
Early-morning trading suggestions: Buy Bitcoin around 80,800–81,200, with a target near 82,500; buy Ethereum around 2,355–2,375, with a target near 2,430. This analysis and these strategies are for reference only; trade at your own risk. Articles are not necessarily published in a timely manner, so please refer to real-time market conditions! #币安神算子 #特斯拉盘前下跌5% #South Korea's KOSPI fell 3.52% to its lowest level since April
Trader Gu Jingci: Bitcoin/Ethereum fell as expected on 10/23, with an analysis of early-morning trading strategies
The short positions in Bitcoin/Ethereum that I repeatedly mentioned last night and during today's daytime session should have brought over 3,000 points and 100 points of gains, respectively, for those who followed the strategy. After sharing multiple trade setups this week, the overall gains on Ethereum alone have reached at least 300 points. Since breaking below 82,000 and 2,400 this afternoon, the market has been weak overall, with only a feeble rebound. The 4-hour chart has recently seen a sharp decline accompanied by high trading volume, indicating strong selling pressure. The latest candlestick has a small body and extremely low volume, suggesting that the market is hesitating or consolidating in the short term.
On the daily chart, the rally ended with a large bearish candlestick on elevated trading volume, confirming strong short-term bearish sentiment and wiping out the gains of the previous two days. Among the technical indicators, the 4-hour DIF line has crossed below the DEA line, and both lines are below the zero axis. The MACD histogram is negative and continues to expand, clearly indicating a strong downtrend. Going forward, focus on support around 79,500 and 2,300 below, and resistance around 84,000 and 2,480 above.
Early-morning trading suggestions: Buy Bitcoin around 80,800–81,200, with a target near 82,500; buy Ethereum around 2,355–2,375, with a target near 2,430. This analysis and these strategies are for reference only; trade at your own risk. Articles are not necessarily published in a timely manner, so please refer to real-time market conditions! #币安神算子 #特斯拉盘前下跌5% #South Korea's KOSPI fell 3.52% to its lowest level since April
The short positions in Bitcoin/Ethereum that I repeatedly mentioned last night and during today's daytime session should have brought over 3,000 points and 100 points of gains, respectively, for those who followed the strategy. After sharing multiple trade setups this week, the overall gains on Ethereum alone have reached at least 300 points. Since breaking below 82,000 and 2,400 this afternoon, the market has been weak overall, with only a feeble rebound. The 4-hour chart has recently seen a sharp decline accompanied by high trading volume, indicating strong selling pressure. The latest candlestick has a small body and extremely low volume, suggesting that the market is hesitating or consolidating in the short term.
On the daily chart, the rally ended with a large bearish candlestick on elevated trading volume, confirming strong short-term bearish sentiment and wiping out the gains of the previous two days. Among the technical indicators, the 4-hour DIF line has crossed below the DEA line, and both lines are below the zero axis. The MACD histogram is negative and continues to expand, clearly indicating a strong downtrend. Going forward, focus on support around 79,500 and 2,300 below, and resistance around 84,000 and 2,480 above.
Early-morning trading suggestions: Buy Bitcoin around 80,800–81,200, with a target near 82,500; buy Ethereum around 2,355–2,375, with a target near 2,430. This analysis and these strategies are for reference only; trade at your own risk. Articles are not necessarily published in a timely manner, so please refer to real-time market conditions! #币安神算子 #特斯拉盘前下跌5% #South Korea's KOSPI fell 3.52% to its lowest level since April
2
811
·
--
Trader Gu Jingci: 10.22 Bitcoin and Ethereum Evening Video Analysis#特斯拉盘前下跌5% #韩国KOSPI收跌3.52%至4月以来低点 #特斯拉英伟达将投资三星电机
Trader Gu Jingci: 10.22 Bitcoin and Ethereum Evening Video Analysis#特斯拉盘前下跌5% #韩国KOSPI收跌3.52%至4月以来低点 #特斯拉英伟达将投资三星电机
1
552
·
--
Trader Gu Jingci: The strategy just released has a small stop-loss; I’ll continue entering positions this evening
The short-selling strategy for Bitcoin/Ethereum that I just set up has a small stop-loss of 400 points and 20 points of room. I’m preparing to continue opening short positions this evening, using the current prices of 84500 and 2500 as reference points, with targets around 82000 and 2400.#股票财报季 #Zcash开发者确认11月NU7升级 #OCC发布GENIUS法案首个最终规则
Trader Gu Jingci: The strategy just released has a small stop-loss; I’ll continue entering positions this evening
The short-selling strategy for Bitcoin/Ethereum that I just set up has a small stop-loss of 400 points and 20 points of room. I’m preparing to continue opening short positions this evening, using the current prices of 84500 and 2500 as reference points, with targets around 82000 and 2400.#股票财报季 #Zcash开发者确认11月NU7升级 #OCC发布GENIUS法案首个最终规则
The short-selling strategy for Bitcoin/Ethereum that I just set up has a small stop-loss of 400 points and 20 points of room. I’m preparing to continue opening short positions this evening, using the current prices of 84500 and 2500 as reference points, with targets around 82000 and 2400.#股票财报季 #Zcash开发者确认11月NU7升级 #OCC发布GENIUS法案首个最终规则
6
20.8k
·
--
Trader Gu Jingci: Key Bitcoin/Ethereum levels to watch tonight and early tomorrow morning
For Bitcoin/Ethereum tonight and early tomorrow morning, focus on the recent daily highs around 84,500 and 2,500. If entering a short, just place your stop-loss at these levels. As long as the market hasn’t broken through, enter short directly on a rally. Based on current prices, short around 84,100 and 2,480, with targets near 82,500 and 2,400. #Zcash开发者确认11月NU7升级 #OCC发布GENIUS法案首个最终规则 #股票财报季
Trader Gu Jingci: Key Bitcoin/Ethereum levels to watch tonight and early tomorrow morning
For Bitcoin/Ethereum tonight and early tomorrow morning, focus on the recent daily highs around 84,500 and 2,500. If entering a short, just place your stop-loss at these levels. As long as the market hasn’t broken through, enter short directly on a rally. Based on current prices, short around 84,100 and 2,480, with targets near 82,500 and 2,400. #Zcash开发者确认11月NU7升级 #OCC发布GENIUS法案首个最终规则 #股票财报季
For Bitcoin/Ethereum tonight and early tomorrow morning, focus on the recent daily highs around 84,500 and 2,500. If entering a short, just place your stop-loss at these levels. As long as the market hasn’t broken through, enter short directly on a rally. Based on current prices, short around 84,100 and 2,480, with targets near 82,500 and 2,400. #Zcash开发者确认11月NU7升级 #OCC发布GENIUS法案首个最终规则 #股票财报季
2
967
·
--
Trader Gu Jingci: 10.21 Bitcoin and Ethereum (BTC, ETH) Evening Video Analysis #特朗普拟阐述打击海外加密诈骗 #韩国散户单股杠杆ETP亏损6.3万亿韩元 #GENIUS法案预计2027年1月18日生效
Trader Gu Jingci: 10.21 Bitcoin and Ethereum (BTC, ETH) Evening Video Analysis #特朗普拟阐述打击海外加密诈骗 #韩国散户单股杠杆ETP亏损6.3万亿韩元 #GENIUS法案预计2027年1月18日生效
2
670
·
--
Trader Gu Jingci: 10.20 Bitcoin and Ethereum (BTC, ETH) Evening Video Analysis #股票财报季 #瑞士批准首只比特币ETF #SkyAI出售全部SOL并发起现金要约收购
Trader Gu Jingci: 10.20 Bitcoin and Ethereum (BTC, ETH) Evening Video Analysis #股票财报季 #瑞士批准首只比特币ETF #SkyAI出售全部SOL并发起现金要约收购
1
925
·
--
Trader Gu Jingci: Bitcoin and Ethereum Evening Trading Strategy for 10/20, with Market Analysis
Bitcoin and Ethereum surged again this evening, reaching around 83,300 and 2,470. Tonight and into the early hours, pay close attention to whether prices break through the previous daily highs around 84,400 and 2,500. Don’t treat it as a breakout before prices break through and hold above these levels. Overhead resistance remains significant, so don’t chase the rally; a rise in price also provides a good opportunity to enter short positions. There was no positive news catalyst behind the rapid evening rally. The main factors were weak intraday liquidity combined with concentrated short covering, creating a short-term short squeeze. Improving risk appetite in the broader market also brought buyers in and fueled the rebound. Nighttime price movements can be rapid and their continuation is uncertain, so don’t blindly chase highs. Follow real-time market signals and wait for the rebound to run its course before looking for a change in direction.
Evening trading suggestions: Short Bitcoin around 83,000–84,000, targeting around 81,500; short Ethereum around 2,460–2,480, targeting around 2,380. Set stop-losses at 84,500 for Bitcoin and 2,500 for Ethereum. This analysis and strategy are for reference only; you assume all risk. The article’s review and publication may not be timely, so rely on real-time conditions! #股票财报季 #瑞士批准首只比特币ETF #SkyAI出售全部SOL并发起现金要约收购
Trader Gu Jingci: Bitcoin and Ethereum Evening Trading Strategy for 10/20, with Market Analysis
Bitcoin and Ethereum surged again this evening, reaching around 83,300 and 2,470. Tonight and into the early hours, pay close attention to whether prices break through the previous daily highs around 84,400 and 2,500. Don’t treat it as a breakout before prices break through and hold above these levels. Overhead resistance remains significant, so don’t chase the rally; a rise in price also provides a good opportunity to enter short positions. There was no positive news catalyst behind the rapid evening rally. The main factors were weak intraday liquidity combined with concentrated short covering, creating a short-term short squeeze. Improving risk appetite in the broader market also brought buyers in and fueled the rebound. Nighttime price movements can be rapid and their continuation is uncertain, so don’t blindly chase highs. Follow real-time market signals and wait for the rebound to run its course before looking for a change in direction.
Evening trading suggestions: Short Bitcoin around 83,000–84,000, targeting around 81,500; short Ethereum around 2,460–2,480, targeting around 2,380. Set stop-losses at 84,500 for Bitcoin and 2,500 for Ethereum. This analysis and strategy are for reference only; you assume all risk. The article’s review and publication may not be timely, so rely on real-time conditions! #股票财报季 #瑞士批准首只比特币ETF #SkyAI出售全部SOL并发起现金要约收购
Bitcoin and Ethereum surged again this evening, reaching around 83,300 and 2,470. Tonight and into the early hours, pay close attention to whether prices break through the previous daily highs around 84,400 and 2,500. Don’t treat it as a breakout before prices break through and hold above these levels. Overhead resistance remains significant, so don’t chase the rally; a rise in price also provides a good opportunity to enter short positions. There was no positive news catalyst behind the rapid evening rally. The main factors were weak intraday liquidity combined with concentrated short covering, creating a short-term short squeeze. Improving risk appetite in the broader market also brought buyers in and fueled the rebound. Nighttime price movements can be rapid and their continuation is uncertain, so don’t blindly chase highs. Follow real-time market signals and wait for the rebound to run its course before looking for a change in direction.
Evening trading suggestions: Short Bitcoin around 83,000–84,000, targeting around 81,500; short Ethereum around 2,460–2,480, targeting around 2,380. Set stop-losses at 84,500 for Bitcoin and 2,500 for Ethereum. This analysis and strategy are for reference only; you assume all risk. The article’s review and publication may not be timely, so rely on real-time conditions! #股票财报季 #瑞士批准首只比特币ETF #SkyAI出售全部SOL并发起现金要约收购
1
1k
·
--
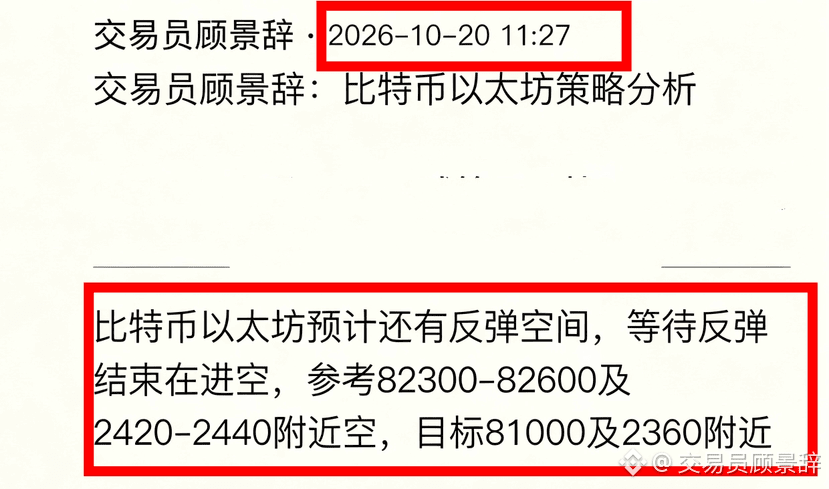
Trader Gu Jingci: The Bitcoin/Ethereum strategy continues to profit. We planned short positions again near 2,420 and 82,300 in the morning. After prices surged and then pulled back to around 81,400 and 2,385, the short positions once again captured solid gains. #美国比特币ETF净流入5.27亿美元 #韩国KOSPI指数跌超2% #Elice韩股上市首日暴跌33%
Trader Gu Jingci: The Bitcoin/Ethereum strategy continues to profit. We planned short positions again near 2,420 and 82,300 in the morning. After prices surged and then pulled back to around 81,400 and 2,385, the short positions once again captured solid gains. #美国比特币ETF净流入5.27亿美元 #韩国KOSPI指数跌超2% #Elice韩股上市首日暴跌33%
1
913
·
--
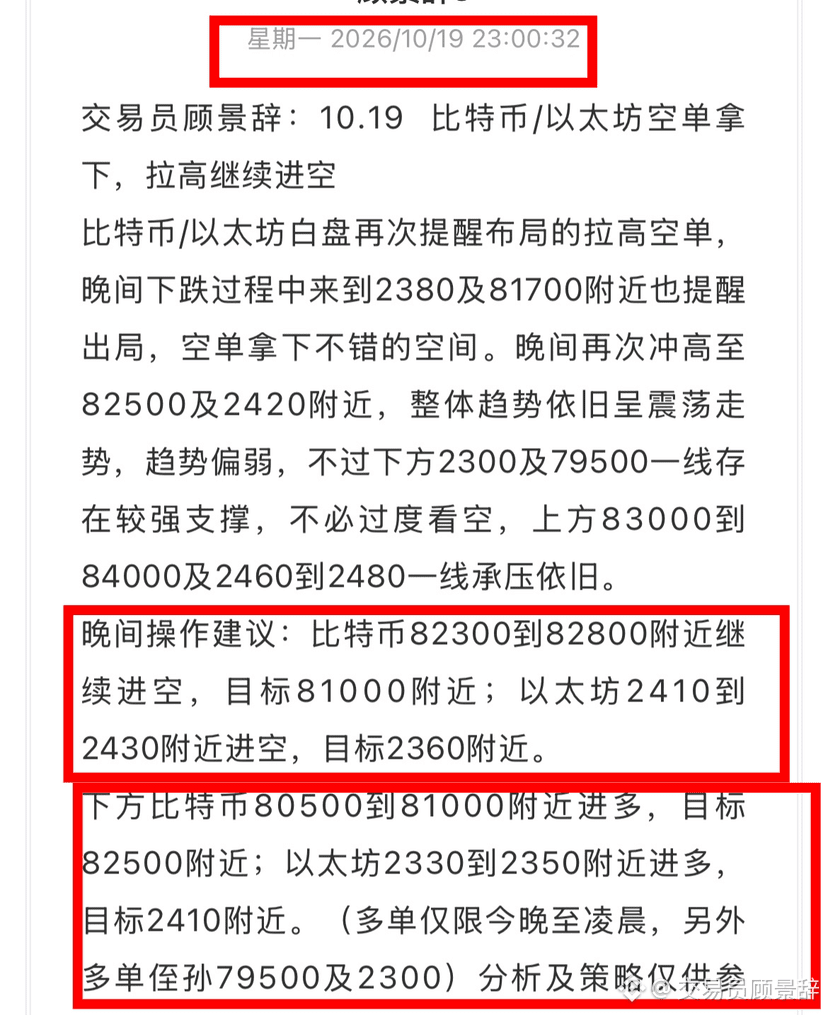
Trader Gu Jingci: Validating the Bitcoin/Ethereum strategy of going short first, then long—conservative in appearance, but accurate on the trend
After taking profit on yesterday’s daytime short positions in Bitcoin/Ethereum, we continued with the plan to go short first and then long in the evening. The long positions were somewhat conservative, but the overall trend call was on target. Those who stand by remain where they are; those who take action move forward together.
Markets aren’t won with talk; results come down to action. When the direction is unclear, stay composed. When a trend emerges, follow it decisively.
Knowing how to choose, learning to leverage your resources, and staying clear-headed—that’s the wisdom ordinary people need in the market. All like-minded people are welcome. Don’t just watch from the sidelines—be someone who takes action. #韩国KOSPI指数跌超2% #Elice韩股上市首日暴跌33% #谷歌更新阿联酋加密广告规则
Trader Gu Jingci: Validating the Bitcoin/Ethereum strategy of going short first, then long—conservative in appearance, but accurate on the trend
After taking profit on yesterday’s daytime short positions in Bitcoin/Ethereum, we continued with the plan to go short first and then long in the evening. The long positions were somewhat conservative, but the overall trend call was on target. Those who stand by remain where they are; those who take action move forward together.
Markets aren’t won with talk; results come down to action. When the direction is unclear, stay composed. When a trend emerges, follow it decisively.
Knowing how to choose, learning to leverage your resources, and staying clear-headed—that’s the wisdom ordinary people need in the market. All like-minded people are welcome. Don’t just watch from the sidelines—be someone who takes action. #韩国KOSPI指数跌超2% #Elice韩股上市首日暴跌33% #谷歌更新阿联酋加密广告规则
After taking profit on yesterday’s daytime short positions in Bitcoin/Ethereum, we continued with the plan to go short first and then long in the evening. The long positions were somewhat conservative, but the overall trend call was on target. Those who stand by remain where they are; those who take action move forward together.
Markets aren’t won with talk; results come down to action. When the direction is unclear, stay composed. When a trend emerges, follow it decisively.
Knowing how to choose, learning to leverage your resources, and staying clear-headed—that’s the wisdom ordinary people need in the market. All like-minded people are welcome. Don’t just watch from the sidelines—be someone who takes action. #韩国KOSPI指数跌超2% #Elice韩股上市首日暴跌33% #谷歌更新阿联酋加密广告规则
1
669
·
--
Trader Gu Jingci: In the same market, why do some people make a profit while others get stuck in losing positions?
The market is never short of opportunities; what’s lacking is the discipline to stay true to your principles. As the market fluctuates, some people will always make profits while others get stuck in losing positions. With the same market conditions, different entry timing and risk management can lead to vastly different outcomes.
Many people lose money not because they can’t read the market, but because they can’t wait. They let short-term fluctuations sway their emotions and frequently open positions, chasing rallies and selling into dips. Opportunities won’t disappear, but once your capital is gone, even the best market conditions are no use to you.
Go with the trend, trade only markets you understand, and manage your position size well. You don’t have to catch every move. Patiently wait for the opportunities that are right for you. Securing profits is far more important than fantasizing about huge gains. Keep to your rhythm, and you’ll be able to stay in the market for the long haul. #加密金库存款超100亿美元 #比特币突破8.3万美元 #USD1: The stablecoin’s market capitalization fell by more than $400 million in two weeks
Trader Gu Jingci: In the same market, why do some people make a profit while others get stuck in losing positions?
The market is never short of opportunities; what’s lacking is the discipline to stay true to your principles. As the market fluctuates, some people will always make profits while others get stuck in losing positions. With the same market conditions, different entry timing and risk management can lead to vastly different outcomes.
Many people lose money not because they can’t read the market, but because they can’t wait. They let short-term fluctuations sway their emotions and frequently open positions, chasing rallies and selling into dips. Opportunities won’t disappear, but once your capital is gone, even the best market conditions are no use to you.
Go with the trend, trade only markets you understand, and manage your position size well. You don’t have to catch every move. Patiently wait for the opportunities that are right for you. Securing profits is far more important than fantasizing about huge gains. Keep to your rhythm, and you’ll be able to stay in the market for the long haul. #加密金库存款超100亿美元 #比特币突破8.3万美元 #USD1: The stablecoin’s market capitalization fell by more than $400 million in two weeks
The market is never short of opportunities; what’s lacking is the discipline to stay true to your principles. As the market fluctuates, some people will always make profits while others get stuck in losing positions. With the same market conditions, different entry timing and risk management can lead to vastly different outcomes.
Many people lose money not because they can’t read the market, but because they can’t wait. They let short-term fluctuations sway their emotions and frequently open positions, chasing rallies and selling into dips. Opportunities won’t disappear, but once your capital is gone, even the best market conditions are no use to you.
Go with the trend, trade only markets you understand, and manage your position size well. You don’t have to catch every move. Patiently wait for the opportunities that are right for you. Securing profits is far more important than fantasizing about huge gains. Keep to your rhythm, and you’ll be able to stay in the market for the long haul. #加密金库存款超100亿美元 #比特币突破8.3万美元 #USD1: The stablecoin’s market capitalization fell by more than $400 million in two weeks
3
449
Log in to explore more content
Join global crypto users on Binance Square
⚡️ Get latest and useful information about crypto.
💬 Trusted by the world’s largest crypto exchange.
👍 Discover real insights from verified creators.
Email / Phone number
Trending Topics
BinancePick
2.6M views
138,898 Discussing
Join #EarningsSeason: Predict Earnings on Binance Pick, Share Your Take on Binance Square!
Binance Square Official
·400 Likes
·337.4k views
EarningsSeason
5M views
24,021 Discussing
ElectrumWalletBugLetRogueServersStealFunds
3,254 views
168 Discussing