
CryptoHaiduc
168 Posts

CryptoHaiduc
Report
Block User
Open Trade
Occasional Trader
5.1 Years
0 Following
77 Followers
346 Liked
Posts
Portfolio
All
Quotes
Videos
PINNED
·
--
🚨 DON'T GET CAUGHT IN THE BITCOIN TRAP!
Bitcoin is following the pattern I predicted weeks ago. This could be the final bull trap of the cycle.
Remember, I called Bitcoin's $17K bottom in 2022 and $126K top in 2025, both in advance.
Don't mistake a temporary bounce for a trend reversal. Stay cautious and protect your capital.
Follow me for my next Bitcoin call! 📉
🚨 DON'T GET CAUGHT IN THE BITCOIN TRAP!
Bitcoin is following the pattern I predicted weeks ago. This could be the final bull trap of the cycle.
Remember, I called Bitcoin's $17K bottom in 2022 and $126K top in 2025, both in advance.
Don't mistake a temporary bounce for a trend reversal. Stay cautious and protect your capital.
Follow me for my next Bitcoin call! 📉
Bitcoin is following the pattern I predicted weeks ago. This could be the final bull trap of the cycle.
Remember, I called Bitcoin's $17K bottom in 2022 and $126K top in 2025, both in advance.
Don't mistake a temporary bounce for a trend reversal. Stay cautious and protect your capital.
Follow me for my next Bitcoin call! 📉
1
49
7.2k
·
--
Verified
Kraken vs. Binance: Bitcoin Sold at ~$18,300 on Kraken While Trading at $57K Everywhere Else 🚨⚠️
If you ever needed a real-world stress test on why trading venue liquidity is a core risk-management pillar, look at what just unfolded on Kraken’s BTC/CAD pair.
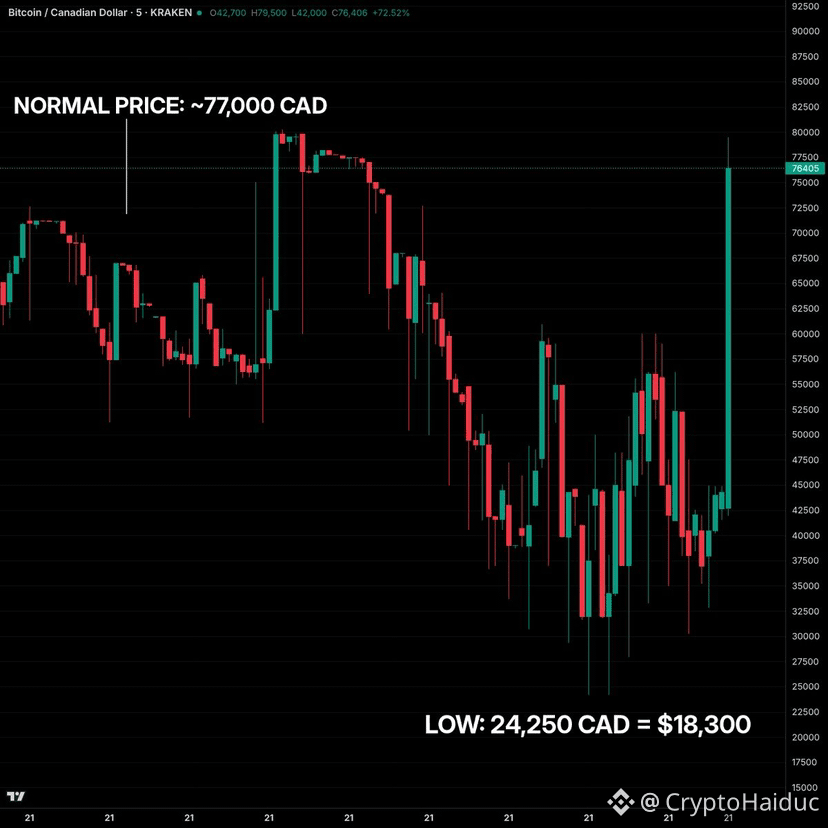
While global Bitcoin hovered near the mid-$50,000s, heavy sell pressure against thin Canadian dollar order books and deposit/arbitrage friction sent BTC/CAD down to 24,250 CAD (roughly ~$16,900 - $18,300 USD depending on FX conversion) - a massive dislocation of roughly 68% - 71% below broader market pricing.
🔴 What Happened & Why "Executed Trades Stand" Hurts
📌 Sell orders overwhelmed thin CAD buy-side depth, while deposit limits and slow CAD inflows delayed arbitrage from quickly closing the gap.
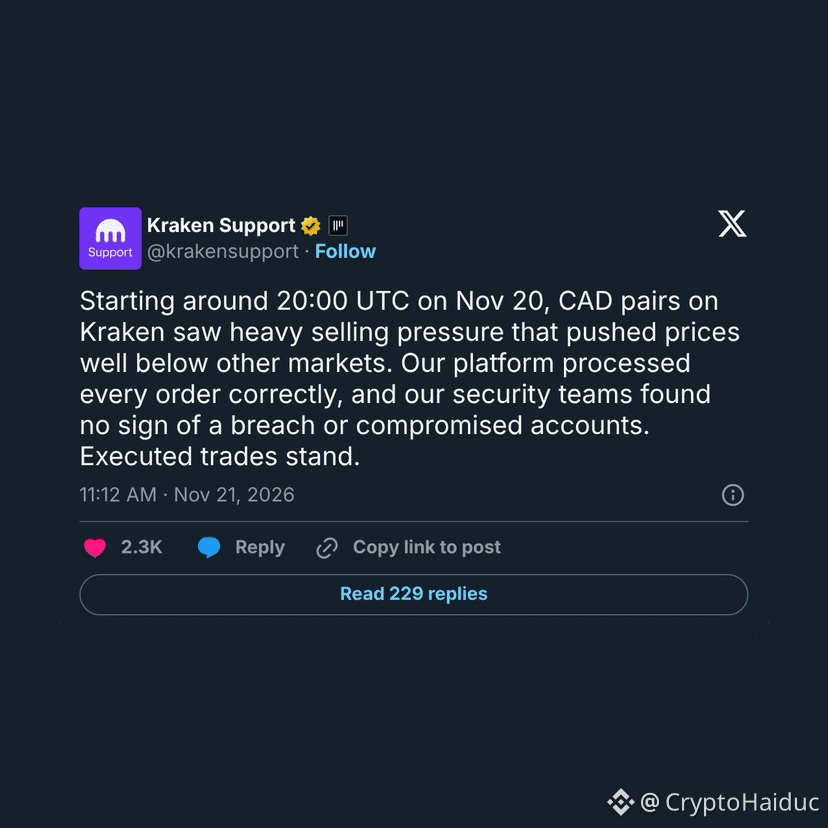
📌 #Kraken confirmed there was no security breach or compromised accounts, stating that orders were processed normally and executed trades stand—meaning bargain buyers kept cheap fills, while sellers or stop-losses on that thin book took severe price slippage.
📌 That is the harsh reality of low-liquidity pairs during acute market stress: when order book depth thins out, execution price can detach violently from global benchmarks.
🛡️ Kraken vs. #Binance : Why We Appreciate Being on Binance
Comparing localized order-book dislocations against tier-1 global liquidity highlights the practical edge of trading where depth and participation are deepest:
1️⃣ Order Book Depth & Liquidity Cushion: Deep global liquidity and heavy active market-maker participation help absorb sharp order flow without isolated books snapping as easily.
2️⃣ Tighter Alignment With Global Price Discovery: High-volume venues generally maintain much tighter alignment with global reference prices during fast cascades, reducing extreme localized slippage risk.
3️⃣ Operational Resilience Under Stress: Even in volatile sessions where liquidations spike across the market, deep books and high-throughput matching engines are critical to executing risk controls cleanly.
$BTC
#BTC #BinanceSquare
{spot}(BTCUSDT)
Kraken vs. Binance: Bitcoin Sold at ~$18,300 on Kraken While Trading at $57K Everywhere Else 🚨⚠️
If you ever needed a real-world stress test on why trading venue liquidity is a core risk-management pillar, look at what just unfolded on Kraken’s BTC/CAD pair.
While global Bitcoin hovered near the mid-$50,000s, heavy sell pressure against thin Canadian dollar order books and deposit/arbitrage friction sent BTC/CAD down to 24,250 CAD (roughly ~$16,900 - $18,300 USD depending on FX conversion) - a massive dislocation of roughly 68% - 71% below broader market pricing.
🔴 What Happened & Why "Executed Trades Stand" Hurts
📌 Sell orders overwhelmed thin CAD buy-side depth, while deposit limits and slow CAD inflows delayed arbitrage from quickly closing the gap.
📌 #Kraken confirmed there was no security breach or compromised accounts, stating that orders were processed normally and executed trades stand—meaning bargain buyers kept cheap fills, while sellers or stop-losses on that thin book took severe price slippage.
📌 That is the harsh reality of low-liquidity pairs during acute market stress: when order book depth thins out, execution price can detach violently from global benchmarks.
🛡️ Kraken vs. #Binance : Why We Appreciate Being on Binance
Comparing localized order-book dislocations against tier-1 global liquidity highlights the practical edge of trading where depth and participation are deepest:
1️⃣ Order Book Depth & Liquidity Cushion: Deep global liquidity and heavy active market-maker participation help absorb sharp order flow without isolated books snapping as easily.
2️⃣ Tighter Alignment With Global Price Discovery: High-volume venues generally maintain much tighter alignment with global reference prices during fast cascades, reducing extreme localized slippage risk.
3️⃣ Operational Resilience Under Stress: Even in volatile sessions where liquidations spike across the market, deep books and high-throughput matching engines are critical to executing risk controls cleanly.
$BTC
#BTC #BinanceSquare
If you ever needed a real-world stress test on why trading venue liquidity is a core risk-management pillar, look at what just unfolded on Kraken’s BTC/CAD pair.
While global Bitcoin hovered near the mid-$50,000s, heavy sell pressure against thin Canadian dollar order books and deposit/arbitrage friction sent BTC/CAD down to 24,250 CAD (roughly ~$16,900 - $18,300 USD depending on FX conversion) - a massive dislocation of roughly 68% - 71% below broader market pricing.
🔴 What Happened & Why "Executed Trades Stand" Hurts
📌 Sell orders overwhelmed thin CAD buy-side depth, while deposit limits and slow CAD inflows delayed arbitrage from quickly closing the gap.
📌 #Kraken confirmed there was no security breach or compromised accounts, stating that orders were processed normally and executed trades stand—meaning bargain buyers kept cheap fills, while sellers or stop-losses on that thin book took severe price slippage.
📌 That is the harsh reality of low-liquidity pairs during acute market stress: when order book depth thins out, execution price can detach violently from global benchmarks.
🛡️ Kraken vs. #Binance : Why We Appreciate Being on Binance
Comparing localized order-book dislocations against tier-1 global liquidity highlights the practical edge of trading where depth and participation are deepest:
1️⃣ Order Book Depth & Liquidity Cushion: Deep global liquidity and heavy active market-maker participation help absorb sharp order flow without isolated books snapping as easily.
2️⃣ Tighter Alignment With Global Price Discovery: High-volume venues generally maintain much tighter alignment with global reference prices during fast cascades, reducing extreme localized slippage risk.
3️⃣ Operational Resilience Under Stress: Even in volatile sessions where liquidations spike across the market, deep books and high-throughput matching engines are critical to executing risk controls cleanly.
$BTC
#BTC #BinanceSquare
1
127
·
--
Well, we are heading there, aren't we? Cheap Bitcoin on the market. 💆♂️
$BTC
{spot}(BTCUSDT)
Well, we are heading there, aren't we? Cheap Bitcoin on the market. 💆♂️
$BTC
$BTC
CryptoHaiduc
·
--
Bitcoin to $40K–$50K? What the Macro Elliott Wave Count Says 📉📊
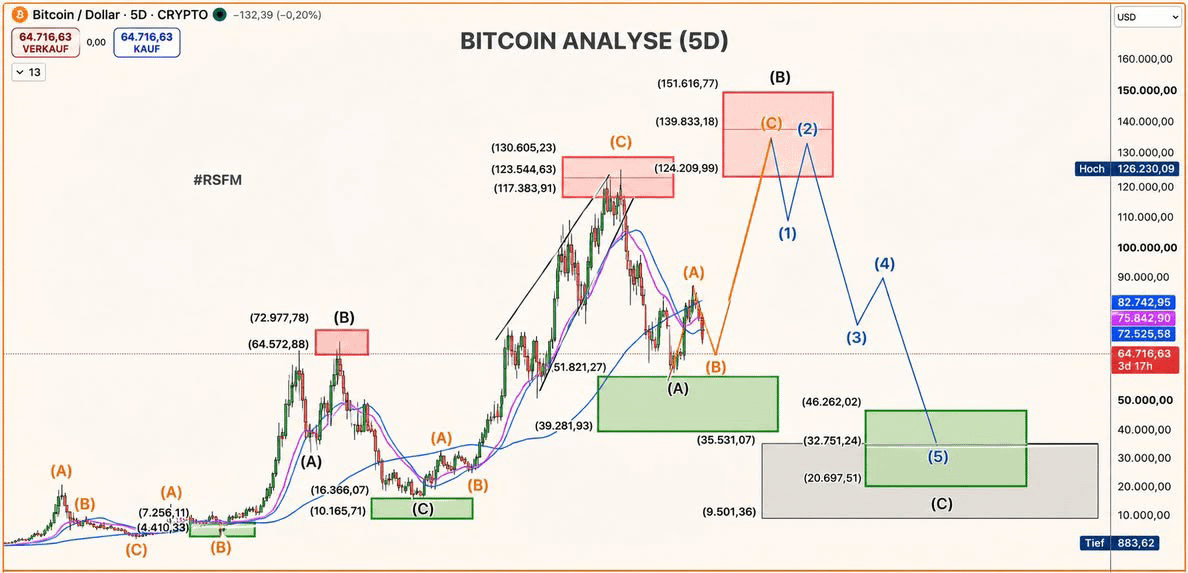
When price action gets volatile, stepping back to look at higher-timeframe market structure helps filter out the daily noise. According to a long-term Elliott Wave projection, Bitcoin could still face a deeper corrective leg toward the $40,000–$50,000 zone.
Here is the core structural breakdown:
📌 The Wave (C) Trajectory: The broader market appears to be unfolding within a large-scale corrective Wave (C). Historically, this final corrective phase seeks out major historical demand zones to fully reset market leverage before a new multi-year impulse can begin.
📌 Sentiment vs. Structure: Retail sentiment swings wildly after every sharp move—turning euphoric on relief bounces and fearful on flushes. While technical wave counts map out probabilistic liquidity targets, short-term execution remains heavily dictated by macroeconomic shifts and geopolitical headlines
‼️ The Risk Management Perspective:
A wave count is a roadmap, not a guarantee. Whether price sweeps the $40K–$50K liquidity pocket or invalidates the bearish count early, trying to catch falling knives with high leverage is a losing game. Scaling into spot positions gradually at major structural levels remains the highest-probability approach. 🛡️
👇Do you think $BTC actually visits the $40K–$50K zone to complete this macro correction, or will institutional spot demand step in much higher? Drop your game plan below! 💬🔥
$BTC
#bitcoin #BTC #Elliottwave #cryptotrading #BinanceSquare
When price action gets volatile, stepping back to look at higher-timeframe market structure helps filter out the daily noise. According to a long-term Elliott Wave projection, Bitcoin could still face a deeper corrective leg toward the $40,000–$50,000 zone.
Here is the core structural breakdown:
📌 The Wave (C) Trajectory: The broader market appears to be unfolding within a large-scale corrective Wave (C). Historically, this final corrective phase seeks out major historical demand zones to fully reset market leverage before a new multi-year impulse can begin.
📌 Sentiment vs. Structure: Retail sentiment swings wildly after every sharp move—turning euphoric on relief bounces and fearful on flushes. While technical wave counts map out probabilistic liquidity targets, short-term execution remains heavily dictated by macroeconomic shifts and geopolitical headlines
‼️ The Risk Management Perspective:
A wave count is a roadmap, not a guarantee. Whether price sweeps the $40K–$50K liquidity pocket or invalidates the bearish count early, trying to catch falling knives with high leverage is a losing game. Scaling into spot positions gradually at major structural levels remains the highest-probability approach. 🛡️
👇Do you think $BTC actually visits the $40K–$50K zone to complete this macro correction, or will institutional spot demand step in much higher? Drop your game plan below! 💬🔥
$BTC
#bitcoin #BTC #Elliottwave #cryptotrading #BinanceSquare
3
1
120
·
--
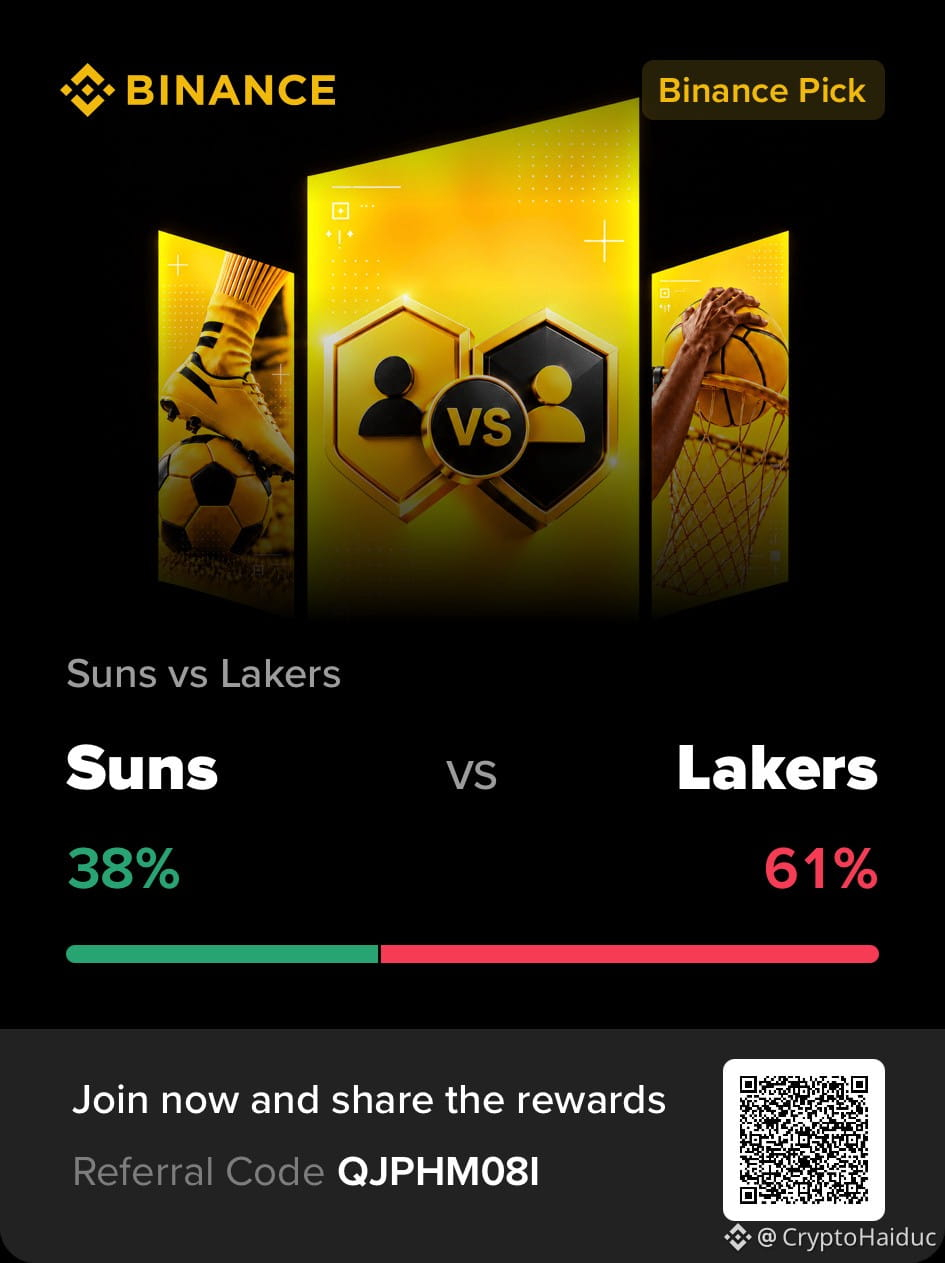
BTC goes under 50K 🐻
BTC holds steadily above 50K 🐂
5 day(s) left
2
1
228
·
--
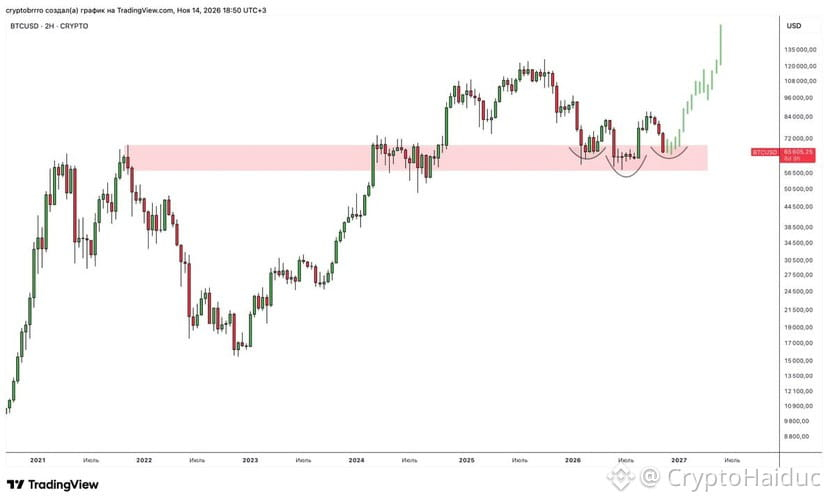
The Ultimate Mirror Level: Is This the Setup for $124K Bitcoin? 📊🔥
😵💫 Market psychology is playing out exactly as expected. Right when retail sentiment plummets into deep disappointment and disbelief, the charts are setting up a high-confluence macro structure.
Here is why this current price zone deserves your full attention:
1️⃣ The Power of the Mirror Level 🛑🟢
We are sitting right at a major macro support zone - the previous cycle’s All-Time High, which previously acted as an impenetrable resistance barrier. For six months, price chopped through this level before finally breaking upward. Now, it is acting as a classic mirror support level.
2️⃣ Reversal Pattern Forming 📈
A textbook reversal formation is currently printing right inside this structural demand zone. If this support holds firm, the technical path clears for a massive continuation leg upward.
3️⃣ The Target: Reclaiming & Breaking $124K 🚀
Hold this zone, and the macroeconomic trajectory points straight toward an aggressive rally aimed at shattering previous highs and pushing targets toward $124,000.
➡️ The Bottom Line: This is precisely what market bottoms look like—maximum despair, widespread disbelief, and peak skepticism. Smart money accumulates while the crowd looks away.
❓Are you scaling into spot positions here expecting the mirror level to hold, or are you waiting for confirmation? Drop your strategy below! 💬🔥
$BTC
#bitcoin #BTC #cryptotrading #MarketAnalysis #BinanceSquare
{spot}(BTCUSDT)
The Ultimate Mirror Level: Is This the Setup for $124K Bitcoin? 📊🔥
😵💫 Market psychology is playing out exactly as expected. Right when retail sentiment plummets into deep disappointment and disbelief, the charts are setting up a high-confluence macro structure.
Here is why this current price zone deserves your full attention:
1️⃣ The Power of the Mirror Level 🛑🟢
We are sitting right at a major macro support zone - the previous cycle’s All-Time High, which previously acted as an impenetrable resistance barrier. For six months, price chopped through this level before finally breaking upward. Now, it is acting as a classic mirror support level.
2️⃣ Reversal Pattern Forming 📈
A textbook reversal formation is currently printing right inside this structural demand zone. If this support holds firm, the technical path clears for a massive continuation leg upward.
3️⃣ The Target: Reclaiming & Breaking $124K 🚀
Hold this zone, and the macroeconomic trajectory points straight toward an aggressive rally aimed at shattering previous highs and pushing targets toward $124,000.
➡️ The Bottom Line: This is precisely what market bottoms look like—maximum despair, widespread disbelief, and peak skepticism. Smart money accumulates while the crowd looks away.
❓Are you scaling into spot positions here expecting the mirror level to hold, or are you waiting for confirmation? Drop your strategy below! 💬🔥
$BTC
#bitcoin #BTC #cryptotrading #MarketAnalysis #BinanceSquare
😵💫 Market psychology is playing out exactly as expected. Right when retail sentiment plummets into deep disappointment and disbelief, the charts are setting up a high-confluence macro structure.
Here is why this current price zone deserves your full attention:
1️⃣ The Power of the Mirror Level 🛑🟢
We are sitting right at a major macro support zone - the previous cycle’s All-Time High, which previously acted as an impenetrable resistance barrier. For six months, price chopped through this level before finally breaking upward. Now, it is acting as a classic mirror support level.
2️⃣ Reversal Pattern Forming 📈
A textbook reversal formation is currently printing right inside this structural demand zone. If this support holds firm, the technical path clears for a massive continuation leg upward.
3️⃣ The Target: Reclaiming & Breaking $124K 🚀
Hold this zone, and the macroeconomic trajectory points straight toward an aggressive rally aimed at shattering previous highs and pushing targets toward $124,000.
➡️ The Bottom Line: This is precisely what market bottoms look like—maximum despair, widespread disbelief, and peak skepticism. Smart money accumulates while the crowd looks away.
❓Are you scaling into spot positions here expecting the mirror level to hold, or are you waiting for confirmation? Drop your strategy below! 💬🔥
$BTC
#bitcoin #BTC #cryptotrading #MarketAnalysis #BinanceSquare
1
172
·
--
Verified

Article
📉 APTOS (APT) AT AN ALL-TIME LOW: MACRO CRISIS OR GENERATIONAL ACCUMULATION? 🧠While the broader market fixates on short-term price discovery and emotional panic hitting new lows near $0.51–$0.55, smart money looks past the noise and evaluates network fundamentals, protocol engineering, and structural supply dynamics.
Market bottoms are rarely comfortable. They are built precisely when sentiment hits peak despair (Crypto Fear & Greed Index lingering deep in fear). But beneath the price action, the architecture of Aptos tells a completely different story.
Here is why sophisticated capital views this flush as a potential long-term opportunity:
1️⃣ The Supply Overhang is Finally Easing
* For years, token unlock schedules weighed heavily on investor sentiment.
* However, the critical milestone of the initial 4-year tokenomics schedule concluded, resulting in a dramatic structural reduction of annualized token unlocks.
* Continuous token burns are steadily working at the margins, easing the historic supply pressure that plagued early price discovery.
2️⃣ World-Class Technical Infrastructure (The Global Trading Engine)
* Built on the Move programming language and powered by the Block-STM parallel execution engine, Aptos remains one of the highest-performing Layer-1 architectures in Web3.
* With sub-50-millisecond block times, lightning-fast settlement, and advanced features like native confidential transactions and cross-chain account abstraction, the tech stack is built for institutional-grade scale.
* Ecosystem milestones—including robust stablecoin growth, institutional custody backing (such as BitGo's strategic balance-sheet allocation), and active spot ETF filings—signal that utility is expanding even while price lags.
3️⃣ The Psychology of All-Time Lows
* Retail traders sell when charts look bleak and prices test historical floors.
* Institutional accumulation and venture-backed conviction happen when valuations detach from underlying technological progress.
* Buying strength feels good, but generational asymmetric upside is historically captured during periods of profound apathy and structural capitulation.
💡 The Big Question:
Are you letting a local price floor shake you out of a high-performance Layer-1, or are you scaling into the weakness for the next macro cycle? Let’s discuss below! 👇
Track live market data and price trends for $APT here:
$APT
#Aptos #APT #Layer1 #CryptoInvesting #smartmoney
📉 APTOS (APT) AT AN ALL-TIME LOW: MACRO CRISIS OR GENERATIONAL ACCUMULATION? 🧠
While the broader market fixates on short-term price discovery and emotional panic hitting new lows near $0.51–$0.55, smart money looks past the noise and evaluates network fundamentals, protocol engineering, and structural supply dynamics.
Market bottoms are rarely comfortable. They are built precisely when sentiment hits peak despair (Crypto Fear & Greed Index lingering deep in fear). But beneath the price action, the architecture of Aptos tells a completely different story.
Here is why sophisticated capital views this flush as a potential long-term opportunity:
1️⃣ The Supply Overhang is Finally Easing
* For years, token unlock schedules weighed heavily on investor sentiment.
* However, the critical milestone of the initial 4-year tokenomics schedule concluded, resulting in a dramatic structural reduction of annualized token unlocks.
* Continuous token burns are steadily working at the margins, easing the historic supply pressure that plagued early price discovery.
2️⃣ World-Class Technical Infrastructure (The Global Trading Engine)
* Built on the Move programming language and powered by the Block-STM parallel execution engine, Aptos remains one of the highest-performing Layer-1 architectures in Web3.
* With sub-50-millisecond block times, lightning-fast settlement, and advanced features like native confidential transactions and cross-chain account abstraction, the tech stack is built for institutional-grade scale.
* Ecosystem milestones—including robust stablecoin growth, institutional custody backing (such as BitGo's strategic balance-sheet allocation), and active spot ETF filings—signal that utility is expanding even while price lags.
3️⃣ The Psychology of All-Time Lows
* Retail traders sell when charts look bleak and prices test historical floors.
* Institutional accumulation and venture-backed conviction happen when valuations detach from underlying technological progress.
* Buying strength feels good, but generational asymmetric upside is historically captured during periods of profound apathy and structural capitulation.
💡 The Big Question:
Are you letting a local price floor shake you out of a high-performance Layer-1, or are you scaling into the weakness for the next macro cycle? Let’s discuss below! 👇
Track live market data and price trends for $APT here:
$APT
#Aptos #APT #Layer1 #CryptoInvesting #smartmoney
Market bottoms are rarely comfortable. They are built precisely when sentiment hits peak despair (Crypto Fear & Greed Index lingering deep in fear). But beneath the price action, the architecture of Aptos tells a completely different story.
Here is why sophisticated capital views this flush as a potential long-term opportunity:
1️⃣ The Supply Overhang is Finally Easing
* For years, token unlock schedules weighed heavily on investor sentiment.
* However, the critical milestone of the initial 4-year tokenomics schedule concluded, resulting in a dramatic structural reduction of annualized token unlocks.
* Continuous token burns are steadily working at the margins, easing the historic supply pressure that plagued early price discovery.
2️⃣ World-Class Technical Infrastructure (The Global Trading Engine)
* Built on the Move programming language and powered by the Block-STM parallel execution engine, Aptos remains one of the highest-performing Layer-1 architectures in Web3.
* With sub-50-millisecond block times, lightning-fast settlement, and advanced features like native confidential transactions and cross-chain account abstraction, the tech stack is built for institutional-grade scale.
* Ecosystem milestones—including robust stablecoin growth, institutional custody backing (such as BitGo's strategic balance-sheet allocation), and active spot ETF filings—signal that utility is expanding even while price lags.
3️⃣ The Psychology of All-Time Lows
* Retail traders sell when charts look bleak and prices test historical floors.
* Institutional accumulation and venture-backed conviction happen when valuations detach from underlying technological progress.
* Buying strength feels good, but generational asymmetric upside is historically captured during periods of profound apathy and structural capitulation.
💡 The Big Question:
Are you letting a local price floor shake you out of a high-performance Layer-1, or are you scaling into the weakness for the next macro cycle? Let’s discuss below! 👇
Track live market data and price trends for $APT here:
$APT
#Aptos #APT #Layer1 #CryptoInvesting #smartmoney
4
1.7k

·
--
Whales vs. ETF Outflows: The Real Story Behind Bitcoin's Current Phase 📊
The crypto market is currently witnessing a fascinating divergence in behavior. While retail and ETF-driven capital are pulling back, large-wallet cohorts are quietly stepping in to absorb the pressure.
1️⃣ The Institutional/ETF Exodus
U.S. spot Bitcoin ETFs have faced sustained net outflows, reflecting a risk-off sentiment among traditional financial participants.
Successive sessions of redemptions have put short-term pressure on prices, as broader macroeconomic concerns and shifting rate expectations prompt institutional portfolio rebalancing.
2️⃣ On-Chain Accumulation by Whales
Despite the negative ETF flows, on-chain data highlights renewed accumulation from specific large-wallet cohorts (specifically addresses holding between 100 and 10,000 $BTC).
Historically, these large entities tend to accumulate during periods of widespread market hesitation, treating localized dips as strategic entry points rather than structural exits.
3️⃣ What the Order Flow Tells Us
Market depth and bid walls around key structural levels indicate that smart money is defending specific ranges.
However, until ETF outflows stabilize and broader liquidity returns, price action is likely to remain range-bound.
💡 The Big Question:
Are you aligning with the whales and accumulating during this institutional cooldown, or are you waiting for ETF inflows to turn green before making your next move? Let’s discuss below! 👇
Whales vs. ETF Outflows: The Real Story Behind Bitcoin's Current Phase 📊
The crypto market is currently witnessing a fascinating divergence in behavior. While retail and ETF-driven capital are pulling back, large-wallet cohorts are quietly stepping in to absorb the pressure.
1️⃣ The Institutional/ETF Exodus
U.S. spot Bitcoin ETFs have faced sustained net outflows, reflecting a risk-off sentiment among traditional financial participants.
Successive sessions of redemptions have put short-term pressure on prices, as broader macroeconomic concerns and shifting rate expectations prompt institutional portfolio rebalancing.
2️⃣ On-Chain Accumulation by Whales
Despite the negative ETF flows, on-chain data highlights renewed accumulation from specific large-wallet cohorts (specifically addresses holding between 100 and 10,000 $BTC).
Historically, these large entities tend to accumulate during periods of widespread market hesitation, treating localized dips as strategic entry points rather than structural exits.
3️⃣ What the Order Flow Tells Us
Market depth and bid walls around key structural levels indicate that smart money is defending specific ranges.
However, until ETF outflows stabilize and broader liquidity returns, price action is likely to remain range-bound.
💡 The Big Question:
Are you aligning with the whales and accumulating during this institutional cooldown, or are you waiting for ETF inflows to turn green before making your next move? Let’s discuss below! 👇
The crypto market is currently witnessing a fascinating divergence in behavior. While retail and ETF-driven capital are pulling back, large-wallet cohorts are quietly stepping in to absorb the pressure.
1️⃣ The Institutional/ETF Exodus
U.S. spot Bitcoin ETFs have faced sustained net outflows, reflecting a risk-off sentiment among traditional financial participants.
Successive sessions of redemptions have put short-term pressure on prices, as broader macroeconomic concerns and shifting rate expectations prompt institutional portfolio rebalancing.
2️⃣ On-Chain Accumulation by Whales
Despite the negative ETF flows, on-chain data highlights renewed accumulation from specific large-wallet cohorts (specifically addresses holding between 100 and 10,000 $BTC).
Historically, these large entities tend to accumulate during periods of widespread market hesitation, treating localized dips as strategic entry points rather than structural exits.
3️⃣ What the Order Flow Tells Us
Market depth and bid walls around key structural levels indicate that smart money is defending specific ranges.
However, until ETF outflows stabilize and broader liquidity returns, price action is likely to remain range-bound.
💡 The Big Question:
Are you aligning with the whales and accumulating during this institutional cooldown, or are you waiting for ETF inflows to turn green before making your next move? Let’s discuss below! 👇

1
150
·
--
🚨 SOMETHING TERRIBLE IS BREWING FOR $BTC
Market is back at $72K, pullback phase confirmed again
The drop is almost done, but it won't be smooth...
One final shakeout is coming and it will spread fear everywhere
My plan is absolutely simple:
1st target: $70K + Bear Trap
2nd target: pump above $80K -> $100K sweep
The final trap will wipe out more than one trading deposit...
Save this post - we'll come back to it in 2-3 months
🚨 SOMETHING TERRIBLE IS BREWING FOR $BTC
Market is back at $72K, pullback phase confirmed again
The drop is almost done, but it won't be smooth...
One final shakeout is coming and it will spread fear everywhere
My plan is absolutely simple:
1st target: $70K + Bear Trap
2nd target: pump above $80K -> $100K sweep
The final trap will wipe out more than one trading deposit...
Save this post - we'll come back to it in 2-3 months
Market is back at $72K, pullback phase confirmed again
The drop is almost done, but it won't be smooth...
One final shakeout is coming and it will spread fear everywhere
My plan is absolutely simple:
1st target: $70K + Bear Trap
2nd target: pump above $80K -> $100K sweep
The final trap will wipe out more than one trading deposit...
Save this post - we'll come back to it in 2-3 months
4
761

·
--
Jensen Huang will be fired from #NVIDIA .
He got with the VP of Healthcare from his own company.
& the Chinese spy.
Don’t hate the player, hate the game!
$NVDAB
Jensen Huang will be fired from #NVIDIA .
He got with the VP of Healthcare from his own company.
& the Chinese spy.
Don’t hate the player, hate the game!
$NVDAB
He got with the VP of Healthcare from his own company.
& the Chinese spy.
Don’t hate the player, hate the game!
$NVDAB

1
106
·
--
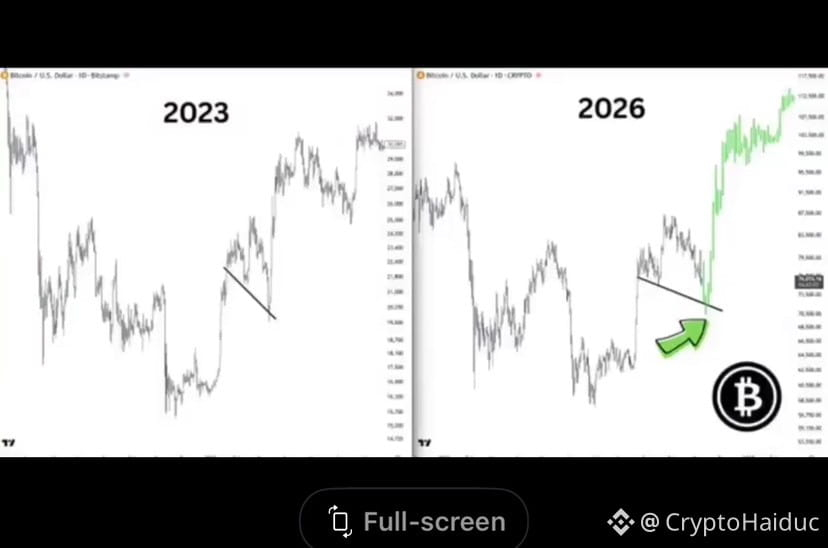
🚨‼️ Remember back in 2023, when Bitcoin plummeted and everyone sold off at the bottom?
🚀 It’s happening all over again in 2026.
$BTC
{spot}(BTCUSDT)
🚨‼️ Remember back in 2023, when Bitcoin plummeted and everyone sold off at the bottom?
🚀 It’s happening all over again in 2026.
$BTC
🚀 It’s happening all over again in 2026.
$BTC
1
150
·
--
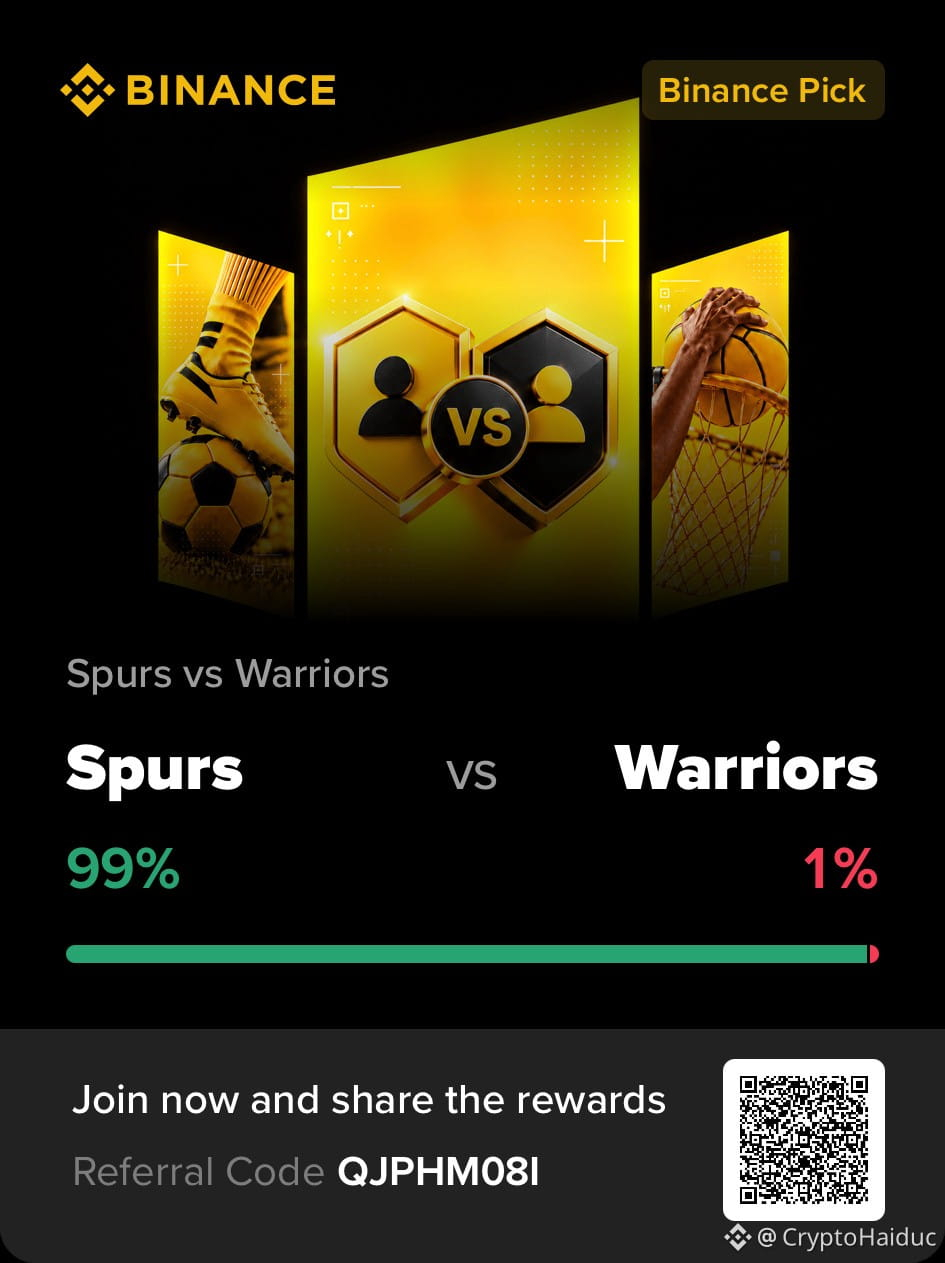
Less than a a week for Season 1 on #BinancePick
Less than a a week for Season 1 on #BinancePick

10
·
--
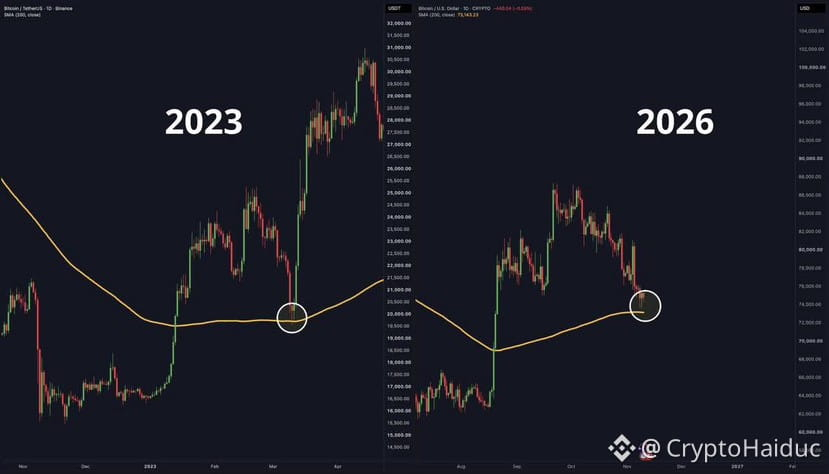
‼️ What if Bitcoin does the same thing it did 3 years ago...
$BTC
{spot}(BTCUSDT)
‼️ What if Bitcoin does the same thing it did 3 years ago...
$BTC
$BTC
2
1
216
·
--
⬇️ Bitcoin’s price has been suffering lately. The asset is currently pressing into the 200D SMA at $73K, and prices remain in a structural decline (down 15% since late September). So given the recent price action, it’s a fair question to ask what are the headwinds pushing prices lower.
Below is the list of the responsible culprits:
🔸Higher Fed Rates & Elevated Opportunity Cost: The markets are pricing in a near-certain December Fed rate hike, and higher short-term rates raise the opportunity cost of holding non-yielding assets relative to yield assets like bonds.
🔸 BTC Trading as a Beta Tech Stock: Bitcoin is somewhat correlated with the Nasdaq and AI-related names. So softness in the tech complex, driven by AI bubble concerns and higher yields, has pulled Bitcoin lower.
🔸 Regulatory Regime Shift after the Mid-Terms: The election results shift power back towards the Democrats, and that means the prospects of less regulatory-friendly crypto market-structure bills.
🔸 Exchange Security After-Shocks: The cluster of recent hacks (#Binance , Mercado Bitcoin, BTCPay, #Polymarket ) has kept security in the headlines. While none of these touched Bitcoin’s protocol, the incidents have added a layer of caution amongst institutional and retail holders.
The four factors above capture the best explanation for Bitcoin’s current price action. However, when comparing prices to previous cycle bottoms, what we’re seeing here is the norm.
After Bitcoin finds its new cycle low (we still think that’s $57K from June), it typically spends months building support off that level before the next sustained move higher. Therefore, there’s nothing in the current price action that suggests any cause for concern.
$BTC
{spot}(BTCUSDT)
⬇️ Bitcoin’s price has been suffering lately. The asset is currently pressing into the 200D SMA at $73K, and prices remain in a structural decline (down 15% since late September). So given the recent price action, it’s a fair question to ask what are the headwinds pushing prices lower.
Below is the list of the responsible culprits:
🔸Higher Fed Rates & Elevated Opportunity Cost: The markets are pricing in a near-certain December Fed rate hike, and higher short-term rates raise the opportunity cost of holding non-yielding assets relative to yield assets like bonds.
🔸 BTC Trading as a Beta Tech Stock: Bitcoin is somewhat correlated with the Nasdaq and AI-related names. So softness in the tech complex, driven by AI bubble concerns and higher yields, has pulled Bitcoin lower.
🔸 Regulatory Regime Shift after the Mid-Terms: The election results shift power back towards the Democrats, and that means the prospects of less regulatory-friendly crypto market-structure bills.
🔸 Exchange Security After-Shocks: The cluster of recent hacks (#Binance , Mercado Bitcoin, BTCPay, #Polymarket ) has kept security in the headlines. While none of these touched Bitcoin’s protocol, the incidents have added a layer of caution amongst institutional and retail holders.
The four factors above capture the best explanation for Bitcoin’s current price action. However, when comparing prices to previous cycle bottoms, what we’re seeing here is the norm.
After Bitcoin finds its new cycle low (we still think that’s $57K from June), it typically spends months building support off that level before the next sustained move higher. Therefore, there’s nothing in the current price action that suggests any cause for concern.
$BTC
Below is the list of the responsible culprits:
🔸Higher Fed Rates & Elevated Opportunity Cost: The markets are pricing in a near-certain December Fed rate hike, and higher short-term rates raise the opportunity cost of holding non-yielding assets relative to yield assets like bonds.
🔸 BTC Trading as a Beta Tech Stock: Bitcoin is somewhat correlated with the Nasdaq and AI-related names. So softness in the tech complex, driven by AI bubble concerns and higher yields, has pulled Bitcoin lower.
🔸 Regulatory Regime Shift after the Mid-Terms: The election results shift power back towards the Democrats, and that means the prospects of less regulatory-friendly crypto market-structure bills.
🔸 Exchange Security After-Shocks: The cluster of recent hacks (#Binance , Mercado Bitcoin, BTCPay, #Polymarket ) has kept security in the headlines. While none of these touched Bitcoin’s protocol, the incidents have added a layer of caution amongst institutional and retail holders.
The four factors above capture the best explanation for Bitcoin’s current price action. However, when comparing prices to previous cycle bottoms, what we’re seeing here is the norm.
After Bitcoin finds its new cycle low (we still think that’s $57K from June), it typically spends months building support off that level before the next sustained move higher. Therefore, there’s nothing in the current price action that suggests any cause for concern.
$BTC
2
540

·
--
Last week of Season 1 on #BinancePick Get your USDC!
Last week of Season 1 on #BinancePick Get your USDC!

1
9

Log in to explore more content
Join global crypto users on Binance Square
⚡️ Get latest and useful information about crypto.
💬 Trusted by the world’s largest crypto exchange.
👍 Discover real insights from verified creators.
Email / Phone number
Trending Topics
NvidiaLoses$2.7TrillionInMonthAndAHalf
30,576 views
166 Discussing
Nvidia’s $2.7 Trillion Wipeout: When Narrative Overrides Numbers 📉
Crypto With Faisal
·7 Likes
·6.2k views
CanBTCReboundAfterFallingBelow60K?
872,905 views
3,236 Discussing
GlobalStocksFaceLongestLosingStreakSince2023
332,258 views
2,167 Discussing