
Elon jamess 1
128 Posts

Elon jamess 1
Dream big trust big move big and your outcomes will grow big too.
0 Following
5 Followers
7 Liked
Posts
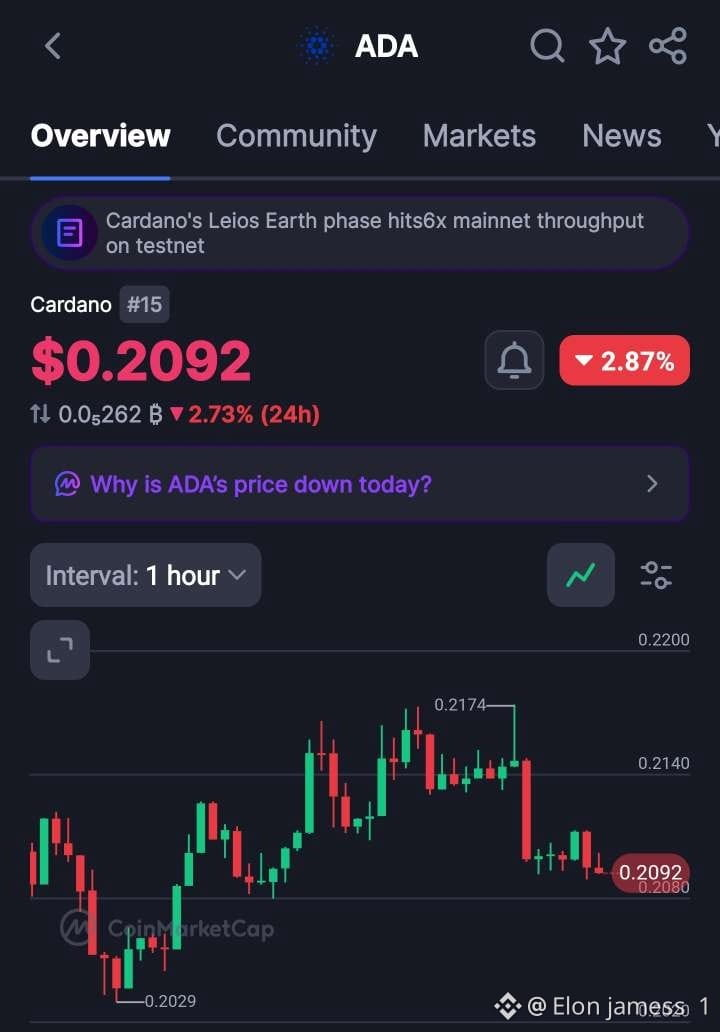
$ADA is cooling off after testing the $0.2174 area. 👀
ADA is currently around $0.2092, down about 2.87%, with the 1H chart showing some short-term selling pressure.
Key levels to watch:
→ Support: $0.2080 → $0.2029
→ Resistance: $0.2140 → $0.2174
If ADA can reclaim $0.214 and hold above it, momentum could improve. But losing the $0.208 zone may bring another test of lower support.
Also worth watching: Cardano’s Leios testnet is showing higher throughput, which could be an interesting fundamental development.
Short-term weakness, but the bigger picture still needs confirmation. DYOR.
ADA is currently around $0.2092, down about 2.87%, with the 1H chart showing some short-term selling pressure.
Key levels to watch:
→ Support: $0.2080 → $0.2029
→ Resistance: $0.2140 → $0.2174
If ADA can reclaim $0.214 and hold above it, momentum could improve. But losing the $0.208 zone may bring another test of lower support.
Also worth watching: Cardano’s Leios testnet is showing higher throughput, which could be an interesting fundamental development.
Short-term weakness, but the bigger picture still needs confirmation. DYOR.
$XLM — Bounces to 0.2150 or breaks to 0.1650.
Long $XLM (Or Wait for Structural Confirmation)
Entry: 0.1840–0.1865
SL: 0.1810
TP1: 0.1891
TP2: 0.2000
TP3: 0.2150
Market Context & Reasoning
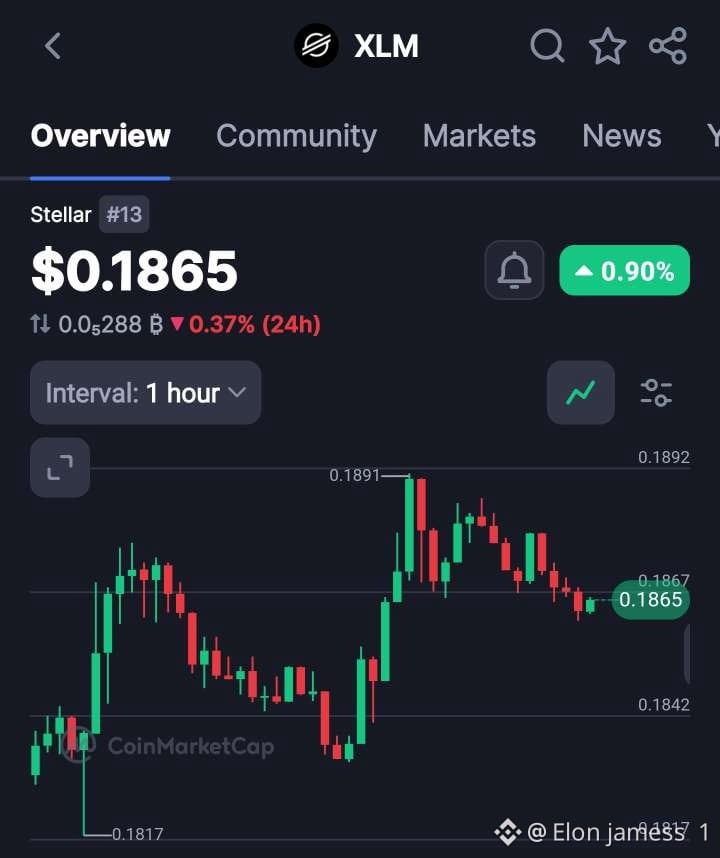
Price action on the 1-hour chart of shows a volatile double-bottom accumulation structure leading into a high-level consolidation. After finding clear buyer demand at the major session floor of 0.1817, the asset staged an aggressive, multi-candle green impulse run to flag a localized session top at 0.1891.
Following that breakout, the price entered a structural pullback phase, carving out a slow downward channel that is currently showing signs of stabilization. The token is compressing right around 0.1865 (up 0.90% on the session), holding tightly above the immediate intermediate support shelf at 0.1842. This defense of a higher low compared to the deep 0.1817 capitulation floor signals that bulls are actively stepping in to absorb incoming supply. Bears attempting to press short positions here run a significant risk of getting caught in a reversal squeeze as the downside momentum bleeds out. If this defensive base holds firmly and the bulls can muster enough follow-through volume to breach the localized 0.1891 resistance peak, it will confirm a clean trend continuation vector targeting macro liquidity pools higher up the tape.
Trade $XLM here 👇
Long $XLM (Or Wait for Structural Confirmation)
Entry: 0.1840–0.1865
SL: 0.1810
TP1: 0.1891
TP2: 0.2000
TP3: 0.2150
Market Context & Reasoning
Price action on the 1-hour chart of shows a volatile double-bottom accumulation structure leading into a high-level consolidation. After finding clear buyer demand at the major session floor of 0.1817, the asset staged an aggressive, multi-candle green impulse run to flag a localized session top at 0.1891.
Following that breakout, the price entered a structural pullback phase, carving out a slow downward channel that is currently showing signs of stabilization. The token is compressing right around 0.1865 (up 0.90% on the session), holding tightly above the immediate intermediate support shelf at 0.1842. This defense of a higher low compared to the deep 0.1817 capitulation floor signals that bulls are actively stepping in to absorb incoming supply. Bears attempting to press short positions here run a significant risk of getting caught in a reversal squeeze as the downside momentum bleeds out. If this defensive base holds firmly and the bulls can muster enough follow-through volume to breach the localized 0.1891 resistance peak, it will confirm a clean trend continuation vector targeting macro liquidity pools higher up the tape.
Trade $XLM here 👇
$LINK — Bounces to 9.200 or breaks to 7.800.
Long $LINK (Or Wait for Structural Confirmation)
Entry: 8.370–8.479
SL: 8.130
TP1: 8.605
TP2: 8.950
TP3: 9.200
Market Context & Reasoning
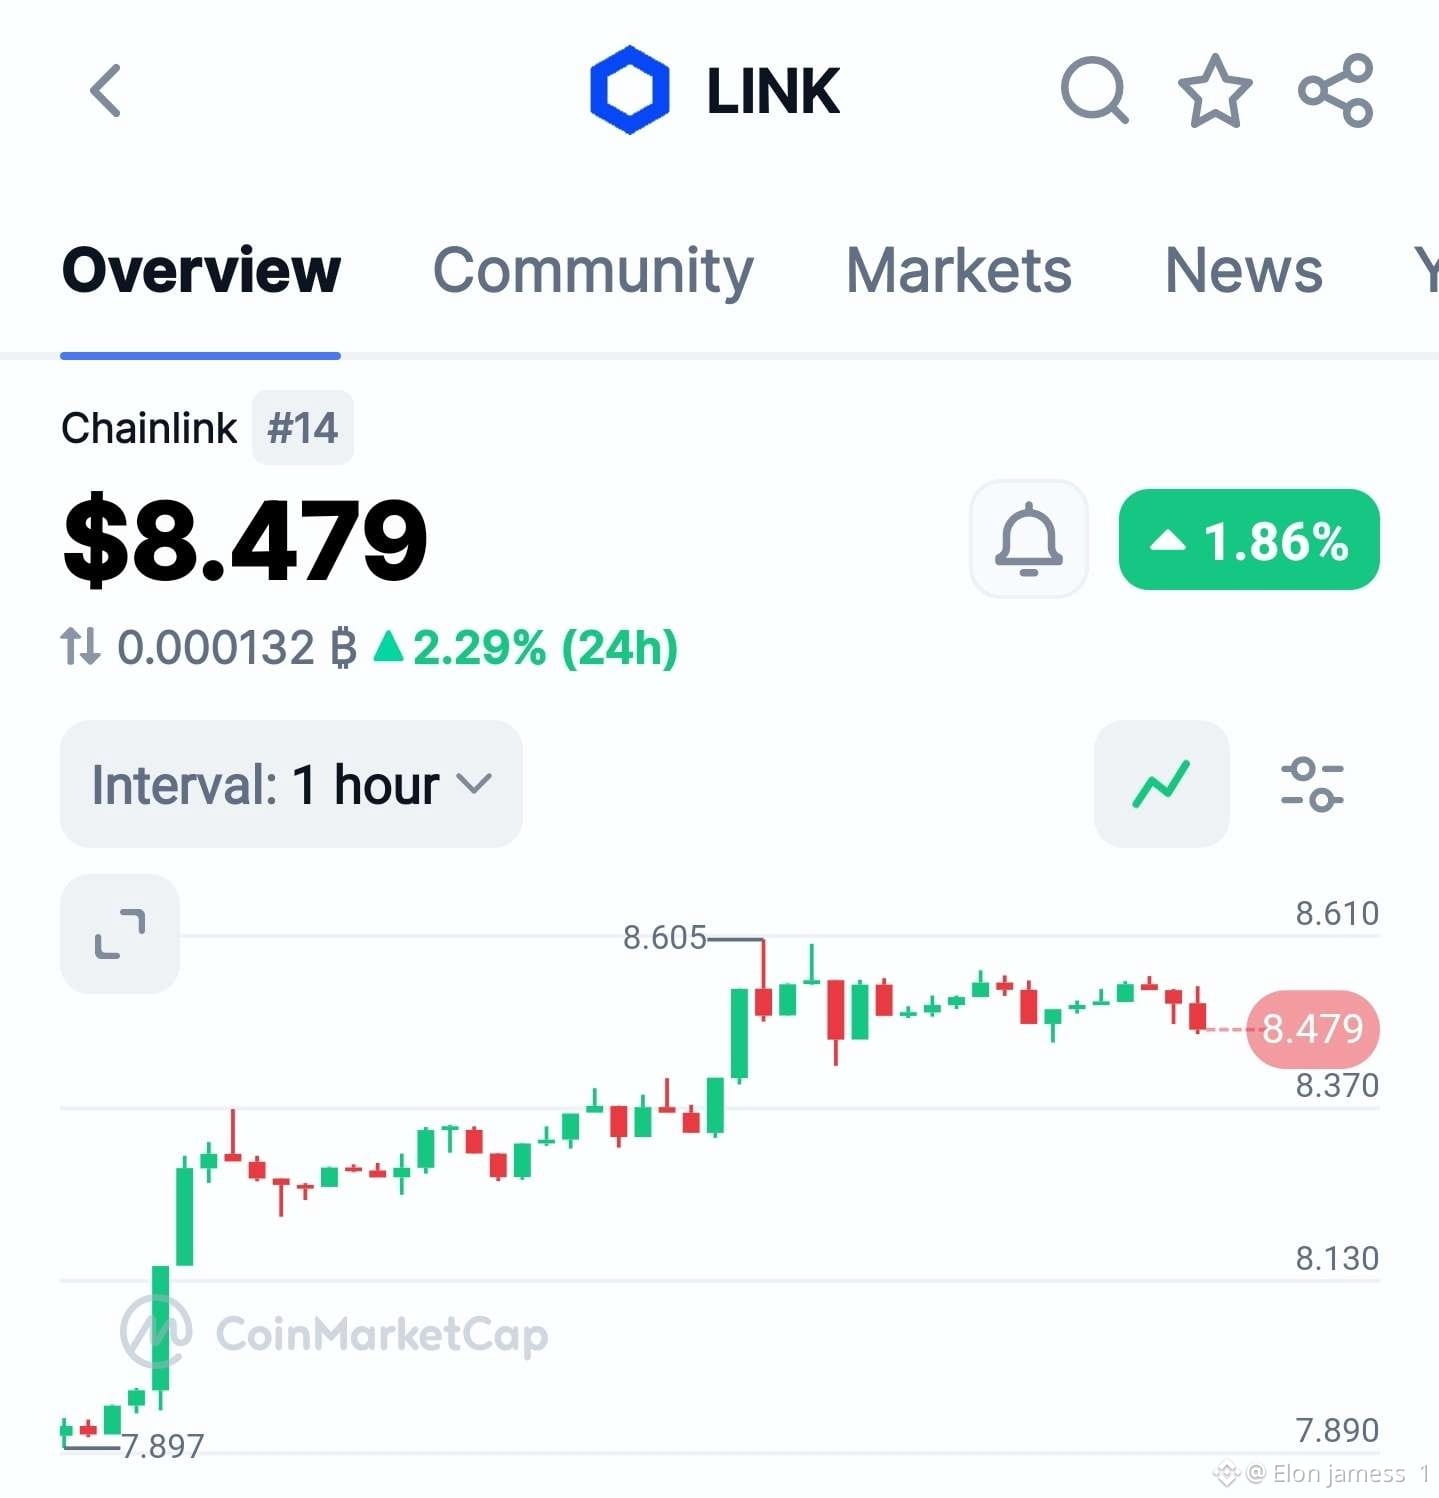
The 1-hour chart displays a highly constructive, trending bullish structure. After established accumulation swept liquidity at the session base of 7.897, an aggressive buy-side surge drove the price through previous overhead resistance.
Since setting a local high of 8.605, the price has established a healthy, high-level consolidation range between 8.370 and 8.605. It is currently trading near the middle of this range at 8.479 (up 1.86% on the day). The shallow nature of this pullback, coupled with consistent higher lows, indicates that demand remains strong and sellers are struggling to drive the price deeper. If the bulls successfully defend the 8.370 support pivot, a breakout above the local ceiling at 8.605 is expected to trigger a momentum expansion toward key upside targets.
Trade $LINK here 👇
Long $LINK (Or Wait for Structural Confirmation)
Entry: 8.370–8.479
SL: 8.130
TP1: 8.605
TP2: 8.950
TP3: 9.200
Market Context & Reasoning
The 1-hour chart displays a highly constructive, trending bullish structure. After established accumulation swept liquidity at the session base of 7.897, an aggressive buy-side surge drove the price through previous overhead resistance.
Since setting a local high of 8.605, the price has established a healthy, high-level consolidation range between 8.370 and 8.605. It is currently trading near the middle of this range at 8.479 (up 1.86% on the day). The shallow nature of this pullback, coupled with consistent higher lows, indicates that demand remains strong and sellers are struggling to drive the price deeper. If the bulls successfully defend the 8.370 support pivot, a breakout above the local ceiling at 8.605 is expected to trigger a momentum expansion toward key upside targets.
Trade $LINK here 👇
$LINK — Bounces to 9.150 or breaks to 7.100.
Long $LINK (Or Wait for Breakout Confirmation)
Entry: 7.780–7.892
SL: 7.620
TP1: 7.922
TP2: 8.350
TP3: 9.150
Market Context & Reasoning
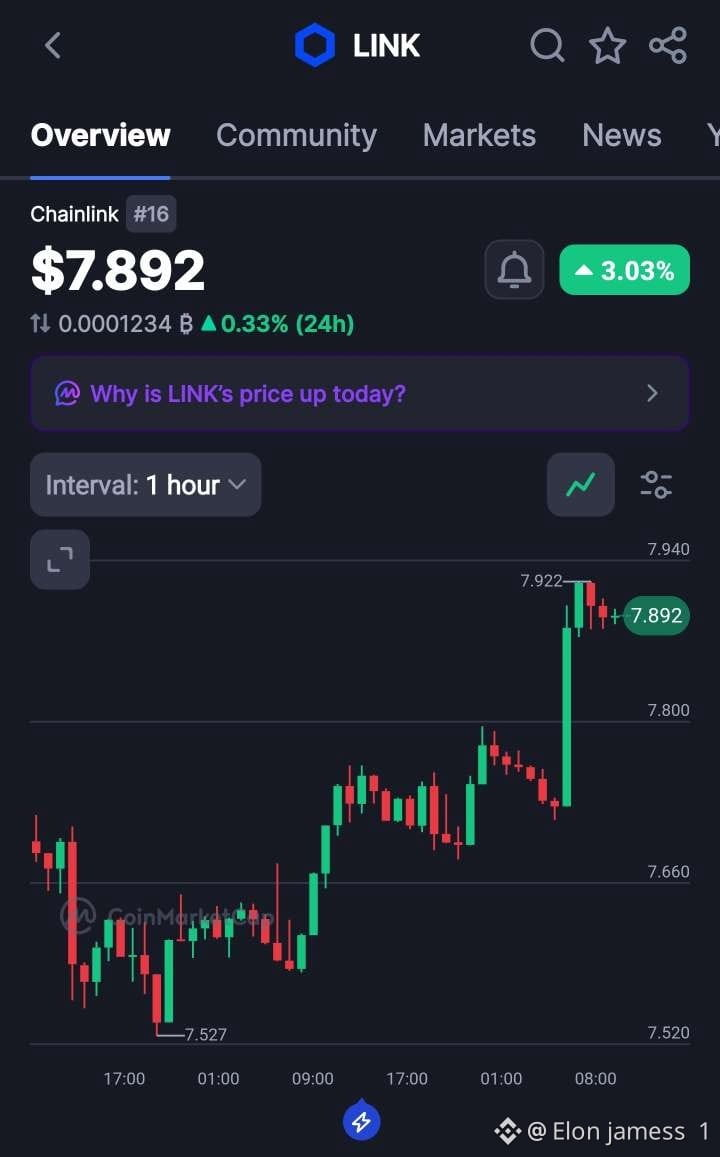
Price action on the 1-hour chart of displays a stark structural shift, with bulls completely reversing the previous markdown phase. After establishing an intraday capitulation floor at 7.527, a violent influx of aggressive spot demand absorbed all available overhead supply. This structural bottom sparked a sustained higher-low sequence that culminated in an explosive, near-vertical impulse candle surging directly into the local overhead ceiling.
The asset peaked at 7.922 and is currently undergoing a tight, high-ordered compression right beneath that level, trading at 7.892 (up 3.03% on the session). Finding acceptance and building a tight support base near the absolute highs of a major momentum move is a highly bullish posture, indicating that sellers are completely exhausted and unable to push the price back down. Attempting to step in front of this velocity to short runs a severe risk of being caught in an immediate breakout expansion. If bulls successfully anchor above the broken 7.800 psychological shelf and deploy enough continuation volume to cleanly breach 7.922, it sets the stage for a major upward expansion leg targeting deeper macro levels.
Trade $LINK here 👇
Long $LINK (Or Wait for Breakout Confirmation)
Entry: 7.780–7.892
SL: 7.620
TP1: 7.922
TP2: 8.350
TP3: 9.150
Market Context & Reasoning
Price action on the 1-hour chart of displays a stark structural shift, with bulls completely reversing the previous markdown phase. After establishing an intraday capitulation floor at 7.527, a violent influx of aggressive spot demand absorbed all available overhead supply. This structural bottom sparked a sustained higher-low sequence that culminated in an explosive, near-vertical impulse candle surging directly into the local overhead ceiling.
The asset peaked at 7.922 and is currently undergoing a tight, high-ordered compression right beneath that level, trading at 7.892 (up 3.03% on the session). Finding acceptance and building a tight support base near the absolute highs of a major momentum move is a highly bullish posture, indicating that sellers are completely exhausted and unable to push the price back down. Attempting to step in front of this velocity to short runs a severe risk of being caught in an immediate breakout expansion. If bulls successfully anchor above the broken 7.800 psychological shelf and deploy enough continuation volume to cleanly breach 7.922, it sets the stage for a major upward expansion leg targeting deeper macro levels.
Trade $LINK here 👇
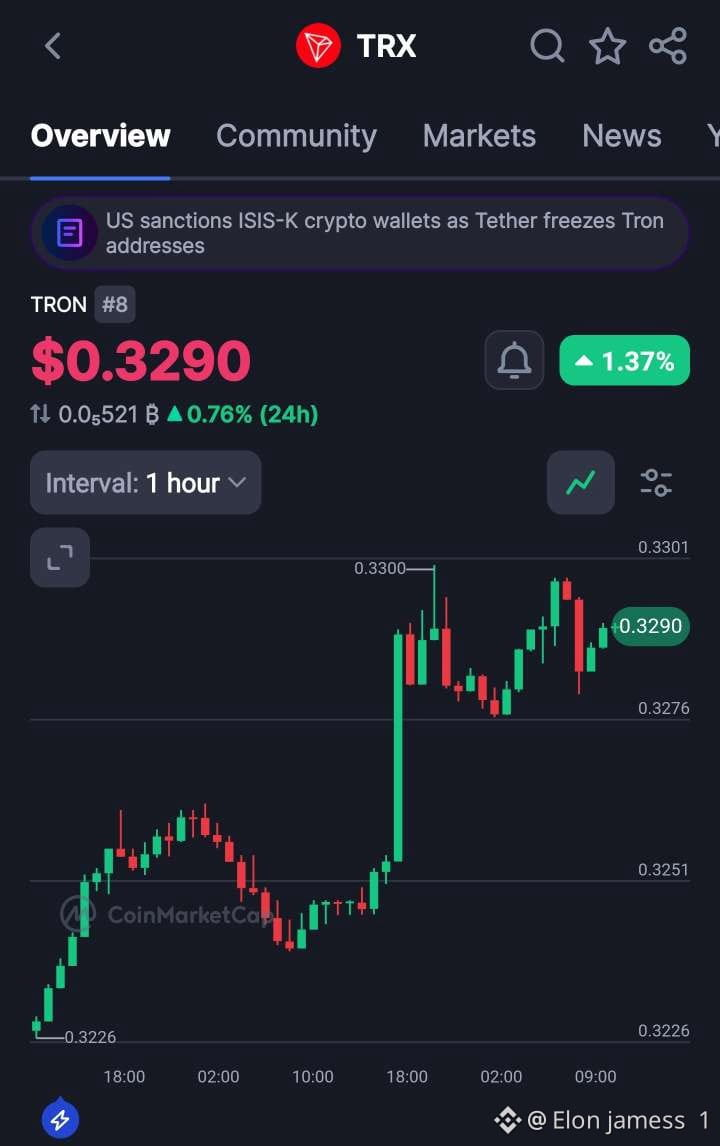
$TRX — Bounces to 0.3850 or breaks to 0.2950.
Long $TRX (Or Wait for Breakout Confirmation)
Entry: 0.3270–0.3290
SL: 0.3210
TP1: 0.3340
TP2: 0.3600
TP3: 0.3850
Market Context & Reasoning
Price action on the 1-hour chart of displays a structurally strong bullish expansion and continuation pattern establishing itself after a solid build-up from an absolute session low at 0.3226. Following a sharp, high-volume vertical expansion candle that shattered initial horizontal layers, the price tapped a local structural resistance ceiling at 0.3300.
Rather than succumbing to an aggressive distribution dump, the asset has spent subsequent trading blocks carving out a well-defined high-level consolidation flag above the 0.3276 horizontal support shelf. It is currently trading firmly at 0.3290, testing the upper bounds of this accumulation structure despite headline noise tracking over centralized freezes on the network. Dips are being absorbed cleanly by buy-side liquidity, indicating that institutional demand remains in driving control. Short-term bears trying to fight this upward structure face a high risk of being crushed in an accelerating breakout squeeze. If bulls can maintain this defensive shelf and gather enough volume to slice cleanly through the 0.3300 structural roof, it clears a high-probability expansion vector toward fresh macro targets up the tape.
Trade $TRX here 👇
Long $TRX (Or Wait for Breakout Confirmation)
Entry: 0.3270–0.3290
SL: 0.3210
TP1: 0.3340
TP2: 0.3600
TP3: 0.3850
Market Context & Reasoning
Price action on the 1-hour chart of displays a structurally strong bullish expansion and continuation pattern establishing itself after a solid build-up from an absolute session low at 0.3226. Following a sharp, high-volume vertical expansion candle that shattered initial horizontal layers, the price tapped a local structural resistance ceiling at 0.3300.
Rather than succumbing to an aggressive distribution dump, the asset has spent subsequent trading blocks carving out a well-defined high-level consolidation flag above the 0.3276 horizontal support shelf. It is currently trading firmly at 0.3290, testing the upper bounds of this accumulation structure despite headline noise tracking over centralized freezes on the network. Dips are being absorbed cleanly by buy-side liquidity, indicating that institutional demand remains in driving control. Short-term bears trying to fight this upward structure face a high risk of being crushed in an accelerating breakout squeeze. If bulls can maintain this defensive shelf and gather enough volume to slice cleanly through the 0.3300 structural roof, it clears a high-probability expansion vector toward fresh macro targets up the tape.
Trade $TRX here 👇
Log in to explore more content