


Original|Odaily Planet Daily (@OdailyChina)
Author|Wenser (@wenser 2010)

With the Federal Reserve’s rate hike landing and the CLARITY Act temporarily put on hold, the crypto market has returned to a bull run thanks to positives such as the U.S. SEC’s innovation exemption policy.
Total cryptocurrency market capitalization briefly reclaimed the level above $2.9 trillion, only a doorstep away from $3 trillion. BTC briefly broke through $84,000; compared with the rate-hike day on September 16, after briefly falling below $75,000, the gain has exceeded 12%. ETH briefly broke above $2,700, and is currently quoted around $2,690. SOL has been oscillating around $110; it is currently quoted at roughly $115.
For a time, bullish sentiment dominated the market; but on the other hand, the overhang from the Fed’s second rate hike still remains unclear, and the outlook for the CLARITY bill is uncertain. With global central banks also moving in step with rate hikes, many investors have chosen to take profits, and many whales are still pressing shorts.
What changes are happening in market liquidity? Can policy tailwinds continue? Odaily Planet Daily will lay out the main viewpoints on the outlook in this article for readers to reference.
A full look at the effects of rate hikes: the market has moved out of the weight of the hikes, but still awaits more positive catalysts
On September 16, the Federal Reserve raised rates by 25 basis points, lifting the target range for the federal funds rate to 3.75%–4.00%. The market expects that in the next six months there may be further rate hikes totaling another 75 basis points.
Bitcoin has fallen about 40% from last October’s high of around $126,000. This is similar to the case in March 2022, when after the first rate hike, Bitcoin fell about 40% from the November 2021 high of around $69,000. After the March 2022 rate hike, Bitcoin rebounded by about 18% within 12 days, then fell further by roughly 50%.
Grayscale: This round of Fed rate hikes has little impact and will not lead to major changes in the crypto market
In analysis published on September 17, digital asset manager Grayscale said that the latest Fed rate hike is closer to an “adjustment within a cycle” rather than a major shift in monetary policy. The firm believes that this round of rate hikes—and potentially a second hike later this year—are unlikely to cause major changes in the digital asset market.
Grayscale said that from March 2022 to July 2023, the Fed cumulatively raised rates by 525 basis points, continuously tightening financial conditions, increasing returns on cash and interest-bearing assets, and raising the opportunity cost of holding Bitcoin. The current environment is a single rate hike after years of rate hikes, rate cuts, and staying put.
Grayscale said that the impact of the rate hikes will vary depending on crypto business models. Stablecoin issuers could benefit from increased interest income from reserve assets, and the higher yields of tokenized bonds and money market funds may also attract capital inflows into on-chain financial products.
On the trading side: the offshore market continues to accumulate positions, and the sell-off intensity on exchanges has slowed
On September 16, after the Fed’s rate hike was implemented, Bitcoin analyst Willy Woo wrote that after the CLARITY bill failed its procedural vote in the Senate, the cumulative differences in trading volumes across exchanges showed that Coinbase’s CVD accelerated downward to about -6,659 BTC, reflecting U.S. investors selling off; Binance’s CVD also rebounded from a low level to about -5,841 BTC.
He believes that the more dominant offshore market is still accumulating positions, and he calls this divergence slightly bullish. In the same period, Bitcoin fell from its $80,560 peak and at one point dipped to $74,968. The CVDs for Bybit, OKX, and Bitstamp were approximately -582, -1,135, and -764 BTC, respectively.
Citing exchange BTC net flow data from Glassnode, crypto KOL Phyrex said that recently the amount of BTC net inflows to exchanges has been greater than net outflows, and this has continued for a considerable period of time.
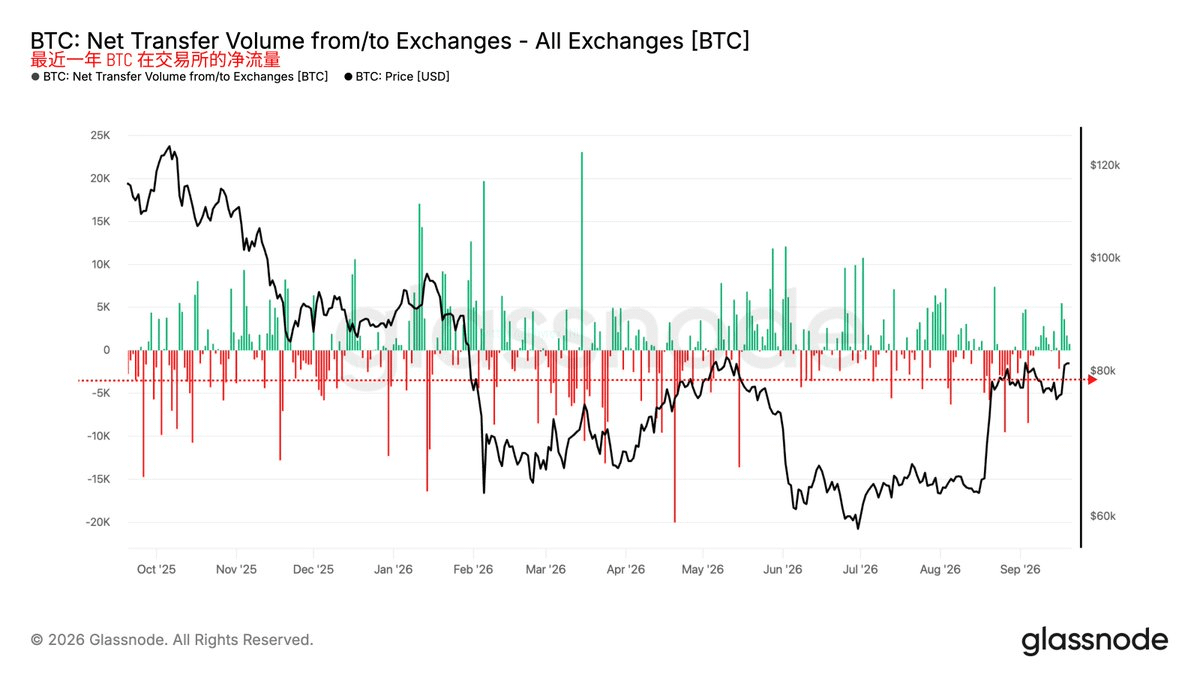
The strong rebound in the past few days indirectly confirms the reliability of this data, and overall the market still remains in a buyer’s market.
In addition, the rate at which long-term holders sell has slowed significantly compared with August. Crypto analyst AxelAdlerJr is monitoring that the amount held by Bitcoin long-term holders has continued to decrease over nearly five weeks. However, the rate of trimming over the past 30 days slowed from 105,900 BTC on August 30 to 21,700 BTC on September 20. In other words, long-term holders are still reducing their holdings, but the selling pace is only about one-fifth of late August.
K-line chart: BTC price first breaks above the 50-week moving average, signaling that the bull market confirmation is underway
As of the week of September 20, Bitcoin for the first time in 45 weeks closed above its 50-week moving average. Galaxy Research head Alex Thorn described this as a potential important confirmation that the bearish phase in the market may be over and that a new uptrend is about to begin.
Bitcoin rose nearly 6% last week, trading around $81,000, expanding its rebound over the past 35 days to 29%. This move helped the weekly candlestick chart for Bitcoin—i.e., the chart of week-to-week price performance—break above the 50-week moving average, not merely touch it.
Galaxy considers the value of the BTC 50-week moving average as the ceiling during periods of sharp BTC pullbacks. Once a cryptocurrency falls below that level, historically efforts to return to this number tend to fail until the market is closer to a sustained bottom.
Galaxy studied Bitcoin’s main drawdowns since 2011 and found that within a week, Bitcoin’s closing price rebounded to above its 50-week moving average 13 times. Of those 13 instances, in 11 the market did not make new lows again, suggesting that the most severe phase of the decline has already passed.
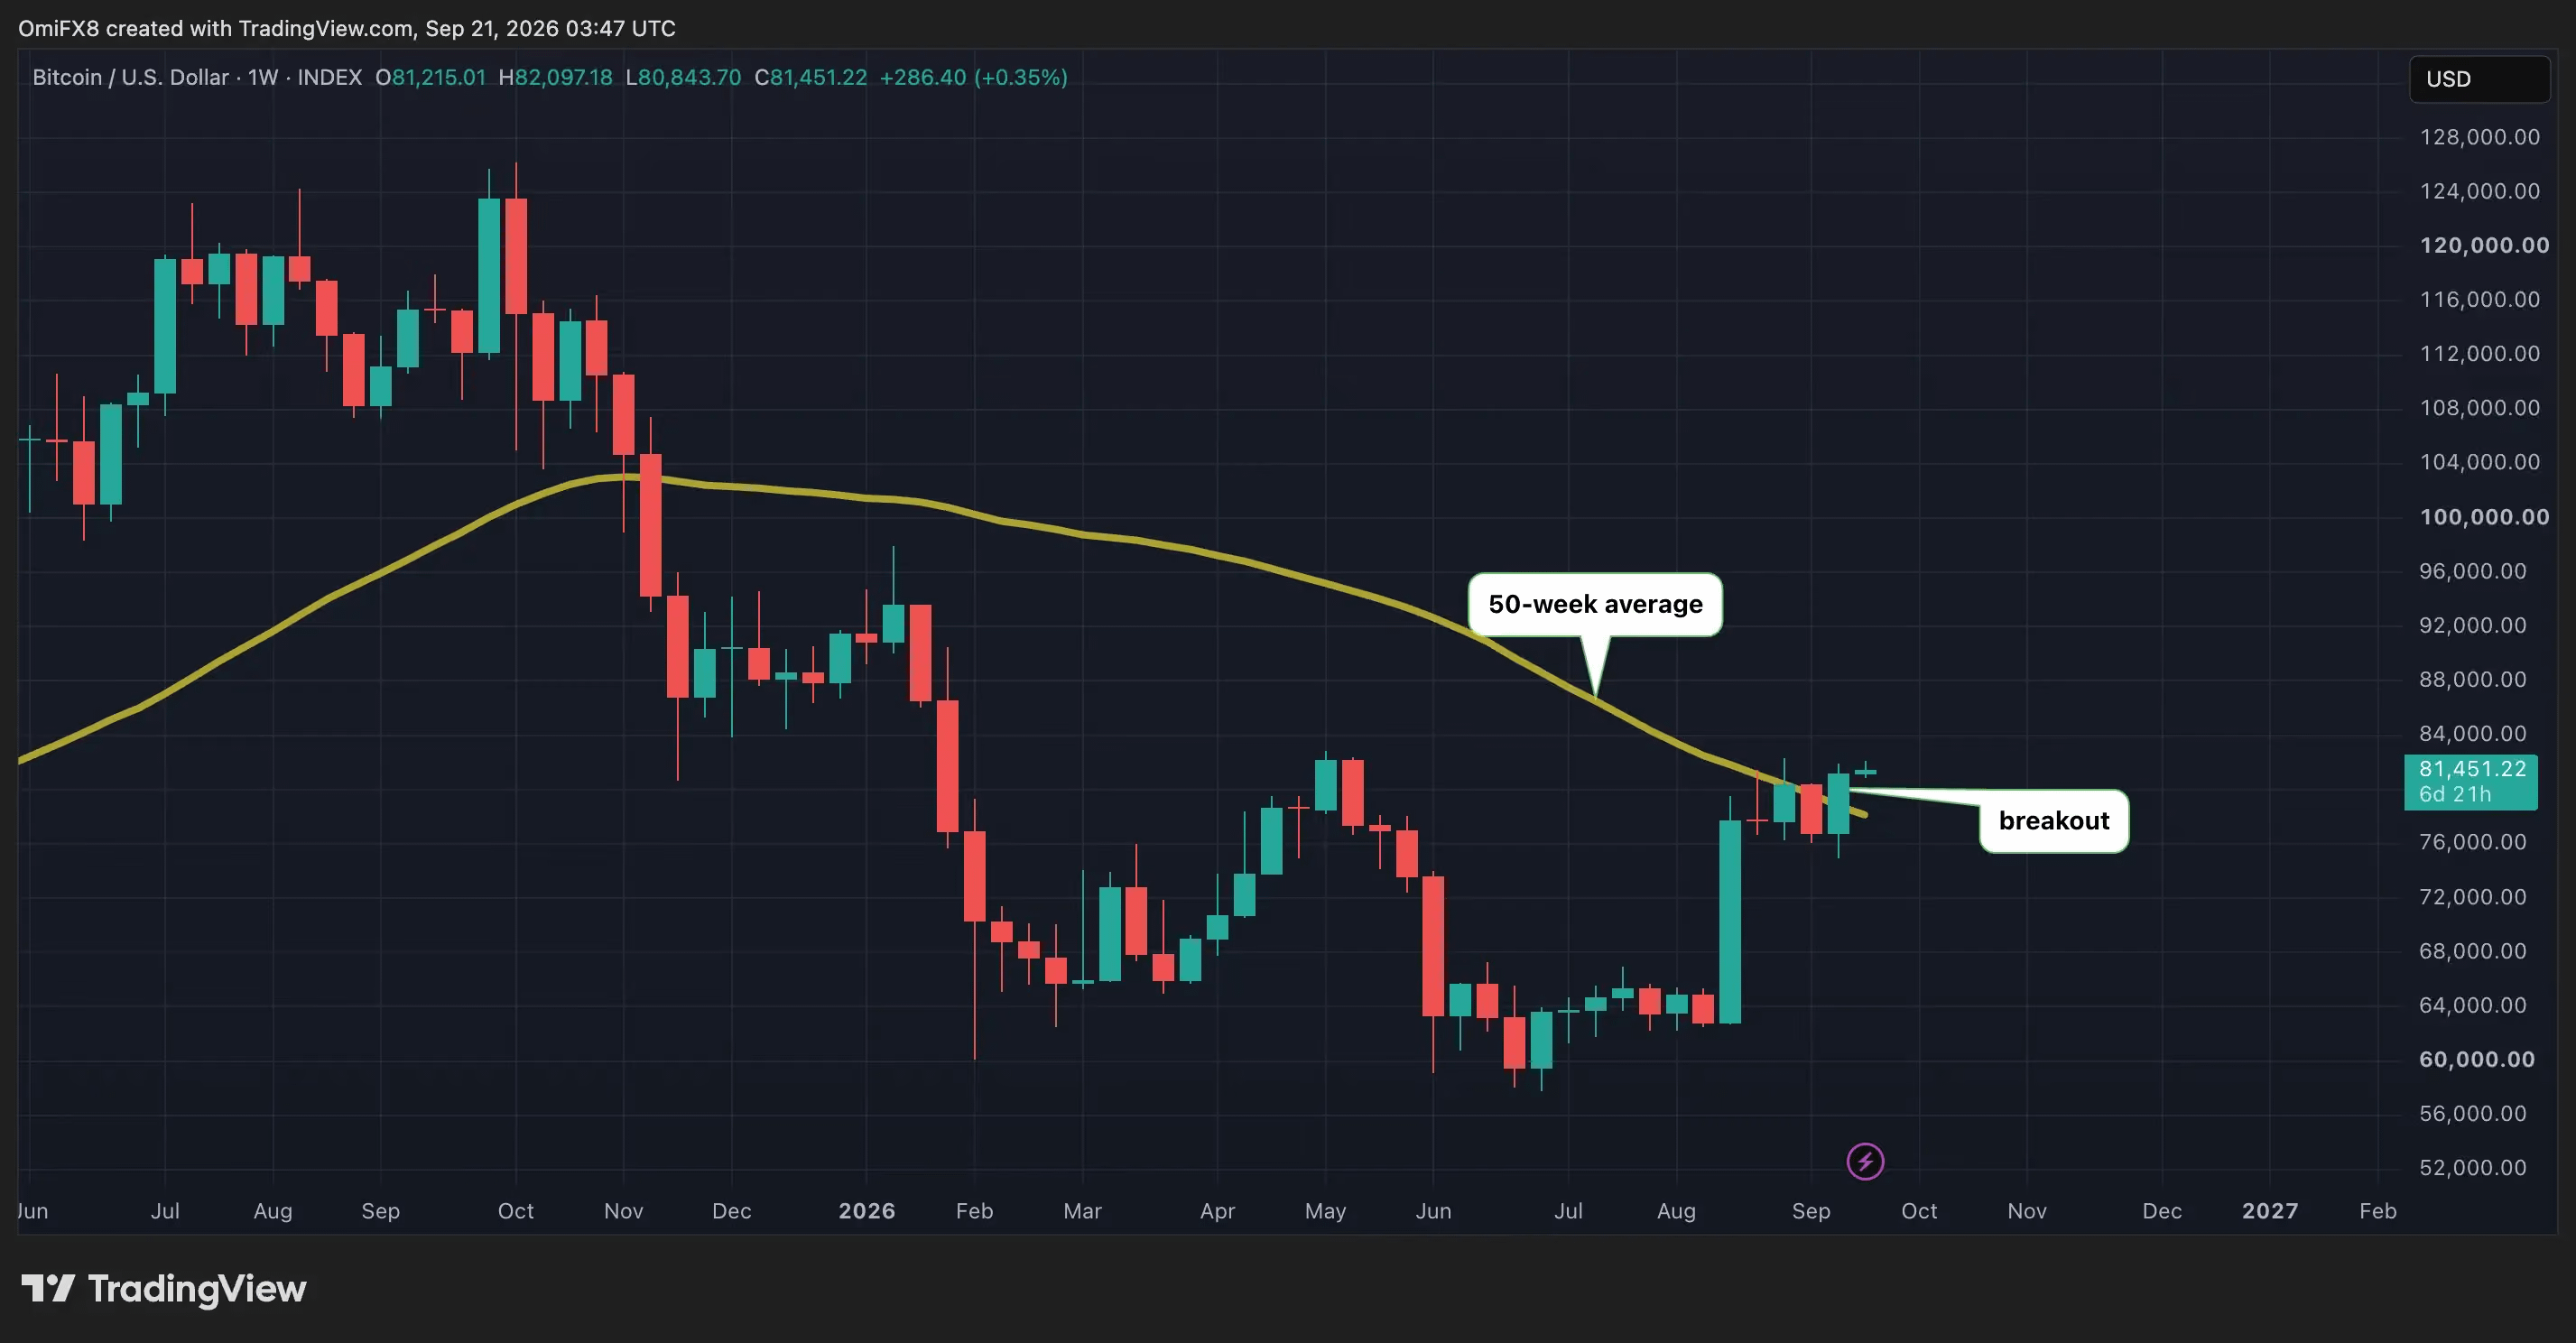
Late on September 20, crypto analyst Doctor Profit also posted that Bitcoin has broken through the 50-week moving average located at about $78,700. He said that last week’s closing price staying above this moving average is a confirmation signal that a new bull market is starting.
He believes the current BTC trend is structurally similar to 2022–2023: after Bitcoin was blocked for several consecutive weeks and went through a short-seller trap, it regained the 50-week moving average. Historically, of the seven times Bitcoin broke below the 50-week moving average and then recovered it, five initiated bull markets; the other two formed false breakouts in 2011 and 2020, respectively. Currently, Bitcoin is still in a range of $71,000 to $82,000. A breakout above the $82,500–$83,000 area would provide stronger confirmation. He will continue holding spot and target $88,000 once the remaining resistance levels are broken.
ETF data is steady and improving: cumulative net inflows have surpassed $55 billion, and the net asset value ratio is close to 6.3%
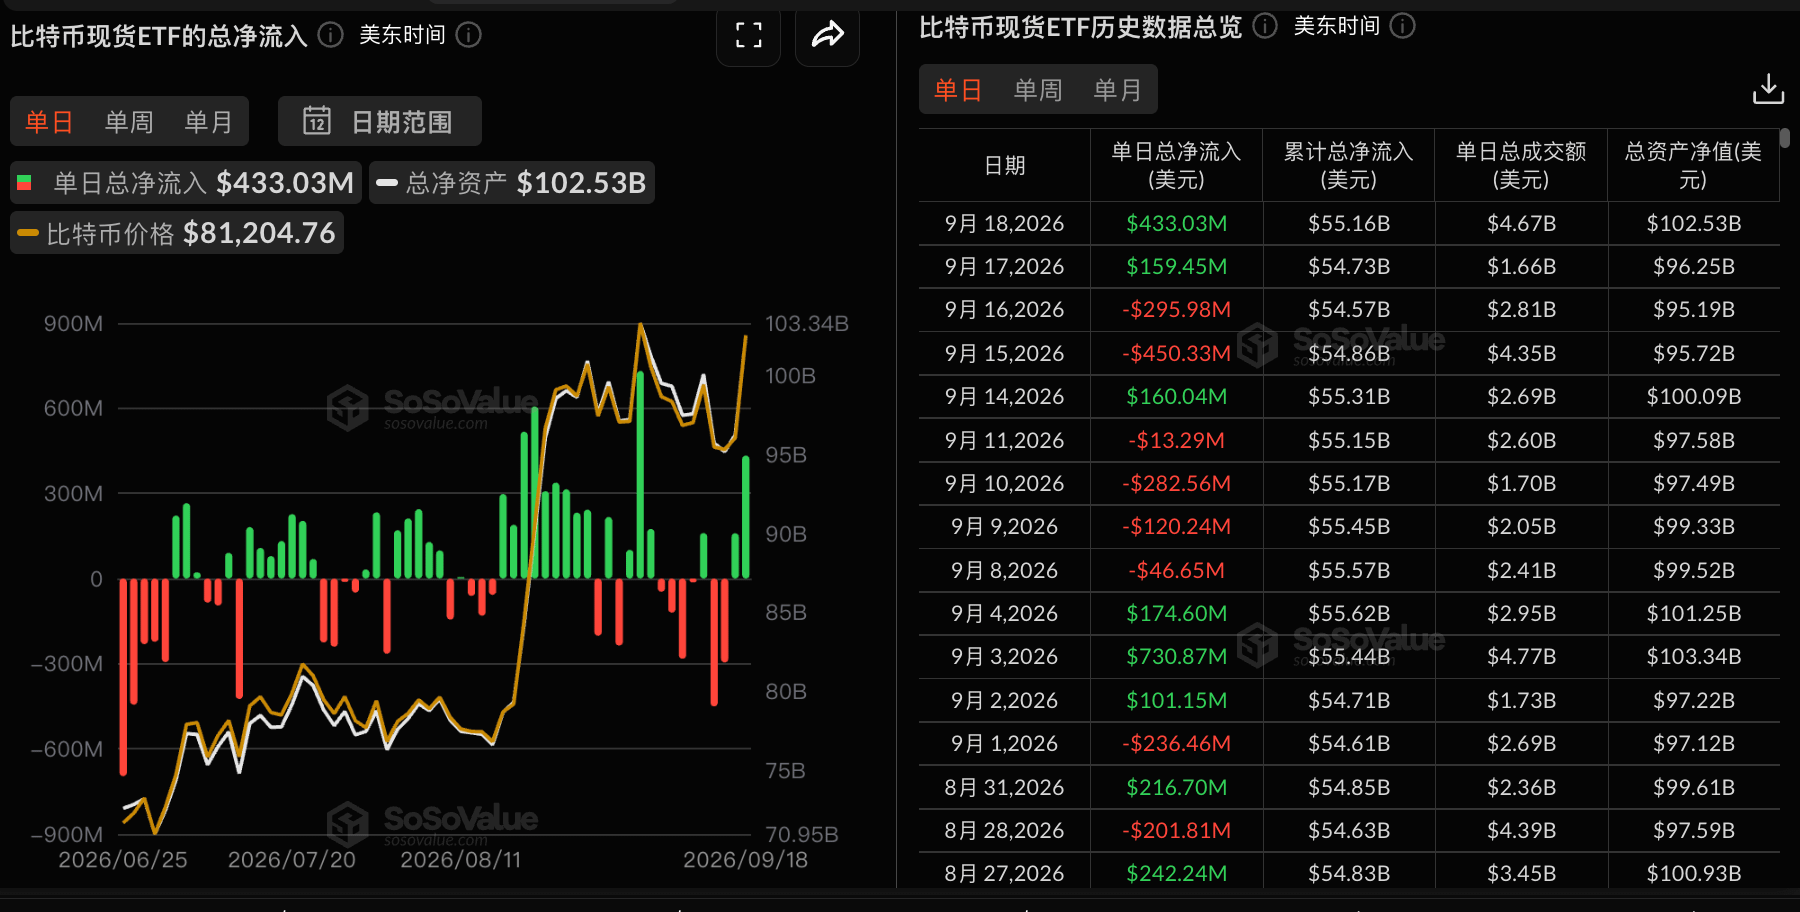
From the perspective of institutional inflows, the recent inflow data for BTC spot ETFs is also gradually stabilizing and turning more positive.
On September 17, ETF-related fund products attracted $159 million in net inflows; on September 18, that figure jumped to about $433 million. As of September 9 through September 8, the cumulative net inflows for BTC spot ETFs exceeded $55 billion, and the net asset value ratio of total assets was close to 6.3%.
Bloomberg ETF analyst Eric Balchunas also pointed out that overall Bitcoin investors are younger, while gold investors are older. As volatility and correlation with other assets stabilize, Bitcoin will be adopted more by large institutional funds. At the same time, Bitcoin ETFs have higher market buzz and stronger distribution capabilities; dozens of wholesale institutions familiar with both crypto and traditional investor markets are educating investors about Bitcoin ETFs.
From a time perspective, history is on BTC’s side, and young people as well as institutions are BTC’s best allies.
As the CLARITY impact fades, policy tailwinds from the U.S. SEC and CFTC may continue to benefit the crypto market
On September 17, the day after the CLARITY bill’s senator vote failed, the U.S. SEC issued a new innovation exemption policy allowing tokenized stock to be traded via TSVs crypto trading platforms. On September 18, the U.S. CFTC submitted to the White House a draft of new rules for cryptocurrency trading and markets. Based on the previous remarks by SEC Chair Paul Atkins and CFTC Chair Michael Selig, among others, crypto-friendly rules and policies that support market development will likely continue to be released.
Pantera Capital founder Dan Morehead said that the SEC and CFTC are still continuously rolling out related measures, which in the future may be included within the scope of the CLARITY legislation. In his view, even if it has not been passed yet, the crypto industry can still continue to develop.
A roundup of crypto analyst views: BTC breaks above $82,000 as an important signal; ETH may target $3,000
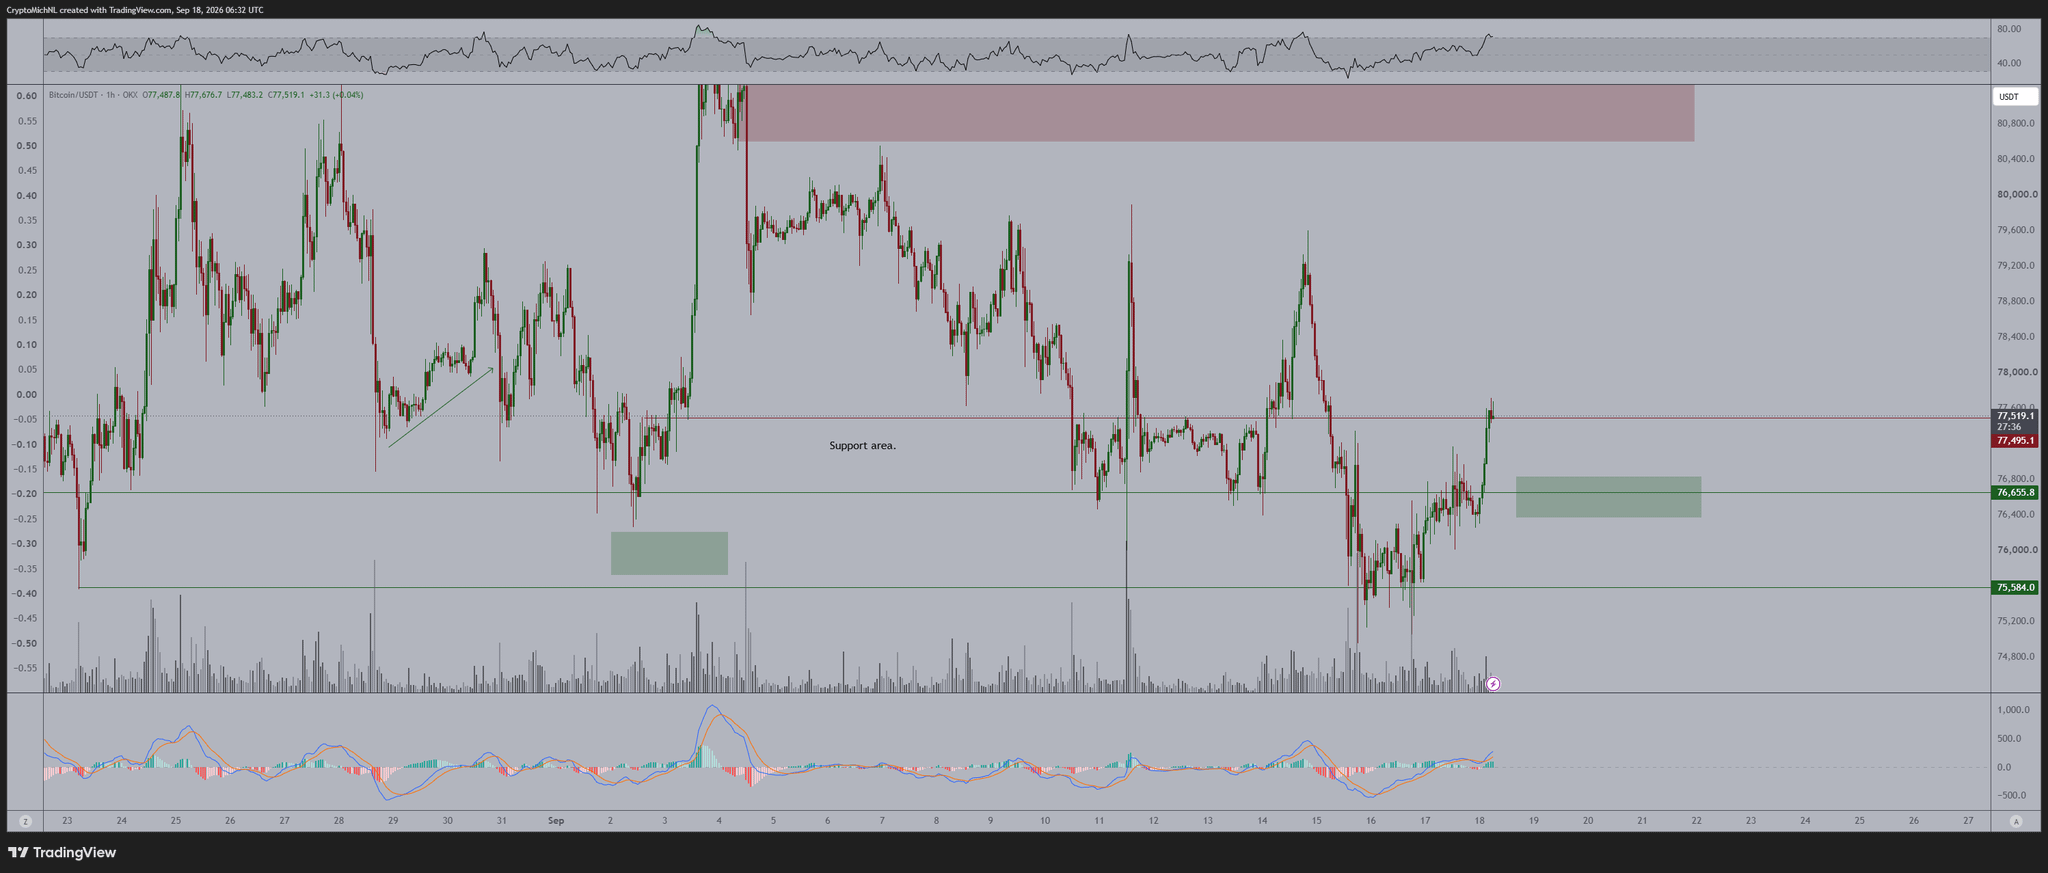
Crypto analyst Michaël van de Poppe even said that the market was “bullish” before Bitcoin broke above the $80,000 level. He believes $76,700 is a potential support level that would allow Bitcoin to continue its upward move and push toward the high end of the range. His exact words were: “Any pullback at the $76,700 price level is an excellent long-term entry opportunity to reach the high point of that range.”
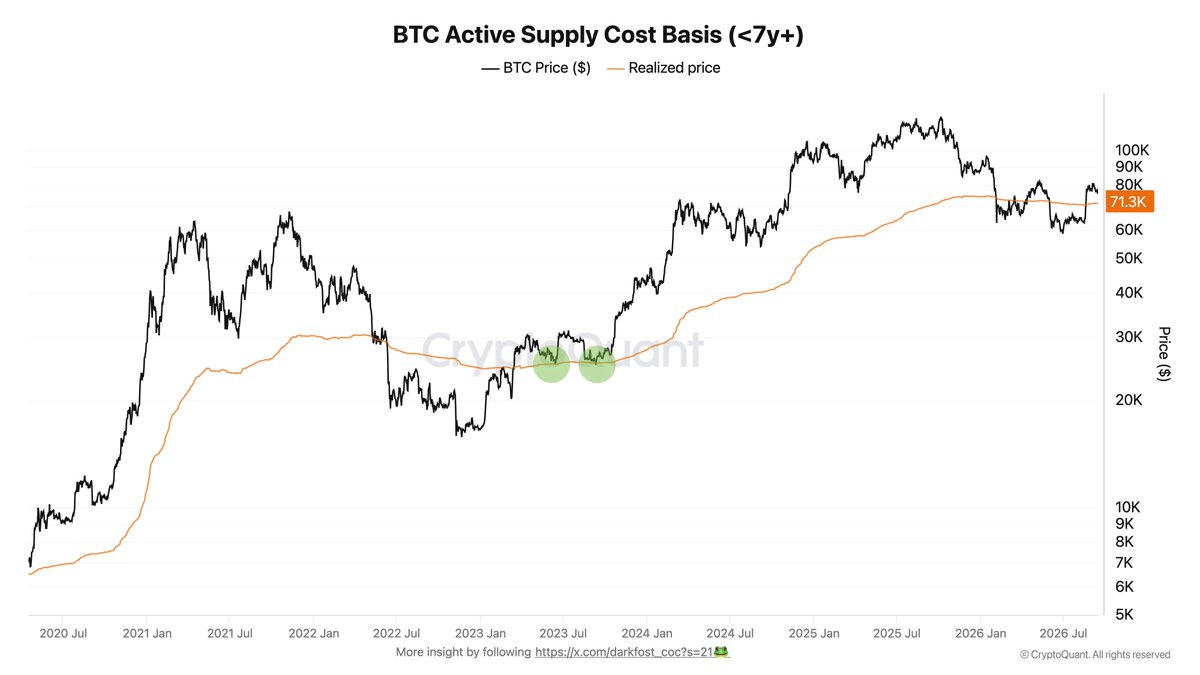
On September 17, CryptoQuant analyst Darkfost pointed to BTC’s key range of $71,300–$79,800. He said the lower bound of this range corresponds to the average cost of Bitcoin’s active supply, which can act as support. By contrast, because investors choose to sell after reaching their breakeven point, the $79,800 area has repeatedly acted as resistance. On September 18, the BTC price successfully broke above.
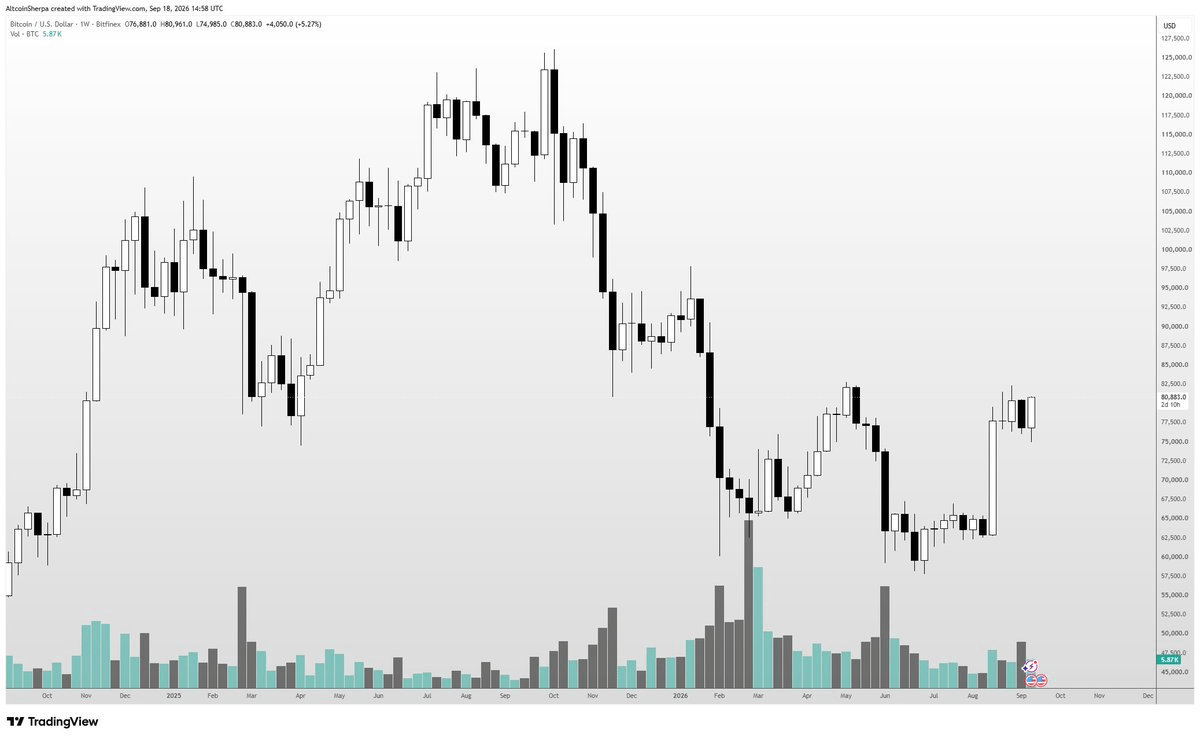
Trader Altcoin Sherpa believes the next key level is around $82,000. In his view, after a successful breakout above this level, the price could move toward $100,000. Before that, he does not rule out continued range-bound consolidation.
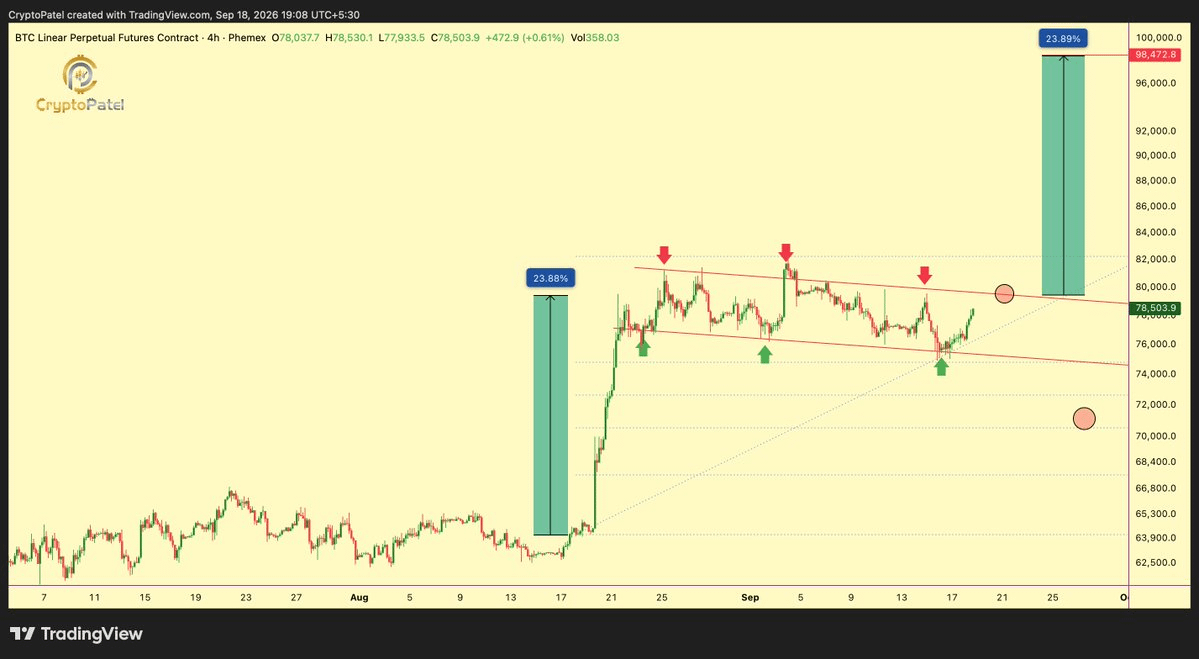
Technical analyst Crypto Patel listed $80,000 as a key level. According to his model, if the BTC price stays above this level, it will confirm a breakout in a “bullish flag” pattern; the subsequent targets are $82,250 and $98,000.
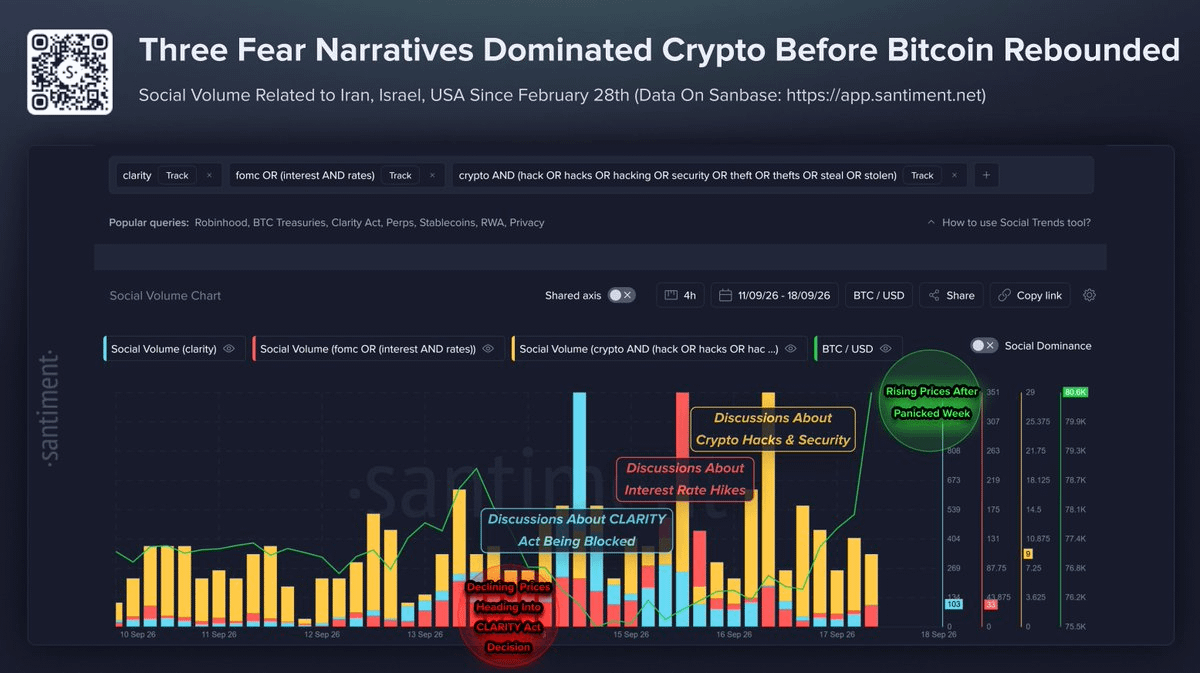
The data analytics platform Sentiment also noted that last week the overall crypto market was in the process of digesting the “three major crises,” including the Fed’s rate hikes, the CLARITY bill failing to pass, and market-security-risk incidents involving Symbiosis and Revolut. As of now, the market has already fully digested the negative news, and the more patient long-term holders have already entered; it will be difficult to see a major drop in the short term.
Finally, looking at specific price performance, some analysts believe that ETH could potentially rise to $2,700–$3,000. On September 17, crypto analyst Ali said that although volatility in Ethereum has increased recently, the current price is still operating within a range-bound environment. ETH’s near-term rebound target is $2,570; if ETH can break out with volume and hold above that level, it could signal further strengthening of the trend, with ETH potentially moving up toward $2,700 and even $3,000.