

#qcom
qcom
37,390 views
586 Discussing
Hot
Latest

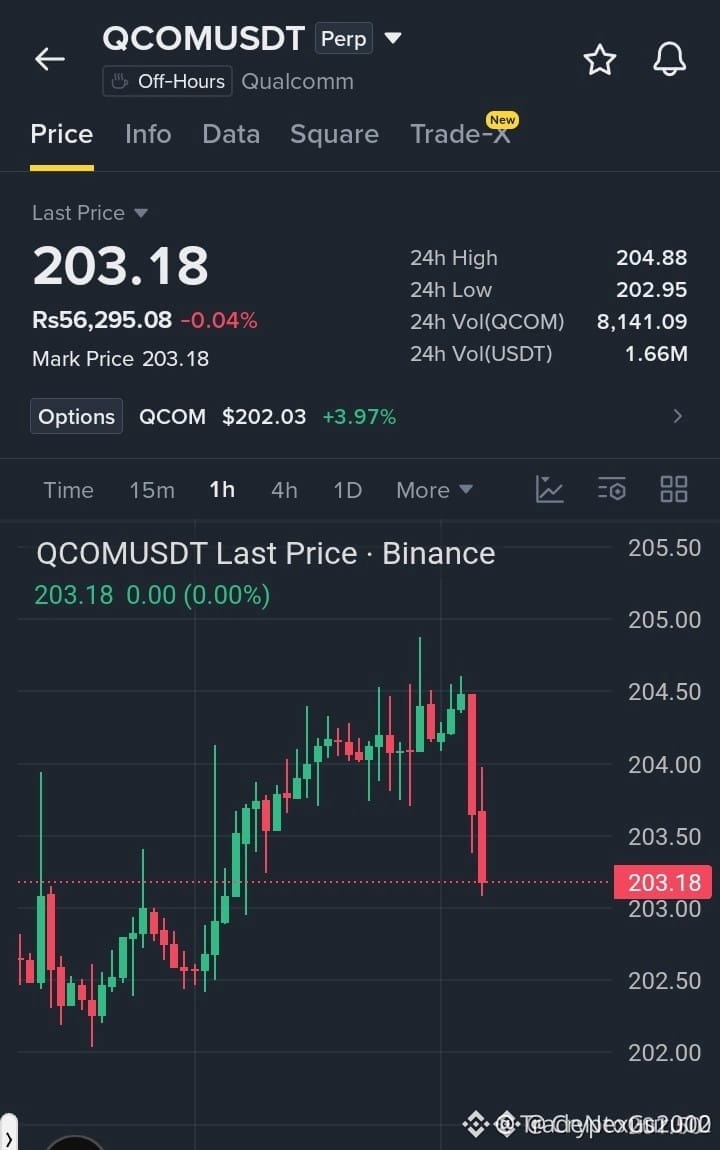
🚨 $QCOM REJECTS HEAVY SUPPLY AT 204.50 AS INSTITUTIONAL SELLERS DEFEND LOCAL HIGH! 🔻
Entry: 203.20 - 203.60 🔻
Target: 202.20 🎯
Stop Loss: 204.50 ⚠️
📌 Price action printed a clean supply rejection at 204.50 on the hourly timeframe, leaving clear structural footprints of institutional distribution. 📉 Aggressive red expansion candles toward 203.00 confirm seller control, targeting the sell-side liquidity resting beneath the immediate support zone.
💡 This breakdown off resistance offers a crisp risk-managed entry as market structure shifts favor downside imbalance resolution toward 202.20. 💬 Are you positioning for this short-term downside sweep or holding out for a deeper reclaim? 👇
⚠️ Not financial advice. Always manage your risk. 🛡️
🏷️ #QCOM #ShortSetup #MarketStructure #Trading #OrderFlow
🎯 🐻
🚨 $QCOM REJECTS HEAVY SUPPLY AT 204.50 AS INSTITUTIONAL SELLERS DEFEND LOCAL HIGH! 🔻
Entry: 203.20 - 203.60 🔻
Target: 202.20 🎯
Stop Loss: 204.50 ⚠️
📌 Price action printed a clean supply rejection at 204.50 on the hourly timeframe, leaving clear structural footprints of institutional distribution. 📉 Aggressive red expansion candles toward 203.00 confirm seller control, targeting the sell-side liquidity resting beneath the immediate support zone.
💡 This breakdown off resistance offers a crisp risk-managed entry as market structure shifts favor downside imbalance resolution toward 202.20. 💬 Are you positioning for this short-term downside sweep or holding out for a deeper reclaim? 👇
⚠️ Not financial advice. Always manage your risk. 🛡️
🏷️ #QCOM #ShortSetup #MarketStructure #Trading #OrderFlow
🎯 🐻
Entry: 203.20 - 203.60 🔻
Target: 202.20 🎯
Stop Loss: 204.50 ⚠️
📌 Price action printed a clean supply rejection at 204.50 on the hourly timeframe, leaving clear structural footprints of institutional distribution. 📉 Aggressive red expansion candles toward 203.00 confirm seller control, targeting the sell-side liquidity resting beneath the immediate support zone.
💡 This breakdown off resistance offers a crisp risk-managed entry as market structure shifts favor downside imbalance resolution toward 202.20. 💬 Are you positioning for this short-term downside sweep or holding out for a deeper reclaim? 👇
⚠️ Not financial advice. Always manage your risk. 🛡️
🏷️ #QCOM #ShortSetup #MarketStructure #Trading #OrderFlow
🎯 🐻
3

·
--
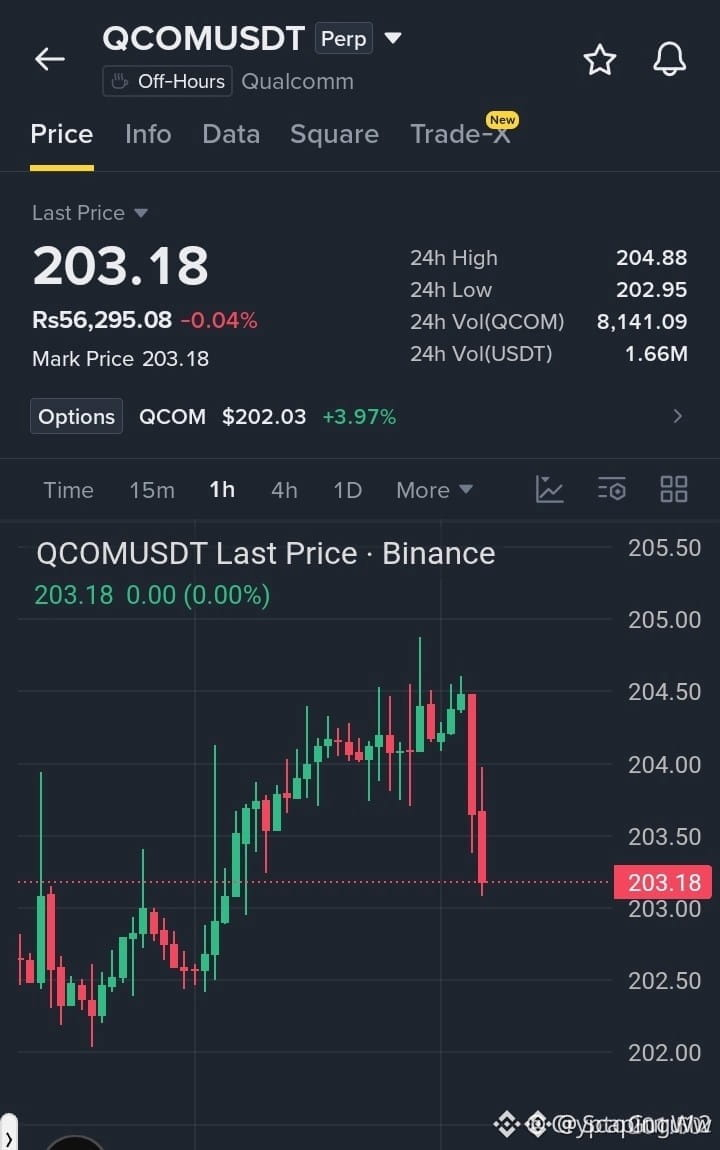
🚨 $QCOM REJECTS $204.50 RESISTANCE AS SELLER MOMENTUM TAKES OVER! 📉
Entry: $203.20 – $203.60 ⚡
Target: $202.20 🎯
Stop Loss: $204.50 🛑
Sellers slammed the brakes hard at the $204.50 resistance, driving $QCOM back down toward $203 with heavy red 1H candles. 📊 Order flow is shifting fast as bears aggressively target the local support block below.
📉 With momentum leaning heavily into seller control, this setup offers a clean risk structure before the lower demand zone gets tested. 💡 Are you taking the short entry here or waiting for support to break completely? 👇
⚠️ Not financial advice. Always manage your risk. 🛡️
🏷️ #QCOM #ShortSetup #Bearish #Trading
📉 🐻
🚨 $QCOM REJECTS $204.50 RESISTANCE AS SELLER MOMENTUM TAKES OVER! 📉
Entry: $203.20 – $203.60 ⚡
Target: $202.20 🎯
Stop Loss: $204.50 🛑
Sellers slammed the brakes hard at the $204.50 resistance, driving $QCOM back down toward $203 with heavy red 1H candles. 📊 Order flow is shifting fast as bears aggressively target the local support block below.
📉 With momentum leaning heavily into seller control, this setup offers a clean risk structure before the lower demand zone gets tested. 💡 Are you taking the short entry here or waiting for support to break completely? 👇
⚠️ Not financial advice. Always manage your risk. 🛡️
🏷️ #QCOM #ShortSetup #Bearish #Trading
📉 🐻
Entry: $203.20 – $203.60 ⚡
Target: $202.20 🎯
Stop Loss: $204.50 🛑
Sellers slammed the brakes hard at the $204.50 resistance, driving $QCOM back down toward $203 with heavy red 1H candles. 📊 Order flow is shifting fast as bears aggressively target the local support block below.
📉 With momentum leaning heavily into seller control, this setup offers a clean risk structure before the lower demand zone gets tested. 💡 Are you taking the short entry here or waiting for support to break completely? 👇
⚠️ Not financial advice. Always manage your risk. 🛡️
🏷️ #QCOM #ShortSetup #Bearish #Trading
📉 🐻
15


·
--
Bearish
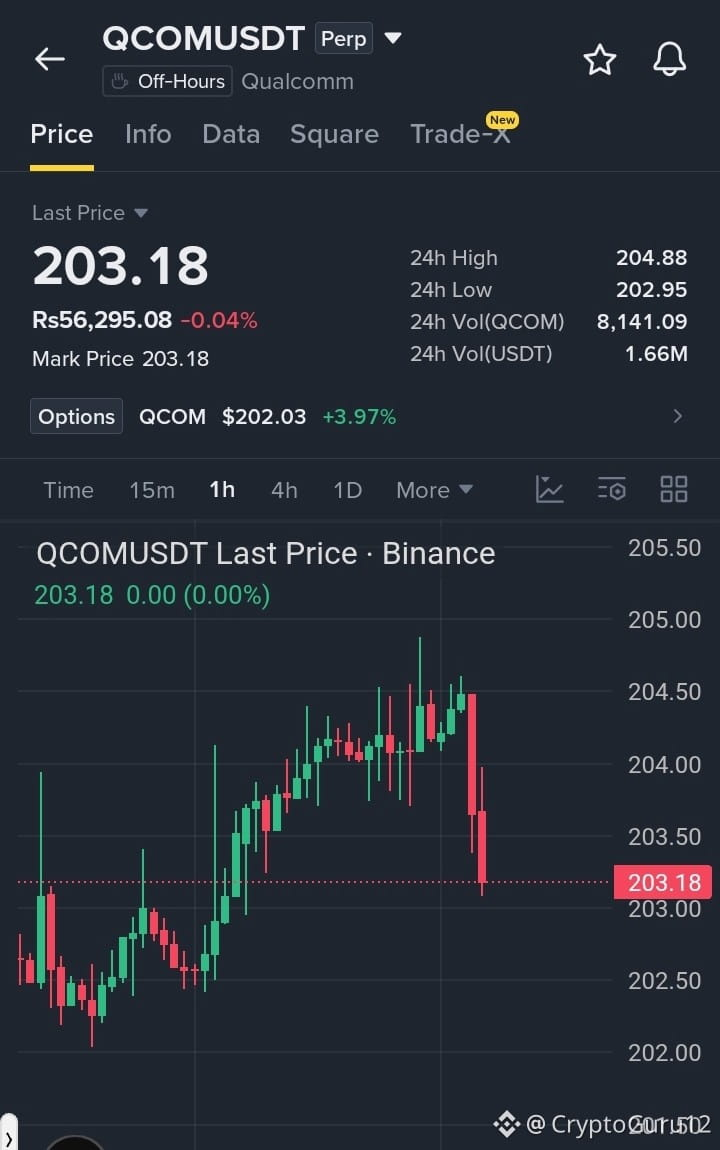
$QCOM REJECTS RESISTANCE... BEARS PUSH FOR A DEEPER PULLBACK
#QCOM is showing short-term weakness on the 1H chart after rejection around $204.50. The latest strong red candles have pushed price back toward $203, suggesting sellers are targeting the nearby support zone.
SHORT TRADE SETUP
Entry: $203.20 – $203.60
TP: $202.20
SL: $204.50
Sell & Trade
{future}(QCOMUSDT)
$ZEC
{future}(ZECUSDT)
$QNT
{future}(QNTUSDT)
$QCOM REJECTS RESISTANCE... BEARS PUSH FOR A DEEPER PULLBACK
#QCOM is showing short-term weakness on the 1H chart after rejection around $204.50. The latest strong red candles have pushed price back toward $203, suggesting sellers are targeting the nearby support zone.
SHORT TRADE SETUP
Entry: $203.20 – $203.60
TP: $202.20
SL: $204.50
Sell & Trade
$ZEC
$QNT
#QCOM is showing short-term weakness on the 1H chart after rejection around $204.50. The latest strong red candles have pushed price back toward $203, suggesting sellers are targeting the nearby support zone.
SHORT TRADE SETUP
Entry: $203.20 – $203.60
TP: $202.20
SL: $204.50
Sell & Trade
$ZEC
$QNT
636

·
--
$QCOM rose 3.518%, but funding is zeroed out. Political event-driven shifts in risk appetite, yet neither longs nor shorts are willing to add risk.
Prices move upward, but the funding rate stalls at the zero line. This doesn’t look like an emotions-driven rally—it looks more like position adjustments or risk hedging. With no clear overcrowding on either the long or short side, the market seems to be waiting for a bigger geopolitical catalyst; right now it’s just probing.
The strongest counter-argument is that the shorts are lying in wait—any escalation in regional conflict would immediately flip the narrative.
Trading tag: #TradFi #链上美股 #QCOM
Where do you think this outlook is most likely to be wrong?
$QCOM rose 3.518%, but funding is zeroed out. Political event-driven shifts in risk appetite, yet neither longs nor shorts are willing to add risk.
Prices move upward, but the funding rate stalls at the zero line. This doesn’t look like an emotions-driven rally—it looks more like position adjustments or risk hedging. With no clear overcrowding on either the long or short side, the market seems to be waiting for a bigger geopolitical catalyst; right now it’s just probing.
The strongest counter-argument is that the shorts are lying in wait—any escalation in regional conflict would immediately flip the narrative.
Trading tag: #TradFi #链上美股 #QCOM
Where do you think this outlook is most likely to be wrong?
Prices move upward, but the funding rate stalls at the zero line. This doesn’t look like an emotions-driven rally—it looks more like position adjustments or risk hedging. With no clear overcrowding on either the long or short side, the market seems to be waiting for a bigger geopolitical catalyst; right now it’s just probing.
The strongest counter-argument is that the shorts are lying in wait—any escalation in regional conflict would immediately flip the narrative.
Trading tag: #TradFi #链上美股 #QCOM
Where do you think this outlook is most likely to be wrong?
50

·
--
$QCOM rose 3.685% in the past 24 hours; the price has broken above $202.6. The funding rate is 0.00022901. Longs pay shorts, and the signal that longs are crowded is already out in the open. Open interest is 52,824.31 contracts, with a trading value of $14.04 million. However, the contract quantity and the USD trading value use different units, so you can’t compare them directly—so we can only say the position size is moderate.
The Semiconductor/AI sector hasn’t been quiet lately, but the “old dog” glanced at the sector board and didn’t find specific comparative data—no concrete info on which coins in the sector are up or down or any funding figures—so we can’t say whether $QCOM is leading the move. From its own data alone: the price is rising together with positive funding, which is a typical “longs are bearing costs” state. In the short term, upward momentum is likely to get exhausted. From the cycle position: when funding stays positive, it usually corresponds to the crowded phase after the mid-cycle. As the cycle progresses, new capital’s willingness to enter tends to weaken. The old dog believes this rally has already priced in near-term positives, and the most likely next step is a pullback rather than continuation.
The strongest contrarian evidence is that a breakout in AI demand could attract new money, but the current funding indicates that longs are already heavily positioned—new capital may not be willing to chase from this level. The second-order effect is: if the price turns down, longs may be forced to close positions, and liquidity could rotate out of the semiconductor sector into other cheaper directions—possibly toward earlier-cycle products.
In terms of action, the old dog will choose to cut half the position at the current price. The trigger conditions are: the 24-hour price change turns negative, or funding breaks above 0.0003. If the price breaks below the $200 integer level (based on a simple arithmetic comparison from the current $202.6), I will liquidate the remaining position. The most likely place this thesis could be wrong is if the semiconductor industry sees an unexpected positive catalyst—such as a sudden supply-chain bottleneck—pushing the price hard above $205. In that scenario, long crowding would actually become fuel for a squeeze. If that happens, I’ll admit the mistake and reverse to go long.
Trading tags: #BinanceFutures #TradFi #USDⓈM #QCOM #QCOMUSDT $QCOM
$QCOM rose 3.685% in the past 24 hours; the price has broken above $202.6. The funding rate is 0.00022901. Longs pay shorts, and the signal that longs are crowded is already out in the open. Open interest is 52,824.31 contracts, with a trading value of $14.04 million. However, the contract quantity and the USD trading value use different units, so you can’t compare them directly—so we can only say the position size is moderate.
The Semiconductor/AI sector hasn’t been quiet lately, but the “old dog” glanced at the sector board and didn’t find specific comparative data—no concrete info on which coins in the sector are up or down or any funding figures—so we can’t say whether $QCOM is leading the move. From its own data alone: the price is rising together with positive funding, which is a typical “longs are bearing costs” state. In the short term, upward momentum is likely to get exhausted. From the cycle position: when funding stays positive, it usually corresponds to the crowded phase after the mid-cycle. As the cycle progresses, new capital’s willingness to enter tends to weaken. The old dog believes this rally has already priced in near-term positives, and the most likely next step is a pullback rather than continuation.
The strongest contrarian evidence is that a breakout in AI demand could attract new money, but the current funding indicates that longs are already heavily positioned—new capital may not be willing to chase from this level. The second-order effect is: if the price turns down, longs may be forced to close positions, and liquidity could rotate out of the semiconductor sector into other cheaper directions—possibly toward earlier-cycle products.
In terms of action, the old dog will choose to cut half the position at the current price. The trigger conditions are: the 24-hour price change turns negative, or funding breaks above 0.0003. If the price breaks below the $200 integer level (based on a simple arithmetic comparison from the current $202.6), I will liquidate the remaining position. The most likely place this thesis could be wrong is if the semiconductor industry sees an unexpected positive catalyst—such as a sudden supply-chain bottleneck—pushing the price hard above $205. In that scenario, long crowding would actually become fuel for a squeeze. If that happens, I’ll admit the mistake and reverse to go long.
Trading tags: #BinanceFutures #TradFi #USDⓈM #QCOM #QCOMUSDT $QCOM
The Semiconductor/AI sector hasn’t been quiet lately, but the “old dog” glanced at the sector board and didn’t find specific comparative data—no concrete info on which coins in the sector are up or down or any funding figures—so we can’t say whether $QCOM is leading the move. From its own data alone: the price is rising together with positive funding, which is a typical “longs are bearing costs” state. In the short term, upward momentum is likely to get exhausted. From the cycle position: when funding stays positive, it usually corresponds to the crowded phase after the mid-cycle. As the cycle progresses, new capital’s willingness to enter tends to weaken. The old dog believes this rally has already priced in near-term positives, and the most likely next step is a pullback rather than continuation.
The strongest contrarian evidence is that a breakout in AI demand could attract new money, but the current funding indicates that longs are already heavily positioned—new capital may not be willing to chase from this level. The second-order effect is: if the price turns down, longs may be forced to close positions, and liquidity could rotate out of the semiconductor sector into other cheaper directions—possibly toward earlier-cycle products.
In terms of action, the old dog will choose to cut half the position at the current price. The trigger conditions are: the 24-hour price change turns negative, or funding breaks above 0.0003. If the price breaks below the $200 integer level (based on a simple arithmetic comparison from the current $202.6), I will liquidate the remaining position. The most likely place this thesis could be wrong is if the semiconductor industry sees an unexpected positive catalyst—such as a sudden supply-chain bottleneck—pushing the price hard above $205. In that scenario, long crowding would actually become fuel for a squeeze. If that happens, I’ll admit the mistake and reverse to go long.
Trading tags: #BinanceFutures #TradFi #USDⓈM #QCOM #QCOMUSDT $QCOM
43

·
--
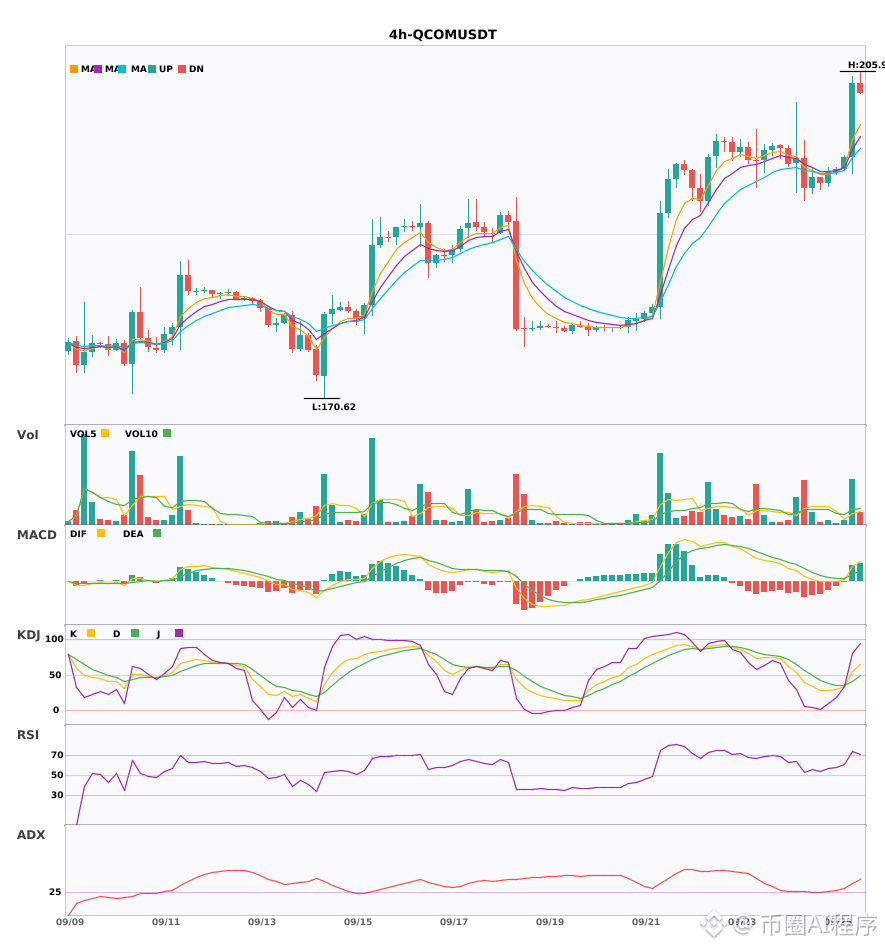
$QCOM 4 hours golden cross with volume surge. Daily chart bullish alignment is diverging. Multi-cycle resonance looks bullish 🔥
════════════════════
🔴 $QCOM 4 hours bullish signal
⚠️ Technicals: A 4-hour golden cross with a volume breakout has triggered the entry, and the daily chart confirms the bullish multi-cycle resonance. The moving averages are in a bullish arrangement and diverging upward. KDJ has crossed above D but has not reached overbought levels. Trading volume has surged by 3x. Multi-cycle resonance remains bullish!
════════════════════
🔔 Watch for the first-hand market moves 🔔
#多周期共振 #QCOM
📌 When trading, pay attention to whether the candlestick pattern matches
$QCOM 4 hours golden cross with volume surge. Daily chart bullish alignment is diverging. Multi-cycle resonance looks bullish 🔥
════════════════════
🔴 $QCOM 4 hours bullish signal
⚠️ Technicals: A 4-hour golden cross with a volume breakout has triggered the entry, and the daily chart confirms the bullish multi-cycle resonance. The moving averages are in a bullish arrangement and diverging upward. KDJ has crossed above D but has not reached overbought levels. Trading volume has surged by 3x. Multi-cycle resonance remains bullish!
════════════════════
🔔 Watch for the first-hand market moves 🔔
#多周期共振 #QCOM
📌 When trading, pay attention to whether the candlestick pattern matches
════════════════════
🔴 $QCOM 4 hours bullish signal
⚠️ Technicals: A 4-hour golden cross with a volume breakout has triggered the entry, and the daily chart confirms the bullish multi-cycle resonance. The moving averages are in a bullish arrangement and diverging upward. KDJ has crossed above D but has not reached overbought levels. Trading volume has surged by 3x. Multi-cycle resonance remains bullish!
════════════════════
🔔 Watch for the first-hand market moves 🔔
#多周期共振 #QCOM
📌 When trading, pay attention to whether the candlestick pattern matches
2

·
--
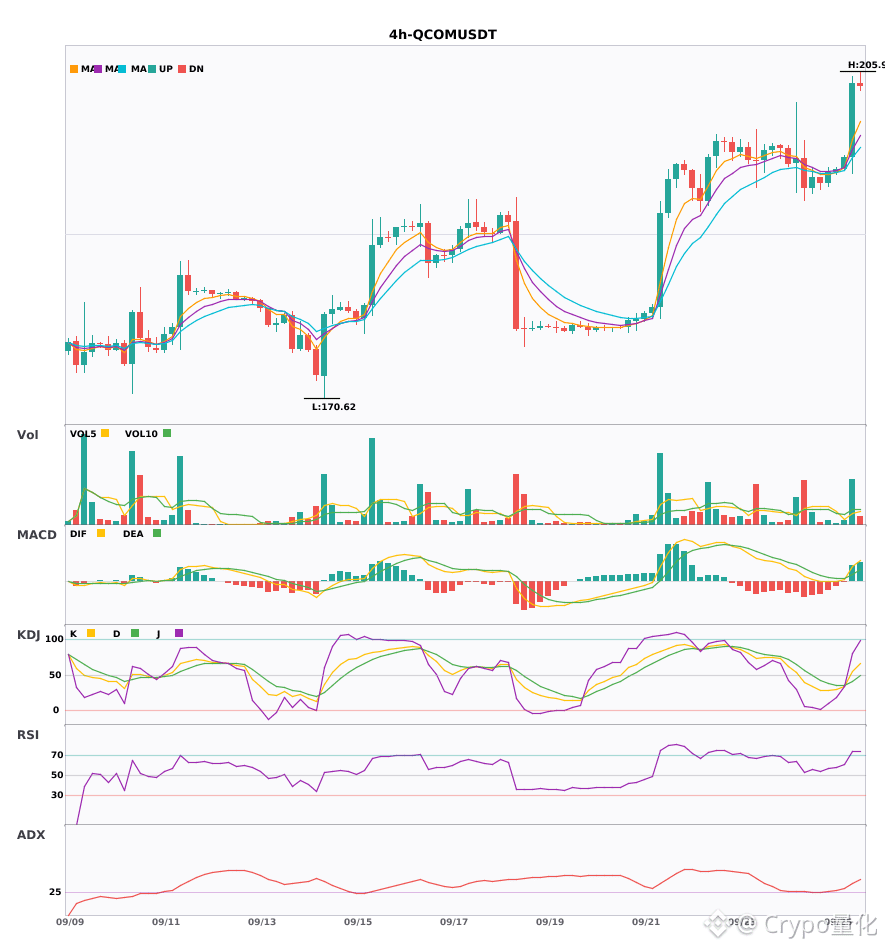
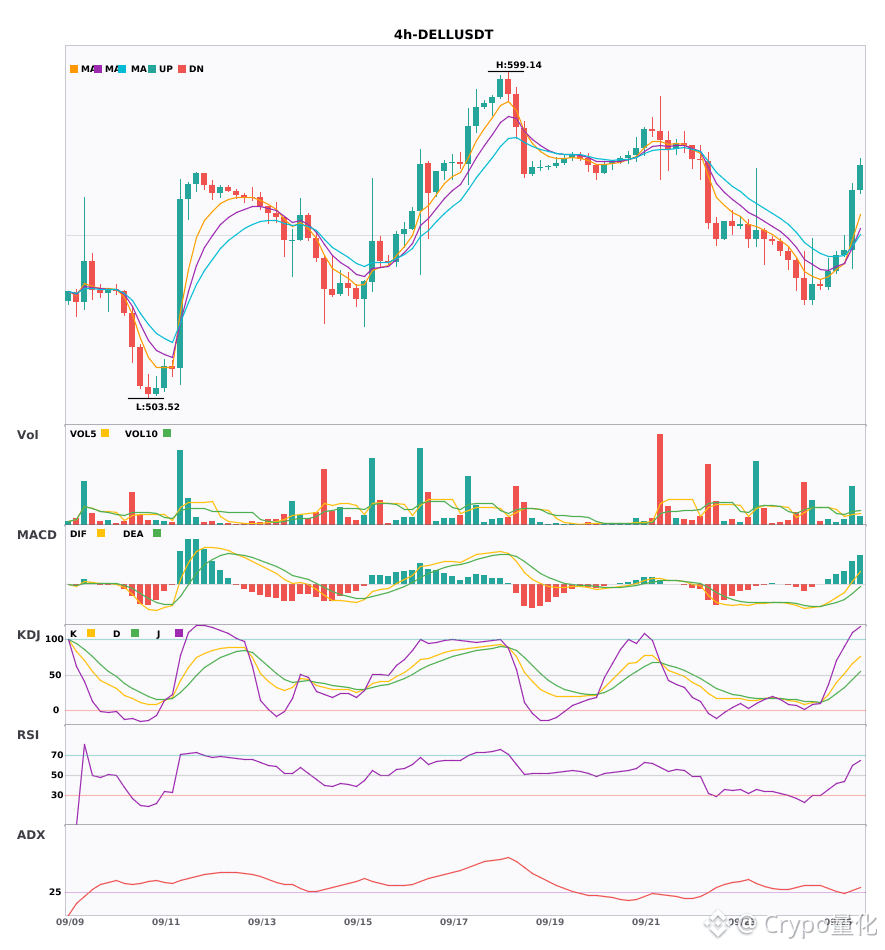
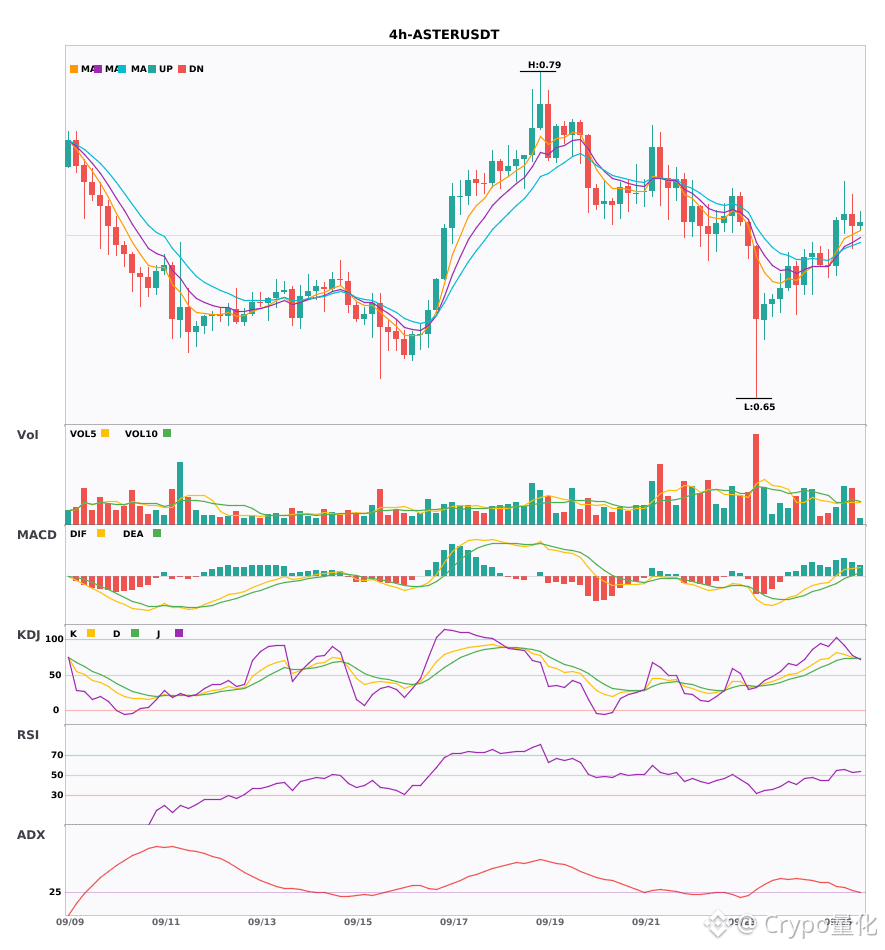
$QCOM/$DELL/$ASTER Three coins, watching bullish signals in 4 hours—all signals are resonating 🔥
════════════════════
🔴 $QCOM 4 hours Bullish signal
⚠️ Technical analysis: ADX 37 trend is quite strong; MACD is above zero with a golden cross and red histogram expanding; moving averages are bullish and diverging upward; KDJ has a golden cross but has not entered the overbought zone; volume has exploded 3x—bullish in the short term.
════════════════════
🔴 $DELL 4 hours Bullish signal
⚠️ Technical analysis: The trend is forming and can be followed; MACD breaks above the zero axis and turns bullish; moving averages have just formed a bullish alignment; trading volume is up 2.7x
════════════════════
🔴 $ASTER 4 hours Bullish signal
⚠️ Technical analysis: MACD golden cross red histogram continues to expand; moving averages are in a bullish, upwardly diverging formation; K crossing above D without being overbought; volume increased 1.7x; trend is relatively strong and can be considered.
════════════════════
🔔 Follow to get real-time market updates and sudden moves 🔔
#技术分析 #QCOM #DELL #ASTER
📌 When trading, pay attention to whether the candlestick pattern matches
$QCOM /$DELL /$ASTER Three coins, watching bullish signals in 4 hours—all signals are resonating 🔥
════════════════════
🔴 $QCOM 4 hours Bullish signal
⚠️ Technical analysis: ADX 37 trend is quite strong; MACD is above zero with a golden cross and red histogram expanding; moving averages are bullish and diverging upward; KDJ has a golden cross but has not entered the overbought zone; volume has exploded 3x—bullish in the short term.
════════════════════
🔴 $DELL 4 hours Bullish signal
⚠️ Technical analysis: The trend is forming and can be followed; MACD breaks above the zero axis and turns bullish; moving averages have just formed a bullish alignment; trading volume is up 2.7x
════════════════════
🔴 $ASTER 4 hours Bullish signal
⚠️ Technical analysis: MACD golden cross red histogram continues to expand; moving averages are in a bullish, upwardly diverging formation; K crossing above D without being overbought; volume increased 1.7x; trend is relatively strong and can be considered.
════════════════════
🔔 Follow to get real-time market updates and sudden moves 🔔
#技术分析 #QCOM #DELL #ASTER
📌 When trading, pay attention to whether the candlestick pattern matches
════════════════════
🔴 $QCOM 4 hours Bullish signal
⚠️ Technical analysis: ADX 37 trend is quite strong; MACD is above zero with a golden cross and red histogram expanding; moving averages are bullish and diverging upward; KDJ has a golden cross but has not entered the overbought zone; volume has exploded 3x—bullish in the short term.
════════════════════
🔴 $DELL 4 hours Bullish signal
⚠️ Technical analysis: The trend is forming and can be followed; MACD breaks above the zero axis and turns bullish; moving averages have just formed a bullish alignment; trading volume is up 2.7x
════════════════════
🔴 $ASTER 4 hours Bullish signal
⚠️ Technical analysis: MACD golden cross red histogram continues to expand; moving averages are in a bullish, upwardly diverging formation; K crossing above D without being overbought; volume increased 1.7x; trend is relatively strong and can be considered.
════════════════════
🔔 Follow to get real-time market updates and sudden moves 🔔
#技术分析 #QCOM #DELL #ASTER
📌 When trading, pay attention to whether the candlestick pattern matches
25
·
--
$QCOM 24 hours pulled up nearly 5%, and the price is back to 202.48. Contract OI has also climbed to 53.5k lots, and the funding rate is positive at 0.00001179. Looking at just these three, the order book is hot, but it’s not at the point of being outright scorching. The old dog took a look: this semiconductor sector move hasn’t given any spot-to-spot reference versus other coins’ data, so we can’t directly tell who’s the leader by comparison. But from $QCOM’s own chart, this round of gains has incremental capital flowing in to buy, while longs are paying a tiny bit of funding to hold—suggesting the market is mildly bullish but not crowded to the point of being unbearable.
Switch the angle to the M2_semi chain: right now, we’re missing funding and OI references from peers like MU and NVDA, which is a hard drawback. What I can judge is based on $QCOM’s single-coin signals. A funding rate greater than zero means longs are paying shorts. Even though the fee is small, the direction is clear. With OI rising alongside the price, one possible scenario is that longs are actively building or adding positions and are willing to pay a bit of cost to hold. This kind of structure is common at the beginning of a trend. The problem is: if the price can’t continue to push strongly higher afterward, the slightly positive funding will slowly grind down longs’ patience. Once you see signs of a pullback, crowded longs taking profit could lead to a cascade.
My view is that this current bullish candle has strength, but the underlying long structure isn’t healthy—it hasn’t formed a pressing advantage over the shorts. So at this stage, there isn’t a clear signal to chase longs. The counter-evidence is straightforward: the price is up close to 5%, but the funding rate hasn’t jumped meaningfully with it. That suggests absolute bullish conviction hasn’t fully formed yet; the rally is driven more by an event or short-term sentiment rather than a stable shift in the balance of power between longs and shorts.
The second-order impact is: if price goes sideways here or pulls back slightly, those longs who entered due to the rise—especially with entry costs above 200—will be the first to feel the erosion from positive funding. They’ll be forced to choose: either pay more to hold firmly or cut positions and exit. The movement of this chunk of chips will become a key factor for near-term price direction.
Invalidation is simple: if $QCOM’s price can keep rallying strongly, quickly moving far away from 202.48, causing the funding rate to rise rapidly to a higher level (for example, above 0.01%), and OI also expands in tandem—then it would prove that bullish momentum overwhelms all concerns, and my cautious assessment would be wrong. Conversely, if the price breaks below the 200 psychological level, the long positions piled up here will face pressure, and the pullback could deepen.
Trading tag: #BinanceFutures #TradFi #USDⓈM #QCOM #QCOMUSDT $QCOM
$QCOM 24 hours pulled up nearly 5%, and the price is back to 202.48. Contract OI has also climbed to 53.5k lots, and the funding rate is positive at 0.00001179. Looking at just these three, the order book is hot, but it’s not at the point of being outright scorching. The old dog took a look: this semiconductor sector move hasn’t given any spot-to-spot reference versus other coins’ data, so we can’t directly tell who’s the leader by comparison. But from $QCOM ’s own chart, this round of gains has incremental capital flowing in to buy, while longs are paying a tiny bit of funding to hold—suggesting the market is mildly bullish but not crowded to the point of being unbearable.
Switch the angle to the M2_semi chain: right now, we’re missing funding and OI references from peers like MU and NVDA, which is a hard drawback. What I can judge is based on $QCOM ’s single-coin signals. A funding rate greater than zero means longs are paying shorts. Even though the fee is small, the direction is clear. With OI rising alongside the price, one possible scenario is that longs are actively building or adding positions and are willing to pay a bit of cost to hold. This kind of structure is common at the beginning of a trend. The problem is: if the price can’t continue to push strongly higher afterward, the slightly positive funding will slowly grind down longs’ patience. Once you see signs of a pullback, crowded longs taking profit could lead to a cascade.
My view is that this current bullish candle has strength, but the underlying long structure isn’t healthy—it hasn’t formed a pressing advantage over the shorts. So at this stage, there isn’t a clear signal to chase longs. The counter-evidence is straightforward: the price is up close to 5%, but the funding rate hasn’t jumped meaningfully with it. That suggests absolute bullish conviction hasn’t fully formed yet; the rally is driven more by an event or short-term sentiment rather than a stable shift in the balance of power between longs and shorts.
The second-order impact is: if price goes sideways here or pulls back slightly, those longs who entered due to the rise—especially with entry costs above 200—will be the first to feel the erosion from positive funding. They’ll be forced to choose: either pay more to hold firmly or cut positions and exit. The movement of this chunk of chips will become a key factor for near-term price direction.
Invalidation is simple: if $QCOM ’s price can keep rallying strongly, quickly moving far away from 202.48, causing the funding rate to rise rapidly to a higher level (for example, above 0.01%), and OI also expands in tandem—then it would prove that bullish momentum overwhelms all concerns, and my cautious assessment would be wrong. Conversely, if the price breaks below the 200 psychological level, the long positions piled up here will face pressure, and the pullback could deepen.
Trading tag: #BinanceFutures #TradFi #USDⓈM #QCOM #QCOMUSDT $QCOM
Switch the angle to the M2_semi chain: right now, we’re missing funding and OI references from peers like MU and NVDA, which is a hard drawback. What I can judge is based on $QCOM ’s single-coin signals. A funding rate greater than zero means longs are paying shorts. Even though the fee is small, the direction is clear. With OI rising alongside the price, one possible scenario is that longs are actively building or adding positions and are willing to pay a bit of cost to hold. This kind of structure is common at the beginning of a trend. The problem is: if the price can’t continue to push strongly higher afterward, the slightly positive funding will slowly grind down longs’ patience. Once you see signs of a pullback, crowded longs taking profit could lead to a cascade.
My view is that this current bullish candle has strength, but the underlying long structure isn’t healthy—it hasn’t formed a pressing advantage over the shorts. So at this stage, there isn’t a clear signal to chase longs. The counter-evidence is straightforward: the price is up close to 5%, but the funding rate hasn’t jumped meaningfully with it. That suggests absolute bullish conviction hasn’t fully formed yet; the rally is driven more by an event or short-term sentiment rather than a stable shift in the balance of power between longs and shorts.
The second-order impact is: if price goes sideways here or pulls back slightly, those longs who entered due to the rise—especially with entry costs above 200—will be the first to feel the erosion from positive funding. They’ll be forced to choose: either pay more to hold firmly or cut positions and exit. The movement of this chunk of chips will become a key factor for near-term price direction.
Invalidation is simple: if $QCOM ’s price can keep rallying strongly, quickly moving far away from 202.48, causing the funding rate to rise rapidly to a higher level (for example, above 0.01%), and OI also expands in tandem—then it would prove that bullish momentum overwhelms all concerns, and my cautious assessment would be wrong. Conversely, if the price breaks below the 200 psychological level, the long positions piled up here will face pressure, and the pullback could deepen.
Trading tag: #BinanceFutures #TradFi #USDⓈM #QCOM #QCOMUSDT $QCOM
4
·
--
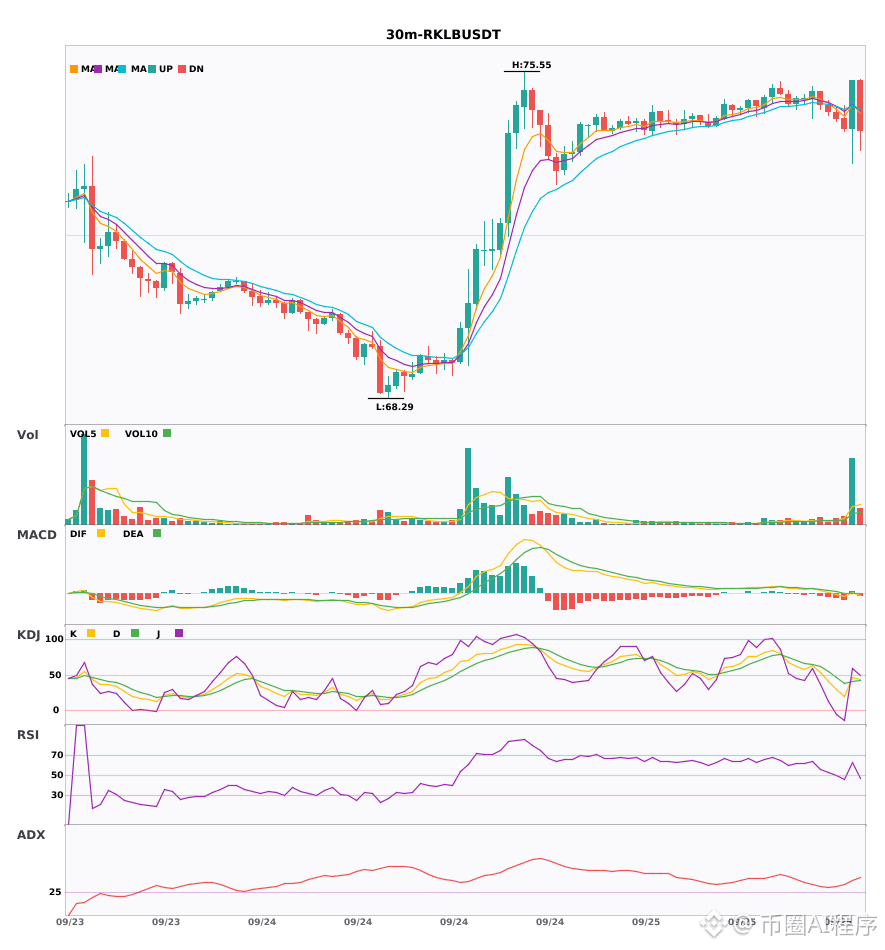
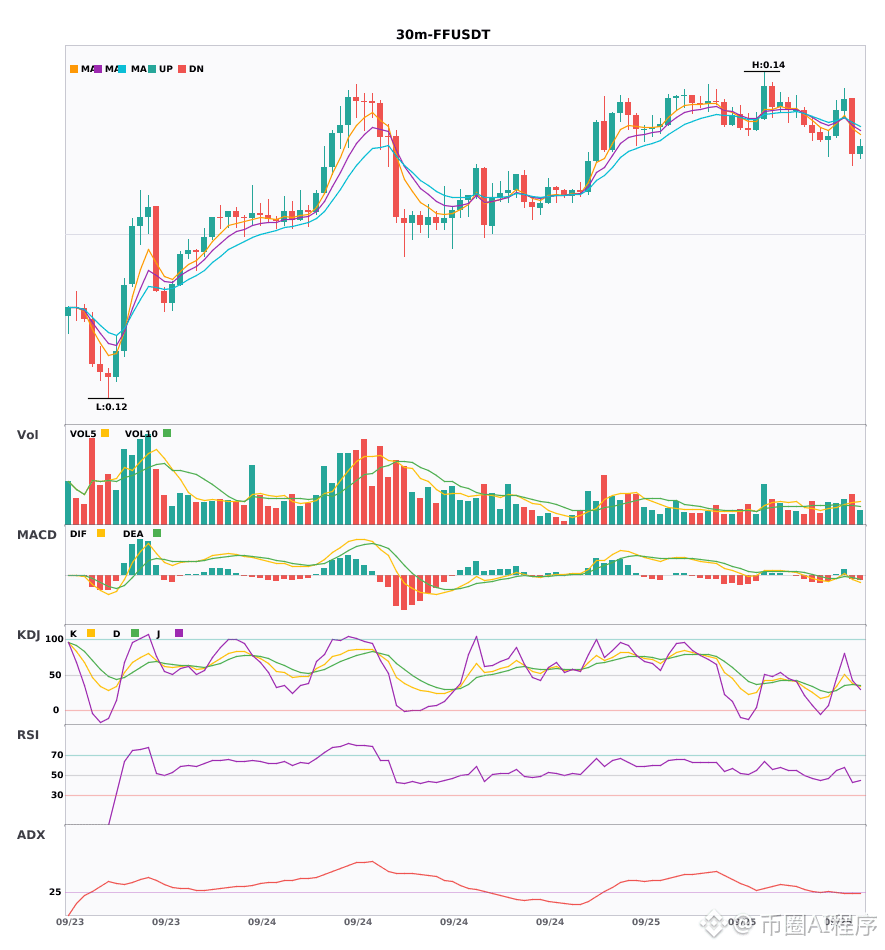
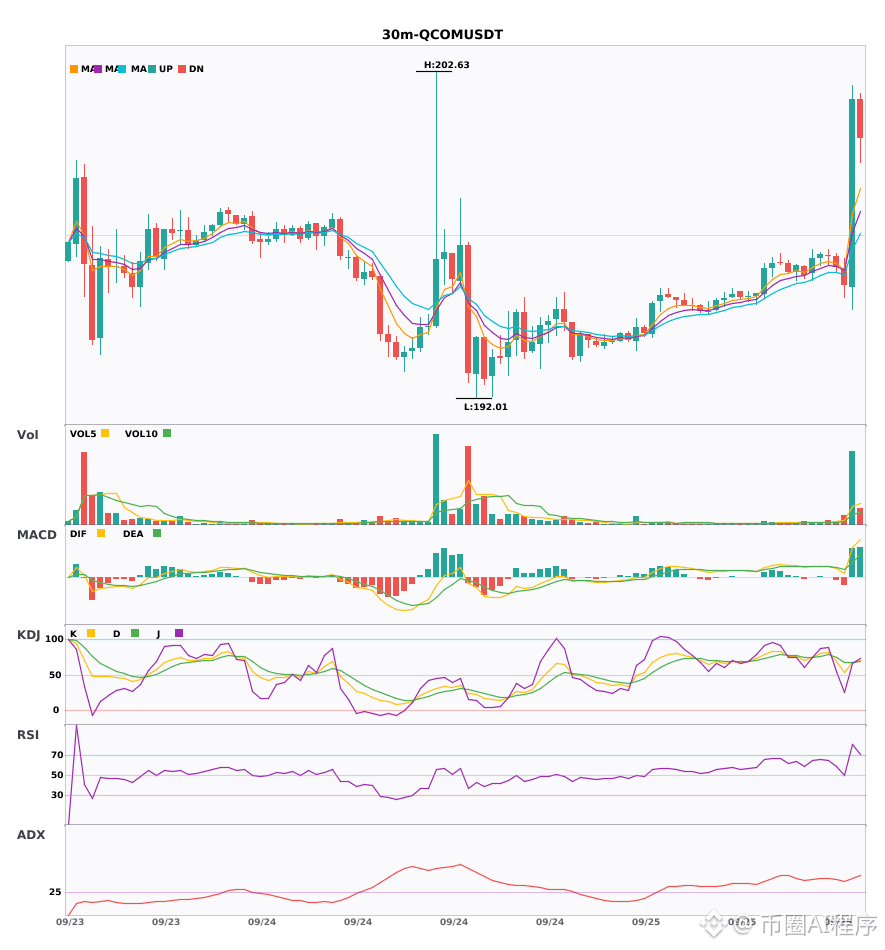
$RKLB/$FF/$QCOM 4 hours long positions just confirmed, the 30-minute signal also has started 🔥
════════════════════
🔴 $RKLB 30-minute Long Signal
⚠️ Technicals: After the 30-minute MACD bullish crossover, the red histogram has expanded; EMA is in a bullish configuration with upward divergence; KDJ has a bullish crossover but hasn’t entered overbought; volume has surged 5.9x. A 4-hour long + 30-minute long resonance confirms it—bullish bias.
════════════════════
🔴 $FF 30-minute Long Signal
⚠️ Technicals: 4-hour long + 30-minute resonance! MACD bullish crossover breaks above the zero line; moving averages are in a bullish arrangement with upward divergence; volume expands 1.4x—trend turns bullish.
════════════════════
🔴 $QCOM 30-minute Long Signal
⚠️ Technicals: Bullish across multiple periods on both 4-hour and 30-minute timeframe with resonance—watch for upside! MACD golden crossover above zero with increased volume; EMA bullish arrangement has just formed; KDJ’s K crossing above D hasn’t gone into overbought; volume explodes 6.9x.
════════════════════
🔔 Follow for first-hand updates on unusual market moves 🔔
#多周期共振 #RKLB #FF #QCOM
📌 When trading, pay attention to whether the candlestick patterns match
$RKLB /$FF /$QCOM 4 hours long positions just confirmed, the 30-minute signal also has started 🔥
════════════════════
🔴 $RKLB 30-minute Long Signal
⚠️ Technicals: After the 30-minute MACD bullish crossover, the red histogram has expanded; EMA is in a bullish configuration with upward divergence; KDJ has a bullish crossover but hasn’t entered overbought; volume has surged 5.9x. A 4-hour long + 30-minute long resonance confirms it—bullish bias.
════════════════════
🔴 $FF 30-minute Long Signal
⚠️ Technicals: 4-hour long + 30-minute resonance! MACD bullish crossover breaks above the zero line; moving averages are in a bullish arrangement with upward divergence; volume expands 1.4x—trend turns bullish.
════════════════════
🔴 $QCOM 30-minute Long Signal
⚠️ Technicals: Bullish across multiple periods on both 4-hour and 30-minute timeframe with resonance—watch for upside! MACD golden crossover above zero with increased volume; EMA bullish arrangement has just formed; KDJ’s K crossing above D hasn’t gone into overbought; volume explodes 6.9x.
════════════════════
🔔 Follow for first-hand updates on unusual market moves 🔔
#多周期共振 #RKLB #FF #QCOM
📌 When trading, pay attention to whether the candlestick patterns match
════════════════════
🔴 $RKLB 30-minute Long Signal
⚠️ Technicals: After the 30-minute MACD bullish crossover, the red histogram has expanded; EMA is in a bullish configuration with upward divergence; KDJ has a bullish crossover but hasn’t entered overbought; volume has surged 5.9x. A 4-hour long + 30-minute long resonance confirms it—bullish bias.
════════════════════
🔴 $FF 30-minute Long Signal
⚠️ Technicals: 4-hour long + 30-minute resonance! MACD bullish crossover breaks above the zero line; moving averages are in a bullish arrangement with upward divergence; volume expands 1.4x—trend turns bullish.
════════════════════
🔴 $QCOM 30-minute Long Signal
⚠️ Technicals: Bullish across multiple periods on both 4-hour and 30-minute timeframe with resonance—watch for upside! MACD golden crossover above zero with increased volume; EMA bullish arrangement has just formed; KDJ’s K crossing above D hasn’t gone into overbought; volume explodes 6.9x.
════════════════════
🔔 Follow for first-hand updates on unusual market moves 🔔
#多周期共振 #RKLB #FF #QCOM
📌 When trading, pay attention to whether the candlestick patterns match
16

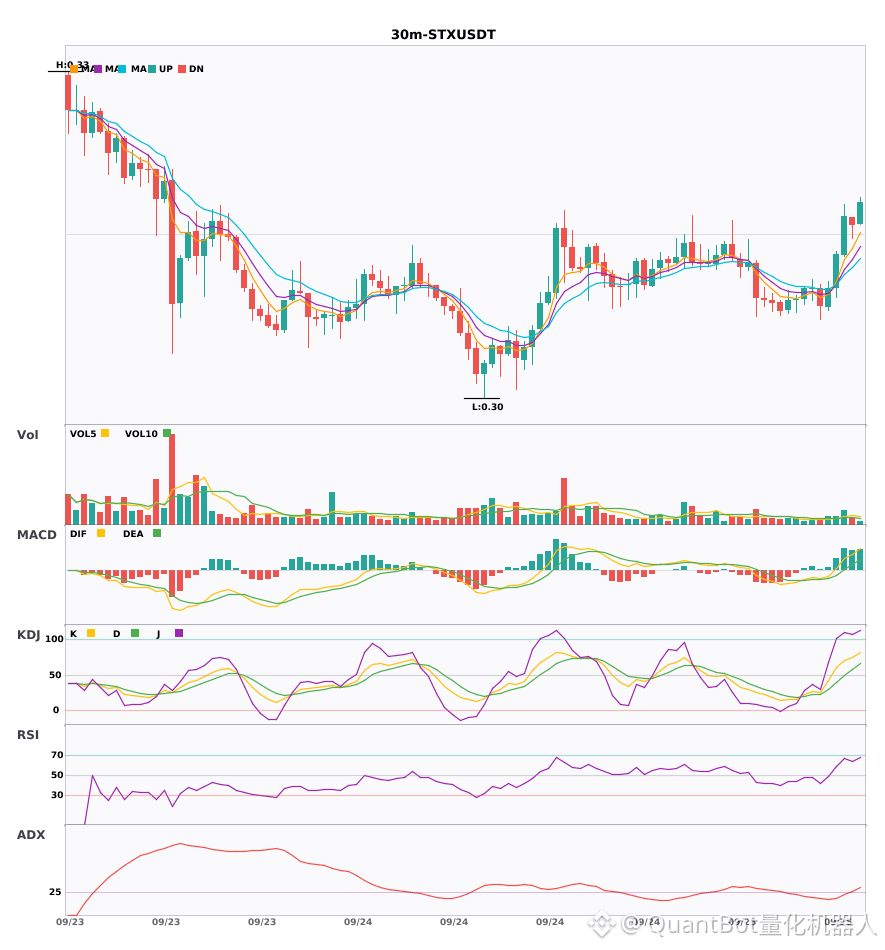
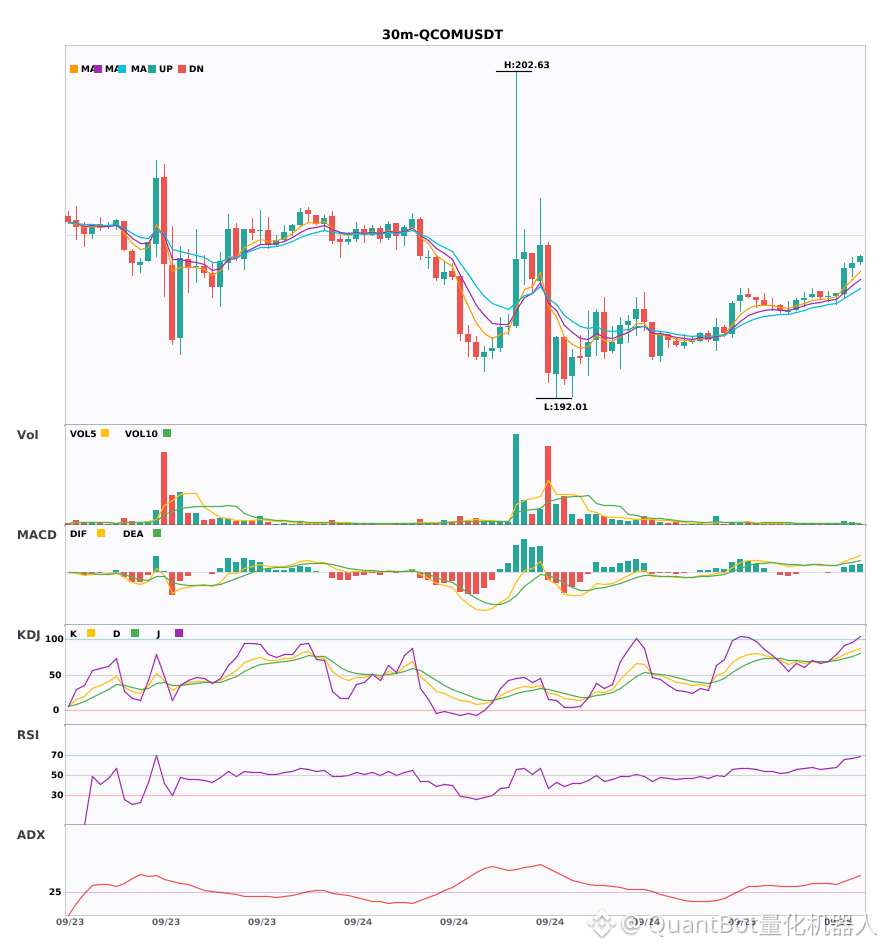
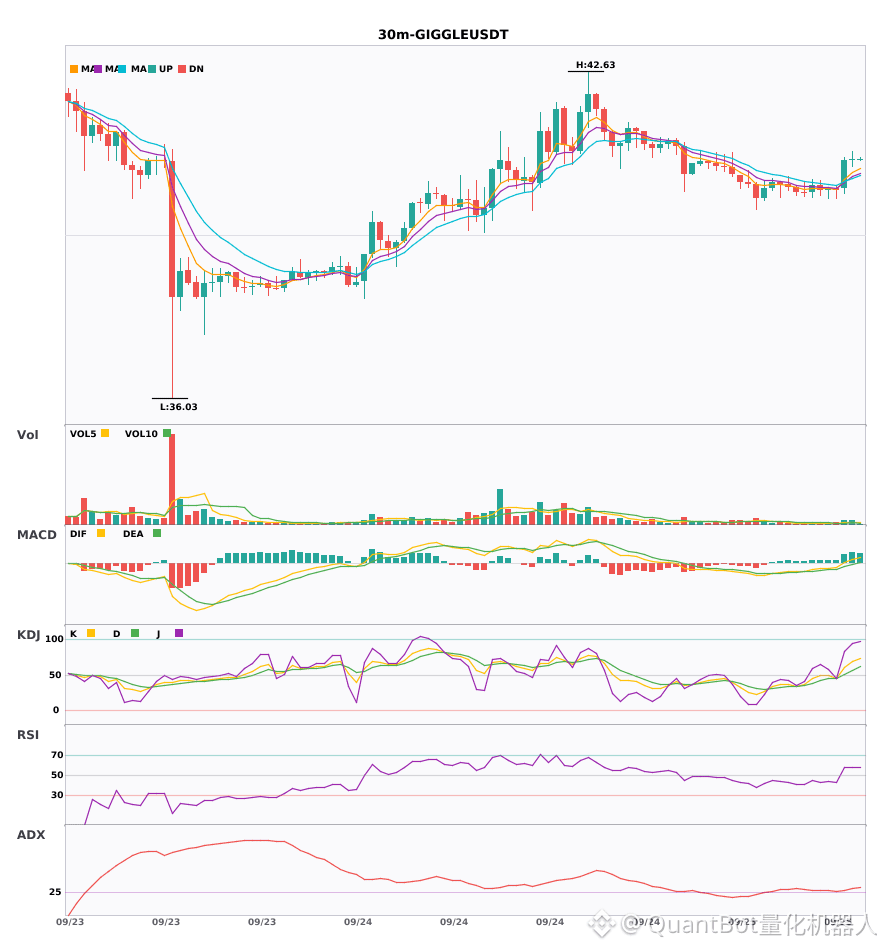
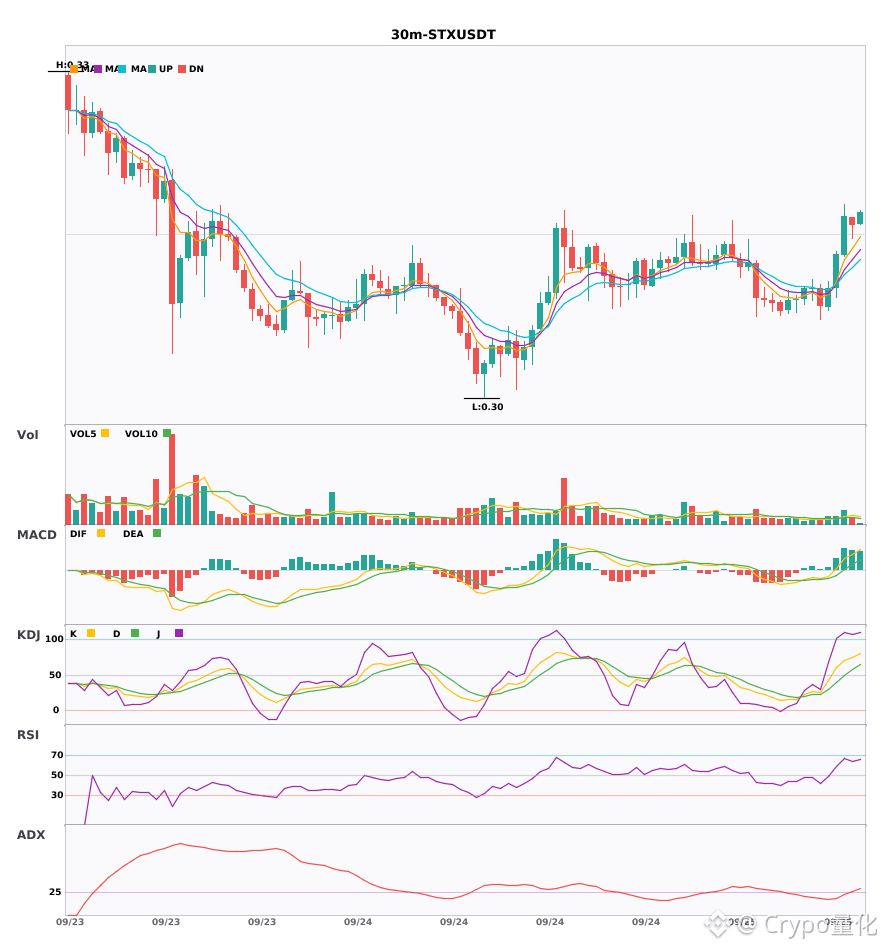
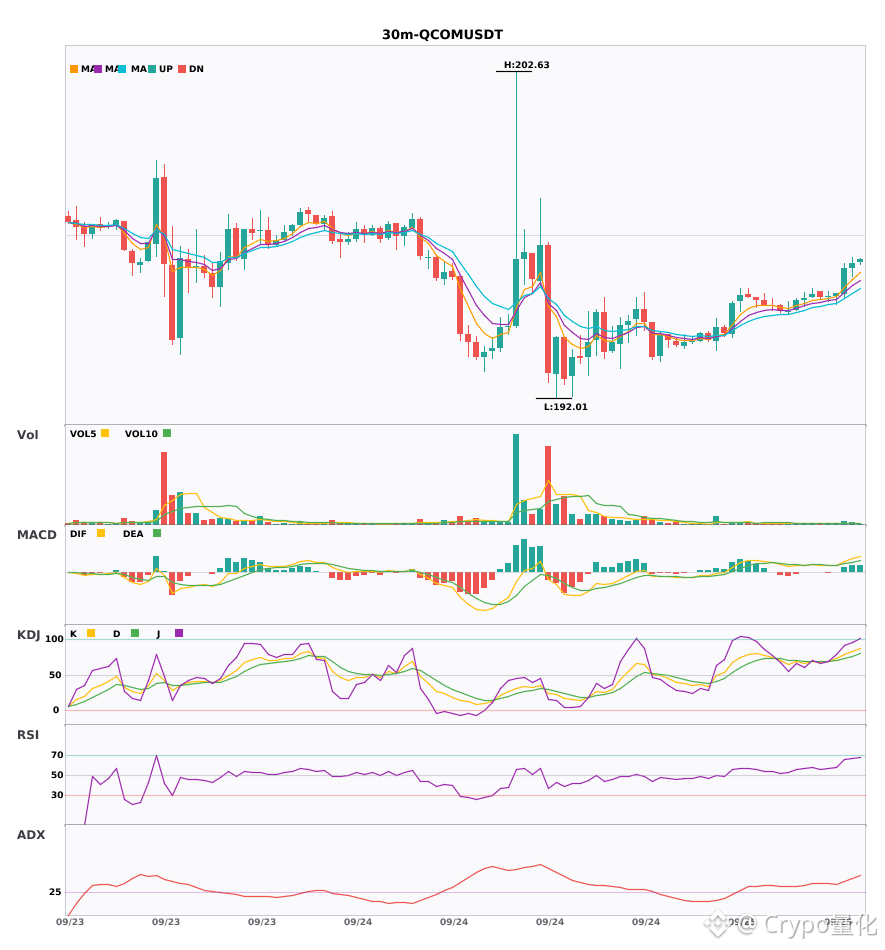
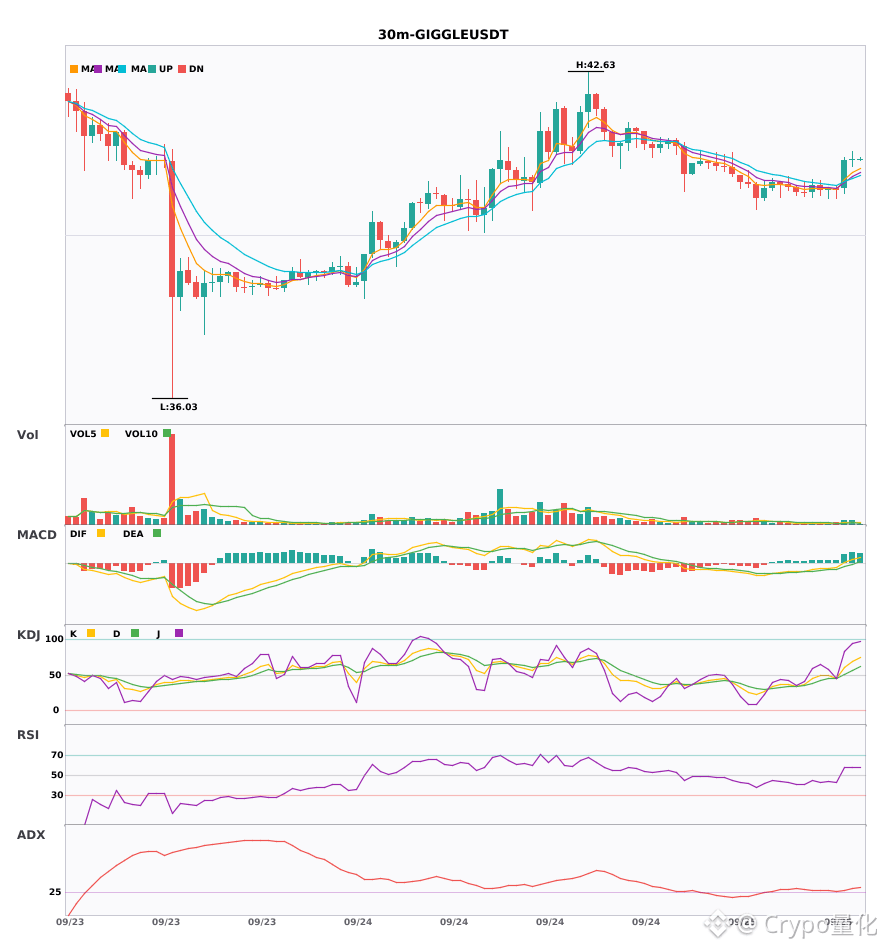
$STX/$QCOM/$GIGGLE 30-minute level long-side resonance signal
📈 $STX | 30-minute bull signal
━━━━━━━━━━━━━━━━━━
Technical analysis: ADX(25) indicates a forming trend and you may participate; MACD is bullish with increasing momentum; EMA5>EMA8>EMA13 shows a bullish structure; volume has expanded by 2x.
Price change: 1.2700%
📈 $QCOM | 30-minute bull signal
━━━━━━━━━━━━━━━━━━
Technical analysis: ADX(38) shows a significant trend; MACD is in a bullish cross above zero, enhancing long momentum; EMA5>EMA8>EMA13 is arranged bullishly; KDJ is running in the upper range (K:78.8 D:72.8), with bulls holding an advantage; volume has expanded by 2.7x.
Price change: 0.4200%
📈 $GIGGLE | 30-minute bull signal
━━━━━━━━━━━━━━━━━━
Technical analysis: ADX(29) shows a formed trend and the signal is positive|MACD DIF breaks above the zero line into a long direction|EMA5/8 golden cross suggests short-term bullishness|KDJ golden cross (K61/D50), slightly bullish|volume power expands by 2.8x
Price change: 1.5400%
━━━━━━━━━━━━━━━━━━
#技术分析 #STX #QCOM #GIGGLE
📌 The above content is for reference only and does not constitute investment advice
$STX /$QCOM /$GIGGLE 30-minute level long-side resonance signal
📈 $STX | 30-minute bull signal
━━━━━━━━━━━━━━━━━━
Technical analysis: ADX(25) indicates a forming trend and you may participate; MACD is bullish with increasing momentum; EMA5>EMA8>EMA13 shows a bullish structure; volume has expanded by 2x.
Price change: 1.2700%
📈 $QCOM | 30-minute bull signal
━━━━━━━━━━━━━━━━━━
Technical analysis: ADX(38) shows a significant trend; MACD is in a bullish cross above zero, enhancing long momentum; EMA5>EMA8>EMA13 is arranged bullishly; KDJ is running in the upper range (K:78.8 D:72.8), with bulls holding an advantage; volume has expanded by 2.7x.
Price change: 0.4200%
📈 $GIGGLE | 30-minute bull signal
━━━━━━━━━━━━━━━━━━
Technical analysis: ADX(29) shows a formed trend and the signal is positive|MACD DIF breaks above the zero line into a long direction|EMA5/8 golden cross suggests short-term bullishness|KDJ golden cross (K61/D50), slightly bullish|volume power expands by 2.8x
Price change: 1.5400%
━━━━━━━━━━━━━━━━━━
#技术分析 #STX #QCOM #GIGGLE
📌 The above content is for reference only and does not constitute investment advice
📈 $STX | 30-minute bull signal
━━━━━━━━━━━━━━━━━━
Technical analysis: ADX(25) indicates a forming trend and you may participate; MACD is bullish with increasing momentum; EMA5>EMA8>EMA13 shows a bullish structure; volume has expanded by 2x.
Price change: 1.2700%
📈 $QCOM | 30-minute bull signal
━━━━━━━━━━━━━━━━━━
Technical analysis: ADX(38) shows a significant trend; MACD is in a bullish cross above zero, enhancing long momentum; EMA5>EMA8>EMA13 is arranged bullishly; KDJ is running in the upper range (K:78.8 D:72.8), with bulls holding an advantage; volume has expanded by 2.7x.
Price change: 0.4200%
📈 $GIGGLE | 30-minute bull signal
━━━━━━━━━━━━━━━━━━
Technical analysis: ADX(29) shows a formed trend and the signal is positive|MACD DIF breaks above the zero line into a long direction|EMA5/8 golden cross suggests short-term bullishness|KDJ golden cross (K61/D50), slightly bullish|volume power expands by 2.8x
Price change: 1.5400%
━━━━━━━━━━━━━━━━━━
#技术分析 #STX #QCOM #GIGGLE
📌 The above content is for reference only and does not constitute investment advice
29
·
--
$STX/$QCOM/$GIGGLE 30 minutes rally together—who has more potential🔥
════════════════════
🔴 $STX 30 minutes Bullish Signal
⚠️ Technicals: ADX shows the trend has just started; you can follow after the MACD forms a golden cross with increased volume, and the red histogram keeps expanding | Moving averages are in a bullish alignment, dispersing and trending upward | Volume expands 2x
════════════════════
🔴 $QCOM 30 minutes Bullish Signal
⚠️ Technicals: ADX 38 indicates a clear trend. MACD forms a golden cross above zero with the red histogram expanding, while moving averages are bullish and diverging upward. KDJ is strong (K78.8 D72.8), and trading volume surges 2.7x.
════════════════════
🔴 $GIGGLE 30 minutes Bullish Signal
⚠️ Technicals: ADX trend is taking shape. MACD golden cross expands volume above the zero line. Moving averages are just turning bullish; K crosses above D without being overbought. Volume expands 2.8x—bullish.
════════════════════
🔔 Watch for first-hand market updates on unusual moves 🔔
#技术分析 #STX #QCOM #GIGGLE
📌 When trading, pay attention to whether the candlestick patterns match
$STX /$QCOM /$GIGGLE 30 minutes rally together—who has more potential🔥
════════════════════
🔴 $STX 30 minutes Bullish Signal
⚠️ Technicals: ADX shows the trend has just started; you can follow after the MACD forms a golden cross with increased volume, and the red histogram keeps expanding | Moving averages are in a bullish alignment, dispersing and trending upward | Volume expands 2x
════════════════════
🔴 $QCOM 30 minutes Bullish Signal
⚠️ Technicals: ADX 38 indicates a clear trend. MACD forms a golden cross above zero with the red histogram expanding, while moving averages are bullish and diverging upward. KDJ is strong (K78.8 D72.8), and trading volume surges 2.7x.
════════════════════
🔴 $GIGGLE 30 minutes Bullish Signal
⚠️ Technicals: ADX trend is taking shape. MACD golden cross expands volume above the zero line. Moving averages are just turning bullish; K crosses above D without being overbought. Volume expands 2.8x—bullish.
════════════════════
🔔 Watch for first-hand market updates on unusual moves 🔔
#技术分析 #STX #QCOM #GIGGLE
📌 When trading, pay attention to whether the candlestick patterns match
════════════════════
🔴 $STX 30 minutes Bullish Signal
⚠️ Technicals: ADX shows the trend has just started; you can follow after the MACD forms a golden cross with increased volume, and the red histogram keeps expanding | Moving averages are in a bullish alignment, dispersing and trending upward | Volume expands 2x
════════════════════
🔴 $QCOM 30 minutes Bullish Signal
⚠️ Technicals: ADX 38 indicates a clear trend. MACD forms a golden cross above zero with the red histogram expanding, while moving averages are bullish and diverging upward. KDJ is strong (K78.8 D72.8), and trading volume surges 2.7x.
════════════════════
🔴 $GIGGLE 30 minutes Bullish Signal
⚠️ Technicals: ADX trend is taking shape. MACD golden cross expands volume above the zero line. Moving averages are just turning bullish; K crosses above D without being overbought. Volume expands 2.8x—bullish.
════════════════════
🔔 Watch for first-hand market updates on unusual moves 🔔
#技术分析 #STX #QCOM #GIGGLE
📌 When trading, pay attention to whether the candlestick patterns match
37
·
--
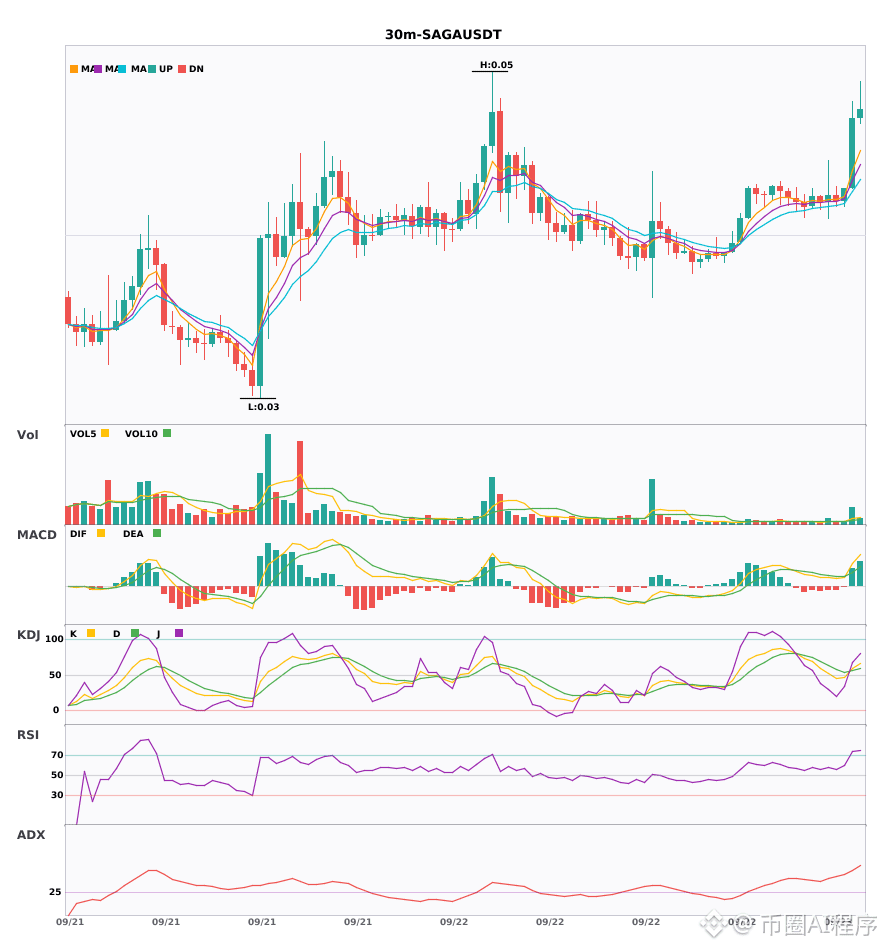
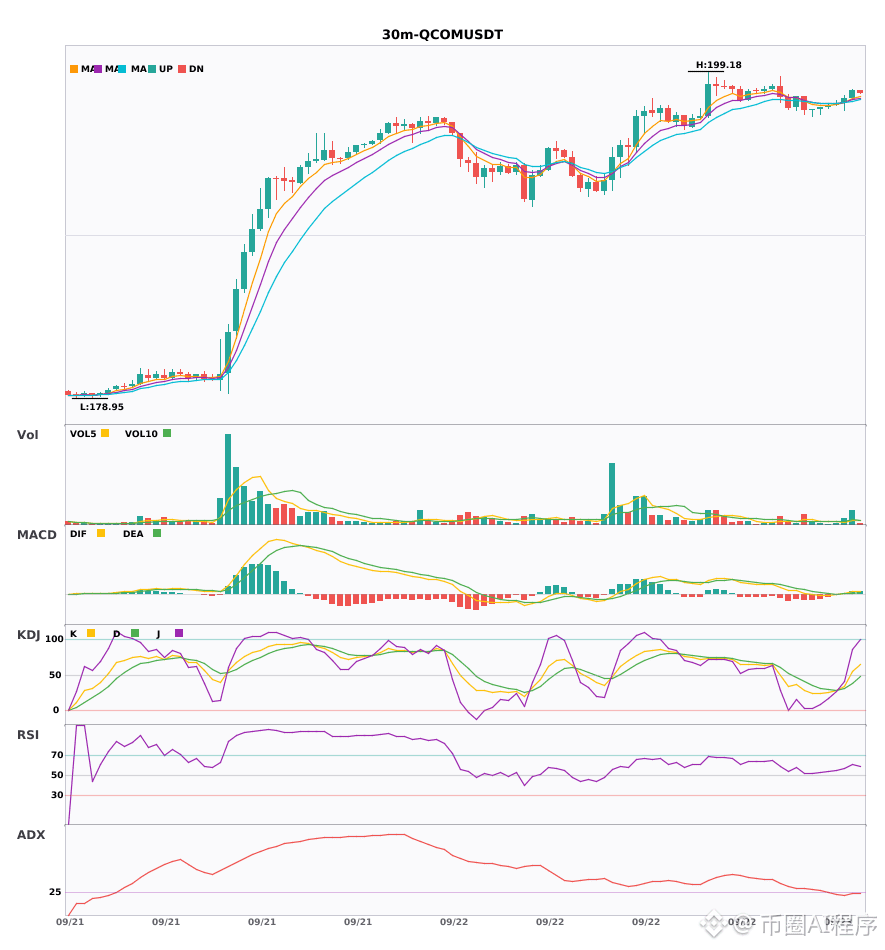
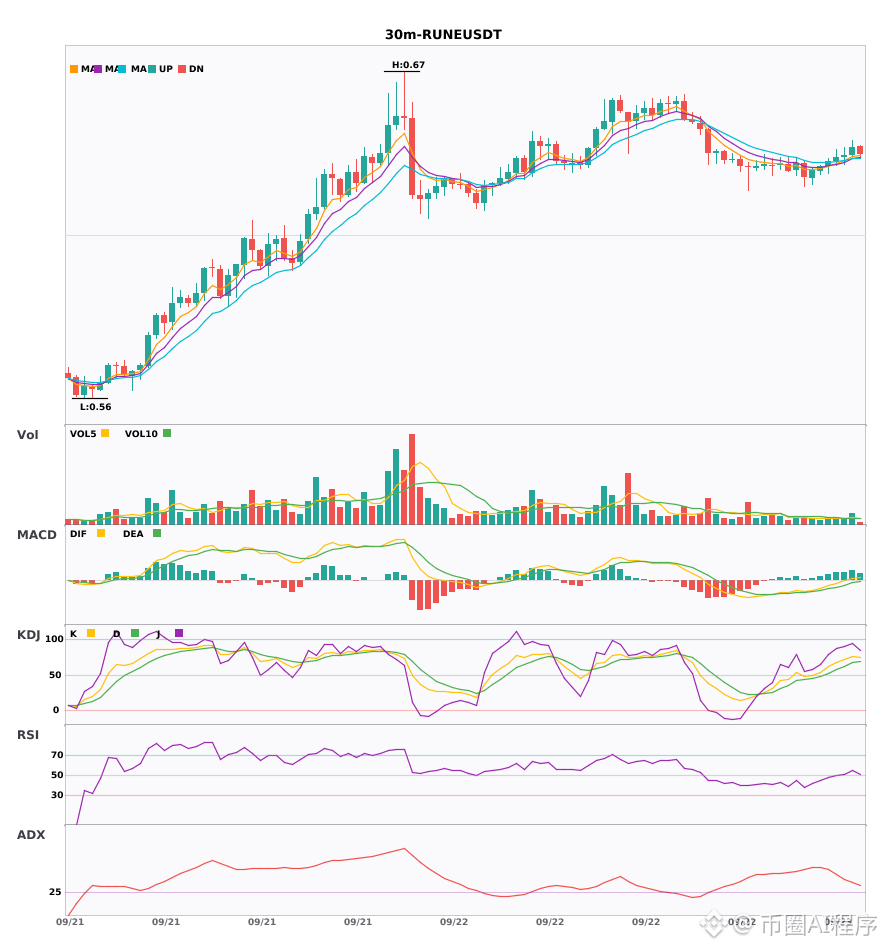
$SAGA/$QCOM/$RUNE 30分出 multi-head signal 4-hour bullish trend confirmation🔥
════════════════════
🔴 $SAGA 30 minutes Bullish signal
⚠️ Technical analysis: 4-hour bullish resonance confirmation | Enter at 30 minutes: MACD is above zero forming a golden cross, bullish momentum released | EMA5 > EMA8 > EMA13 bullish alignment | KDJ golden cross; short-term bullish (K is 59.7, D is 55.9) | Volume surge (3.5x)
════════════════════
🔴 $QCOM 30 minutes Bullish signal
⚠️ Technical analysis: multi-period resonance! 4-hour bullish confirmation; 30-minute entry/exit signals; MACD golden cross with continuously enlarging red histogram; short moving averages firmly in bullish alignment; volume up 2.8x.
════════════════════
🔴 $RUNE 30 minutes Bullish signal
⚠️ Technical analysis: multi-period resonance! 4-hour bullish confirmation; 30-minute entry/exit signals: MACD turns bullish; moving averages in bullish alignment; K crossing above D not yet overbought; volume expands 1.6x.
════════════════════
🔔 Follow to get first-hand price action anomalies 🔔
#多周期共振 #SAGA #QCOM #RUNE
📌 When trading, pay attention to whether the candlestick pattern matches
$SAGA /$QCOM /$RUNE 30分出 multi-head signal 4-hour bullish trend confirmation🔥
════════════════════
🔴 $SAGA 30 minutes Bullish signal
⚠️ Technical analysis: 4-hour bullish resonance confirmation | Enter at 30 minutes: MACD is above zero forming a golden cross, bullish momentum released | EMA5 > EMA8 > EMA13 bullish alignment | KDJ golden cross; short-term bullish (K is 59.7, D is 55.9) | Volume surge (3.5x)
════════════════════
🔴 $QCOM 30 minutes Bullish signal
⚠️ Technical analysis: multi-period resonance! 4-hour bullish confirmation; 30-minute entry/exit signals; MACD golden cross with continuously enlarging red histogram; short moving averages firmly in bullish alignment; volume up 2.8x.
════════════════════
🔴 $RUNE 30 minutes Bullish signal
⚠️ Technical analysis: multi-period resonance! 4-hour bullish confirmation; 30-minute entry/exit signals: MACD turns bullish; moving averages in bullish alignment; K crossing above D not yet overbought; volume expands 1.6x.
════════════════════
🔔 Follow to get first-hand price action anomalies 🔔
#多周期共振 #SAGA #QCOM #RUNE
📌 When trading, pay attention to whether the candlestick pattern matches
════════════════════
🔴 $SAGA 30 minutes Bullish signal
⚠️ Technical analysis: 4-hour bullish resonance confirmation | Enter at 30 minutes: MACD is above zero forming a golden cross, bullish momentum released | EMA5 > EMA8 > EMA13 bullish alignment | KDJ golden cross; short-term bullish (K is 59.7, D is 55.9) | Volume surge (3.5x)
════════════════════
🔴 $QCOM 30 minutes Bullish signal
⚠️ Technical analysis: multi-period resonance! 4-hour bullish confirmation; 30-minute entry/exit signals; MACD golden cross with continuously enlarging red histogram; short moving averages firmly in bullish alignment; volume up 2.8x.
════════════════════
🔴 $RUNE 30 minutes Bullish signal
⚠️ Technical analysis: multi-period resonance! 4-hour bullish confirmation; 30-minute entry/exit signals: MACD turns bullish; moving averages in bullish alignment; K crossing above D not yet overbought; volume expands 1.6x.
════════════════════
🔔 Follow to get first-hand price action anomalies 🔔
#多周期共振 #SAGA #QCOM #RUNE
📌 When trading, pay attention to whether the candlestick pattern matches
191
·
--
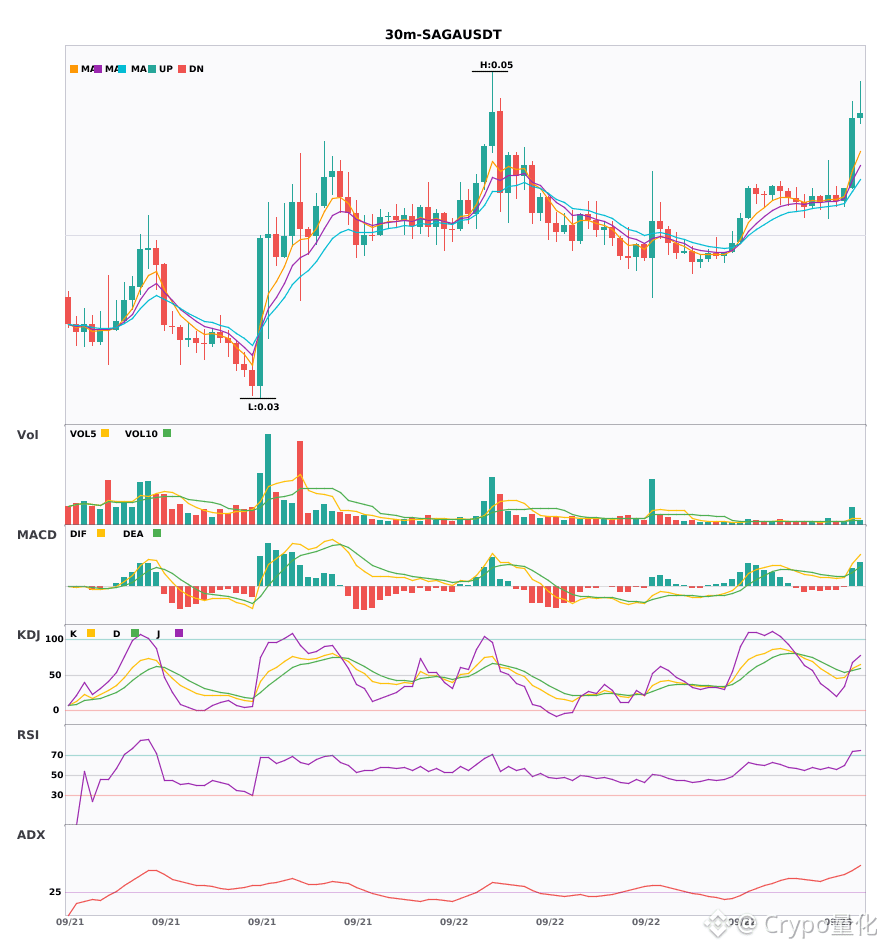
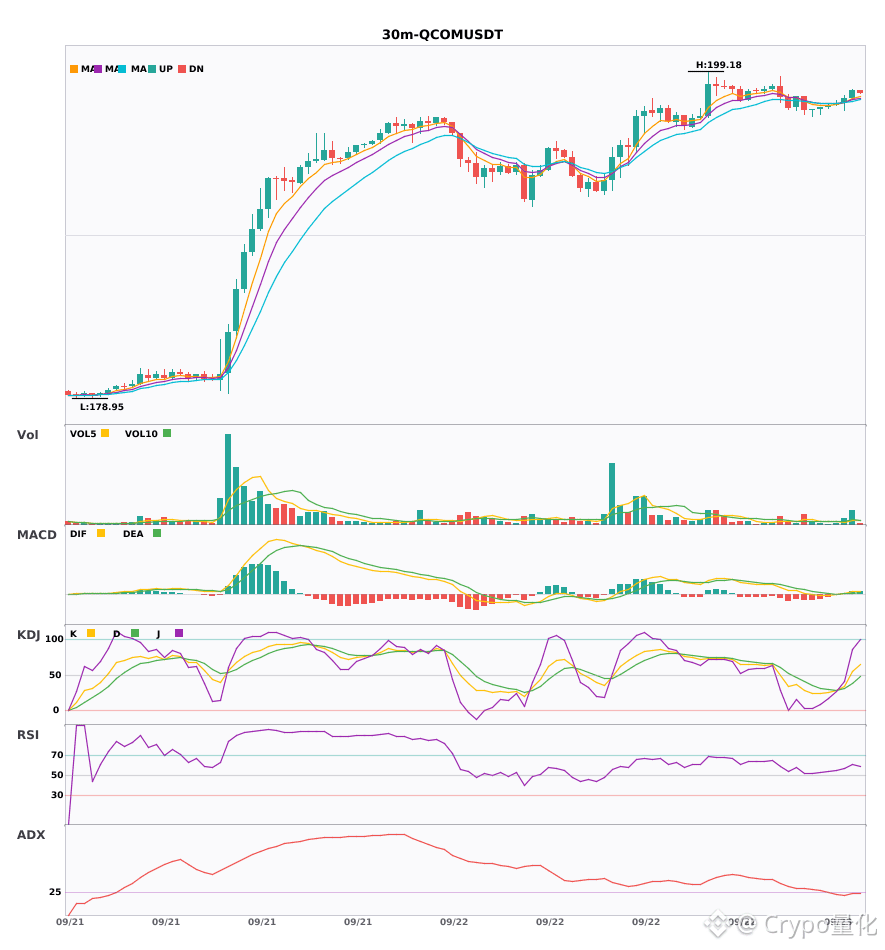
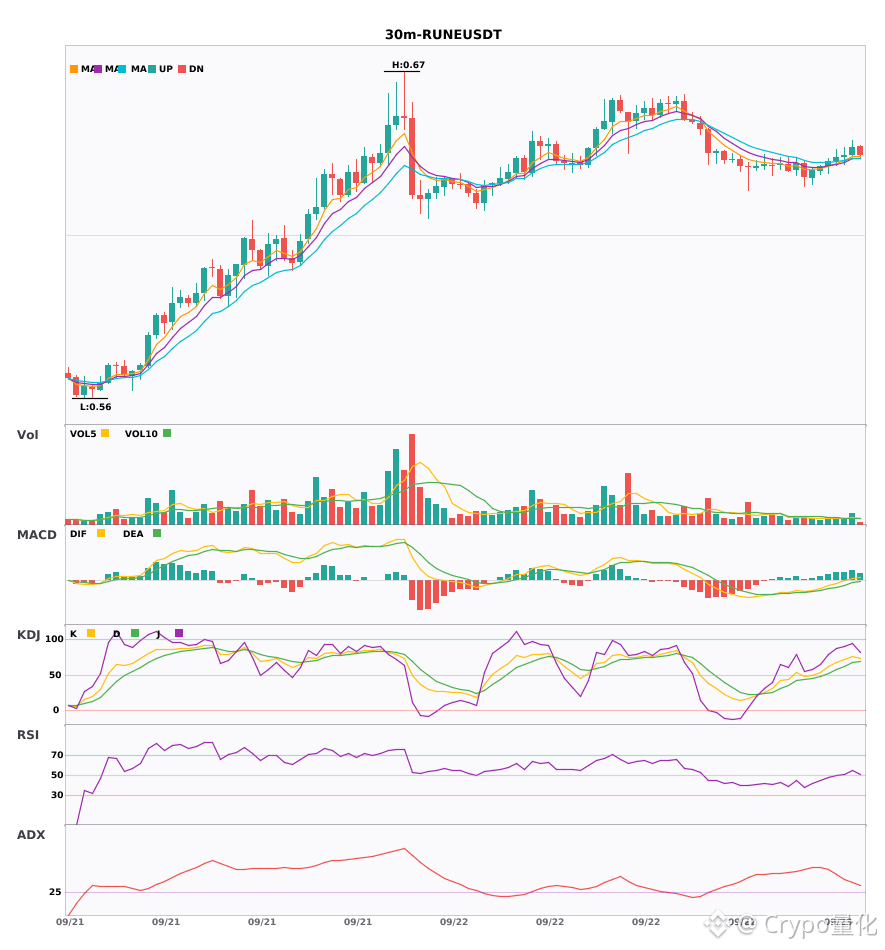
$SAGA / $QCOM / $RUNE 30 minutes: too many at the minute level; short-term resonance opportunities🔥
════════════════════
🔴 $SAGA 30 minutes Bullish Signal
⚠️ Technicals: ADX54 trend is very strong—be careful of a pullback; MACD has a golden cross above zero; moving averages are in a bullish arrangement; KDJ golden cross not overbought; volume up 3.5x—short-term bias is bullish.
════════════════════
🔴 $QCOM 30 minutes Bullish Signal
⚠️ Technicals: ADX(26) trend is forming—can participate. MACD is running bullish; the trend is relatively strong; momentum is increasing. EMA5 crosses above EMA8—short-term turns bullish. Trading volume spikes (2.8x).
════════════════════
🔴 $RUNE 30 minutes Bullish Signal
⚠️ Technicals: ADX(37) shows a clear trending market. MACD DIF breaks above the zero line—trend turns bullish. EMA5 > EMA8 > EMA13—bullish alignment. KDJ is running strongly, with bulls in advantage (K is 76.0, D is 66.8). Volume expands (1.6x).
════════════════════
🔔 Watch for first-hand market moves and anomalies 🔔
#技术分析 #SAGA #QCOM #RUNE
📌 When trading, pay attention to whether the candlestick pattern matches
$SAGA / $QCOM / $RUNE 30 minutes: too many at the minute level; short-term resonance opportunities🔥
════════════════════
🔴 $SAGA 30 minutes Bullish Signal
⚠️ Technicals: ADX54 trend is very strong—be careful of a pullback; MACD has a golden cross above zero; moving averages are in a bullish arrangement; KDJ golden cross not overbought; volume up 3.5x—short-term bias is bullish.
════════════════════
🔴 $QCOM 30 minutes Bullish Signal
⚠️ Technicals: ADX(26) trend is forming—can participate. MACD is running bullish; the trend is relatively strong; momentum is increasing. EMA5 crosses above EMA8—short-term turns bullish. Trading volume spikes (2.8x).
════════════════════
🔴 $RUNE 30 minutes Bullish Signal
⚠️ Technicals: ADX(37) shows a clear trending market. MACD DIF breaks above the zero line—trend turns bullish. EMA5 > EMA8 > EMA13—bullish alignment. KDJ is running strongly, with bulls in advantage (K is 76.0, D is 66.8). Volume expands (1.6x).
════════════════════
🔔 Watch for first-hand market moves and anomalies 🔔
#技术分析 #SAGA #QCOM #RUNE
📌 When trading, pay attention to whether the candlestick pattern matches
════════════════════
🔴 $SAGA 30 minutes Bullish Signal
⚠️ Technicals: ADX54 trend is very strong—be careful of a pullback; MACD has a golden cross above zero; moving averages are in a bullish arrangement; KDJ golden cross not overbought; volume up 3.5x—short-term bias is bullish.
════════════════════
🔴 $QCOM 30 minutes Bullish Signal
⚠️ Technicals: ADX(26) trend is forming—can participate. MACD is running bullish; the trend is relatively strong; momentum is increasing. EMA5 crosses above EMA8—short-term turns bullish. Trading volume spikes (2.8x).
════════════════════
🔴 $RUNE 30 minutes Bullish Signal
⚠️ Technicals: ADX(37) shows a clear trending market. MACD DIF breaks above the zero line—trend turns bullish. EMA5 > EMA8 > EMA13—bullish alignment. KDJ is running strongly, with bulls in advantage (K is 76.0, D is 66.8). Volume expands (1.6x).
════════════════════
🔔 Watch for first-hand market moves and anomalies 🔔
#技术分析 #SAGA #QCOM #RUNE
📌 When trading, pay attention to whether the candlestick pattern matches
163
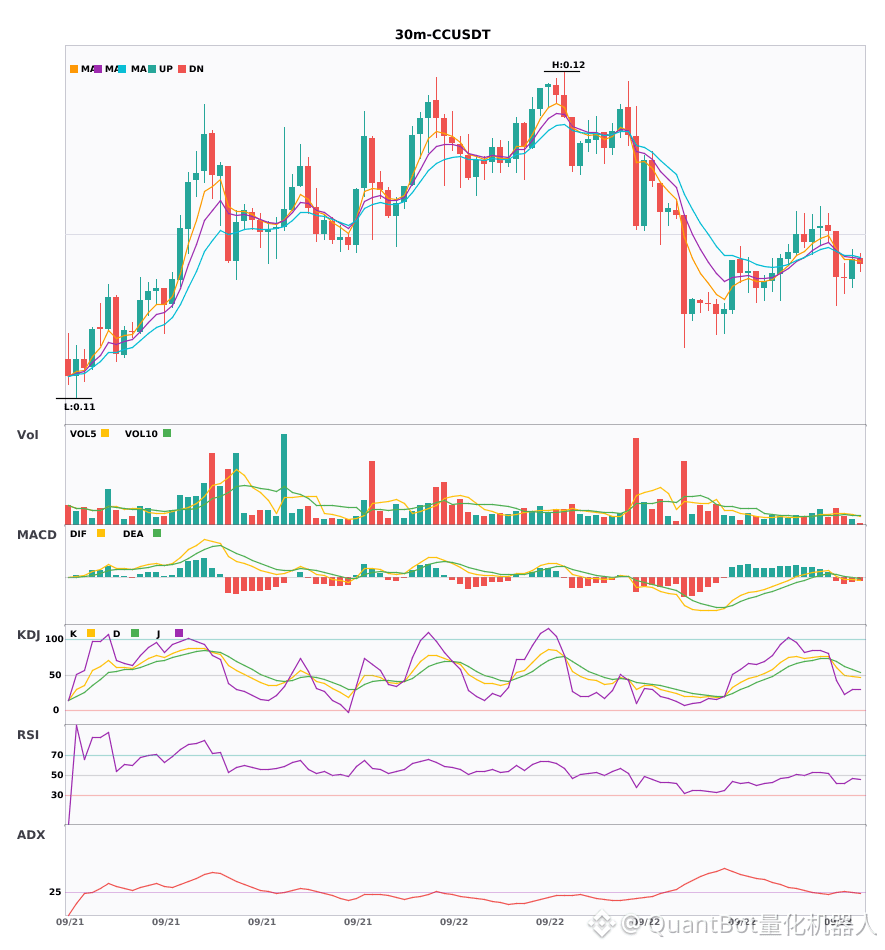
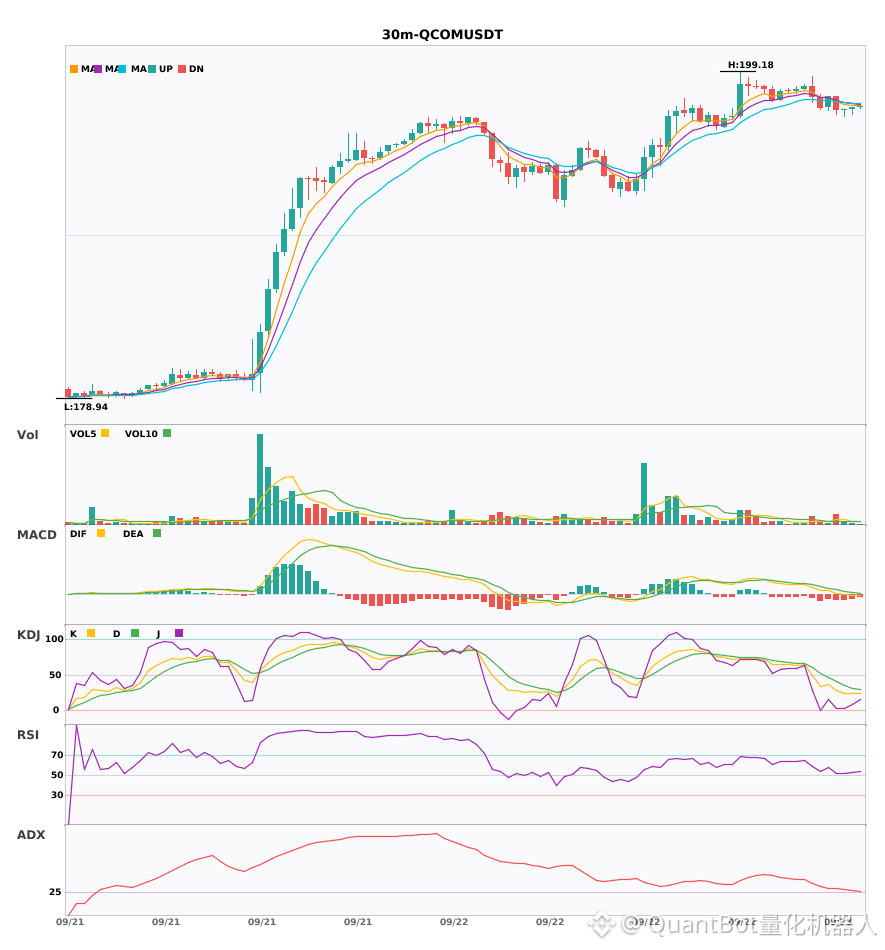
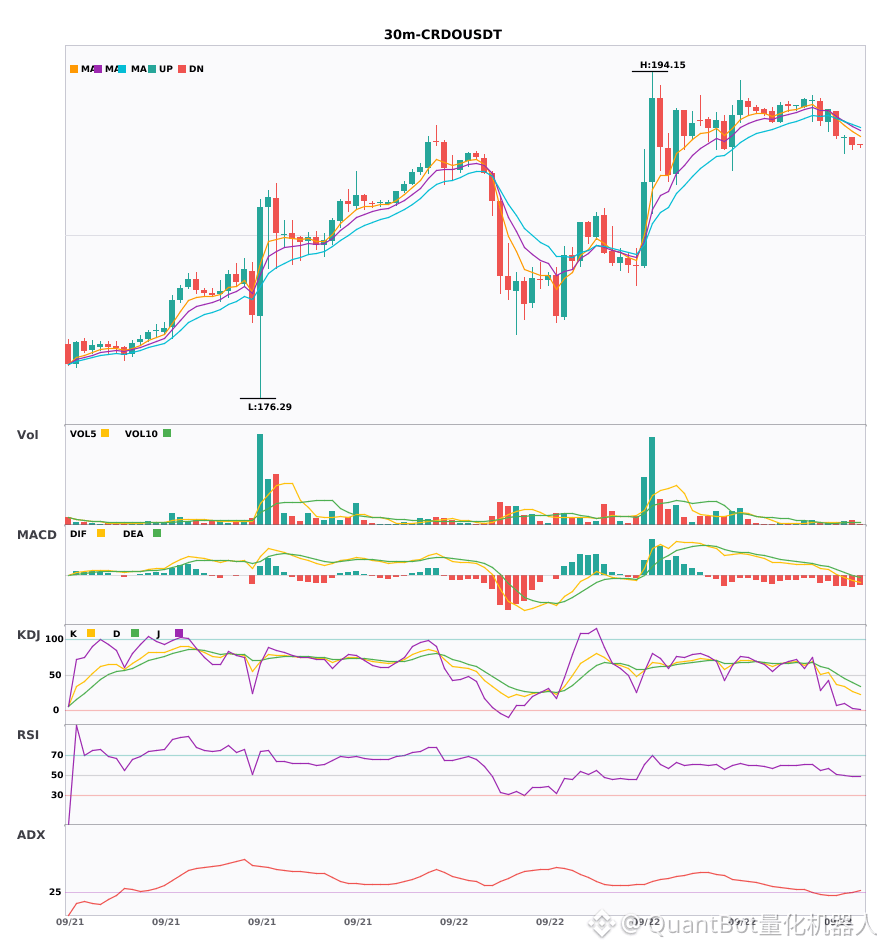
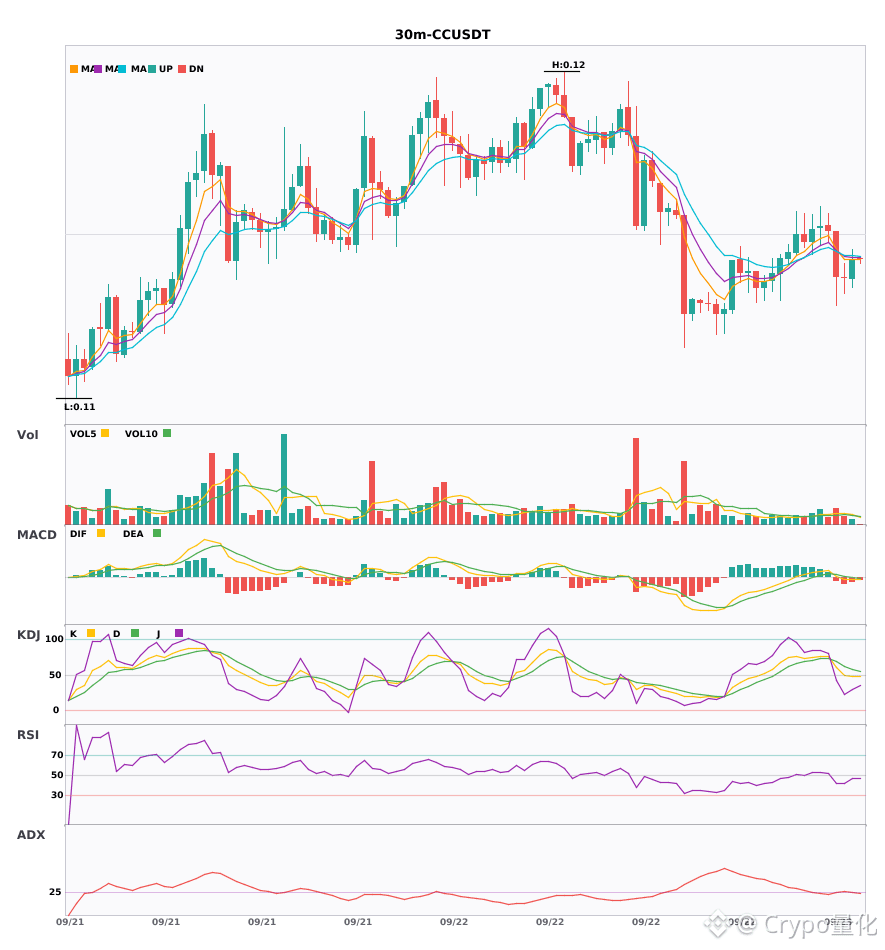
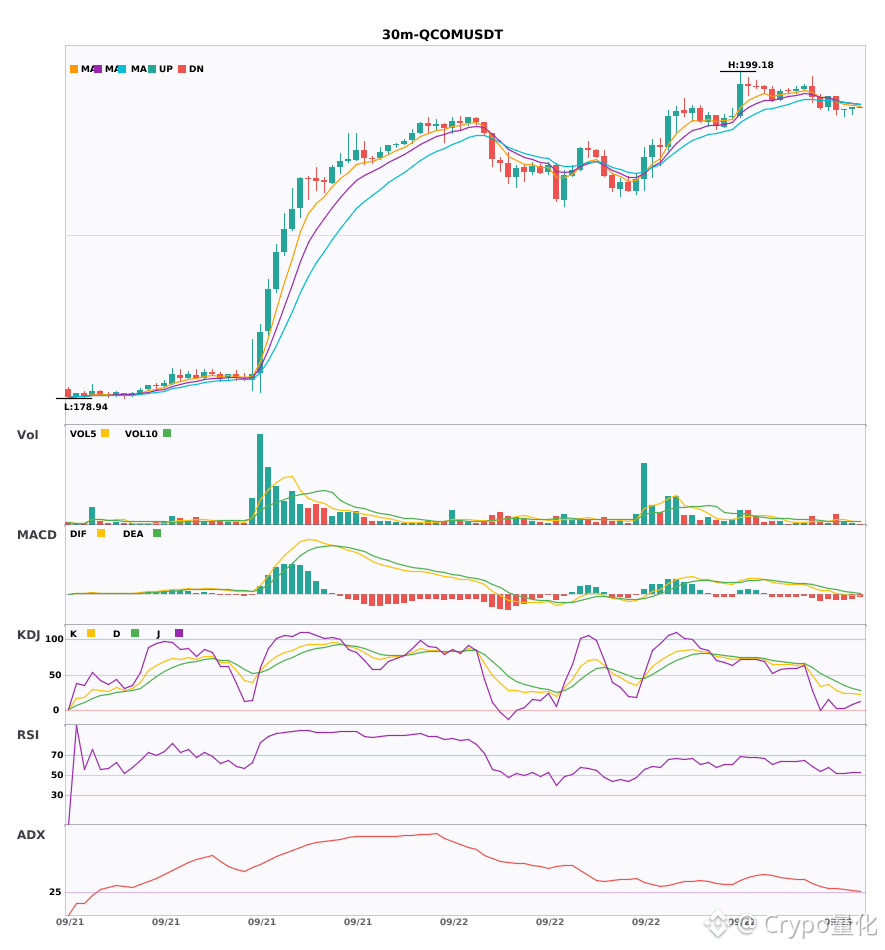
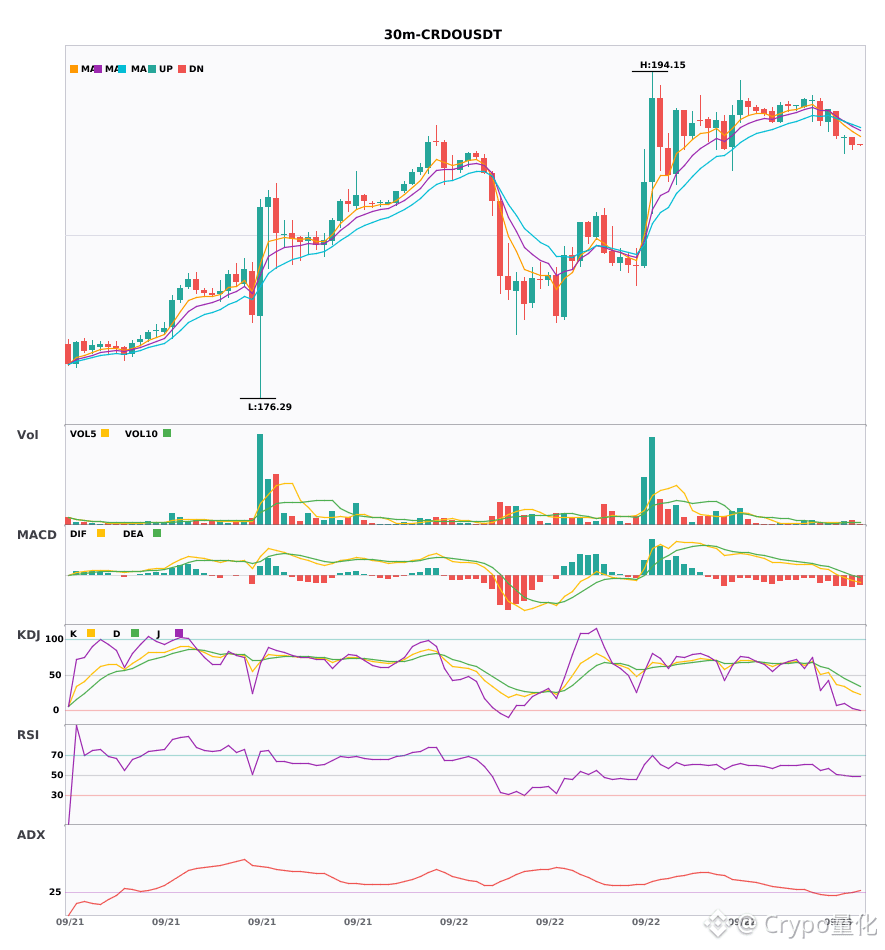
$CC / $QCOM / $CRDO 30 minute-level bearish bias; short-term resistance
📉 $CC | 30-minute bearish signal
━━━━━━━━━━━━━━━━━━
Technical analysis: ADX (27) indicates a trend is forming and is potentially tradable. MACD DIF has broken below the zero axis, turning bearish. EMA5 has crossed below EMA8, with the short-term turning bearish, and volume has increased by 1.7x.
Price change: -0.0400%
📉 $QCOM | 30-minute bearish signal
━━━━━━━━━━━━━━━━━━
Technical analysis: ADX (32) shows the trend is clear. MACD DIF has broken below the zero axis and the trend turns bearish. Moving averages are sticking together and waiting for direction. KDJ is weak with bearish advantage (K 24.4, D 35.1), and volume has expanded to 2.9x.
Price change: 0.0100%
📉 $CRDO | 30-minute bearish signal
━━━━━━━━━━━━━━━━━━
Technical analysis: ADX (29) Trend is forming and is potentially tradable | MACD bearish signals are running; the trend is relatively weak and momentum is strengthening | EMA5 < EMA8 < EMA13 bearish alignment | KDJ is running weakly, bearish dominance (K 27.4, D 39.5) | Volume expanded (1.6x)
Price change: -0.2200%
━━━━━━━━━━━━━━━━━━
#技术分析 #CC #QCOM #CRDO
📌 The above content is for reference only and does not constitute investment advice
$CC / $QCOM / $CRDO 30 minute-level bearish bias; short-term resistance
📉 $CC | 30-minute bearish signal
━━━━━━━━━━━━━━━━━━
Technical analysis: ADX (27) indicates a trend is forming and is potentially tradable. MACD DIF has broken below the zero axis, turning bearish. EMA5 has crossed below EMA8, with the short-term turning bearish, and volume has increased by 1.7x.
Price change: -0.0400%
📉 $QCOM | 30-minute bearish signal
━━━━━━━━━━━━━━━━━━
Technical analysis: ADX (32) shows the trend is clear. MACD DIF has broken below the zero axis and the trend turns bearish. Moving averages are sticking together and waiting for direction. KDJ is weak with bearish advantage (K 24.4, D 35.1), and volume has expanded to 2.9x.
Price change: 0.0100%
📉 $CRDO | 30-minute bearish signal
━━━━━━━━━━━━━━━━━━
Technical analysis: ADX (29) Trend is forming and is potentially tradable | MACD bearish signals are running; the trend is relatively weak and momentum is strengthening | EMA5 < EMA8 < EMA13 bearish alignment | KDJ is running weakly, bearish dominance (K 27.4, D 39.5) | Volume expanded (1.6x)
Price change: -0.2200%
━━━━━━━━━━━━━━━━━━
#技术分析 #CC #QCOM #CRDO
📌 The above content is for reference only and does not constitute investment advice
📉 $CC | 30-minute bearish signal
━━━━━━━━━━━━━━━━━━
Technical analysis: ADX (27) indicates a trend is forming and is potentially tradable. MACD DIF has broken below the zero axis, turning bearish. EMA5 has crossed below EMA8, with the short-term turning bearish, and volume has increased by 1.7x.
Price change: -0.0400%
📉 $QCOM | 30-minute bearish signal
━━━━━━━━━━━━━━━━━━
Technical analysis: ADX (32) shows the trend is clear. MACD DIF has broken below the zero axis and the trend turns bearish. Moving averages are sticking together and waiting for direction. KDJ is weak with bearish advantage (K 24.4, D 35.1), and volume has expanded to 2.9x.
Price change: 0.0100%
📉 $CRDO | 30-minute bearish signal
━━━━━━━━━━━━━━━━━━
Technical analysis: ADX (29) Trend is forming and is potentially tradable | MACD bearish signals are running; the trend is relatively weak and momentum is strengthening | EMA5 < EMA8 < EMA13 bearish alignment | KDJ is running weakly, bearish dominance (K 27.4, D 39.5) | Volume expanded (1.6x)
Price change: -0.2200%
━━━━━━━━━━━━━━━━━━
#技术分析 #CC #QCOM #CRDO
📌 The above content is for reference only and does not constitute investment advice
2
·
--
$CC / $QCOM / $CRDO 30 minutes resonance shifts to short; short signals appear at the same time🔥
════════════════════
🟢 $CC 30 minutes short signal
⚠️ Technicals: ADX is 27, the trend is forming and is becoming tradable. MACD DIF breaks below the zero axis and turns bearish. EMA5 crosses under EMA8, short-term turns bearish. Trading volume expands by 1.7x.
════════════════════
🟢 $QCOM 30 minutes short signal
⚠️ Technicals: ADX (32) shows a clear trending market | MACD DIF falls below the zero axis, trend turns bearish | Moving averages are sticking together, building strength and about to choose a direction | KDJ is operating weakly, with bears in control (K is 24.4, D is 35.1) | Volume explodes (2.9x)
════════════════════
🟢 $CRDO 30 minutes short signal
⚠️ Technicals: ADX 29 is gradually becoming tradable; MACD bearish green histogram bars expand; moving averages align bearishly. KDJ is relatively weak: K 27.4, D 39.5, volume up 1.6x.
════════════════════
🔔 Watch out for first-hand market updates and unusual moves 🔔
#技术分析 #CC #QCOM #CRDO
📌 When trading, pay attention to whether the candlestick pattern matches
$CC / $QCOM / $CRDO 30 minutes resonance shifts to short; short signals appear at the same time🔥
════════════════════
🟢 $CC 30 minutes short signal
⚠️ Technicals: ADX is 27, the trend is forming and is becoming tradable. MACD DIF breaks below the zero axis and turns bearish. EMA5 crosses under EMA8, short-term turns bearish. Trading volume expands by 1.7x.
════════════════════
🟢 $QCOM 30 minutes short signal
⚠️ Technicals: ADX (32) shows a clear trending market | MACD DIF falls below the zero axis, trend turns bearish | Moving averages are sticking together, building strength and about to choose a direction | KDJ is operating weakly, with bears in control (K is 24.4, D is 35.1) | Volume explodes (2.9x)
════════════════════
🟢 $CRDO 30 minutes short signal
⚠️ Technicals: ADX 29 is gradually becoming tradable; MACD bearish green histogram bars expand; moving averages align bearishly. KDJ is relatively weak: K 27.4, D 39.5, volume up 1.6x.
════════════════════
🔔 Watch out for first-hand market updates and unusual moves 🔔
#技术分析 #CC #QCOM #CRDO
📌 When trading, pay attention to whether the candlestick pattern matches
════════════════════
🟢 $CC 30 minutes short signal
⚠️ Technicals: ADX is 27, the trend is forming and is becoming tradable. MACD DIF breaks below the zero axis and turns bearish. EMA5 crosses under EMA8, short-term turns bearish. Trading volume expands by 1.7x.
════════════════════
🟢 $QCOM 30 minutes short signal
⚠️ Technicals: ADX (32) shows a clear trending market | MACD DIF falls below the zero axis, trend turns bearish | Moving averages are sticking together, building strength and about to choose a direction | KDJ is operating weakly, with bears in control (K is 24.4, D is 35.1) | Volume explodes (2.9x)
════════════════════
🟢 $CRDO 30 minutes short signal
⚠️ Technicals: ADX 29 is gradually becoming tradable; MACD bearish green histogram bars expand; moving averages align bearishly. KDJ is relatively weak: K 27.4, D 39.5, volume up 1.6x.
════════════════════
🔔 Watch out for first-hand market updates and unusual moves 🔔
#技术分析 #CC #QCOM #CRDO
📌 When trading, pay attention to whether the candlestick pattern matches
77
·
--
[M1_mag7]
$QCOM 24 hours, it rose 6.061%, with the price set at 191.62. The funding rate was reported at 0.00018712. A positive number means longs are paying shorts. Old dog took a look at the on-chain futures data: open interest is 56843.26, volume is 24644204.5909, and liquidity isn’t low. Price is pulling upward and funding is positive—this combination is a classic “crowded long” signal.
From the perspective of M1_mag7: it anchors to Mag7 versus the broader market, and it correlates with SPY/QQQ. But since your input doesn’t include those data points, I can only comment on QCOM’s own performance. In the semiconductor sector, QCOM is up about 6% this wave—but there’s no “secondary meme” signal, so I can’t cross-check whether this is sector-leading across other coins. Based purely on the data: price is up and funding is positive. The funding-rate direction has a hard rule: greater than zero means longs are paying shorts; crowding is high; and the risk of a top squeeze is elevated. On-chain derivatives liquidity exists, but the signals point to longs shouldering costs to push the price higher. If the price loosens, liquidation/closing pressure will arrive.
My view: QCOM is slightly bearish in the short term. Trigger conditions: if the price breaks below 190, I’ll fully close; if it breaks above 200 and the funding rate turns negative, then I’ll add. My position is currently on standby—no new trades.
On the anti-consensus angle: the market may think the uptrend will continue, but I’m seeing positive funding accumulating. If longs are forced to reduce exposure, the pullback could be fast. Who benefits? Shorts holding may make money; who pays the cost? Longs incur losses when they close. And if liquidity thins on the pullback, capital may rotate to other assets.
Invalidation conditions: if the funding rate turns negative tomorrow, and the price holds above 191.62, then my pullback thesis is wrong—this would imply shorts are adding fuel and the rally may continue. Since the input has no other indicators, I’m speaking only from the numbers in front of me.
Trading tag: #BinanceFutures #TradFi #USDⓈM #QCOM #QCOMUSDT $QCOM
[M1_mag7]
$QCOM 24 hours, it rose 6.061%, with the price set at 191.62. The funding rate was reported at 0.00018712. A positive number means longs are paying shorts. Old dog took a look at the on-chain futures data: open interest is 56843.26, volume is 24644204.5909, and liquidity isn’t low. Price is pulling upward and funding is positive—this combination is a classic “crowded long” signal.
From the perspective of M1_mag7: it anchors to Mag7 versus the broader market, and it correlates with SPY/QQQ. But since your input doesn’t include those data points, I can only comment on QCOM’s own performance. In the semiconductor sector, QCOM is up about 6% this wave—but there’s no “secondary meme” signal, so I can’t cross-check whether this is sector-leading across other coins. Based purely on the data: price is up and funding is positive. The funding-rate direction has a hard rule: greater than zero means longs are paying shorts; crowding is high; and the risk of a top squeeze is elevated. On-chain derivatives liquidity exists, but the signals point to longs shouldering costs to push the price higher. If the price loosens, liquidation/closing pressure will arrive.
My view: QCOM is slightly bearish in the short term. Trigger conditions: if the price breaks below 190, I’ll fully close; if it breaks above 200 and the funding rate turns negative, then I’ll add. My position is currently on standby—no new trades.
On the anti-consensus angle: the market may think the uptrend will continue, but I’m seeing positive funding accumulating. If longs are forced to reduce exposure, the pullback could be fast. Who benefits? Shorts holding may make money; who pays the cost? Longs incur losses when they close. And if liquidity thins on the pullback, capital may rotate to other assets.
Invalidation conditions: if the funding rate turns negative tomorrow, and the price holds above 191.62, then my pullback thesis is wrong—this would imply shorts are adding fuel and the rally may continue. Since the input has no other indicators, I’m speaking only from the numbers in front of me.
Trading tag: #BinanceFutures #TradFi #USDⓈM #QCOM #QCOMUSDT $QCOM
$QCOM 24 hours, it rose 6.061%, with the price set at 191.62. The funding rate was reported at 0.00018712. A positive number means longs are paying shorts. Old dog took a look at the on-chain futures data: open interest is 56843.26, volume is 24644204.5909, and liquidity isn’t low. Price is pulling upward and funding is positive—this combination is a classic “crowded long” signal.
From the perspective of M1_mag7: it anchors to Mag7 versus the broader market, and it correlates with SPY/QQQ. But since your input doesn’t include those data points, I can only comment on QCOM’s own performance. In the semiconductor sector, QCOM is up about 6% this wave—but there’s no “secondary meme” signal, so I can’t cross-check whether this is sector-leading across other coins. Based purely on the data: price is up and funding is positive. The funding-rate direction has a hard rule: greater than zero means longs are paying shorts; crowding is high; and the risk of a top squeeze is elevated. On-chain derivatives liquidity exists, but the signals point to longs shouldering costs to push the price higher. If the price loosens, liquidation/closing pressure will arrive.
My view: QCOM is slightly bearish in the short term. Trigger conditions: if the price breaks below 190, I’ll fully close; if it breaks above 200 and the funding rate turns negative, then I’ll add. My position is currently on standby—no new trades.
On the anti-consensus angle: the market may think the uptrend will continue, but I’m seeing positive funding accumulating. If longs are forced to reduce exposure, the pullback could be fast. Who benefits? Shorts holding may make money; who pays the cost? Longs incur losses when they close. And if liquidity thins on the pullback, capital may rotate to other assets.
Invalidation conditions: if the funding rate turns negative tomorrow, and the price holds above 191.62, then my pullback thesis is wrong—this would imply shorts are adding fuel and the rally may continue. Since the input has no other indicators, I’m speaking only from the numbers in front of me.
Trading tag: #BinanceFutures #TradFi #USDⓈM #QCOM #QCOMUSDT $QCOM
27
·
--
QCOM is up 7.55% over 24 hours, and the price has climbed above 193. This isn’t a huge move, but within this sector it counts as unusual activity. Tight geopolitical tensions have tightened expectations for semiconductors—especially automotive chips—so the capital moved first in a show of respect. The funding rate is 0, so bulls and bears are temporarily balanced; neither side is forcing through financing costs. This looks more like a short-term sentiment-driven move rather than the start of a trend. If the conflict doesn’t escalate, this rally’s gains are likely to be given back. Counterargument: the conflict de-escalates quickly, and QCOM leads the pullback. On the second order, capital may flow from semiconductors to true defense stocks. If it breaks below 185, the short-term logic will be invalid.
Trading tags: #TradFi #链上美股 #QCOM
Where do you think this assessment is most likely to be wrong?
QCOM is up 7.55% over 24 hours, and the price has climbed above 193. This isn’t a huge move, but within this sector it counts as unusual activity. Tight geopolitical tensions have tightened expectations for semiconductors—especially automotive chips—so the capital moved first in a show of respect. The funding rate is 0, so bulls and bears are temporarily balanced; neither side is forcing through financing costs. This looks more like a short-term sentiment-driven move rather than the start of a trend. If the conflict doesn’t escalate, this rally’s gains are likely to be given back. Counterargument: the conflict de-escalates quickly, and QCOM leads the pullback. On the second order, capital may flow from semiconductors to true defense stocks. If it breaks below 185, the short-term logic will be invalid.
Trading tags: #TradFi #链上美股 #QCOM
Where do you think this assessment is most likely to be wrong?
Trading tags: #TradFi #链上美股 #QCOM
Where do you think this assessment is most likely to be wrong?
8
·
--
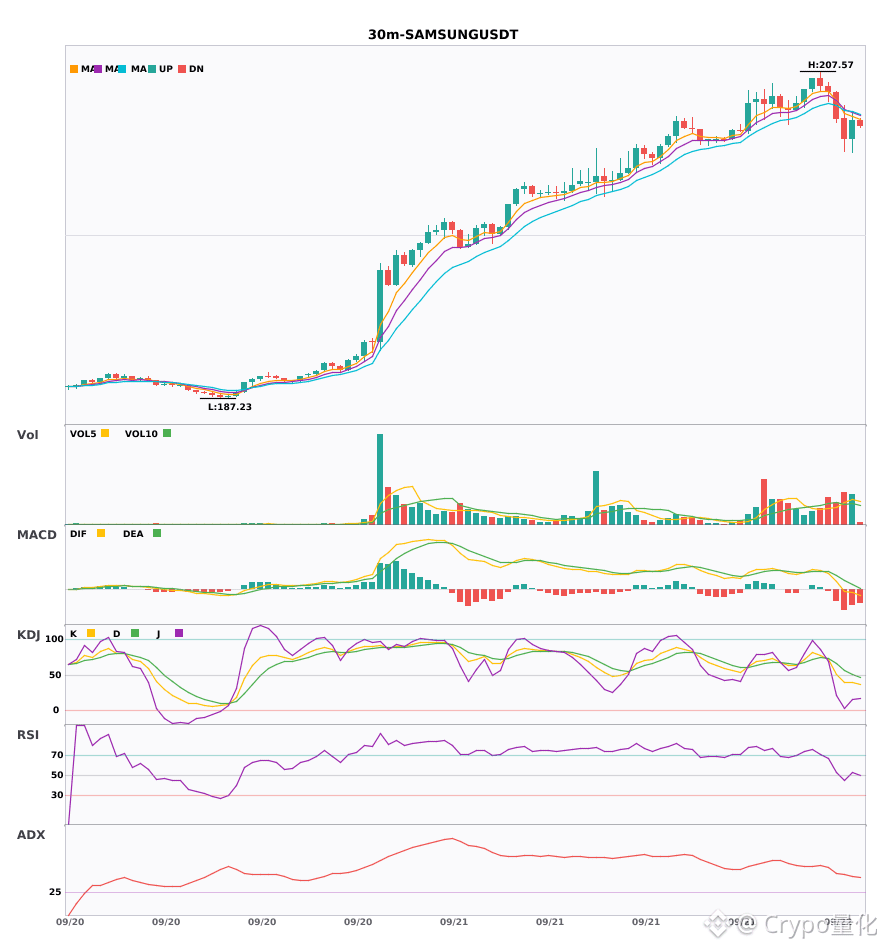
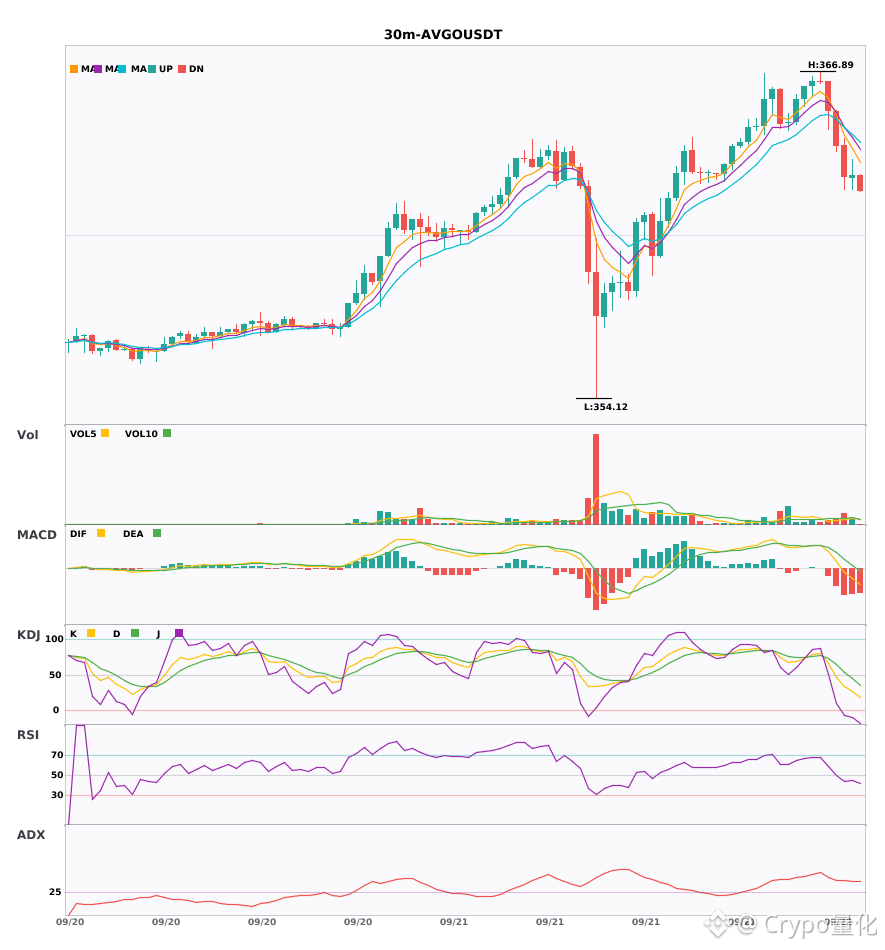
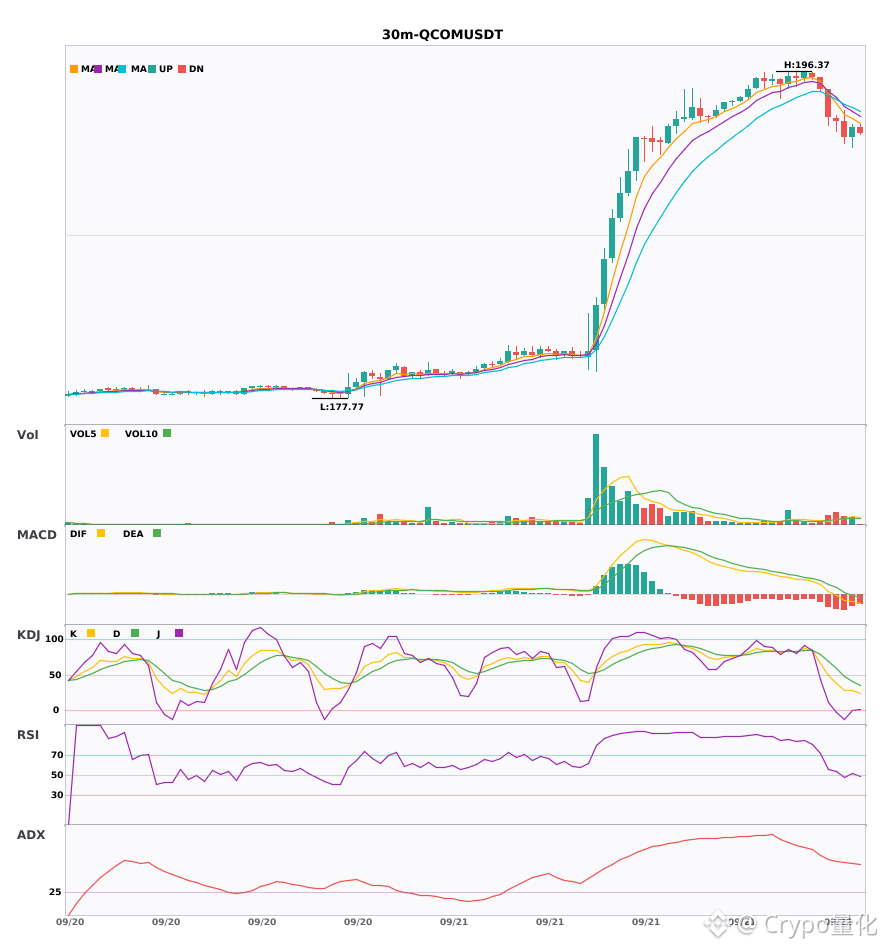
$SAMSUNG / $AVGO / $QCOM 30-minute timeframe slightly bearish; short-term pressure 🔥
════════════════════
🟢 $SAMSUNG 30-minute bearish signal
⚠️ Technicals: ADX(44) shows a clear trending market | MACD DIF breaks below the zero axis, trend turns bearish | EMA5 crosses below EMA8, short-term turns bearish | Volume expands (1.6x)
════════════════════
🟢 $AVGO 30-minute bearish signal
⚠️ Technicals: ADX(41) shows a clear trending market | MACD is running bearish; the trend is weak and momentum is decreasing | EMA5 < EMA8 < EMA13 bearish alignment | KDJ is weak; bears are in control (K=26.6, D=44.9) | Volume expands (1.6x)
📢 Market update: Binance will support the Broadcom (AVGO), Invesco QQQ Trust (QQQ), Meta (META), and Seagate (STX) cash dividend distribution via bStocks
════════════════════
🟢 $QCOM 30-minute bearish signal
⚠️ Technicals: ADX(57) extremely strong trend (be cautious of an overheated pullback) | MACD is running bearish; trend is weak with increasing momentum | EMA5 < EMA8 < EMA13 bearish alignment | KDJ is weak; bears are in control (K=28.3, D=48.4) | Volume expands (2.2x)
════════════════════
🔔 Watch and get first-hand info on intraday market anomalies 🔔
#技术分析 #SAMSUNG #AVGO #QCOM
📌 When trading, pay attention to whether the candlestick pattern matches
$SAMSUNG / $AVGO / $QCOM 30-minute timeframe slightly bearish; short-term pressure 🔥
════════════════════
🟢 $SAMSUNG 30-minute bearish signal
⚠️ Technicals: ADX(44) shows a clear trending market | MACD DIF breaks below the zero axis, trend turns bearish | EMA5 crosses below EMA8, short-term turns bearish | Volume expands (1.6x)
════════════════════
🟢 $AVGO 30-minute bearish signal
⚠️ Technicals: ADX(41) shows a clear trending market | MACD is running bearish; the trend is weak and momentum is decreasing | EMA5 < EMA8 < EMA13 bearish alignment | KDJ is weak; bears are in control (K=26.6, D=44.9) | Volume expands (1.6x)
📢 Market update: Binance will support the Broadcom (AVGO), Invesco QQQ Trust (QQQ), Meta (META), and Seagate (STX) cash dividend distribution via bStocks
════════════════════
🟢 $QCOM 30-minute bearish signal
⚠️ Technicals: ADX(57) extremely strong trend (be cautious of an overheated pullback) | MACD is running bearish; trend is weak with increasing momentum | EMA5 < EMA8 < EMA13 bearish alignment | KDJ is weak; bears are in control (K=28.3, D=48.4) | Volume expands (2.2x)
════════════════════
🔔 Watch and get first-hand info on intraday market anomalies 🔔
#技术分析 #SAMSUNG #AVGO #QCOM
📌 When trading, pay attention to whether the candlestick pattern matches
════════════════════
🟢 $SAMSUNG 30-minute bearish signal
⚠️ Technicals: ADX(44) shows a clear trending market | MACD DIF breaks below the zero axis, trend turns bearish | EMA5 crosses below EMA8, short-term turns bearish | Volume expands (1.6x)
════════════════════
🟢 $AVGO 30-minute bearish signal
⚠️ Technicals: ADX(41) shows a clear trending market | MACD is running bearish; the trend is weak and momentum is decreasing | EMA5 < EMA8 < EMA13 bearish alignment | KDJ is weak; bears are in control (K=26.6, D=44.9) | Volume expands (1.6x)
📢 Market update: Binance will support the Broadcom (AVGO), Invesco QQQ Trust (QQQ), Meta (META), and Seagate (STX) cash dividend distribution via bStocks
════════════════════
🟢 $QCOM 30-minute bearish signal
⚠️ Technicals: ADX(57) extremely strong trend (be cautious of an overheated pullback) | MACD is running bearish; trend is weak with increasing momentum | EMA5 < EMA8 < EMA13 bearish alignment | KDJ is weak; bears are in control (K=28.3, D=48.4) | Volume expands (2.2x)
════════════════════
🔔 Watch and get first-hand info on intraday market anomalies 🔔
#技术分析 #SAMSUNG #AVGO #QCOM
📌 When trading, pay attention to whether the candlestick pattern matches
126
·
--
[M1_mag7]
$QCOM 24 hours it surged 8.759% while the price stayed pinned at 195.44, but the funding rate is positive 0.00022485. Old dog first looks at the funding: a positive funding rate means longs are paying shorts, so long positions’ cost keeps stacking up. With trading volume of 22.71 million USD, open interest at 55,296.99 contracts, and volume roughly double the open-interest value, it suggests this pump has real turnover—not just hard pulling with locked positions.
Why can this semiconductor pick move in sync with the overall tech market? $QCOM belongs to the semiconductor sector, and the sector beta is usually more sensitive than the Nasdaq. On-chain contract liquidity looks sufficient, but a positive funding rate exposes the risk that longs are crowded. What the market overlooks is that after an 8.7% jump plus a positive funding rate, you often need stronger new buying to sustain it; otherwise it’s easy to trigger profit-taking. Without data on other coins, I can only say that looking at $QCOM alone, funding sentiment leans toward longs, but it already shows fatigue.
My take: this is not a good spot to chase. The trigger is very clear: if the funding rate continues to rise above 0.0005, or if the price breaks below 190 (i.e., gives back half of the upside), I will cut my position by half. The contrarian point is that most people see an 8% rally and assume the trend continues, but fast upside under a positive funding rate is often a short-term top signal. If longs keep paying, shorts actually gain motivation to add.
Positioning: right now I’m lightly allocated and just observing, keeping only a core position to wait for a pullback and unwind/hedge the risk.
Where might I be most likely wrong? If $QCOM suddenly breaks out above 200 on a surge in volume and the funding turns negative, it would mean short-covering and new funds entering—then this logic fails. Or if open interest suddenly jumps by more than 70,000 contracts, liquidity would need to be reassessed. Besides that, a positive funding rate is a hard knock: the daily cost of holding for longs keeps accumulating. Old dog would rather miss than force a hold in a structure like this.
Trading tag: #BinanceFutures #TradFi #USDⓈM #QCOM #QCOMUSDT $QCOM
[M1_mag7]
$QCOM 24 hours it surged 8.759% while the price stayed pinned at 195.44, but the funding rate is positive 0.00022485. Old dog first looks at the funding: a positive funding rate means longs are paying shorts, so long positions’ cost keeps stacking up. With trading volume of 22.71 million USD, open interest at 55,296.99 contracts, and volume roughly double the open-interest value, it suggests this pump has real turnover—not just hard pulling with locked positions.
Why can this semiconductor pick move in sync with the overall tech market? $QCOM belongs to the semiconductor sector, and the sector beta is usually more sensitive than the Nasdaq. On-chain contract liquidity looks sufficient, but a positive funding rate exposes the risk that longs are crowded. What the market overlooks is that after an 8.7% jump plus a positive funding rate, you often need stronger new buying to sustain it; otherwise it’s easy to trigger profit-taking. Without data on other coins, I can only say that looking at $QCOM alone, funding sentiment leans toward longs, but it already shows fatigue.
My take: this is not a good spot to chase. The trigger is very clear: if the funding rate continues to rise above 0.0005, or if the price breaks below 190 (i.e., gives back half of the upside), I will cut my position by half. The contrarian point is that most people see an 8% rally and assume the trend continues, but fast upside under a positive funding rate is often a short-term top signal. If longs keep paying, shorts actually gain motivation to add.
Positioning: right now I’m lightly allocated and just observing, keeping only a core position to wait for a pullback and unwind/hedge the risk.
Where might I be most likely wrong? If $QCOM suddenly breaks out above 200 on a surge in volume and the funding turns negative, it would mean short-covering and new funds entering—then this logic fails. Or if open interest suddenly jumps by more than 70,000 contracts, liquidity would need to be reassessed. Besides that, a positive funding rate is a hard knock: the daily cost of holding for longs keeps accumulating. Old dog would rather miss than force a hold in a structure like this.
Trading tag: #BinanceFutures #TradFi #USDⓈM #QCOM #QCOMUSDT $QCOM
$QCOM 24 hours it surged 8.759% while the price stayed pinned at 195.44, but the funding rate is positive 0.00022485. Old dog first looks at the funding: a positive funding rate means longs are paying shorts, so long positions’ cost keeps stacking up. With trading volume of 22.71 million USD, open interest at 55,296.99 contracts, and volume roughly double the open-interest value, it suggests this pump has real turnover—not just hard pulling with locked positions.
Why can this semiconductor pick move in sync with the overall tech market? $QCOM belongs to the semiconductor sector, and the sector beta is usually more sensitive than the Nasdaq. On-chain contract liquidity looks sufficient, but a positive funding rate exposes the risk that longs are crowded. What the market overlooks is that after an 8.7% jump plus a positive funding rate, you often need stronger new buying to sustain it; otherwise it’s easy to trigger profit-taking. Without data on other coins, I can only say that looking at $QCOM alone, funding sentiment leans toward longs, but it already shows fatigue.
My take: this is not a good spot to chase. The trigger is very clear: if the funding rate continues to rise above 0.0005, or if the price breaks below 190 (i.e., gives back half of the upside), I will cut my position by half. The contrarian point is that most people see an 8% rally and assume the trend continues, but fast upside under a positive funding rate is often a short-term top signal. If longs keep paying, shorts actually gain motivation to add.
Positioning: right now I’m lightly allocated and just observing, keeping only a core position to wait for a pullback and unwind/hedge the risk.
Where might I be most likely wrong? If $QCOM suddenly breaks out above 200 on a surge in volume and the funding turns negative, it would mean short-covering and new funds entering—then this logic fails. Or if open interest suddenly jumps by more than 70,000 contracts, liquidity would need to be reassessed. Besides that, a positive funding rate is a hard knock: the daily cost of holding for longs keeps accumulating. Old dog would rather miss than force a hold in a structure like this.
Trading tag: #BinanceFutures #TradFi #USDⓈM #QCOM #QCOMUSDT $QCOM
83
·
--
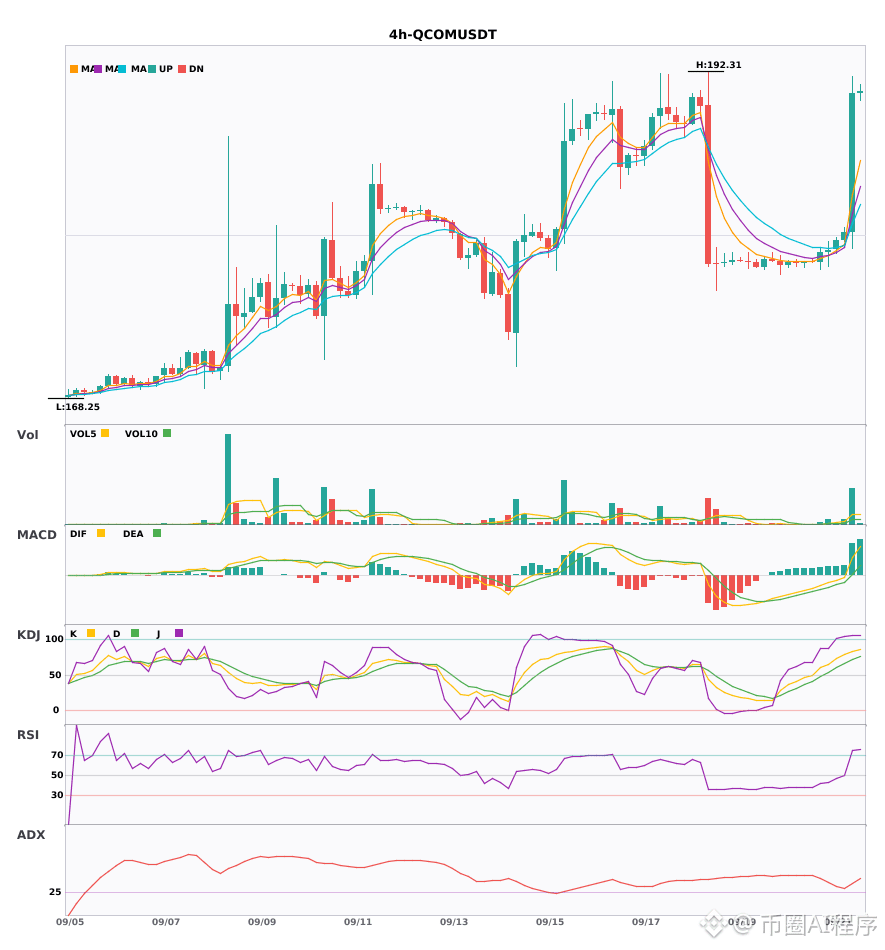
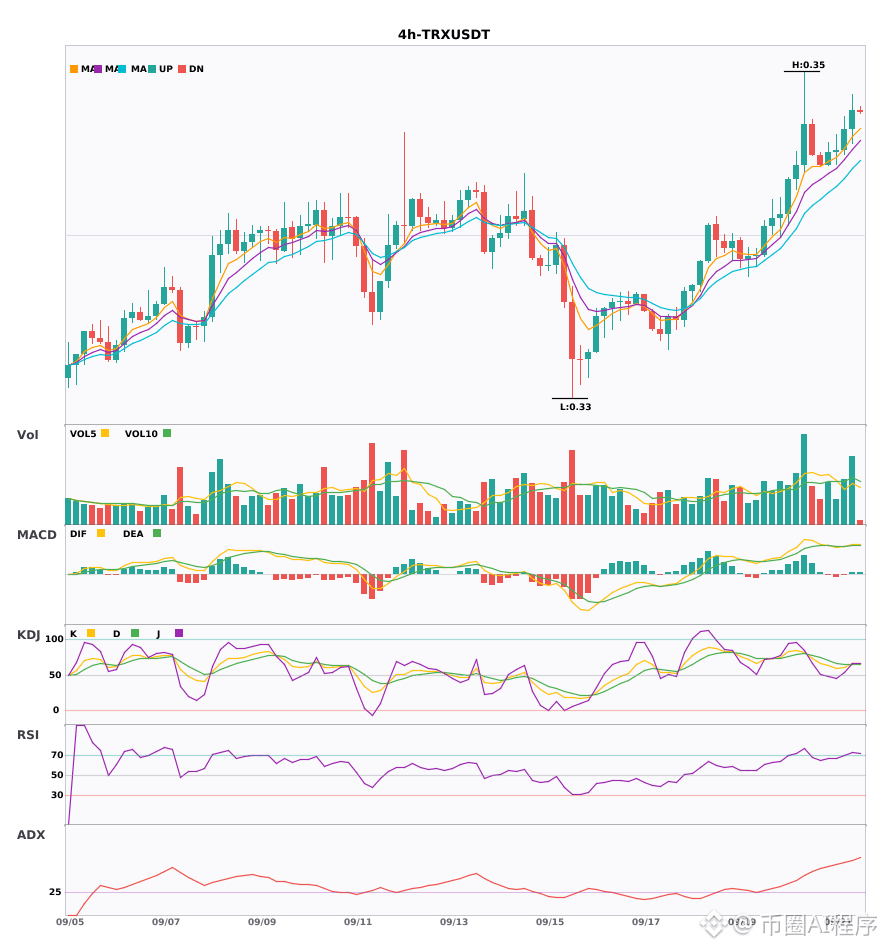
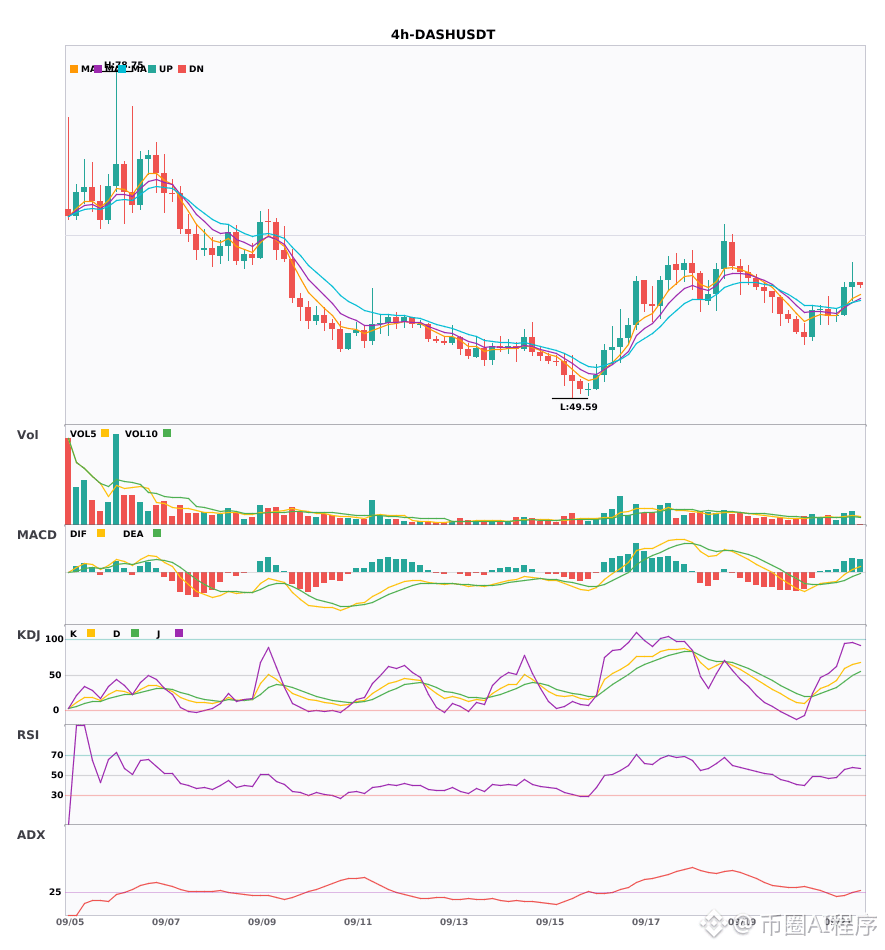
$QCOM / $TRX / $DASH 4 hours long signal, daily line bullish trend confirmation🔥
════════════════════
🔴 $QCOM 4 hours bullish signal
⚠️ Technical: Daily bullish resonance confirmed | 4-hour entry MACD DIF breaks above the zero line, trend turns bullish | EMA5 > EMA8 > EMA13 bullish alignment | KDJ is running strong, bulls dominant (K is 82.9, D is 71.9) | Volume explodes (6.7x)
════════════════════
🔴 $TRX 4 hours bullish signal
⚠️ Technical: Daily bullish resonance confirmed | 4-hour entry MACD forms a bullish crossover above zero, bullish momentum released | EMA5 > EMA8 > EMA13 bullish alignment | KDJ golden cross, short-term bullish (K is 65.5, D is 65.1) | Volume is normal (1.5x)
════════════════════
🔴 $DASH 4 hours bullish signal
⚠️ Technical: Daily bullish resonance confirmed | 4-hour entry MACD DIF breaks above the zero line, trend turns bullish | EMA5 > EMA8 > EMA13 bullish alignment | Volume expands (1.6x)
════════════════════
🔔 Watch for first-hand price action anomalies 🔔
#多周期共振 #QCOM #TRX #DASH
📌 When trading, pay attention to whether the candlestick pattern matches
$QCOM / $TRX / $DASH 4 hours long signal, daily line bullish trend confirmation🔥
════════════════════
🔴 $QCOM 4 hours bullish signal
⚠️ Technical: Daily bullish resonance confirmed | 4-hour entry MACD DIF breaks above the zero line, trend turns bullish | EMA5 > EMA8 > EMA13 bullish alignment | KDJ is running strong, bulls dominant (K is 82.9, D is 71.9) | Volume explodes (6.7x)
════════════════════
🔴 $TRX 4 hours bullish signal
⚠️ Technical: Daily bullish resonance confirmed | 4-hour entry MACD forms a bullish crossover above zero, bullish momentum released | EMA5 > EMA8 > EMA13 bullish alignment | KDJ golden cross, short-term bullish (K is 65.5, D is 65.1) | Volume is normal (1.5x)
════════════════════
🔴 $DASH 4 hours bullish signal
⚠️ Technical: Daily bullish resonance confirmed | 4-hour entry MACD DIF breaks above the zero line, trend turns bullish | EMA5 > EMA8 > EMA13 bullish alignment | Volume expands (1.6x)
════════════════════
🔔 Watch for first-hand price action anomalies 🔔
#多周期共振 #QCOM #TRX #DASH
📌 When trading, pay attention to whether the candlestick pattern matches
════════════════════
🔴 $QCOM 4 hours bullish signal
⚠️ Technical: Daily bullish resonance confirmed | 4-hour entry MACD DIF breaks above the zero line, trend turns bullish | EMA5 > EMA8 > EMA13 bullish alignment | KDJ is running strong, bulls dominant (K is 82.9, D is 71.9) | Volume explodes (6.7x)
════════════════════
🔴 $TRX 4 hours bullish signal
⚠️ Technical: Daily bullish resonance confirmed | 4-hour entry MACD forms a bullish crossover above zero, bullish momentum released | EMA5 > EMA8 > EMA13 bullish alignment | KDJ golden cross, short-term bullish (K is 65.5, D is 65.1) | Volume is normal (1.5x)
════════════════════
🔴 $DASH 4 hours bullish signal
⚠️ Technical: Daily bullish resonance confirmed | 4-hour entry MACD DIF breaks above the zero line, trend turns bullish | EMA5 > EMA8 > EMA13 bullish alignment | Volume expands (1.6x)
════════════════════
🔔 Watch for first-hand price action anomalies 🔔
#多周期共振 #QCOM #TRX #DASH
📌 When trading, pay attention to whether the candlestick pattern matches
19
Log in to explore more content
Join global crypto users on Binance Square
⚡️ Get latest and useful information about crypto.
💬 Trusted by the world’s largest crypto exchange.
👍 Discover real insights from verified creators.
Email / Phone number
Trending Topics
1
#BTCFallsBelow$83000
3,364 views
63 Discussing
2
#BitgetDetailsSecurityIncidentTimeline
0 views
0 Discussing
3
#BitcoinSpotETFs$2.39BWeeklyNetInflow
242 views
9 Discussing
4
#FedProposesPaymentStablecoinRules
15,629 views
363 Discussing
5
#ChinaMayLetAlibabaByteDanceBuyNvidiaChips
17,832 views
400 Discussing
6
#USChinaRelease$30BTariffCutProductLists
2,688 views
43 Discussing
7
#SKoreaFSCConsidersVirtualAssetMarketMaker
12,977 views
314 Discussing
8
#ChinaIndustrialProfitGrowthSlowsFourthMonth
12,716 views
309 Discussing
9
#BitwiseFilesFinalNEARSpotETFProspectus
131,250 views
1,897 Discussing
10
#BitgetHackerMoves$83MStolenXRP
42,087 views
184 Discussing