

#net
net
10,060 views
171 Discussing
Hot
Latest

·
--
🚀 $NET : Bulls Just Took Control — But Can They Hold It?
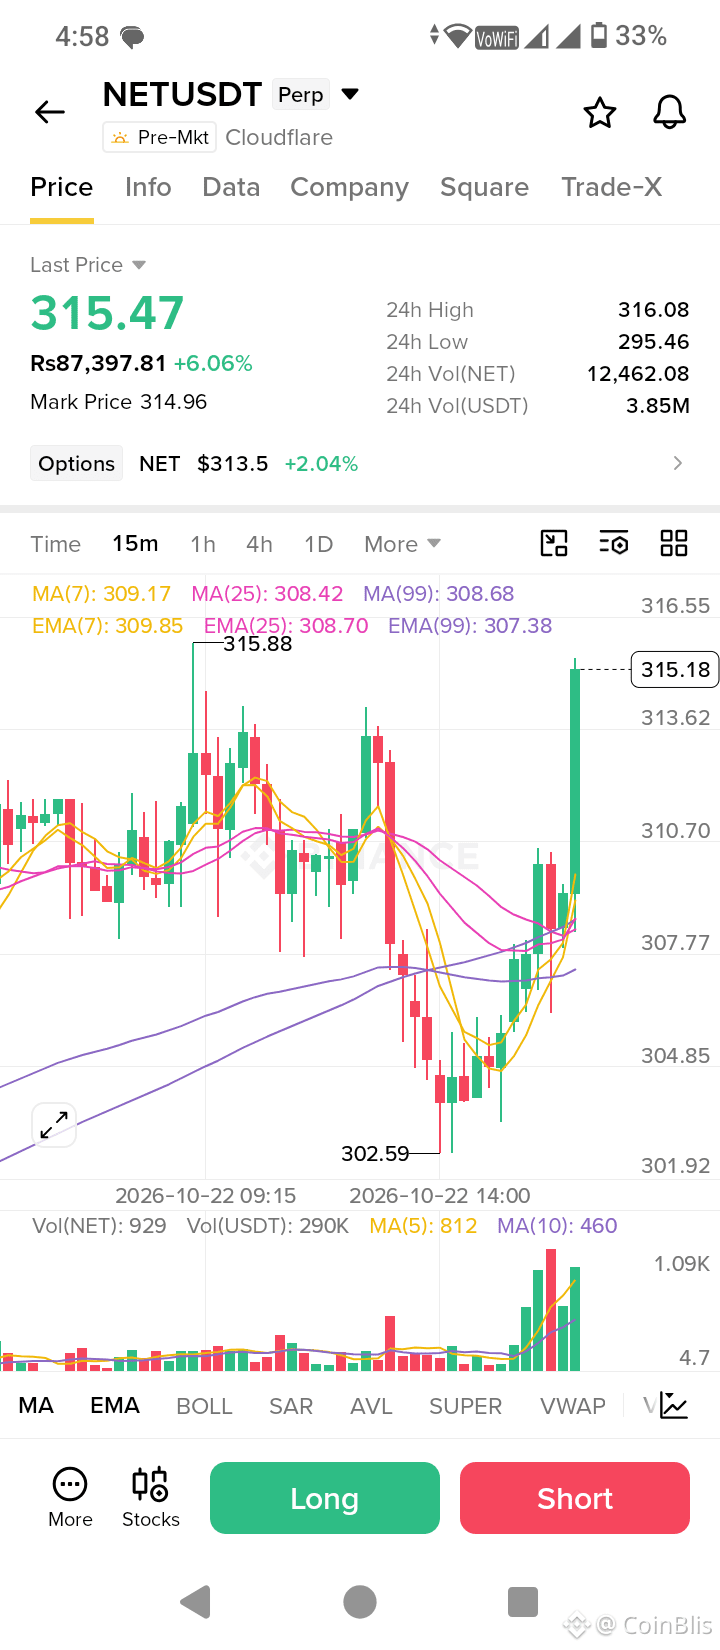
NET is trading at $315.47 (+6.06%) in this chart snapshot, and that final green candle stands out. Price surged above the $310–$311 range with a noticeable volume spike. Momentum is strong, but chasing a candle this large can be risky.
📊 Market Vibe: Short-term bullish momentum. Resistance sits near $315.88–$316.08, while $310–$311 is the key breakout zone to watch on a pullback.
🎯 Conditional LONG Setup
- Entry: $313.50–$314.20 after a successful retest
- SL: $311.80
- TP1: $316.00
- TP2: $318.00
- TP3: $320.00
💡 Pro Tip: Wait for a candle close and retest confirmation. If price loses the breakout zone, skip the trade. RSI isn’t visible, so don’t assume momentum is overbought or oversold.
#NET #Cloudflare #BinanceSquare #TechnicalAnalysis #BinanceSquare
🚀 $NET : Bulls Just Took Control — But Can They Hold It?
NET is trading at $315.47 (+6.06%) in this chart snapshot, and that final green candle stands out. Price surged above the $310–$311 range with a noticeable volume spike. Momentum is strong, but chasing a candle this large can be risky.
📊 Market Vibe: Short-term bullish momentum. Resistance sits near $315.88–$316.08, while $310–$311 is the key breakout zone to watch on a pullback.
🎯 Conditional LONG Setup
- Entry: $313.50–$314.20 after a successful retest
- SL: $311.80
- TP1: $316.00
- TP2: $318.00
- TP3: $320.00
💡 Pro Tip: Wait for a candle close and retest confirmation. If price loses the breakout zone, skip the trade. RSI isn’t visible, so don’t assume momentum is overbought or oversold.
#NET #Cloudflare #BinanceSquare #TechnicalAnalysis #BinanceSquare
NET is trading at $315.47 (+6.06%) in this chart snapshot, and that final green candle stands out. Price surged above the $310–$311 range with a noticeable volume spike. Momentum is strong, but chasing a candle this large can be risky.
📊 Market Vibe: Short-term bullish momentum. Resistance sits near $315.88–$316.08, while $310–$311 is the key breakout zone to watch on a pullback.
🎯 Conditional LONG Setup
- Entry: $313.50–$314.20 after a successful retest
- SL: $311.80
- TP1: $316.00
- TP2: $318.00
- TP3: $320.00
💡 Pro Tip: Wait for a candle close and retest confirmation. If price loses the breakout zone, skip the trade. RSI isn’t visible, so don’t assume momentum is overbought or oversold.
#NET #Cloudflare #BinanceSquare #TechnicalAnalysis #BinanceSquare
1
15


·
--
Bullish
The $3.8396K short liquidation at $367.77519 is a fresh NET upside sweep.
I’d watch whether buyers can maintain this pressure.
$NET
{future}(NETUSDT)
$RLC
{future}(RLCUSDT)
$BR
{future}(BRUSDT)
🟢 LIQUIDITY ZONE HIT 🟢
Short liquidation spotted 🧨
$3.8396K cleared at $367.77519
Upside liquidity swept — watch reaction 👀
🎯 TP Targets:
TP1: ~$371.45
TP2: ~$375.13
TP3: ~$378.80
#NET
The $3.8396K short liquidation at $367.77519 is a fresh NET upside sweep.
I’d watch whether buyers can maintain this pressure.
$NET
$RLC
$BR
🟢 LIQUIDITY ZONE HIT 🟢
Short liquidation spotted 🧨
$3.8396K cleared at $367.77519
Upside liquidity swept — watch reaction 👀
🎯 TP Targets:
TP1: ~$371.45
TP2: ~$375.13
TP3: ~$378.80
#NET
I’d watch whether buyers can maintain this pressure.
$NET
$RLC
$BR
🟢 LIQUIDITY ZONE HIT 🟢
Short liquidation spotted 🧨
$3.8396K cleared at $367.77519
Upside liquidity swept — watch reaction 👀
🎯 TP Targets:
TP1: ~$371.45
TP2: ~$375.13
TP3: ~$378.80
#NET
13

·
--
🚨 $NET DISRUPTS DEFI WITH A 100% PARABOLIC TREASURY-BACKED LIQUIDITY EXPANSION! 📊
Smart money is rotating back into treasury-backed mechanics as $NET briefly breached a $70 million market cap. Built on OlympusDAO architecture, the smart contract enforces a hard algorithmic floor with 1 USDG treasury backing per token, strictly preventing unbacked minting. 🔍
This verifiable solvency structure drives an asymmetric risk profile, fueling a 100.5% rally while ecosystem peer $DTF surged 107% to $5.99 million. ⚡ Capital flows are unmistakably rewarding protocols that lock tangible treasury value behind their tokenomics. 📊
💬 Do you see this OHM-style treasury model sustaining structural momentum, or is this a rapid liquidity sweep across speculative DeFi? 👇
⚠️ Not financial advice. Always manage your risk. 🛡️
🏷️ #NET #DTF #DeFi #Crypto #Altcoins
🦈 💎
🚨 $NET DISRUPTS DEFI WITH A 100% PARABOLIC TREASURY-BACKED LIQUIDITY EXPANSION! 📊
Smart money is rotating back into treasury-backed mechanics as $NET briefly breached a $70 million market cap. Built on OlympusDAO architecture, the smart contract enforces a hard algorithmic floor with 1 USDG treasury backing per token, strictly preventing unbacked minting. 🔍
This verifiable solvency structure drives an asymmetric risk profile, fueling a 100.5% rally while ecosystem peer $DTF surged 107% to $5.99 million. ⚡ Capital flows are unmistakably rewarding protocols that lock tangible treasury value behind their tokenomics. 📊
💬 Do you see this OHM-style treasury model sustaining structural momentum, or is this a rapid liquidity sweep across speculative DeFi? 👇
⚠️ Not financial advice. Always manage your risk. 🛡️
🏷️ #NET #DTF #DeFi #Crypto #Altcoins
🦈 💎
Smart money is rotating back into treasury-backed mechanics as $NET briefly breached a $70 million market cap. Built on OlympusDAO architecture, the smart contract enforces a hard algorithmic floor with 1 USDG treasury backing per token, strictly preventing unbacked minting. 🔍
This verifiable solvency structure drives an asymmetric risk profile, fueling a 100.5% rally while ecosystem peer $DTF surged 107% to $5.99 million. ⚡ Capital flows are unmistakably rewarding protocols that lock tangible treasury value behind their tokenomics. 📊
💬 Do you see this OHM-style treasury model sustaining structural momentum, or is this a rapid liquidity sweep across speculative DeFi? 👇
⚠️ Not financial advice. Always manage your risk. 🛡️
🏷️ #NET #DTF #DeFi #Crypto #Altcoins
🦈 💎
29

🦈 $NET PANIC SELL FADES — INSTITUTIONS EAT THE CONVERTIBLE BOND DIP 💼
The knee-jerk reaction to a $2.175B private convertible offering hit the tape, and sellers took their shot — but the ammunition is running dry. The drop from -2% to -0.94% is the tell. Markets fear dilution before they read the fine print, then the smart money quietly steps in. 📊
At a $105B cap, printing convertible paper isn't distress — it's a capital arsenal. Whoever's buying these bonds is betting on future upside, not bankruptcy. The intraday recovery screams one thing: buyers are swallowing the dip while retail panics. 💡
Is this the classic sell-the-news exhaustion, or are you waiting for a full reclaim before joining the bid? 👇
⚠️ Not financial advice. Always manage your risk. 🛡️
🏷️ #NET #Cloudflare #MarketInsight #SmartMoney #Crypto
🦈 💼
🦈 $NET PANIC SELL FADES — INSTITUTIONS EAT THE CONVERTIBLE BOND DIP 💼
The knee-jerk reaction to a $2.175B private convertible offering hit the tape, and sellers took their shot — but the ammunition is running dry. The drop from -2% to -0.94% is the tell. Markets fear dilution before they read the fine print, then the smart money quietly steps in. 📊
At a $105B cap, printing convertible paper isn't distress — it's a capital arsenal. Whoever's buying these bonds is betting on future upside, not bankruptcy. The intraday recovery screams one thing: buyers are swallowing the dip while retail panics. 💡
Is this the classic sell-the-news exhaustion, or are you waiting for a full reclaim before joining the bid? 👇
⚠️ Not financial advice. Always manage your risk. 🛡️
🏷️ #NET #Cloudflare #MarketInsight #SmartMoney #Crypto
🦈 💼
The knee-jerk reaction to a $2.175B private convertible offering hit the tape, and sellers took their shot — but the ammunition is running dry. The drop from -2% to -0.94% is the tell. Markets fear dilution before they read the fine print, then the smart money quietly steps in. 📊
At a $105B cap, printing convertible paper isn't distress — it's a capital arsenal. Whoever's buying these bonds is betting on future upside, not bankruptcy. The intraday recovery screams one thing: buyers are swallowing the dip while retail panics. 💡
Is this the classic sell-the-news exhaustion, or are you waiting for a full reclaim before joining the bid? 👇
⚠️ Not financial advice. Always manage your risk. 🛡️
🏷️ #NET #Cloudflare #MarketInsight #SmartMoney #Crypto
🦈 💼
8

·
--
$NET price 297.27, down 1.813% over the past 24 hours; the funding rate has returned to zero, and open interest is only 883. The market is so thin that nobody is adding leverage—so this drop is simply because there’s no one to take the other side. If military news truly starts to gain traction, this kind of liquidity could get skewered, but right now the news feed is empty; anyone who imagines a conflict is the one making it up. My view is that there’s no squeeze structure here, so there’s no rush to act. The strongest counterevidence is that the drop is shallow and the funding rate is not biased toward shorting, which suggests the shorts haven’t moved either. There’s only one move: stay flat and wait. If the price regains and holds above 297.27, then I’ll reconsider going long.
Trading tag: #TradFi #链上美股 #NET
Where do you think this thesis is most likely to be wrong?
$NET price 297.27, down 1.813% over the past 24 hours; the funding rate has returned to zero, and open interest is only 883. The market is so thin that nobody is adding leverage—so this drop is simply because there’s no one to take the other side. If military news truly starts to gain traction, this kind of liquidity could get skewered, but right now the news feed is empty; anyone who imagines a conflict is the one making it up. My view is that there’s no squeeze structure here, so there’s no rush to act. The strongest counterevidence is that the drop is shallow and the funding rate is not biased toward shorting, which suggests the shorts haven’t moved either. There’s only one move: stay flat and wait. If the price regains and holds above 297.27, then I’ll reconsider going long.
Trading tag: #TradFi #链上美股 #NET
Where do you think this thesis is most likely to be wrong?
Trading tag: #TradFi #链上美股 #NET
Where do you think this thesis is most likely to be wrong?
8

·
--
$NET In the past 24 hours, it surged more than 10%, hitting $312.61. Such a sudden rally usually sees funding rates get pushed higher, meaning longs pay the cost for their positions. But its funding rate is zero—so neither side has to pay the other. Combined with the open interest of 1,294.39, this rally hasn’t yet shown extreme one-sided pressure in either positions or funding costs.
My core view is that this kind of price spike paired with a neutral funding rate typically indicates that the rally’s main force isn’t being driven by hard pushing with high-leverage futures capital. Instead, spot or lower-leverage buying is more likely the driver. Price appreciation itself attracts attention, but funding being flat means either shorts haven’t entered at scale yet, or they’re also waiting—preparing to ambush at higher levels. This is a neutral-to-bullish signal, but it absolutely doesn’t mean the uptrend is solid.
The strongest counterpoint is: a funding rate of zero could also be a sign of insufficient momentum. If the bulls were truly overpowering, the funding rate should be pushed higher. This current zero-funding state looks more like both sides are probing, with the upward move lacking leveraged “fuel” to accelerate. Once price goes sideways or stalls, it can easily trigger a chain reaction of profit-taking.
The next second-order effect is that with funding neutral, both long and short positions have relatively low costs. That makes it more likely for capital to stay in the game and for volatility to remain. If price can hold steady on the current platform or break upward further, it could force the waiting shorts to take losses and close—potentially triggering another round of short-term push higher. But the other way around also holds: if price turns down, stop-losses for longs in a zero-funding environment also won’t be gentle, and the decline could be sharp.
Where is this view most likely wrong? In that I assumed spot is dominant. If subsequent data shows price rising but trading volume shrinking, or if there are large sell orders in futures contracts, that would indicate momentum may be fading. The invalidation conditions are also clear: if within the next 24 hours the $NET price can’t hold above the $300 level, or if the funding rate turns positive but price then goes nowhere, then the continuity of this rally becomes highly questionable—my thesis would fail.
Action-wise: at this position and with the current funding, I choose to observe. If price can break above the prior high on increased volume (the specific prior high wasn’t provided in the input; here it refers to the recent high-level zone), I’ll consider following the trend and testing a small long position. If price directly falls back and breaks below $300, I will completely give up tracking this move.
Trading tags: #BinanceFutures #TradFi #USDⓈM #NET #NETUSDT $NET
$NET In the past 24 hours, it surged more than 10%, hitting $312.61. Such a sudden rally usually sees funding rates get pushed higher, meaning longs pay the cost for their positions. But its funding rate is zero—so neither side has to pay the other. Combined with the open interest of 1,294.39, this rally hasn’t yet shown extreme one-sided pressure in either positions or funding costs.
My core view is that this kind of price spike paired with a neutral funding rate typically indicates that the rally’s main force isn’t being driven by hard pushing with high-leverage futures capital. Instead, spot or lower-leverage buying is more likely the driver. Price appreciation itself attracts attention, but funding being flat means either shorts haven’t entered at scale yet, or they’re also waiting—preparing to ambush at higher levels. This is a neutral-to-bullish signal, but it absolutely doesn’t mean the uptrend is solid.
The strongest counterpoint is: a funding rate of zero could also be a sign of insufficient momentum. If the bulls were truly overpowering, the funding rate should be pushed higher. This current zero-funding state looks more like both sides are probing, with the upward move lacking leveraged “fuel” to accelerate. Once price goes sideways or stalls, it can easily trigger a chain reaction of profit-taking.
The next second-order effect is that with funding neutral, both long and short positions have relatively low costs. That makes it more likely for capital to stay in the game and for volatility to remain. If price can hold steady on the current platform or break upward further, it could force the waiting shorts to take losses and close—potentially triggering another round of short-term push higher. But the other way around also holds: if price turns down, stop-losses for longs in a zero-funding environment also won’t be gentle, and the decline could be sharp.
Where is this view most likely wrong? In that I assumed spot is dominant. If subsequent data shows price rising but trading volume shrinking, or if there are large sell orders in futures contracts, that would indicate momentum may be fading. The invalidation conditions are also clear: if within the next 24 hours the $NET price can’t hold above the $300 level, or if the funding rate turns positive but price then goes nowhere, then the continuity of this rally becomes highly questionable—my thesis would fail.
Action-wise: at this position and with the current funding, I choose to observe. If price can break above the prior high on increased volume (the specific prior high wasn’t provided in the input; here it refers to the recent high-level zone), I’ll consider following the trend and testing a small long position. If price directly falls back and breaks below $300, I will completely give up tracking this move.
Trading tags: #BinanceFutures #TradFi #USDⓈM #NET #NETUSDT $NET
My core view is that this kind of price spike paired with a neutral funding rate typically indicates that the rally’s main force isn’t being driven by hard pushing with high-leverage futures capital. Instead, spot or lower-leverage buying is more likely the driver. Price appreciation itself attracts attention, but funding being flat means either shorts haven’t entered at scale yet, or they’re also waiting—preparing to ambush at higher levels. This is a neutral-to-bullish signal, but it absolutely doesn’t mean the uptrend is solid.
The strongest counterpoint is: a funding rate of zero could also be a sign of insufficient momentum. If the bulls were truly overpowering, the funding rate should be pushed higher. This current zero-funding state looks more like both sides are probing, with the upward move lacking leveraged “fuel” to accelerate. Once price goes sideways or stalls, it can easily trigger a chain reaction of profit-taking.
The next second-order effect is that with funding neutral, both long and short positions have relatively low costs. That makes it more likely for capital to stay in the game and for volatility to remain. If price can hold steady on the current platform or break upward further, it could force the waiting shorts to take losses and close—potentially triggering another round of short-term push higher. But the other way around also holds: if price turns down, stop-losses for longs in a zero-funding environment also won’t be gentle, and the decline could be sharp.
Where is this view most likely wrong? In that I assumed spot is dominant. If subsequent data shows price rising but trading volume shrinking, or if there are large sell orders in futures contracts, that would indicate momentum may be fading. The invalidation conditions are also clear: if within the next 24 hours the $NET price can’t hold above the $300 level, or if the funding rate turns positive but price then goes nowhere, then the continuity of this rally becomes highly questionable—my thesis would fail.
Action-wise: at this position and with the current funding, I choose to observe. If price can break above the prior high on increased volume (the specific prior high wasn’t provided in the input; here it refers to the recent high-level zone), I’ll consider following the trend and testing a small long position. If price directly falls back and breaks below $300, I will completely give up tracking this move.
Trading tags: #BinanceFutures #TradFi #USDⓈM #NET #NETUSDT $NET
44

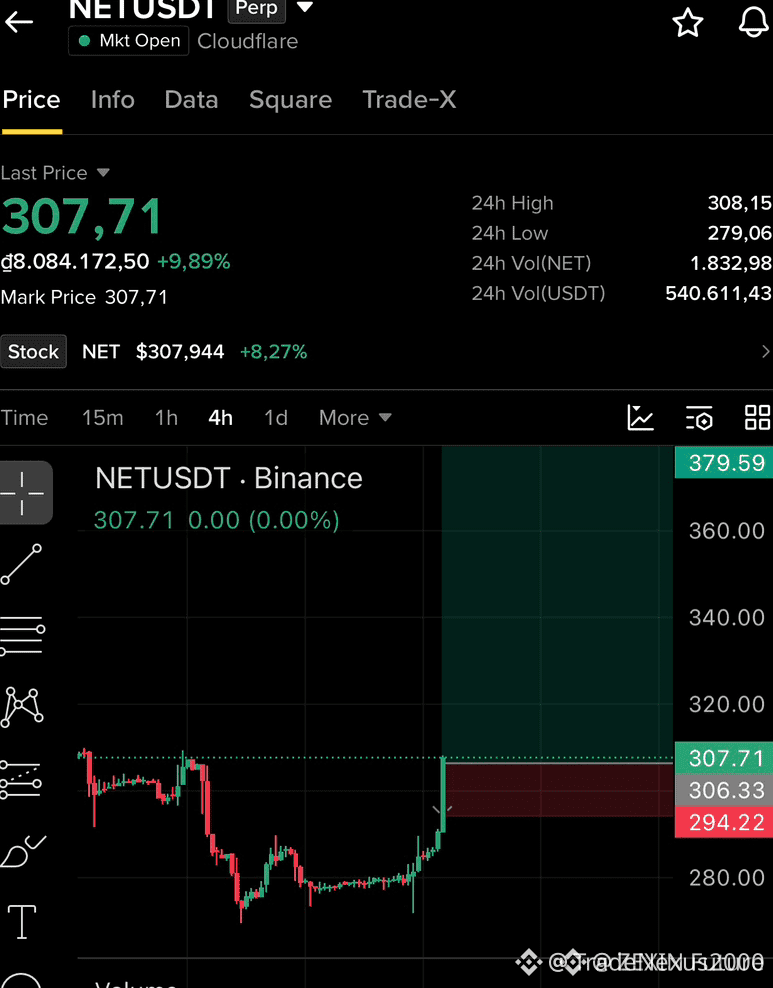
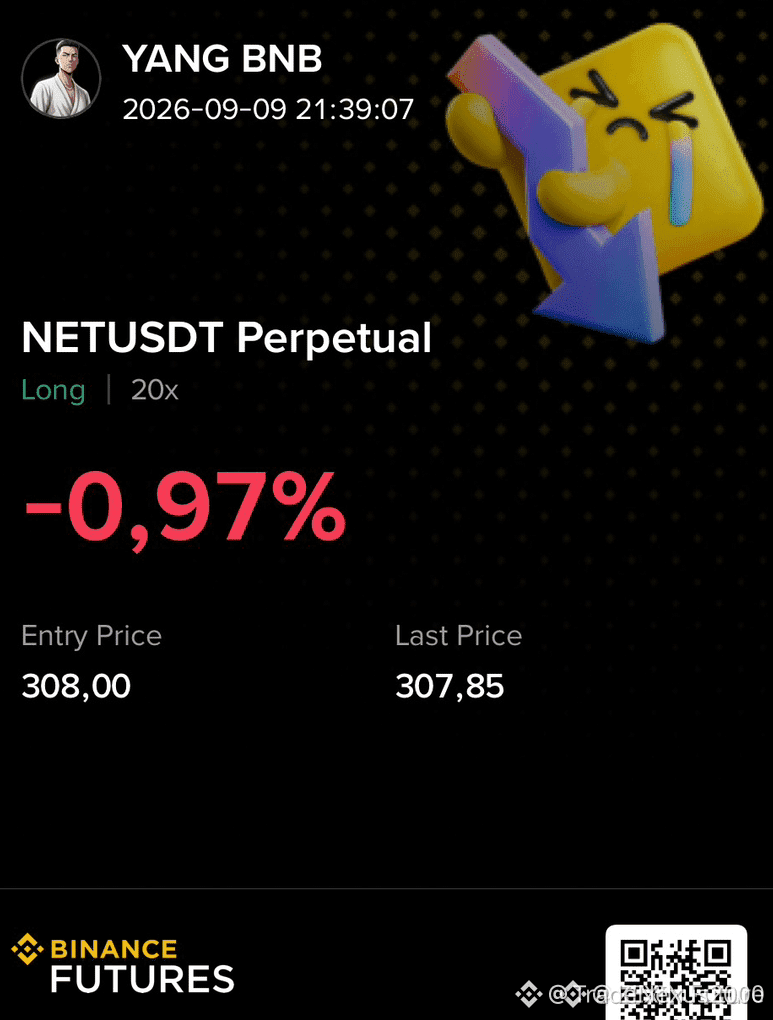
🚀 $NET UNLEASHES A MONEY‑PRINTING MACHINE! 🟢
Entry: 307.71 ⚡
Target: 379.59 🚀
Stop Loss: 294.22 ⚠️
📊 The order block anchored at 307.71 has already absorbed three rounds of seller pressure, signalling a deep smart‑money accumulation zone. 🌊 Liquidity hunters are being forced to the downside, leaving a pristine buying corridor that the next wave can ride with minimal friction. ⚡ Volume on the 4H chart is expanding, and the RSI is carving a bullish divergence, underscoring a potent inefficiency fill.
💡 With a risk‑to‑reward near 1:2.5, this setup rewards disciplined entries and disciplined exits. 🤔 Are you ready to ride the $NET surge or watching from the sidelines? 💬
⚠️ Not financial advice. Always manage your risk. 🛡️
🏷️ #NET #LongSetup #LiquiditySweep #HighRROpportunity #Crypto
🔥 💎
🚀 $NET UNLEASHES A MONEY‑PRINTING MACHINE! 🟢
Entry: 307.71 ⚡
Target: 379.59 🚀
Stop Loss: 294.22 ⚠️
📊 The order block anchored at 307.71 has already absorbed three rounds of seller pressure, signalling a deep smart‑money accumulation zone. 🌊 Liquidity hunters are being forced to the downside, leaving a pristine buying corridor that the next wave can ride with minimal friction. ⚡ Volume on the 4H chart is expanding, and the RSI is carving a bullish divergence, underscoring a potent inefficiency fill.
💡 With a risk‑to‑reward near 1:2.5, this setup rewards disciplined entries and disciplined exits. 🤔 Are you ready to ride the $NET surge or watching from the sidelines? 💬
⚠️ Not financial advice. Always manage your risk. 🛡️
🏷️ #NET #LongSetup #LiquiditySweep #HighRROpportunity #Crypto
🔥 💎
Entry: 307.71 ⚡
Target: 379.59 🚀
Stop Loss: 294.22 ⚠️
📊 The order block anchored at 307.71 has already absorbed three rounds of seller pressure, signalling a deep smart‑money accumulation zone. 🌊 Liquidity hunters are being forced to the downside, leaving a pristine buying corridor that the next wave can ride with minimal friction. ⚡ Volume on the 4H chart is expanding, and the RSI is carving a bullish divergence, underscoring a potent inefficiency fill.
💡 With a risk‑to‑reward near 1:2.5, this setup rewards disciplined entries and disciplined exits. 🤔 Are you ready to ride the $NET surge or watching from the sidelines? 💬
⚠️ Not financial advice. Always manage your risk. 🛡️
🏷️ #NET #LongSetup #LiquiditySweep #HighRROpportunity #Crypto
🔥 💎
105
·
--
$NET 24 hours, it surged 9.421%, the price topped out at 313.6, yet the funding rate is hovering at a negative -0.00097676. The old dog glanced at the data—this combo is kind of interesting: shorts are paying money to longs, a classic prelude to a short squeeze.
Why is it still shorts paying when the price is going up? The funding-rate rule is ironclad: when funding is negative, shorts are crowded and longs are collecting rent. With the price rising and funding negative, it suggests shorts are stubbornly refusing to close positions, but the market is forcing them to get liquidated. The OI (open interest) for $NET is stuck at 1785.59 with no obvious expansion. The rally may be driven by short-covering sell orders rather than a frenzy of new long entries. Trading volume is 2.98 million—not exactly “wealth in torrents,” but enough to stir prices in the liquidity pool of on-chain US stocks.
My take: this spike is fundamentally shorts cutting losses and managing risk, not a fundamentals-driven move. The market might be overlooking one detail: as $NET is a perps contract for on-chain “US stocks,” when funding stays negative long-term, arbitrageurs step in to go long spot and short the contracts to lock in profits—but now the price is surging hard. The arbitrageurs may reverse and close their shorts, creating a second push. The strongest counterargument is: if overall crypto market sentiment cools off, $NET’s upside could be quickly swallowed, especially since OI isn’t keeping up and the price base isn’t solid.
So who gets forced to act next? If shorts keep on hard-fighting, liquidation orders will stack above 313.6 and trigger a cascade. Some profitable longs may also get off around 313, adding selling pressure. The cost is borne by the shorts; liquidity is temporarily tilted toward longs. But once funding flips positive, the game rules reverse.
My action is clear: if the price holds above 313.6 and funding stays negative, I’ll follow with a small position. If the price breaks below 313, or funding suddenly turns positive, I’m out immediately—I’m not betting on a rebound. The failure condition is simple: if either of these signals appears, the old dog immediately admits being wrong and leaves.
Trading tag: #BinanceFutures #TradFi #USDⓈM #NET #NETUSDT $NET
$NET 24 hours, it surged 9.421%, the price topped out at 313.6, yet the funding rate is hovering at a negative -0.00097676. The old dog glanced at the data—this combo is kind of interesting: shorts are paying money to longs, a classic prelude to a short squeeze.
Why is it still shorts paying when the price is going up? The funding-rate rule is ironclad: when funding is negative, shorts are crowded and longs are collecting rent. With the price rising and funding negative, it suggests shorts are stubbornly refusing to close positions, but the market is forcing them to get liquidated. The OI (open interest) for $NET is stuck at 1785.59 with no obvious expansion. The rally may be driven by short-covering sell orders rather than a frenzy of new long entries. Trading volume is 2.98 million—not exactly “wealth in torrents,” but enough to stir prices in the liquidity pool of on-chain US stocks.
My take: this spike is fundamentally shorts cutting losses and managing risk, not a fundamentals-driven move. The market might be overlooking one detail: as $NET is a perps contract for on-chain “US stocks,” when funding stays negative long-term, arbitrageurs step in to go long spot and short the contracts to lock in profits—but now the price is surging hard. The arbitrageurs may reverse and close their shorts, creating a second push. The strongest counterargument is: if overall crypto market sentiment cools off, $NET ’s upside could be quickly swallowed, especially since OI isn’t keeping up and the price base isn’t solid.
So who gets forced to act next? If shorts keep on hard-fighting, liquidation orders will stack above 313.6 and trigger a cascade. Some profitable longs may also get off around 313, adding selling pressure. The cost is borne by the shorts; liquidity is temporarily tilted toward longs. But once funding flips positive, the game rules reverse.
My action is clear: if the price holds above 313.6 and funding stays negative, I’ll follow with a small position. If the price breaks below 313, or funding suddenly turns positive, I’m out immediately—I’m not betting on a rebound. The failure condition is simple: if either of these signals appears, the old dog immediately admits being wrong and leaves.
Trading tag: #BinanceFutures #TradFi #USDⓈM #NET #NETUSDT $NET
Why is it still shorts paying when the price is going up? The funding-rate rule is ironclad: when funding is negative, shorts are crowded and longs are collecting rent. With the price rising and funding negative, it suggests shorts are stubbornly refusing to close positions, but the market is forcing them to get liquidated. The OI (open interest) for $NET is stuck at 1785.59 with no obvious expansion. The rally may be driven by short-covering sell orders rather than a frenzy of new long entries. Trading volume is 2.98 million—not exactly “wealth in torrents,” but enough to stir prices in the liquidity pool of on-chain US stocks.
My take: this spike is fundamentally shorts cutting losses and managing risk, not a fundamentals-driven move. The market might be overlooking one detail: as $NET is a perps contract for on-chain “US stocks,” when funding stays negative long-term, arbitrageurs step in to go long spot and short the contracts to lock in profits—but now the price is surging hard. The arbitrageurs may reverse and close their shorts, creating a second push. The strongest counterargument is: if overall crypto market sentiment cools off, $NET ’s upside could be quickly swallowed, especially since OI isn’t keeping up and the price base isn’t solid.
So who gets forced to act next? If shorts keep on hard-fighting, liquidation orders will stack above 313.6 and trigger a cascade. Some profitable longs may also get off around 313, adding selling pressure. The cost is borne by the shorts; liquidity is temporarily tilted toward longs. But once funding flips positive, the game rules reverse.
My action is clear: if the price holds above 313.6 and funding stays negative, I’ll follow with a small position. If the price breaks below 313, or funding suddenly turns positive, I’m out immediately—I’m not betting on a rebound. The failure condition is simple: if either of these signals appears, the old dog immediately admits being wrong and leaves.
Trading tag: #BinanceFutures #TradFi #USDⓈM #NET #NETUSDT $NET
51
🚨 $NET SLIDES INTO DEEP SELL OFF, SHORT OPPORTUNITY! 📉
Entry: 314-316 ⚡
Target: 312, 309, 307 🚀
Stop Loss: 323 ⚠️
📊 The ATH peak just crumbled, and smart money is sweeping liquidity beneath the 316 zone. ⚡ Volume spikes on the 1H chart confirm a ruthless dump, while the order block at 314‑316 acts as a magnet for aggressive shorts. 🌊 With sellers dominating the tape, the next wave should hammer the 312 level hard, giving a clean ladder of targets.
💬 Are you locking in those bids before the liquidity vacuum deepens? 👇
⚠️ Not financial advice. Always manage your risk. 🛡️
🏷️ #NET #ShortSetup #LiquiditySweep #Crypto #Bearish
🚀 🔥
🚨 $NET SLIDES INTO DEEP SELL OFF, SHORT OPPORTUNITY! 📉
Entry: 314-316 ⚡
Target: 312, 309, 307 🚀
Stop Loss: 323 ⚠️
📊 The ATH peak just crumbled, and smart money is sweeping liquidity beneath the 316 zone. ⚡ Volume spikes on the 1H chart confirm a ruthless dump, while the order block at 314‑316 acts as a magnet for aggressive shorts. 🌊 With sellers dominating the tape, the next wave should hammer the 312 level hard, giving a clean ladder of targets.
💬 Are you locking in those bids before the liquidity vacuum deepens? 👇
⚠️ Not financial advice. Always manage your risk. 🛡️
🏷️ #NET #ShortSetup #LiquiditySweep #Crypto #Bearish
🚀 🔥
Entry: 314-316 ⚡
Target: 312, 309, 307 🚀
Stop Loss: 323 ⚠️
📊 The ATH peak just crumbled, and smart money is sweeping liquidity beneath the 316 zone. ⚡ Volume spikes on the 1H chart confirm a ruthless dump, while the order block at 314‑316 acts as a magnet for aggressive shorts. 🌊 With sellers dominating the tape, the next wave should hammer the 312 level hard, giving a clean ladder of targets.
💬 Are you locking in those bids before the liquidity vacuum deepens? 👇
⚠️ Not financial advice. Always manage your risk. 🛡️
🏷️ #NET #ShortSetup #LiquiditySweep #Crypto #Bearish
🚀 🔥
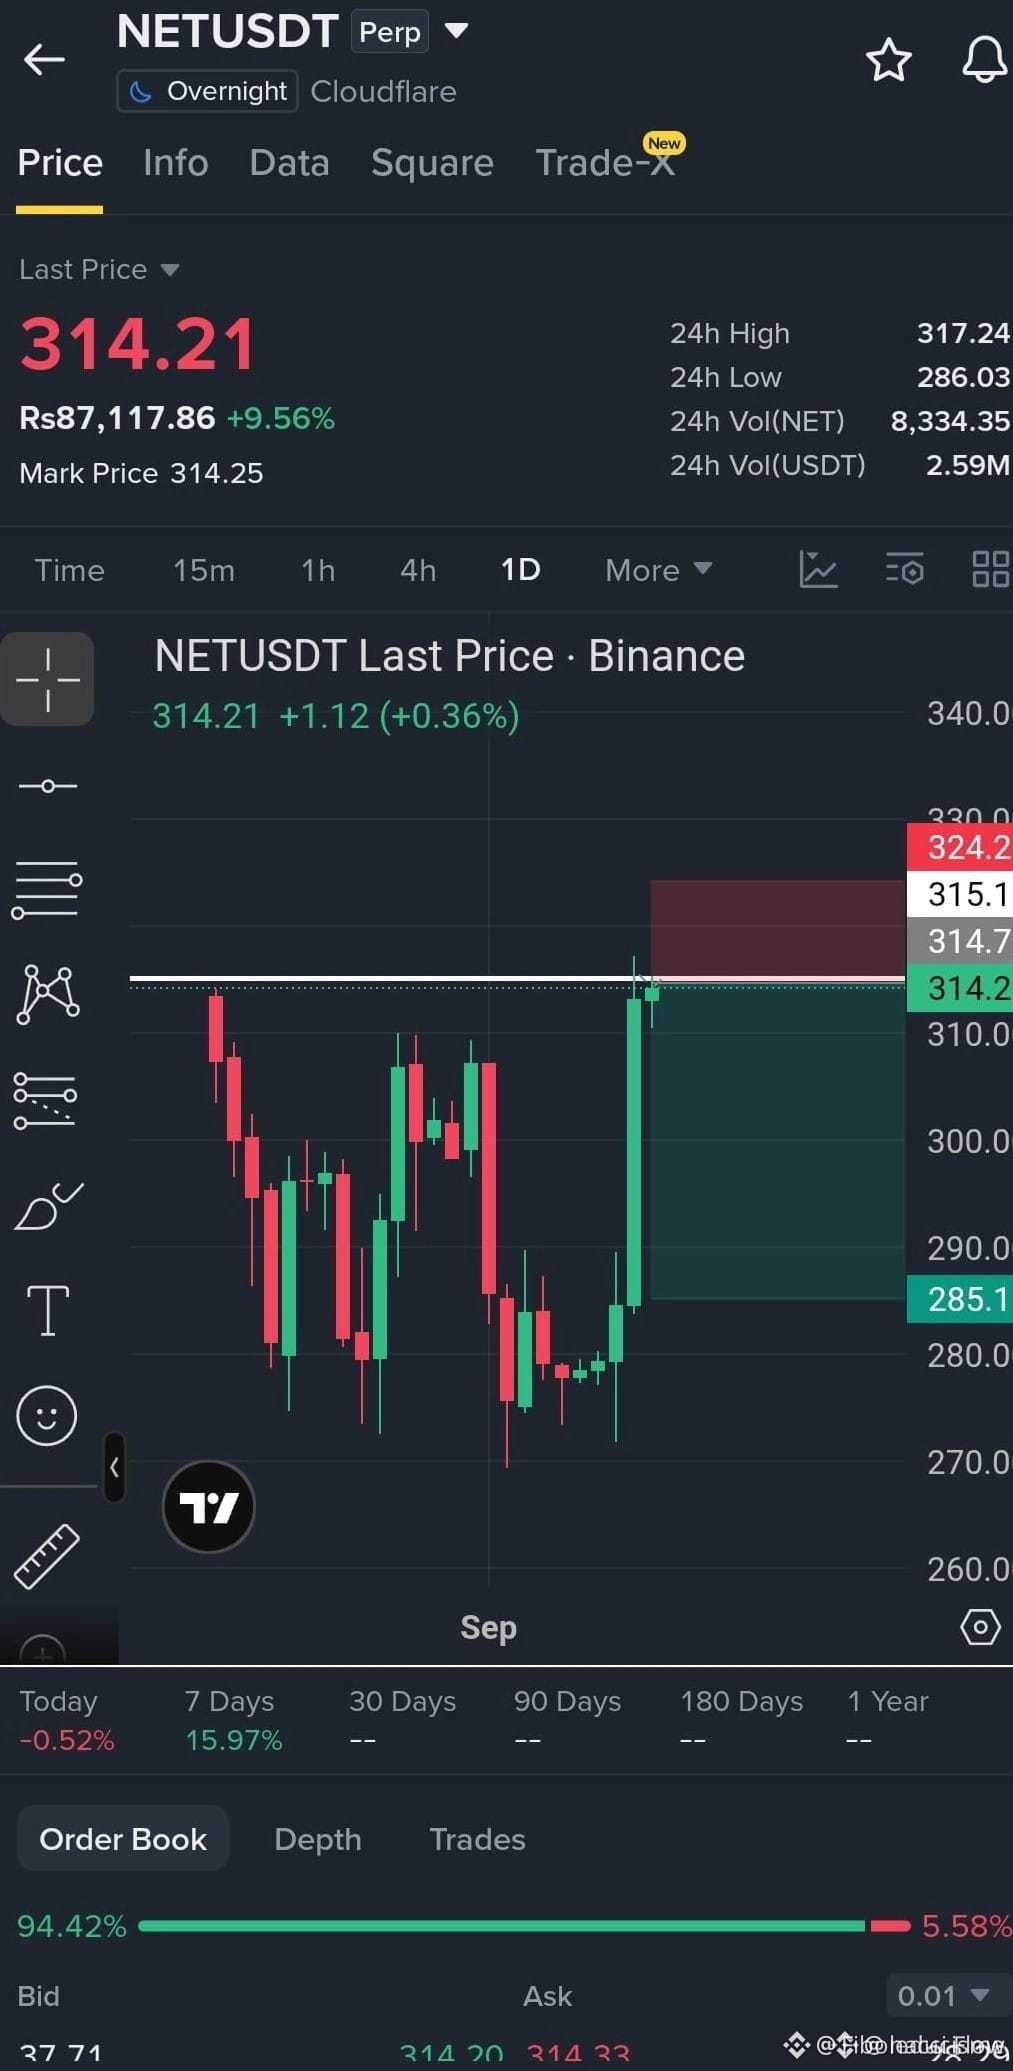
25

Price 313.77, up 9.744% in the past 24 hours. Funding rate: -0.00054360. Shorts are paying longs—price is rising. This is the classic short-squeeze trigger signal. In this $NET setup, the short side’s cost is being bled every day.
A negative funding rate plus a rising price means shorts are holding the bag, and they also have to pay the opposing side every 8 hours. The position size of 1360.44 isn’t huge by itself, but combined with the negative funding rate, it suggests shorts are relatively concentrated and unwilling to admit losses—they’re stubbornly holding. Once price breaks upward through a key psychological level, the stop-loss orders and liquidation orders from this batch of shorts will act like fuel and push the price higher. With uncertainty around Trump’s policies, capital is looking for assets with a short-term squeeze logic, not betting on a long-term narrative.
This single-signal conclusion comes from the funding-rate structure. The strongest opposing factor is long holders taking profits. The price has climbed nearly 10% in one day; if there’s no new buying afterward, early longs will start closing positions, and the upward momentum will quickly fade. Who is paying the cost? Right now, shorts are paying funding. Who will be forced to act? If the price keeps rising, shorts will face margin-top-up pressure and be forced to liquidate. Liquidity will first flow into the futures/contracts market to complete the liquidations, and only then might it spill over to spot.
Invalidation conditions are clear: price falls back below 310, or the funding rate turns positive. Dropping below 310 means the longs’ offensive fails and the short-term support level is invalidated. If the funding rate turns positive, it signals a reversal between longs and shorts—crowding builds on the long side and the squeeze logic ends.
Action: go long. Direction: long. Leverage: 10x. Stop-loss: 310.0. Take-profit: 330.0. Position size: 20% of total position. Price is currently 313.77; placing the stop at 310 is at the upper edge of the previous consolidation range. A break suggests this spike higher is a false breakout. Take-profit at 330 is a round-number level and also a prior minor resistance zone.
Three scenarios: an aggressive approach—enter with 10x long at the current price, stop-loss at 310, betting on accelerated short squeeze. A more conservative approach—wait for a pullback near 312, then enter with reduced leverage to 5x and keep the same stop at 310. A risk-avoidance approach—don’t chase price; wait until the funding rate turns positive or price breaks below 310 before considering the opposite short.
I’m against the market consensus that says you have to chase when volatility is high. In this $NET move up, it’s simply shorts with negative funding rates continuing to pay for the longs.
Trading tag: #TradFi #链上美股 #NET
Where do you think this setup is most likely to be wrong?
Price 313.77, up 9.744% in the past 24 hours. Funding rate: -0.00054360. Shorts are paying longs—price is rising. This is the classic short-squeeze trigger signal. In this $NET setup, the short side’s cost is being bled every day.
A negative funding rate plus a rising price means shorts are holding the bag, and they also have to pay the opposing side every 8 hours. The position size of 1360.44 isn’t huge by itself, but combined with the negative funding rate, it suggests shorts are relatively concentrated and unwilling to admit losses—they’re stubbornly holding. Once price breaks upward through a key psychological level, the stop-loss orders and liquidation orders from this batch of shorts will act like fuel and push the price higher. With uncertainty around Trump’s policies, capital is looking for assets with a short-term squeeze logic, not betting on a long-term narrative.
This single-signal conclusion comes from the funding-rate structure. The strongest opposing factor is long holders taking profits. The price has climbed nearly 10% in one day; if there’s no new buying afterward, early longs will start closing positions, and the upward momentum will quickly fade. Who is paying the cost? Right now, shorts are paying funding. Who will be forced to act? If the price keeps rising, shorts will face margin-top-up pressure and be forced to liquidate. Liquidity will first flow into the futures/contracts market to complete the liquidations, and only then might it spill over to spot.
Invalidation conditions are clear: price falls back below 310, or the funding rate turns positive. Dropping below 310 means the longs’ offensive fails and the short-term support level is invalidated. If the funding rate turns positive, it signals a reversal between longs and shorts—crowding builds on the long side and the squeeze logic ends.
Action: go long. Direction: long. Leverage: 10x. Stop-loss: 310.0. Take-profit: 330.0. Position size: 20% of total position. Price is currently 313.77; placing the stop at 310 is at the upper edge of the previous consolidation range. A break suggests this spike higher is a false breakout. Take-profit at 330 is a round-number level and also a prior minor resistance zone.
Three scenarios: an aggressive approach—enter with 10x long at the current price, stop-loss at 310, betting on accelerated short squeeze. A more conservative approach—wait for a pullback near 312, then enter with reduced leverage to 5x and keep the same stop at 310. A risk-avoidance approach—don’t chase price; wait until the funding rate turns positive or price breaks below 310 before considering the opposite short.
I’m against the market consensus that says you have to chase when volatility is high. In this $NET move up, it’s simply shorts with negative funding rates continuing to pay for the longs.
Trading tag: #TradFi #链上美股 #NET
Where do you think this setup is most likely to be wrong?
A negative funding rate plus a rising price means shorts are holding the bag, and they also have to pay the opposing side every 8 hours. The position size of 1360.44 isn’t huge by itself, but combined with the negative funding rate, it suggests shorts are relatively concentrated and unwilling to admit losses—they’re stubbornly holding. Once price breaks upward through a key psychological level, the stop-loss orders and liquidation orders from this batch of shorts will act like fuel and push the price higher. With uncertainty around Trump’s policies, capital is looking for assets with a short-term squeeze logic, not betting on a long-term narrative.
This single-signal conclusion comes from the funding-rate structure. The strongest opposing factor is long holders taking profits. The price has climbed nearly 10% in one day; if there’s no new buying afterward, early longs will start closing positions, and the upward momentum will quickly fade. Who is paying the cost? Right now, shorts are paying funding. Who will be forced to act? If the price keeps rising, shorts will face margin-top-up pressure and be forced to liquidate. Liquidity will first flow into the futures/contracts market to complete the liquidations, and only then might it spill over to spot.
Invalidation conditions are clear: price falls back below 310, or the funding rate turns positive. Dropping below 310 means the longs’ offensive fails and the short-term support level is invalidated. If the funding rate turns positive, it signals a reversal between longs and shorts—crowding builds on the long side and the squeeze logic ends.
Action: go long. Direction: long. Leverage: 10x. Stop-loss: 310.0. Take-profit: 330.0. Position size: 20% of total position. Price is currently 313.77; placing the stop at 310 is at the upper edge of the previous consolidation range. A break suggests this spike higher is a false breakout. Take-profit at 330 is a round-number level and also a prior minor resistance zone.
Three scenarios: an aggressive approach—enter with 10x long at the current price, stop-loss at 310, betting on accelerated short squeeze. A more conservative approach—wait for a pullback near 312, then enter with reduced leverage to 5x and keep the same stop at 310. A risk-avoidance approach—don’t chase price; wait until the funding rate turns positive or price breaks below 310 before considering the opposite short.
I’m against the market consensus that says you have to chase when volatility is high. In this $NET move up, it’s simply shorts with negative funding rates continuing to pay for the longs.
Trading tag: #TradFi #链上美股 #NET
Where do you think this setup is most likely to be wrong?
10

·
--
$NET fell 6.55% over the past 24 hours, while the funding rate remained at zero during the same period. Prices are moving downward, but the funding rate shows no reaction. This suggests that the shorts are not actively entering to build positions, and the downside momentum may be driven more by spot sell pressure.
Without funding compensation, the shorts’ holding costs are actually not low. If the price continues to trade sideways at this level, without further panic selling, shorts may close positions in advance to lock in profits—ultimately creating short-term buy pressure.
This is based on a single-signal inference. The underlying logic premise is that shorts also need profit-driven incentives.
Trading tag: #TradFi #链上美股 #NET
Where do you think this judgment is most likely to be wrong?
$NET fell 6.55% over the past 24 hours, while the funding rate remained at zero during the same period. Prices are moving downward, but the funding rate shows no reaction. This suggests that the shorts are not actively entering to build positions, and the downside momentum may be driven more by spot sell pressure.
Without funding compensation, the shorts’ holding costs are actually not low. If the price continues to trade sideways at this level, without further panic selling, shorts may close positions in advance to lock in profits—ultimately creating short-term buy pressure.
This is based on a single-signal inference. The underlying logic premise is that shorts also need profit-driven incentives.
Trading tag: #TradFi #链上美股 #NET
Where do you think this judgment is most likely to be wrong?
Without funding compensation, the shorts’ holding costs are actually not low. If the price continues to trade sideways at this level, without further panic selling, shorts may close positions in advance to lock in profits—ultimately creating short-term buy pressure.
This is based on a single-signal inference. The underlying logic premise is that shorts also need profit-driven incentives.
Trading tag: #TradFi #链上美股 #NET
Where do you think this judgment is most likely to be wrong?
11
·
--
[M1_mag7]
$NET 24 hours down 6.588%, with open interest only 866.03. As one of the on-chain US Mag7 anchors, this drop and such a thin position look a bit out of place within the sector.
The funding rate is 0; the market is currently balanced between long and short. But the price is actually moving down, indicating that buy orders at the 286.28 level can’t absorb the sell pressure. Under the Mag7 anchor narrative, if other instruments hold steady, then $NET underperforming and falling could mean that capital is actively avoiding this asset—or that there is some specific negative news weighing on it.
Trading tag: #BinanceFutures #TradFi #USDⓈM #NET #NETUSDT $NET
[M1_mag7]
$NET 24 hours down 6.588%, with open interest only 866.03. As one of the on-chain US Mag7 anchors, this drop and such a thin position look a bit out of place within the sector.
The funding rate is 0; the market is currently balanced between long and short. But the price is actually moving down, indicating that buy orders at the 286.28 level can’t absorb the sell pressure. Under the Mag7 anchor narrative, if other instruments hold steady, then $NET underperforming and falling could mean that capital is actively avoiding this asset—or that there is some specific negative news weighing on it.
Trading tag: #BinanceFutures #TradFi #USDⓈM #NET #NETUSDT $NET
$NET 24 hours down 6.588%, with open interest only 866.03. As one of the on-chain US Mag7 anchors, this drop and such a thin position look a bit out of place within the sector.
The funding rate is 0; the market is currently balanced between long and short. But the price is actually moving down, indicating that buy orders at the 286.28 level can’t absorb the sell pressure. Under the Mag7 anchor narrative, if other instruments hold steady, then $NET underperforming and falling could mean that capital is actively avoiding this asset—or that there is some specific negative news weighing on it.
Trading tag: #BinanceFutures #TradFi #USDⓈM #NET #NETUSDT $NET
25

·
--
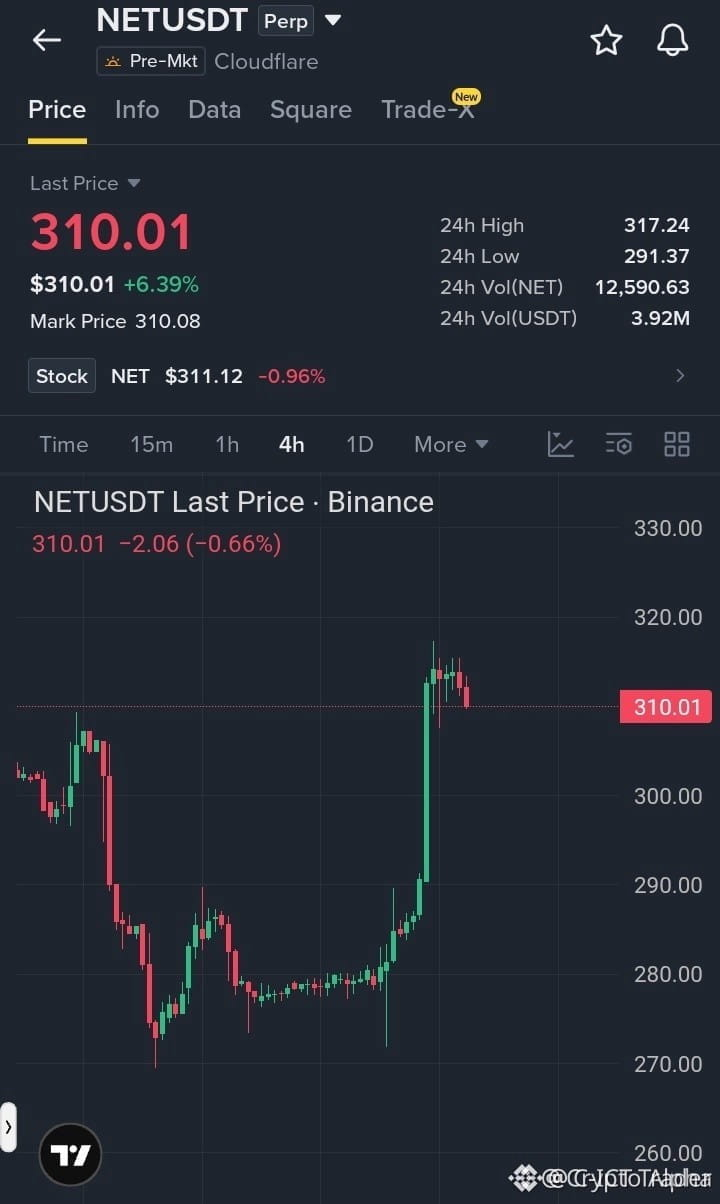
🔴 $NET REJECTED AT $315 – SELLERS HOLDING THE REINFORCE! 🦈
Entry: 311‑313 ⚡
Target: 308 🚀
Stop Loss: 317 ⚠️
📊 The order block just above $315 has been fiercely defended, signaling smart‑money liquidity defense. 🦈 Volume spikes on the 4H confirm a short‑bias, while the price’s inability to breach the ceiling hints at an imminent pullback. 📌 A clean $3‑$5 move to the next demand zones aligns with the institutional sell ladder.
💬 Do you see the next liquidity sweep unfolding below $308? 👇
⚠️ Not financial advice. Always manage your risk. 🛡️
🏷️ #NET #ShortSetup #Liquidity #Crypto
🦈 🔥
🔴 $NET REJECTED AT $315 – SELLERS HOLDING THE REINFORCE! 🦈
Entry: 311‑313 ⚡
Target: 308 🚀
Stop Loss: 317 ⚠️
📊 The order block just above $315 has been fiercely defended, signaling smart‑money liquidity defense. 🦈 Volume spikes on the 4H confirm a short‑bias, while the price’s inability to breach the ceiling hints at an imminent pullback. 📌 A clean $3‑$5 move to the next demand zones aligns with the institutional sell ladder.
💬 Do you see the next liquidity sweep unfolding below $308? 👇
⚠️ Not financial advice. Always manage your risk. 🛡️
🏷️ #NET #ShortSetup #Liquidity #Crypto
🦈 🔥
Entry: 311‑313 ⚡
Target: 308 🚀
Stop Loss: 317 ⚠️
📊 The order block just above $315 has been fiercely defended, signaling smart‑money liquidity defense. 🦈 Volume spikes on the 4H confirm a short‑bias, while the price’s inability to breach the ceiling hints at an imminent pullback. 📌 A clean $3‑$5 move to the next demand zones aligns with the institutional sell ladder.
💬 Do you see the next liquidity sweep unfolding below $308? 👇
⚠️ Not financial advice. Always manage your risk. 🛡️
🏷️ #NET #ShortSetup #Liquidity #Crypto
🦈 🔥
46

·
--
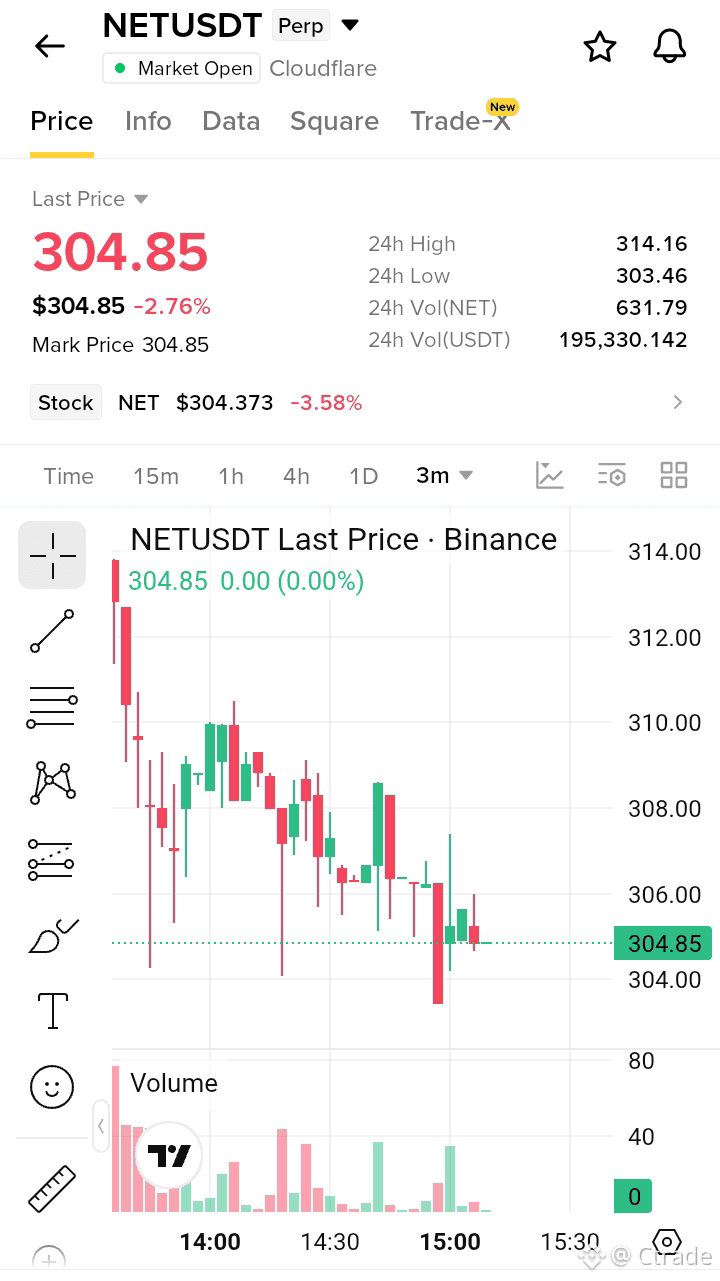
$NET latest market update 🚀
Long/Short: Ranging
Entry: 306.6410–309.5990
Stop Loss: 305.1620
Targets: 311.2012/313.6662/316.7474
Analysis: Oh my, this market is really slapping me across the face—where’s the trend we were promised? The EMA line looks like it’s about to fall asleep. And 308.17 and 307.94 are just crossing in this awkward, ambiguous way. RiS has only just crossed above the 50 line too—if this doesn’t grind you down, then I’d honestly start doubting my life. That said, we still need to move the stop-loss up: don’t think 305.16 can be reclaimed—let’s be extra cautious. After all, we’re not gods; who can guarantee the market won’t suddenly do a 180-degree reversal?
Risk Warning: Recommended Stop Loss: 305.162048. Please adjust your position according to your own risk tolerance.
#NET
$NET latest market update 🚀
Long/Short: Ranging
Entry: 306.6410–309.5990
Stop Loss: 305.1620
Targets: 311.2012/313.6662/316.7474
Analysis: Oh my, this market is really slapping me across the face—where’s the trend we were promised? The EMA line looks like it’s about to fall asleep. And 308.17 and 307.94 are just crossing in this awkward, ambiguous way. RiS has only just crossed above the 50 line too—if this doesn’t grind you down, then I’d honestly start doubting my life. That said, we still need to move the stop-loss up: don’t think 305.16 can be reclaimed—let’s be extra cautious. After all, we’re not gods; who can guarantee the market won’t suddenly do a 180-degree reversal?
Risk Warning: Recommended Stop Loss: 305.162048. Please adjust your position according to your own risk tolerance.
#NET
Long/Short: Ranging
Entry: 306.6410–309.5990
Stop Loss: 305.1620
Targets: 311.2012/313.6662/316.7474
Analysis: Oh my, this market is really slapping me across the face—where’s the trend we were promised? The EMA line looks like it’s about to fall asleep. And 308.17 and 307.94 are just crossing in this awkward, ambiguous way. RiS has only just crossed above the 50 line too—if this doesn’t grind you down, then I’d honestly start doubting my life. That said, we still need to move the stop-loss up: don’t think 305.16 can be reclaimed—let’s be extra cautious. After all, we’re not gods; who can guarantee the market won’t suddenly do a 180-degree reversal?
Risk Warning: Recommended Stop Loss: 305.162048. Please adjust your position according to your own risk tolerance.
#NET
21

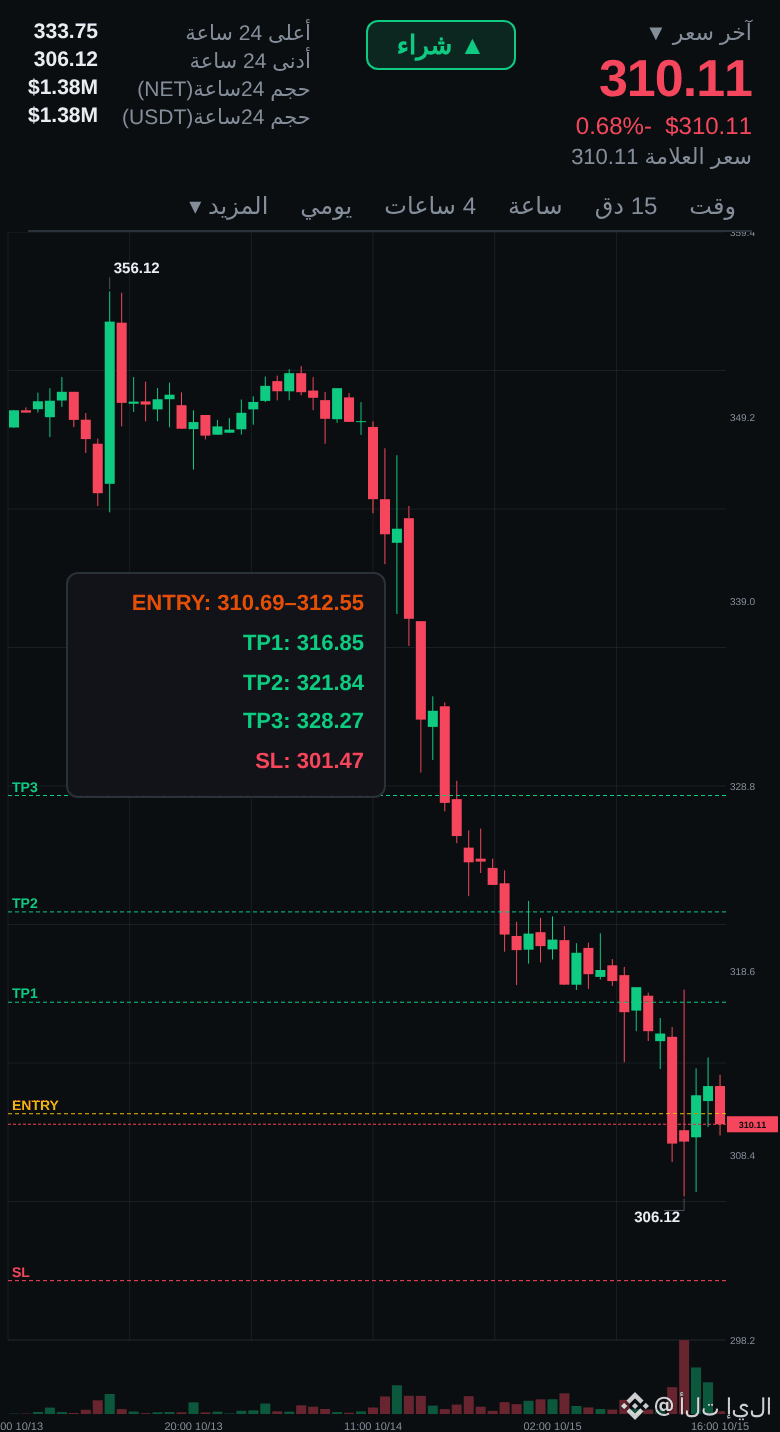
🚨 $NET/USDT FUTURES SIGNAL 🔥
$NET is showing strong upside momentum, currently around $308.83.
📊 SIGNAL: 🟢 LONG
🎯 Entry Zone: $303 – $309
🛑 Stop Loss: $294
🎯 TP1: $320
🎯 TP2: $332
🎯 TP3: $345
✅ Confirmation:
Enter only after price holds the entry zone with strong buying volume.
⚠️ Below $294 = setup invalidation.
💡 If price pumps directly toward TP1, wait for a retest instead of chasing.
#NET #cryptotrading #futures #TradingSignals #BinanceSquare
🚨 $NET/USDT FUTURES SIGNAL 🔥
$NET is showing strong upside momentum, currently around $308.83.
📊 SIGNAL: 🟢 LONG
🎯 Entry Zone: $303 – $309
🛑 Stop Loss: $294
🎯 TP1: $320
🎯 TP2: $332
🎯 TP3: $345
✅ Confirmation:
Enter only after price holds the entry zone with strong buying volume.
⚠️ Below $294 = setup invalidation.
💡 If price pumps directly toward TP1, wait for a retest instead of chasing.
#NET #cryptotrading #futures #TradingSignals #BinanceSquare
$NET is showing strong upside momentum, currently around $308.83.
📊 SIGNAL: 🟢 LONG
🎯 Entry Zone: $303 – $309
🛑 Stop Loss: $294
🎯 TP1: $320
🎯 TP2: $332
🎯 TP3: $345
✅ Confirmation:
Enter only after price holds the entry zone with strong buying volume.
⚠️ Below $294 = setup invalidation.
💡 If price pumps directly toward TP1, wait for a retest instead of chasing.
#NET #cryptotrading #futures #TradingSignals #BinanceSquare
62

·
--
In the past 24 hours, $NET has fallen 6.33%, while the funding rate remains at 0—this is a silent state where both longs and shorts are too afraid to make a bet.
The core contradiction behind the Trump trade is reflected here: the policy’s impact on the supply chains of tech stocks. Reports show that the new tariff policy has seriously affected the supply chains of large technology companies, and as an on-chain tech-stock benchmark, $NET is directly under pressure. Prices are falling, but the funding rate is 0, which suggests that the shorts are probing—while the longs haven’t been forced into a position where they must surrender. The market is waiting for a clear signal, such as the tariff policy being further implemented or a tangible deterioration in corporate earnings.
$NET’s current position size is not high and liquidity is average, meaning that once a directional signal appears, price volatility could be quite intense. My view is that the shorts are temporarily in a better position, but they haven’t yet formed a crushing force. If the price continues to grind lower from its current level, it may attract more shorts, potentially accelerating the drop.
I will watch whether $NET breaks below 280, the lower edge of this prior consolidation range. If it does, I’ll consider taking a small short position on a rebound, with a stop-loss set above 290. If the price holds steady and rebounds above 295, it would indicate that the short-side strength is insufficient, and I’ll exit to observe.
Trading tag: #TradFi #链上美股 #NET
Where do you think this assessment is most likely to be wrong?
In the past 24 hours, $NET has fallen 6.33%, while the funding rate remains at 0—this is a silent state where both longs and shorts are too afraid to make a bet.
The core contradiction behind the Trump trade is reflected here: the policy’s impact on the supply chains of tech stocks. Reports show that the new tariff policy has seriously affected the supply chains of large technology companies, and as an on-chain tech-stock benchmark, $NET is directly under pressure. Prices are falling, but the funding rate is 0, which suggests that the shorts are probing—while the longs haven’t been forced into a position where they must surrender. The market is waiting for a clear signal, such as the tariff policy being further implemented or a tangible deterioration in corporate earnings.
$NET ’s current position size is not high and liquidity is average, meaning that once a directional signal appears, price volatility could be quite intense. My view is that the shorts are temporarily in a better position, but they haven’t yet formed a crushing force. If the price continues to grind lower from its current level, it may attract more shorts, potentially accelerating the drop.
I will watch whether $NET breaks below 280, the lower edge of this prior consolidation range. If it does, I’ll consider taking a small short position on a rebound, with a stop-loss set above 290. If the price holds steady and rebounds above 295, it would indicate that the short-side strength is insufficient, and I’ll exit to observe.
Trading tag: #TradFi #链上美股 #NET
Where do you think this assessment is most likely to be wrong?
The core contradiction behind the Trump trade is reflected here: the policy’s impact on the supply chains of tech stocks. Reports show that the new tariff policy has seriously affected the supply chains of large technology companies, and as an on-chain tech-stock benchmark, $NET is directly under pressure. Prices are falling, but the funding rate is 0, which suggests that the shorts are probing—while the longs haven’t been forced into a position where they must surrender. The market is waiting for a clear signal, such as the tariff policy being further implemented or a tangible deterioration in corporate earnings.
$NET ’s current position size is not high and liquidity is average, meaning that once a directional signal appears, price volatility could be quite intense. My view is that the shorts are temporarily in a better position, but they haven’t yet formed a crushing force. If the price continues to grind lower from its current level, it may attract more shorts, potentially accelerating the drop.
I will watch whether $NET breaks below 280, the lower edge of this prior consolidation range. If it does, I’ll consider taking a small short position on a rebound, with a stop-loss set above 290. If the price holds steady and rebounds above 295, it would indicate that the short-side strength is insufficient, and I’ll exit to observe.
Trading tag: #TradFi #链上美股 #NET
Where do you think this assessment is most likely to be wrong?
41
·
--
Old Dog glanced at the order book. $NET has fallen 1.723% over the past 24 hours, the price is 277.71, open interest is stuck at 910.66 contracts, and the funding rate is 0. When the spot price of an asset falls, the contract funding rate goes to zero, and neither longs nor shorts are paying the other side for now. That means short-term speculative forces have dispersed, and no one is betting against the direction.
On the semiconductor/AI chain, $NET ’s move this time is a micro-cycle pullback. Other names in the same sector had no data today, but Old Dog knows these kinds of assets fear narrative vacuum periods the most. Now that price has pulled back, open interest hasn’t contracted, and the funding rate is flat, this is a classic state of longs waiting and shorts not yet launching an attack. The market is either waiting for the next catalyst or digesting the unrealized gains from the previous rally. From the iron rule of funding rates, a zero rate means there are no overcrowded longs forced to pay, and no pressure from shorts being squeezed; the market has temporarily entered a stalemate.
My judgment is that this area leans toward choppy consolidation that wears people down. If you have a position, 277.71 is a point to watch. If it breaks below 270, I may reduce some, because open interest is still there and further downside in price could easily trigger a chain of stop-losses. If it can break above 285 on volume, I’ll consider adding back, which would mean longs are re-entering. Before there is a second confirmation, I choose to observe with half a position, neither adding nor reducing. The contrarian view is that some may think zero funding is a healthy correction, but I believe that without external news, this balance can be broken by one large bearish candle, and reverse acceleration often comes quickly.
The most likely place this judgment could be wrong is a sudden positive catalyst. For example, if the semiconductor industry lands a major order, or AI compute demand unexpectedly surges and directly lifts $NET, then this consolidation would just be a continuation pattern in an uptrend. If such a signal appears, the earlier plan to reduce positions becomes void immediately, and I’ll switch to looking for opportunities to add.
Trading tags: #BinanceFutures #TradFi #USDⓈM #NET #NETUSDT $NET
Old Dog glanced at the order book. $NET has fallen 1.723% over the past 24 hours, the price is 277.71, open interest is stuck at 910.66 contracts, and the funding rate is 0. When the spot price of an asset falls, the contract funding rate goes to zero, and neither longs nor shorts are paying the other side for now. That means short-term speculative forces have dispersed, and no one is betting against the direction.
On the semiconductor/AI chain, $NET ’s move this time is a micro-cycle pullback. Other names in the same sector had no data today, but Old Dog knows these kinds of assets fear narrative vacuum periods the most. Now that price has pulled back, open interest hasn’t contracted, and the funding rate is flat, this is a classic state of longs waiting and shorts not yet launching an attack. The market is either waiting for the next catalyst or digesting the unrealized gains from the previous rally. From the iron rule of funding rates, a zero rate means there are no overcrowded longs forced to pay, and no pressure from shorts being squeezed; the market has temporarily entered a stalemate.
My judgment is that this area leans toward choppy consolidation that wears people down. If you have a position, 277.71 is a point to watch. If it breaks below 270, I may reduce some, because open interest is still there and further downside in price could easily trigger a chain of stop-losses. If it can break above 285 on volume, I’ll consider adding back, which would mean longs are re-entering. Before there is a second confirmation, I choose to observe with half a position, neither adding nor reducing. The contrarian view is that some may think zero funding is a healthy correction, but I believe that without external news, this balance can be broken by one large bearish candle, and reverse acceleration often comes quickly.
The most likely place this judgment could be wrong is a sudden positive catalyst. For example, if the semiconductor industry lands a major order, or AI compute demand unexpectedly surges and directly lifts $NET , then this consolidation would just be a continuation pattern in an uptrend. If such a signal appears, the earlier plan to reduce positions becomes void immediately, and I’ll switch to looking for opportunities to add.
Trading tags: #BinanceFutures #TradFi #USDⓈM #NET #NETUSDT $NET
On the semiconductor/AI chain, $NET ’s move this time is a micro-cycle pullback. Other names in the same sector had no data today, but Old Dog knows these kinds of assets fear narrative vacuum periods the most. Now that price has pulled back, open interest hasn’t contracted, and the funding rate is flat, this is a classic state of longs waiting and shorts not yet launching an attack. The market is either waiting for the next catalyst or digesting the unrealized gains from the previous rally. From the iron rule of funding rates, a zero rate means there are no overcrowded longs forced to pay, and no pressure from shorts being squeezed; the market has temporarily entered a stalemate.
My judgment is that this area leans toward choppy consolidation that wears people down. If you have a position, 277.71 is a point to watch. If it breaks below 270, I may reduce some, because open interest is still there and further downside in price could easily trigger a chain of stop-losses. If it can break above 285 on volume, I’ll consider adding back, which would mean longs are re-entering. Before there is a second confirmation, I choose to observe with half a position, neither adding nor reducing. The contrarian view is that some may think zero funding is a healthy correction, but I believe that without external news, this balance can be broken by one large bearish candle, and reverse acceleration often comes quickly.
The most likely place this judgment could be wrong is a sudden positive catalyst. For example, if the semiconductor industry lands a major order, or AI compute demand unexpectedly surges and directly lifts $NET , then this consolidation would just be a continuation pattern in an uptrend. If such a signal appears, the earlier plan to reduce positions becomes void immediately, and I’ll switch to looking for opportunities to add.
Trading tags: #BinanceFutures #TradFi #USDⓈM #NET #NETUSDT $NET
22

·
--
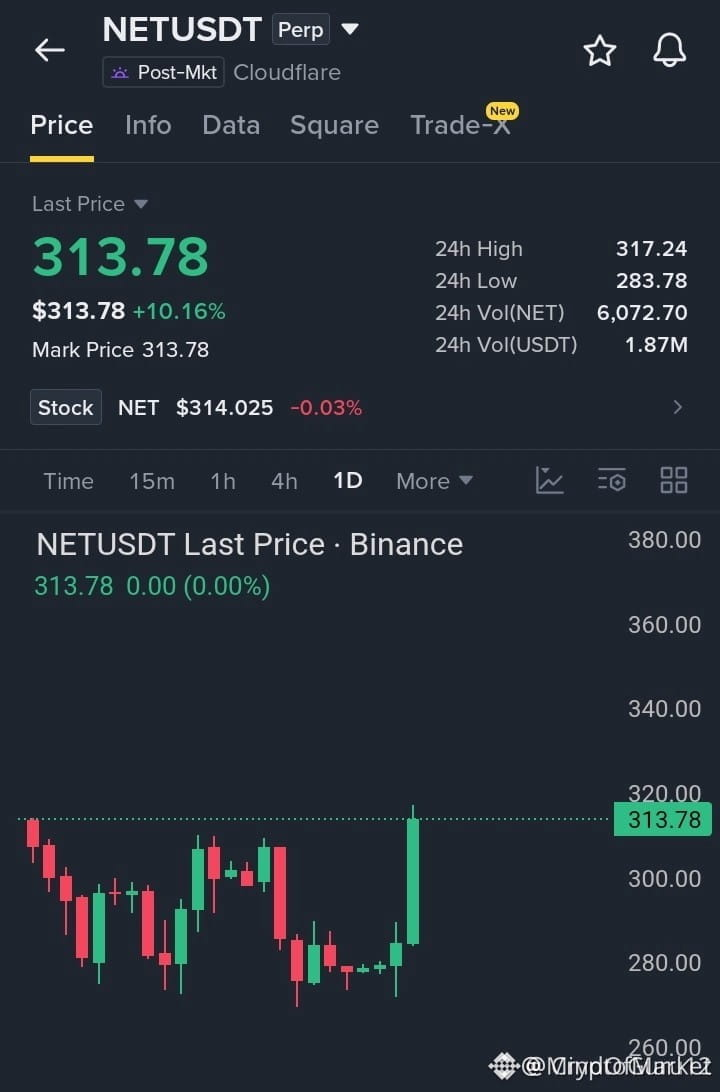
🚀 $NET BREAKING THROUGH RESISTANCE, EYES ON $320 CLIMB! 📈
Entry: 305-314 ⚡
Target: 320 🚀
Stop Loss: 298 ⚠️
📊 The 1D chart shows a classic liquidity sweep: buyers absorbed the $275‑$285 demand zone and thrust price to $314, testing the $317‑$320 order block. 🌊 A clean close above $320 signals smart‑money accumulation and clears the path to the next upside tier. 📌 Should the market pull back, the $300 area acts as the first defensive line, but the bias remains aggressively bullish.
💬 Are you positioning $NET for a breakout beyond $320? 👇
⚠️ Not financial advice. Always manage your risk. 🛡️
🏷️ #NET #LongSetup #Breakout #Crypto
🔥 💎
🚀 $NET BREAKING THROUGH RESISTANCE, EYES ON $320 CLIMB! 📈
Entry: 305-314 ⚡
Target: 320 🚀
Stop Loss: 298 ⚠️
📊 The 1D chart shows a classic liquidity sweep: buyers absorbed the $275‑$285 demand zone and thrust price to $314, testing the $317‑$320 order block. 🌊 A clean close above $320 signals smart‑money accumulation and clears the path to the next upside tier. 📌 Should the market pull back, the $300 area acts as the first defensive line, but the bias remains aggressively bullish.
💬 Are you positioning $NET for a breakout beyond $320? 👇
⚠️ Not financial advice. Always manage your risk. 🛡️
🏷️ #NET #LongSetup #Breakout #Crypto
🔥 💎
Entry: 305-314 ⚡
Target: 320 🚀
Stop Loss: 298 ⚠️
📊 The 1D chart shows a classic liquidity sweep: buyers absorbed the $275‑$285 demand zone and thrust price to $314, testing the $317‑$320 order block. 🌊 A clean close above $320 signals smart‑money accumulation and clears the path to the next upside tier. 📌 Should the market pull back, the $300 area acts as the first defensive line, but the bias remains aggressively bullish.
💬 Are you positioning $NET for a breakout beyond $320? 👇
⚠️ Not financial advice. Always manage your risk. 🛡️
🏷️ #NET #LongSetup #Breakout #Crypto
🔥 💎
39
Log in to explore more content
Join global crypto users on Binance Square
⚡️ Get latest and useful information about crypto.
💬 Trusted by the world’s largest crypto exchange.
👍 Discover real insights from verified creators.
Email / Phone number
Trending Topics
1
#BinancePick
3.1M views
152,868 Discussing
2
#EarningsSeason
5.3M views
26,007 Discussing
3
#AnthropicTTMRevenueGrewAbout1200%
29,072 views
424 Discussing
4
#AnthropicS1ExpectedToday
25,714 views
351 Discussing
5
#SouthKoreaReportedlyWeighsFourthCryptoTaxDelay
30,183 views
473 Discussing
6
#FranklinTempletonFilesForTwoDividendToBitcoinETFs
39,779 views
544 Discussing
7
#StrategyMSTRSurpassesNasdaqInMarketCap
30,172 views
387 Discussing
8
#CanadaProposesStablecoinRedemptionWithin3BusinessDays
1,320 views
36 Discussing
9
#ElectrumWalletBugLetRogueServersStealFunds
30,934 views
464 Discussing
10
#ArgentineCourtDismissesLIBRACaseAgainstMilei
46,326 views
582 Discussing