
#cryptocomparison
cryptocomparison
87,995 views
298 Discussing
Hot
Latest

⚔️ Fiery Showdown: Titans Clash This Weekend... Will the liquidity of $BTC crush altcoin dreams?
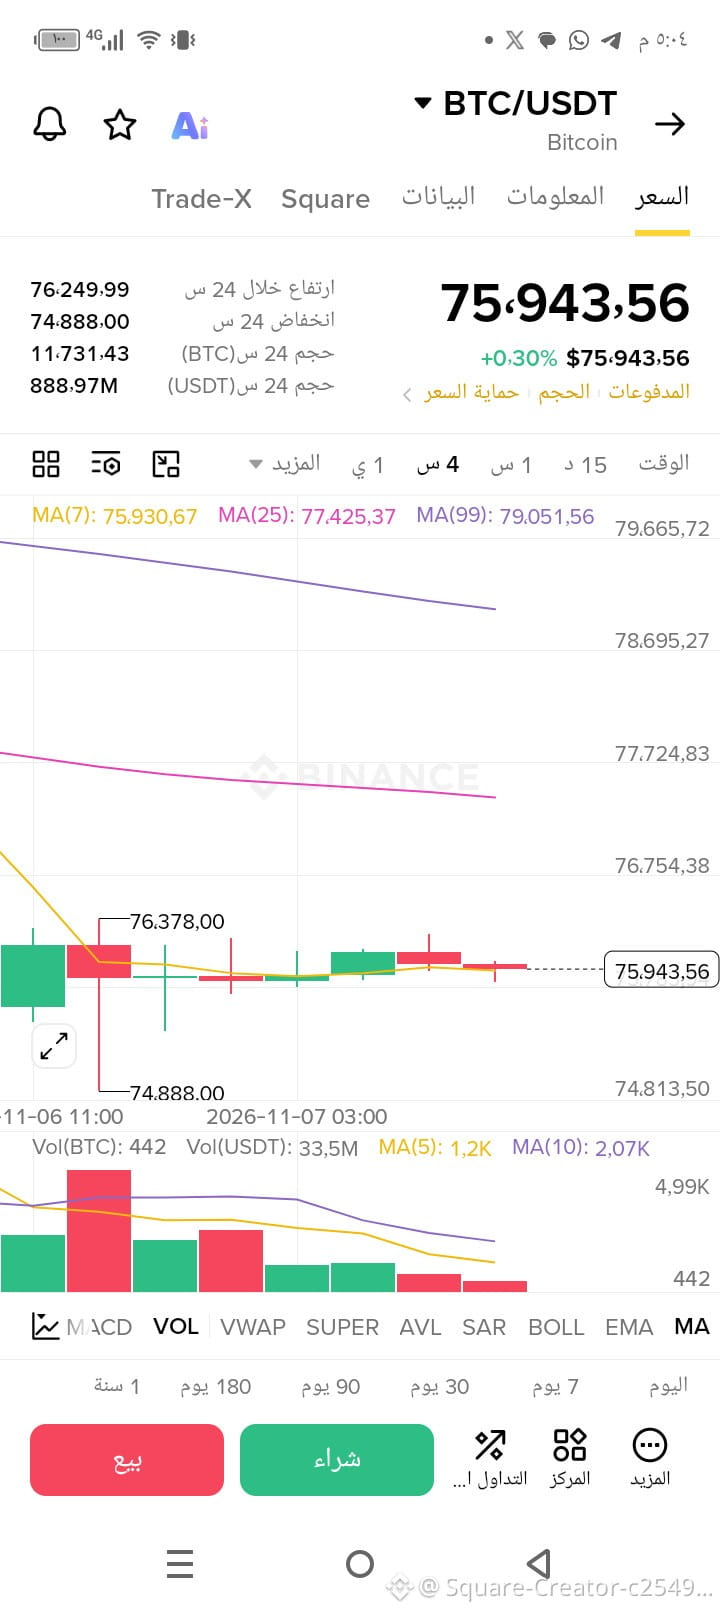
As the BTC chart settles into tight fluctuation zones to build momentum after the recent whale withdrawals, a fierce, hidden battle is emerging on the dominance front.
Live technical comparisons reveal a clear divergence in trading volumes: while leading coins such as $ETH and $SOL hold critical support levels, market makers are cleverly rotating liquidity to prevent altcoins from exploding before Bitcoin’s decisive breakout. History repeats itself on weekends: liquidity gathers in narrow channels, and the coin with the stronger order wall will lead the explosive rebound, leaving the rest behind.
📊 Technical gap and accumulation depth:
There is a clear difference in RSI behavior and trading volume between the market leader and the rest of the market—one that doesn’t show up on standard static screens.
👇 Click the live chart tool (Widget) below now, and compare the current pace of liquidity flows for BTC with the other coins in your portfolio. Discover for yourself the critical levels separating us from the next price explosion!
{spot}(BTCUSDT)
{spot}(ETHUSDT)
{spot}(SOLUSDT)
#Binance #CryptoComparison #Bitcoin #TradingSignals
⚔️ Fiery Showdown: Titans Clash This Weekend... Will the liquidity of $BTC crush altcoin dreams?
As the BTC chart settles into tight fluctuation zones to build momentum after the recent whale withdrawals, a fierce, hidden battle is emerging on the dominance front.
Live technical comparisons reveal a clear divergence in trading volumes: while leading coins such as $ETH and $SOL hold critical support levels, market makers are cleverly rotating liquidity to prevent altcoins from exploding before Bitcoin’s decisive breakout. History repeats itself on weekends: liquidity gathers in narrow channels, and the coin with the stronger order wall will lead the explosive rebound, leaving the rest behind.
📊 Technical gap and accumulation depth:
There is a clear difference in RSI behavior and trading volume between the market leader and the rest of the market—one that doesn’t show up on standard static screens.
👇 Click the live chart tool (Widget) below now, and compare the current pace of liquidity flows for BTC with the other coins in your portfolio. Discover for yourself the critical levels separating us from the next price explosion!
#Binance #CryptoComparison #Bitcoin #TradingSignals
As the BTC chart settles into tight fluctuation zones to build momentum after the recent whale withdrawals, a fierce, hidden battle is emerging on the dominance front.
Live technical comparisons reveal a clear divergence in trading volumes: while leading coins such as $ETH and $SOL hold critical support levels, market makers are cleverly rotating liquidity to prevent altcoins from exploding before Bitcoin’s decisive breakout. History repeats itself on weekends: liquidity gathers in narrow channels, and the coin with the stronger order wall will lead the explosive rebound, leaving the rest behind.
📊 Technical gap and accumulation depth:
There is a clear difference in RSI behavior and trading volume between the market leader and the rest of the market—one that doesn’t show up on standard static screens.
👇 Click the live chart tool (Widget) below now, and compare the current pace of liquidity flows for BTC with the other coins in your portfolio. Discover for yourself the critical levels separating us from the next price explosion!
#Binance #CryptoComparison #Bitcoin #TradingSignals
1
1
104
⚔️ The Fiery Showdown: A Battle for Dominance… Will the Biggest Whale Swallow Altcoin Liquidity?
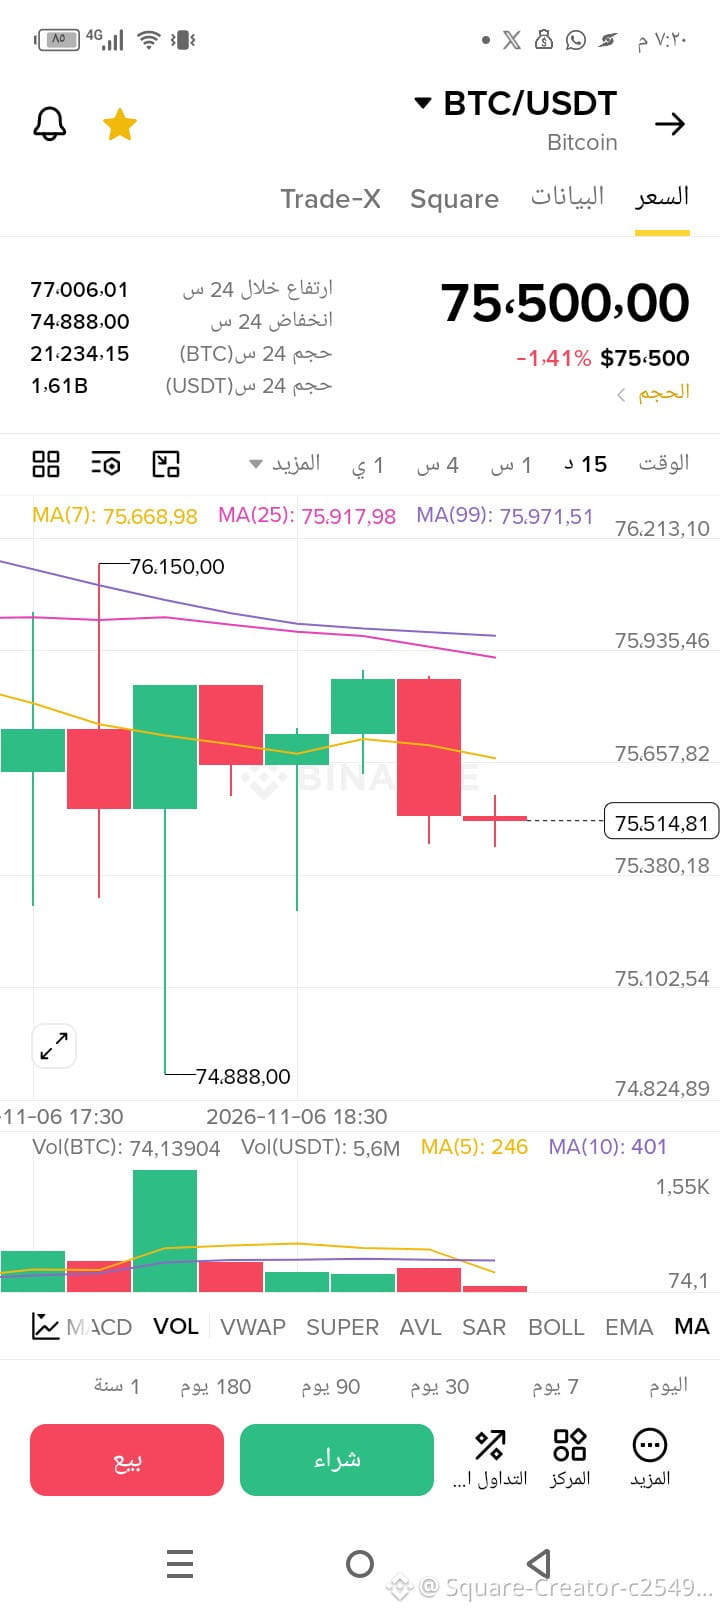
As everyone watches the $BTC chart move through critical zones following the latest whale withdrawals, a frightening gap in trading volumes has begun to emerge between the market leader and the rest of the market.
Historical comparisons confirm that market makers are now following the same familiar psychological pattern: squeezing altcoin liquidity and accumulating at very low levels, so profits can be pumped into them as soon as the main chart stabilizes. The current panic in altcoins is not a collapse, but a clear divergence for professionals who know how to seize opportunities before the rebound.
📊 The technical difference in practice:
Trading volumes on the dominance chart are giving a strong entry signal that has begun to take shape behind the scenes, unseen on regular screens.
👇 Click the live chart tool (Widget) below now, and compare the current pace of liquidity for $BTC with the movement of your altcoins; discover for yourself the critical levels separating us from the next price explosion!
{spot}(BTCUSDT)
#Binance #CryptoComparison #Bitcoin #Altcoins
⚔️ The Fiery Showdown: A Battle for Dominance… Will the Biggest Whale Swallow Altcoin Liquidity?
As everyone watches the $BTC chart move through critical zones following the latest whale withdrawals, a frightening gap in trading volumes has begun to emerge between the market leader and the rest of the market.
Historical comparisons confirm that market makers are now following the same familiar psychological pattern: squeezing altcoin liquidity and accumulating at very low levels, so profits can be pumped into them as soon as the main chart stabilizes. The current panic in altcoins is not a collapse, but a clear divergence for professionals who know how to seize opportunities before the rebound.
📊 The technical difference in practice:
Trading volumes on the dominance chart are giving a strong entry signal that has begun to take shape behind the scenes, unseen on regular screens.
👇 Click the live chart tool (Widget) below now, and compare the current pace of liquidity for $BTC with the movement of your altcoins; discover for yourself the critical levels separating us from the next price explosion!
#Binance #CryptoComparison #Bitcoin #Altcoins
As everyone watches the $BTC chart move through critical zones following the latest whale withdrawals, a frightening gap in trading volumes has begun to emerge between the market leader and the rest of the market.
Historical comparisons confirm that market makers are now following the same familiar psychological pattern: squeezing altcoin liquidity and accumulating at very low levels, so profits can be pumped into them as soon as the main chart stabilizes. The current panic in altcoins is not a collapse, but a clear divergence for professionals who know how to seize opportunities before the rebound.
📊 The technical difference in practice:
Trading volumes on the dominance chart are giving a strong entry signal that has begun to take shape behind the scenes, unseen on regular screens.
👇 Click the live chart tool (Widget) below now, and compare the current pace of liquidity for $BTC with the movement of your altcoins; discover for yourself the critical levels separating us from the next price explosion!
#Binance #CryptoComparison #Bitcoin #Altcoins
622
⚔️ The fierce comparison: The battle for dominance... Will the biggest whale swallow altcoin liquidity?
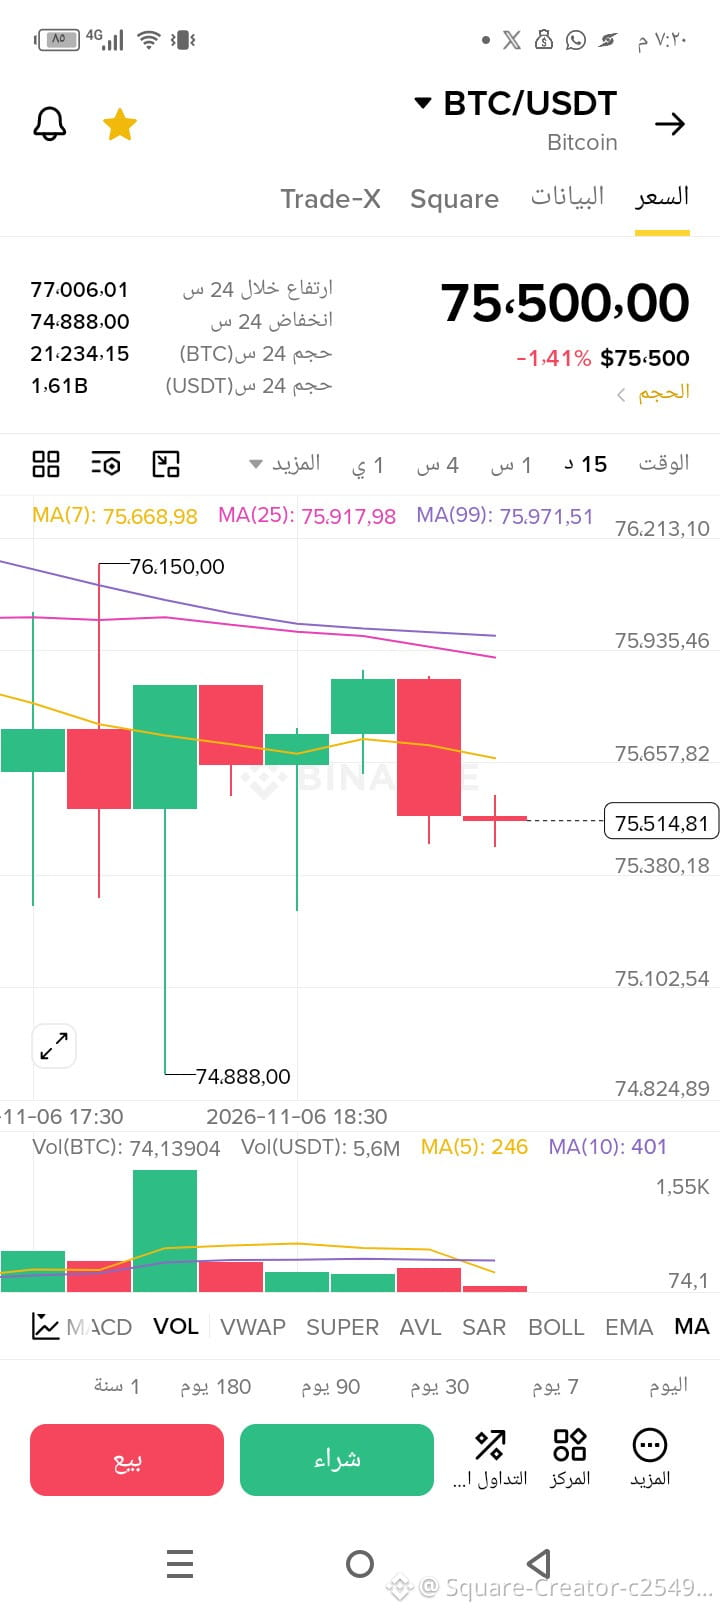
While everyone watches the $BTC chart as it moves through critical zones following the latest whale withdrawals, a frightening gap in trading volumes (Volume) has begun to emerge between the market leader and the rest of the market.
Historical comparisons confirm that market makers are now following the same familiar psychological pattern: squeezing altcoin liquidity and accumulating at very low levels, so profits can flow into them as soon as the main chart stabilizes. The current panic in altcoins is not a collapse, but a clear divergence for professionals who know how to seize opportunities before the rebound.
📊 The technical difference in practice:
Trading volumes on the dominance chart are giving a strong entry signal that has begun to take shape behind the scenes, but isn't visible on ordinary screens.
👇 Click the live chart tool (Widget) below now, and compare the current pace of liquidity for $BTC with the movement of your altcoins; discover for yourself the critical levels separating us from the next price explosion!
{spot}(BTCUSDT)
#Binance #CryptoComparison #Bitcoin #Altcoins
⚔️ The fierce comparison: The battle for dominance... Will the biggest whale swallow altcoin liquidity?
While everyone watches the $BTC chart as it moves through critical zones following the latest whale withdrawals, a frightening gap in trading volumes (Volume) has begun to emerge between the market leader and the rest of the market.
Historical comparisons confirm that market makers are now following the same familiar psychological pattern: squeezing altcoin liquidity and accumulating at very low levels, so profits can flow into them as soon as the main chart stabilizes. The current panic in altcoins is not a collapse, but a clear divergence for professionals who know how to seize opportunities before the rebound.
📊 The technical difference in practice:
Trading volumes on the dominance chart are giving a strong entry signal that has begun to take shape behind the scenes, but isn't visible on ordinary screens.
👇 Click the live chart tool (Widget) below now, and compare the current pace of liquidity for $BTC with the movement of your altcoins; discover for yourself the critical levels separating us from the next price explosion!
#Binance #CryptoComparison #Bitcoin #Altcoins
While everyone watches the $BTC chart as it moves through critical zones following the latest whale withdrawals, a frightening gap in trading volumes (Volume) has begun to emerge between the market leader and the rest of the market.
Historical comparisons confirm that market makers are now following the same familiar psychological pattern: squeezing altcoin liquidity and accumulating at very low levels, so profits can flow into them as soon as the main chart stabilizes. The current panic in altcoins is not a collapse, but a clear divergence for professionals who know how to seize opportunities before the rebound.
📊 The technical difference in practice:
Trading volumes on the dominance chart are giving a strong entry signal that has begun to take shape behind the scenes, but isn't visible on ordinary screens.
👇 Click the live chart tool (Widget) below now, and compare the current pace of liquidity for $BTC with the movement of your altcoins; discover for yourself the critical levels separating us from the next price explosion!
#Binance #CryptoComparison #Bitcoin #Altcoins
1
1
128
⚔️ The fiery showdown: A clash of political meme coins... Will the dragon $TRUMP devour the market’s liquidity?
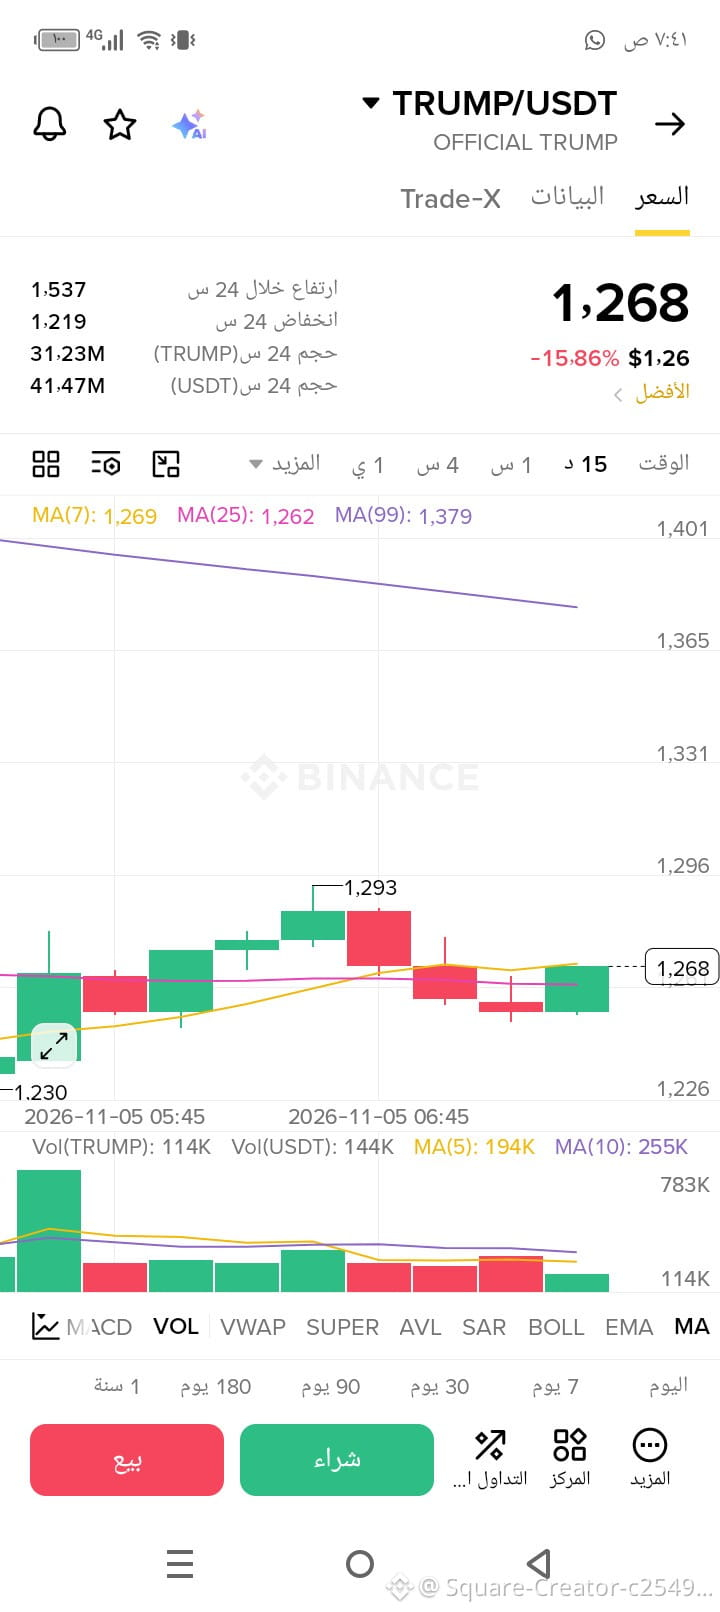
When $TRUMP drops by 15% and reaches the $1.268 zone, fear grips retail traders, but professionals open their historical comparison charts.
If we compare current technical performance and the speed of liquidity rebounds between leading political coins and classic meme coins at critical support levels, we’ll find a visually staggering difference in trading volumes. History repeats itself: the coin with a fierce community and political and media backing is always the one leading the explosive rebound, while ordinary coins continue bleeding at the bottom.
📊 The technical difference in practice:
A price gap and a positive divergence signal have begun to emerge, visible only to those skilled at reading live candlestick movements and comparing MA lines.
👇 Click the live chart widget below now and compare the pace of the current candle’s rise for $TRUMP with the rest of the market. Discover for yourself the decisive price level that confirms the dominance of accumulation liquidity right now!
{future}(TRUMPUSDT)
#Binance #CryptoComparison #MemeCoins #Altcoins
⚔️ The fiery showdown: A clash of political meme coins... Will the dragon $TRUMP devour the market’s liquidity?
When $TRUMP drops by 15% and reaches the $1.268 zone, fear grips retail traders, but professionals open their historical comparison charts.
If we compare current technical performance and the speed of liquidity rebounds between leading political coins and classic meme coins at critical support levels, we’ll find a visually staggering difference in trading volumes. History repeats itself: the coin with a fierce community and political and media backing is always the one leading the explosive rebound, while ordinary coins continue bleeding at the bottom.
📊 The technical difference in practice:
A price gap and a positive divergence signal have begun to emerge, visible only to those skilled at reading live candlestick movements and comparing MA lines.
👇 Click the live chart widget below now and compare the pace of the current candle’s rise for $TRUMP with the rest of the market. Discover for yourself the decisive price level that confirms the dominance of accumulation liquidity right now!
#Binance #CryptoComparison #MemeCoins #Altcoins
When $TRUMP drops by 15% and reaches the $1.268 zone, fear grips retail traders, but professionals open their historical comparison charts.
If we compare current technical performance and the speed of liquidity rebounds between leading political coins and classic meme coins at critical support levels, we’ll find a visually staggering difference in trading volumes. History repeats itself: the coin with a fierce community and political and media backing is always the one leading the explosive rebound, while ordinary coins continue bleeding at the bottom.
📊 The technical difference in practice:
A price gap and a positive divergence signal have begun to emerge, visible only to those skilled at reading live candlestick movements and comparing MA lines.
👇 Click the live chart widget below now and compare the pace of the current candle’s rise for $TRUMP with the rest of the market. Discover for yourself the decisive price level that confirms the dominance of accumulation liquidity right now!
#Binance #CryptoComparison #MemeCoins #Altcoins
1
1
1k

·
--
Binance Square Gem Hunt: TUT vs. HAEDAL!
TUTUSDT (0.02017) is up 14.41% in 24h. Its RSI at 59.54 suggests healthy buying, with price above 1h SMAs. Volume is decent at 5.5M USDT, showing sustained, moderate bullish momentum.
HAEDALUSDT (0.02928) surged 19.90% in 24h. Despite its RSI at 46.38 indicating potential consolidation, it commands massive 26.9M USDT volume and higher volatility, reflecting much greater market interest after a big move.
TUT offers steady bullish signs; HAEDAL delivered a larger gain with huge volume but higher volatility. Which coin catches your eye for its next move? 👇
#CryptoComparison #BinanceSquare #TUT #HAEDAL #MarketAnalysis
Not financial advice. DYOR.
Binance Square Gem Hunt: TUT vs. HAEDAL!
TUTUSDT (0.02017) is up 14.41% in 24h. Its RSI at 59.54 suggests healthy buying, with price above 1h SMAs. Volume is decent at 5.5M USDT, showing sustained, moderate bullish momentum.
HAEDALUSDT (0.02928) surged 19.90% in 24h. Despite its RSI at 46.38 indicating potential consolidation, it commands massive 26.9M USDT volume and higher volatility, reflecting much greater market interest after a big move.
TUT offers steady bullish signs; HAEDAL delivered a larger gain with huge volume but higher volatility. Which coin catches your eye for its next move? 👇
#CryptoComparison #BinanceSquare #TUT #HAEDAL #MarketAnalysis
Not financial advice. DYOR.
TUTUSDT (0.02017) is up 14.41% in 24h. Its RSI at 59.54 suggests healthy buying, with price above 1h SMAs. Volume is decent at 5.5M USDT, showing sustained, moderate bullish momentum.
HAEDALUSDT (0.02928) surged 19.90% in 24h. Despite its RSI at 46.38 indicating potential consolidation, it commands massive 26.9M USDT volume and higher volatility, reflecting much greater market interest after a big move.
TUT offers steady bullish signs; HAEDAL delivered a larger gain with huge volume but higher volatility. Which coin catches your eye for its next move? 👇
#CryptoComparison #BinanceSquare #TUT #HAEDAL #MarketAnalysis
Not financial advice. DYOR.
1
53
·
--
Quick crypto comparison on Binance Square! STEEMUSDT is up 4.13% at 0.05167. Its 24hr range (0.048-0.069) shows high volatility. With 1hr RSI at 53.5 and price above 20/50 SMAs, short-term momentum is positive. Volume: 5.04M USDT.
TONUSDT is up 0.95% at 1.6. Its lower volatility (range 1.58-1.64) and higher volume (7.71M USDT) indicate strong interest. However, 1hr RSI at 49 and price below 20 SMA suggest a more neutral short-term outlook.
STEEM offers stronger momentum and volatility, while TON shows higher liquidity and calmer action. Which one are you watching? #CryptoComparison #STEEM #TON #MarketAnalysis #BinanceSquare
Not financial advice. DYOR.
Quick crypto comparison on Binance Square! STEEMUSDT is up 4.13% at 0.05167. Its 24hr range (0.048-0.069) shows high volatility. With 1hr RSI at 53.5 and price above 20/50 SMAs, short-term momentum is positive. Volume: 5.04M USDT.
TONUSDT is up 0.95% at 1.6. Its lower volatility (range 1.58-1.64) and higher volume (7.71M USDT) indicate strong interest. However, 1hr RSI at 49 and price below 20 SMA suggest a more neutral short-term outlook.
STEEM offers stronger momentum and volatility, while TON shows higher liquidity and calmer action. Which one are you watching? #CryptoComparison #STEEM #TON #MarketAnalysis #BinanceSquare
Not financial advice. DYOR.
TONUSDT is up 0.95% at 1.6. Its lower volatility (range 1.58-1.64) and higher volume (7.71M USDT) indicate strong interest. However, 1hr RSI at 49 and price below 20 SMA suggest a more neutral short-term outlook.
STEEM offers stronger momentum and volatility, while TON shows higher liquidity and calmer action. Which one are you watching? #CryptoComparison #STEEM #TON #MarketAnalysis #BinanceSquare
Not financial advice. DYOR.
7
·
--
Comparing BEB and ZEC today! BEB is up 7.52% at 240.61 with moderate volume (7.5M) and a 1h RSI of 66.51, showing strong momentum without being extremely overbought. Its price is well above SMAs, indicating a clear uptrend. ZEC, however, is soaring 10.95% at 1353.66 on massive volume (228.7M). While its price is also strong above SMAs, its 1h RSI is 86.29, signaling significant overbought conditions. ZEC exhibits higher volume and volatility, suggesting broader interest but also a higher risk of pullback. BEB shows more sustained momentum. Both are strong, but ZEC's extreme RSI might warrant caution, while BEB appears less extended. Which offers better risk/reward? #CryptoComparison #BEB #ZEC #MarketAnalysis #BinanceSquare
Not financial advice. DYOR.
Comparing BEB and ZEC today! BEB is up 7.52% at 240.61 with moderate volume (7.5M) and a 1h RSI of 66.51, showing strong momentum without being extremely overbought. Its price is well above SMAs, indicating a clear uptrend. ZEC, however, is soaring 10.95% at 1353.66 on massive volume (228.7M). While its price is also strong above SMAs, its 1h RSI is 86.29, signaling significant overbought conditions. ZEC exhibits higher volume and volatility, suggesting broader interest but also a higher risk of pullback. BEB shows more sustained momentum. Both are strong, but ZEC's extreme RSI might warrant caution, while BEB appears less extended. Which offers better risk/reward? #CryptoComparison #BEB #ZEC #MarketAnalysis #BinanceSquare
Not financial advice. DYOR.
Not financial advice. DYOR.
241
·
--
Crypto traders, let's compare NVDAB and OSMO! 📊
NVDABUSDT: At 218.43, up 2.94% in 24h. Low volatility, range 211.3-219.78. Volume ~6.99M USDT. Technicals (1h) show steady momentum: RSI 54.29, price > SMA 20 (217.22) & SMA 50 (214.88), indicating a stable, slightly bullish trend. 🟢
OSMOUSDT: An explosive mover! 🚀 At 0.0583, surged 34.64% in 24h. High volatility, wide range 0.0423-0.0649. Volume ~6.78M USDT, intense activity for its price. 1h RSI 77.78 (overbought), immense buying pressure. Price well above SMA 20 (0.0506) & SMA 50 (0.0460). 🔥
Summary: NVDAB offers steady, lower volatility growth. OSMO is a high-momentum, high-volatility play with strong bullish signals, but watch for potential pullbacks from overbought conditions. Both have strong volumes.
Which coin's action catches your eye? Tell us below! 👇
#CryptoComparison #NVDAB #OSMO #MarketAnalysis #Volatility
Not financial advice. DYOR.
Crypto traders, let's compare NVDAB and OSMO! 📊
NVDABUSDT: At 218.43, up 2.94% in 24h. Low volatility, range 211.3-219.78. Volume ~6.99M USDT. Technicals (1h) show steady momentum: RSI 54.29, price > SMA 20 (217.22) & SMA 50 (214.88), indicating a stable, slightly bullish trend. 🟢
OSMOUSDT: An explosive mover! 🚀 At 0.0583, surged 34.64% in 24h. High volatility, wide range 0.0423-0.0649. Volume ~6.78M USDT, intense activity for its price. 1h RSI 77.78 (overbought), immense buying pressure. Price well above SMA 20 (0.0506) & SMA 50 (0.0460). 🔥
Summary: NVDAB offers steady, lower volatility growth. OSMO is a high-momentum, high-volatility play with strong bullish signals, but watch for potential pullbacks from overbought conditions. Both have strong volumes.
Which coin's action catches your eye? Tell us below! 👇
#CryptoComparison #NVDAB #OSMO #MarketAnalysis #Volatility
Not financial advice. DYOR.
NVDABUSDT: At 218.43, up 2.94% in 24h. Low volatility, range 211.3-219.78. Volume ~6.99M USDT. Technicals (1h) show steady momentum: RSI 54.29, price > SMA 20 (217.22) & SMA 50 (214.88), indicating a stable, slightly bullish trend. 🟢
OSMOUSDT: An explosive mover! 🚀 At 0.0583, surged 34.64% in 24h. High volatility, wide range 0.0423-0.0649. Volume ~6.78M USDT, intense activity for its price. 1h RSI 77.78 (overbought), immense buying pressure. Price well above SMA 20 (0.0506) & SMA 50 (0.0460). 🔥
Summary: NVDAB offers steady, lower volatility growth. OSMO is a high-momentum, high-volatility play with strong bullish signals, but watch for potential pullbacks from overbought conditions. Both have strong volumes.
Which coin's action catches your eye? Tell us below! 👇
#CryptoComparison #NVDAB #OSMO #MarketAnalysis #Volatility
Not financial advice. DYOR.
9

·
--
$SOL VS $ETH$SOL vs $ETH: 3 Key Differences On-Chain Traders Should Know
Both Solana and Ethereum are top L1s, but their on-chain behavior is very different. Here’s 3 key differences based on public data:
**1. Transaction Speed & Fees**
$ETH: Averages 12-15 TPS on L1. Gas fees vary with network congestion. L2s like Arbitrum/Base handle most daily volume now.
$SOL: Averages 2,000-3,000 TPS. Fees usually stay under $0.01 even during high activity.
Difference: ETH prioritizes decentralization/security. SOL prioritizes speed/throughput. Different design choices.
**2. Network Activity Pattern**
$ETH: Activity spikes with DeFi, NFT mints, L2 usage. Daily active addresses often 400K-500K.
$SOL: Activity spikes with meme coins, NFTs, and high-frequency trading. Daily active addresses often 1M+.
Difference: ETH sees “fewer, higher-value” txs. SOL sees “more, lower-value” txs.
**3. Validator/Decentralization Model**
$ETH: ~1M+ validators. Low hardware requirements. PoS since 2022 merge.
$SOL: ~1,200-1,500 validators. Higher hardware requirements. PoS + PoH consensus.
Difference: ETH optimizes for validator count. SOL optimizes for performance per validator.
**Important context:**
1. Both networks have outages/congestion at different times. No blockchain is perfect.
2. “Better” depends on use case. DeFi protocols vs gaming/NFT mints need different things.
3. On-chain data shows usage, not investment advice.
This is an educational comparison only. Both $ETH and $SOL are volatile assets. Do your own research and manage risk before trading.
Which chain do you use more for daily crypto stuff? ETH for DeFi or SOL for speed? Comment below 👇
$SOL #CryptoComparison #SKHynixADRListing #Ethereum #solana #dyor
{future}(SOLUSDT)
{future}(ETHUSDT)
$SOL VS $ETH
$SOL vs $ETH: 3 Key Differences On-Chain Traders Should Know
Both Solana and Ethereum are top L1s, but their on-chain behavior is very different. Here’s 3 key differences based on public data:
**1. Transaction Speed & Fees**
$ETH: Averages 12-15 TPS on L1. Gas fees vary with network congestion. L2s like Arbitrum/Base handle most daily volume now.
$SOL : Averages 2,000-3,000 TPS. Fees usually stay under $0.01 even during high activity.
Difference: ETH prioritizes decentralization/security. SOL prioritizes speed/throughput. Different design choices.
**2. Network Activity Pattern**
$ETH: Activity spikes with DeFi, NFT mints, L2 usage. Daily active addresses often 400K-500K.
$SOL : Activity spikes with meme coins, NFTs, and high-frequency trading. Daily active addresses often 1M+.
Difference: ETH sees “fewer, higher-value” txs. SOL sees “more, lower-value” txs.
**3. Validator/Decentralization Model**
$ETH: ~1M+ validators. Low hardware requirements. PoS since 2022 merge.
$SOL : ~1,200-1,500 validators. Higher hardware requirements. PoS + PoH consensus.
Difference: ETH optimizes for validator count. SOL optimizes for performance per validator.
**Important context:**
1. Both networks have outages/congestion at different times. No blockchain is perfect.
2. “Better” depends on use case. DeFi protocols vs gaming/NFT mints need different things.
3. On-chain data shows usage, not investment advice.
This is an educational comparison only. Both $ETH and $SOL are volatile assets. Do your own research and manage risk before trading.
Which chain do you use more for daily crypto stuff? ETH for DeFi or SOL for speed? Comment below 👇
$SOL #CryptoComparison #SKHynixADRListing #Ethereum #solana #dyor
Both Solana and Ethereum are top L1s, but their on-chain behavior is very different. Here’s 3 key differences based on public data:
**1. Transaction Speed & Fees**
$ETH: Averages 12-15 TPS on L1. Gas fees vary with network congestion. L2s like Arbitrum/Base handle most daily volume now.
$SOL : Averages 2,000-3,000 TPS. Fees usually stay under $0.01 even during high activity.
Difference: ETH prioritizes decentralization/security. SOL prioritizes speed/throughput. Different design choices.
**2. Network Activity Pattern**
$ETH: Activity spikes with DeFi, NFT mints, L2 usage. Daily active addresses often 400K-500K.
$SOL : Activity spikes with meme coins, NFTs, and high-frequency trading. Daily active addresses often 1M+.
Difference: ETH sees “fewer, higher-value” txs. SOL sees “more, lower-value” txs.
**3. Validator/Decentralization Model**
$ETH: ~1M+ validators. Low hardware requirements. PoS since 2022 merge.
$SOL : ~1,200-1,500 validators. Higher hardware requirements. PoS + PoH consensus.
Difference: ETH optimizes for validator count. SOL optimizes for performance per validator.
**Important context:**
1. Both networks have outages/congestion at different times. No blockchain is perfect.
2. “Better” depends on use case. DeFi protocols vs gaming/NFT mints need different things.
3. On-chain data shows usage, not investment advice.
This is an educational comparison only. Both $ETH and $SOL are volatile assets. Do your own research and manage risk before trading.
Which chain do you use more for daily crypto stuff? ETH for DeFi or SOL for speed? Comment below 👇
$SOL #CryptoComparison #SKHynixADRListing #Ethereum #solana #dyor
1
150

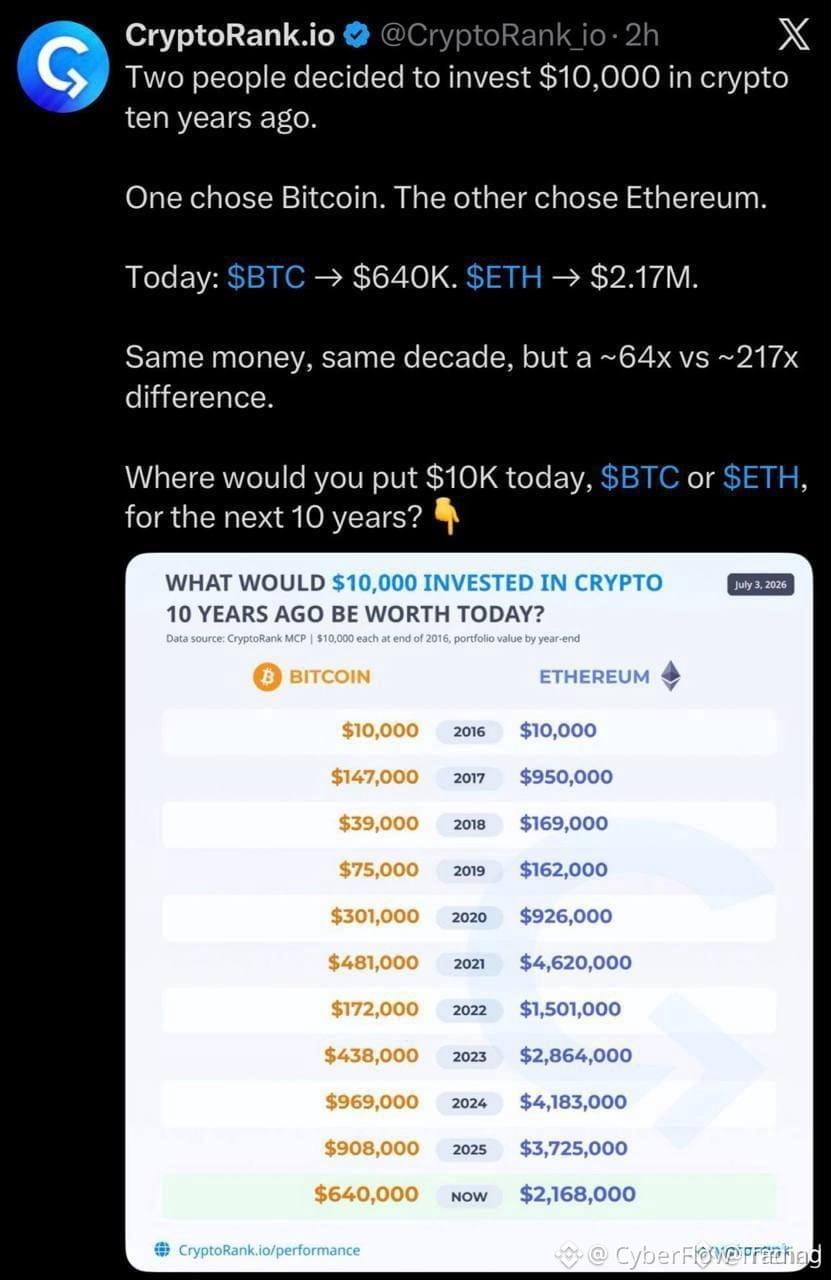
$ETH OUTPERFORMED BTC BY 3.4X OVER THE LAST DECADE 💥
A $10,000 bet on Bitcoin turned into $640K. Same capital in Ethereum? $2.17 million. That's not just a win — that's a 3.4x difference against the king.
The numbers are public. The FUD around Ethereum has been loud for years, but the data doesn't lie. We're talking about a decade-long track record that puts most altcoin narratives to shame.
What's your take — is ETH still the better long-term hold, or has BTC finally closed the gap?
Not financial advice. Always manage your risk.
#ETH #Bitcoin #CryptoComparison #LongTermHolding
🔥
$ETH OUTPERFORMED BTC BY 3.4X OVER THE LAST DECADE 💥
A $10,000 bet on Bitcoin turned into $640K. Same capital in Ethereum? $2.17 million. That's not just a win — that's a 3.4x difference against the king.
The numbers are public. The FUD around Ethereum has been loud for years, but the data doesn't lie. We're talking about a decade-long track record that puts most altcoin narratives to shame.
What's your take — is ETH still the better long-term hold, or has BTC finally closed the gap?
Not financial advice. Always manage your risk.
#ETH #Bitcoin #CryptoComparison #LongTermHolding
🔥
A $10,000 bet on Bitcoin turned into $640K. Same capital in Ethereum? $2.17 million. That's not just a win — that's a 3.4x difference against the king.
The numbers are public. The FUD around Ethereum has been loud for years, but the data doesn't lie. We're talking about a decade-long track record that puts most altcoin narratives to shame.
What's your take — is ETH still the better long-term hold, or has BTC finally closed the gap?
Not financial advice. Always manage your risk.
#ETH #Bitcoin #CryptoComparison #LongTermHolding
🔥
48
·
--
Coin Clash: ONE vs OPN! 🚀 Let's dive into these two movers.
ONEUSDT is on an absolute tear today, surging 36.84% 📈 with its RSI at a fiery 81.54! 🔥 This indicates intense upward momentum, but also suggests it's deeply overbought. Its 24h high to low range of 0.00111-0.0019 shows significant volatility. Volume sits at 5.7M USDT.
OPNUSDT, while not as explosive, is showing solid gains of 8.15% 🟢. Its RSI at 70.18 signals strong bullish momentum without being as extreme as ONE. Crucially, OPN boasts a massive trading volume of 110.9M USDT 💎, indicating much higher market liquidity and interest. Volatility is comparatively lower with a tighter 24h range. Both coins show bullish short-term trends with SMA20 above SMA50.
So, do you prefer the high-octane volatility and momentum of ONE ⚡ or the stronger liquidity and steady climb of OPN? 🎯 What's your pick? Drop a comment below!
#CryptoComparison #ONEUSDT #OPNUSDT #MarketAnalysis #TradeSmart
Not financial advice. DYOR.
Coin Clash: ONE vs OPN! 🚀 Let's dive into these two movers.
ONEUSDT is on an absolute tear today, surging 36.84% 📈 with its RSI at a fiery 81.54! 🔥 This indicates intense upward momentum, but also suggests it's deeply overbought. Its 24h high to low range of 0.00111-0.0019 shows significant volatility. Volume sits at 5.7M USDT.
OPNUSDT, while not as explosive, is showing solid gains of 8.15% 🟢. Its RSI at 70.18 signals strong bullish momentum without being as extreme as ONE. Crucially, OPN boasts a massive trading volume of 110.9M USDT 💎, indicating much higher market liquidity and interest. Volatility is comparatively lower with a tighter 24h range. Both coins show bullish short-term trends with SMA20 above SMA50.
So, do you prefer the high-octane volatility and momentum of ONE ⚡ or the stronger liquidity and steady climb of OPN? 🎯 What's your pick? Drop a comment below!
#CryptoComparison #ONEUSDT #OPNUSDT #MarketAnalysis #TradeSmart
Not financial advice. DYOR.
ONEUSDT is on an absolute tear today, surging 36.84% 📈 with its RSI at a fiery 81.54! 🔥 This indicates intense upward momentum, but also suggests it's deeply overbought. Its 24h high to low range of 0.00111-0.0019 shows significant volatility. Volume sits at 5.7M USDT.
OPNUSDT, while not as explosive, is showing solid gains of 8.15% 🟢. Its RSI at 70.18 signals strong bullish momentum without being as extreme as ONE. Crucially, OPN boasts a massive trading volume of 110.9M USDT 💎, indicating much higher market liquidity and interest. Volatility is comparatively lower with a tighter 24h range. Both coins show bullish short-term trends with SMA20 above SMA50.
So, do you prefer the high-octane volatility and momentum of ONE ⚡ or the stronger liquidity and steady climb of OPN? 🎯 What's your pick? Drop a comment below!
#CryptoComparison #ONEUSDT #OPNUSDT #MarketAnalysis #TradeSmart
Not financial advice. DYOR.
1
150
·
--
Comparing USUAL and TRUMP on Binance Square! USUALUSDT is up 19.06% at 0.01212, with 6.1M USDT volume and moderate volatility. Technicals show momentum building but not overheated (RSI neutral, near SMA 20, above SMA 50).
TRUMPUSDT surged a massive 64.55% to 2.845, with enormous 196.7M USDT volume and extreme volatility. Its RSI is 77.10 (overbought) and price is well above SMAs, indicating very strong, possibly overheated bullish momentum.
In summary, TRUMP leads significantly in momentum and volume, exhibiting higher volatility and a strong breakout. USUAL shows more contained, gradual growth and neutral technicals. Which is on your watchlist?
#CryptoComparison #BinanceSquare #Altcoins #TradingInsights #MarketWatch
Not financial advice. DYOR.
Comparing USUAL and TRUMP on Binance Square! USUALUSDT is up 19.06% at 0.01212, with 6.1M USDT volume and moderate volatility. Technicals show momentum building but not overheated (RSI neutral, near SMA 20, above SMA 50).
TRUMPUSDT surged a massive 64.55% to 2.845, with enormous 196.7M USDT volume and extreme volatility. Its RSI is 77.10 (overbought) and price is well above SMAs, indicating very strong, possibly overheated bullish momentum.
In summary, TRUMP leads significantly in momentum and volume, exhibiting higher volatility and a strong breakout. USUAL shows more contained, gradual growth and neutral technicals. Which is on your watchlist?
#CryptoComparison #BinanceSquare #Altcoins #TradingInsights #MarketWatch
Not financial advice. DYOR.
TRUMPUSDT surged a massive 64.55% to 2.845, with enormous 196.7M USDT volume and extreme volatility. Its RSI is 77.10 (overbought) and price is well above SMAs, indicating very strong, possibly overheated bullish momentum.
In summary, TRUMP leads significantly in momentum and volume, exhibiting higher volatility and a strong breakout. USUAL shows more contained, gradual growth and neutral technicals. Which is on your watchlist?
#CryptoComparison #BinanceSquare #Altcoins #TradingInsights #MarketWatch
Not financial advice. DYOR.
234
·
--
MIRA vs THE: A quick 24h comparison!
MIRAUSDT is up 17.27% to 0.0489 (5.02M Vol). Its 1h RSI at 76.03 suggests overbought, indicating strong momentum but potential pullback. Bullish SMA setup.
THEUSDT surged 35.32% to 0.0636 (11.04M Vol), nearly double MIRA's, showing higher market interest. Its 1h RSI of 65.81 indicates strong buying, less overbought than MIRA. Higher volatility & wider range. Also a bullish SMA setup.
THE leads in percentage gain & volume. MIRA has strong individual momentum but is hitting higher RSI. Both display bullish SMA setups.
Which one are you watching closer? Share below! 👇
#CryptoComparison #MIRA #THE #BinanceSquare #MarketAnalysis
Not financial advice. DYOR.
MIRA vs THE: A quick 24h comparison!
MIRAUSDT is up 17.27% to 0.0489 (5.02M Vol). Its 1h RSI at 76.03 suggests overbought, indicating strong momentum but potential pullback. Bullish SMA setup.
THEUSDT surged 35.32% to 0.0636 (11.04M Vol), nearly double MIRA's, showing higher market interest. Its 1h RSI of 65.81 indicates strong buying, less overbought than MIRA. Higher volatility & wider range. Also a bullish SMA setup.
THE leads in percentage gain & volume. MIRA has strong individual momentum but is hitting higher RSI. Both display bullish SMA setups.
Which one are you watching closer? Share below! 👇
#CryptoComparison #MIRA #THE #BinanceSquare #MarketAnalysis
Not financial advice. DYOR.
MIRAUSDT is up 17.27% to 0.0489 (5.02M Vol). Its 1h RSI at 76.03 suggests overbought, indicating strong momentum but potential pullback. Bullish SMA setup.
THEUSDT surged 35.32% to 0.0636 (11.04M Vol), nearly double MIRA's, showing higher market interest. Its 1h RSI of 65.81 indicates strong buying, less overbought than MIRA. Higher volatility & wider range. Also a bullish SMA setup.
THE leads in percentage gain & volume. MIRA has strong individual momentum but is hitting higher RSI. Both display bullish SMA setups.
Which one are you watching closer? Share below! 👇
#CryptoComparison #MIRA #THE #BinanceSquare #MarketAnalysis
Not financial advice. DYOR.
200

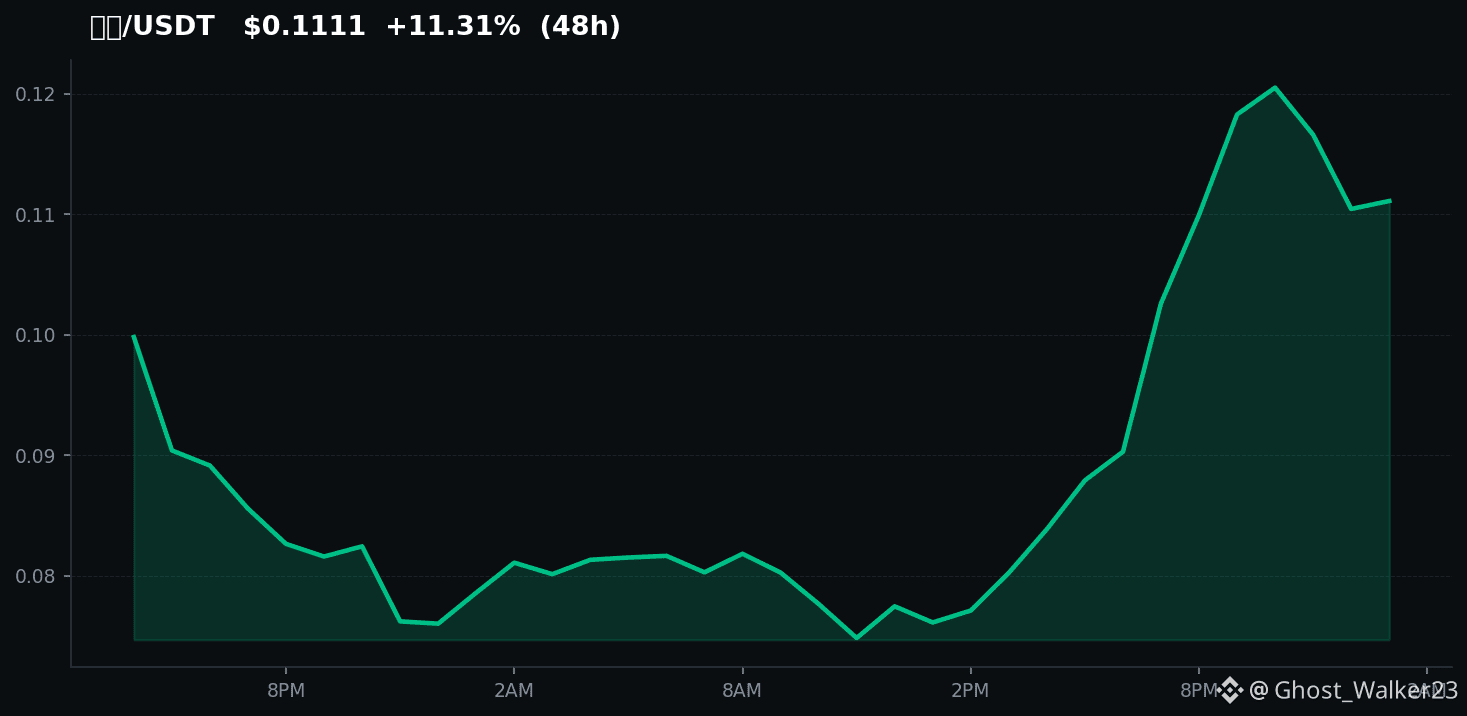
🚀 Let's compare two trending coins: $PONS vs. $RAY!
$PONS is currently down -10.1%, mientras que $RAY has surged +17.9%! As you can see below in the chart, $RAY exhibits stronger momentum. Pero, ¿tiene $PONS la capacidad de recuperarse?
What do you think? 💭 #USAugustPPIRisesLessThanExpected #CryptoComparison
📈 Follow for more real-time market breakdowns!
🚀 Let's compare two trending coins: $PONS vs. $RAY !
$PONS is currently down -10.1%, mientras que $RAY has surged +17.9%! As you can see below in the chart, $RAY exhibits stronger momentum. Pero, ¿tiene $PONS la capacidad de recuperarse?
What do you think? 💭 #USAugustPPIRisesLessThanExpected #CryptoComparison
📈 Follow for more real-time market breakdowns!
$PONS is currently down -10.1%, mientras que $RAY has surged +17.9%! As you can see below in the chart, $RAY exhibits stronger momentum. Pero, ¿tiene $PONS la capacidad de recuperarse?
What do you think? 💭 #USAugustPPIRisesLessThanExpected #CryptoComparison
📈 Follow for more real-time market breakdowns!
288

Spot or Binance Earn: what to choose for your capital?
Managing assets requires a clear understanding of the tools. Let’s compare two popular approaches on Binance:
1. Spot Trading:
Pros: Full control over buying/selling, with the potential for high returns when the market is rising.
Features: Requires constant analysis of charts, timing, and resistance to volatility.
2. Binance Earn (Simple Earn):
Pros: Passive income without the need to monitor the market every day, a low entry threshold, and a choice between flexible and fixed terms.
Features: Returns are usually lower than with successful trading, but the risks are significantly smaller.
Conclusion: For active capital, Spot is a good fit, and for reserves and long-term savings — Binance Earn. The ideal strategy is to combine both!
#BinanceEarn #SpotTradding #CryptoComparison #BinanceSquare
Spot or Binance Earn: what to choose for your capital?
Managing assets requires a clear understanding of the tools. Let’s compare two popular approaches on Binance:
1. Spot Trading:
Pros: Full control over buying/selling, with the potential for high returns when the market is rising.
Features: Requires constant analysis of charts, timing, and resistance to volatility.
2. Binance Earn (Simple Earn):
Pros: Passive income without the need to monitor the market every day, a low entry threshold, and a choice between flexible and fixed terms.
Features: Returns are usually lower than with successful trading, but the risks are significantly smaller.
Conclusion: For active capital, Spot is a good fit, and for reserves and long-term savings — Binance Earn. The ideal strategy is to combine both!
#BinanceEarn #SpotTradding #CryptoComparison #BinanceSquare
Managing assets requires a clear understanding of the tools. Let’s compare two popular approaches on Binance:
1. Spot Trading:
Pros: Full control over buying/selling, with the potential for high returns when the market is rising.
Features: Requires constant analysis of charts, timing, and resistance to volatility.
2. Binance Earn (Simple Earn):
Pros: Passive income without the need to monitor the market every day, a low entry threshold, and a choice between flexible and fixed terms.
Features: Returns are usually lower than with successful trading, but the risks are significantly smaller.
Conclusion: For active capital, Spot is a good fit, and for reserves and long-term savings — Binance Earn. The ideal strategy is to combine both!
#BinanceEarn #SpotTradding #CryptoComparison #BinanceSquare
1
90
·
--
Binance Square Movers! EPIC (EPICUSDT) surged 39.27% to 0.688 USDT, showing strong bullish momentum above SMAs. However, 1h RSI at 73.65 signals overbought (Vol 5.69M). UTK (UTKUSDT) is up 16.23% at 0.00795 USDT, with high volume (10.2M) but extreme volatility, dropping from 0.0244 high to near 0.00677 low. It's now below its SMA20 with a neutral 1h RSI (51.40). EPIC shows sustained surge, while UTK saw a huge pullback after an even bigger rally. Which mover are you watching? Drop a comment! #CryptoComparison #EPIC #UTK #BinanceSquare
Not financial advice. DYOR.
Binance Square Movers! EPIC (EPICUSDT) surged 39.27% to 0.688 USDT, showing strong bullish momentum above SMAs. However, 1h RSI at 73.65 signals overbought (Vol 5.69M). UTK (UTKUSDT) is up 16.23% at 0.00795 USDT, with high volume (10.2M) but extreme volatility, dropping from 0.0244 high to near 0.00677 low. It's now below its SMA20 with a neutral 1h RSI (51.40). EPIC shows sustained surge, while UTK saw a huge pullback after an even bigger rally. Which mover are you watching? Drop a comment! #CryptoComparison #EPIC #UTK #BinanceSquare
Not financial advice. DYOR.
Not financial advice. DYOR.
54
·
--
Crypto Watch: OPN vs BARD! OPN (0.0653) is down -6.85% in 24h with 27.48M volume. Its 1h RSI at 21.84 suggests oversold conditions, potentially hinting at a bounce, but it trades below short-term SMAs, showing bearish pressure. BARD (0.131) is up +4.47% with 6.42M volume. Its 1h RSI is 34.39 and price is consolidating above its 1h SMA 50, indicating a bullish trend. Both showed notable volatility. OPN is high volume & oversold in a downtrend, while BARD has positive momentum in an uptrend. Which looks more interesting? Share your thoughts! #CryptoComparison #Altcoins #MarketAnalysis #OPN #BARD
Not financial advice. DYOR.
Crypto Watch: OPN vs BARD! OPN (0.0653) is down -6.85% in 24h with 27.48M volume. Its 1h RSI at 21.84 suggests oversold conditions, potentially hinting at a bounce, but it trades below short-term SMAs, showing bearish pressure. BARD (0.131) is up +4.47% with 6.42M volume. Its 1h RSI is 34.39 and price is consolidating above its 1h SMA 50, indicating a bullish trend. Both showed notable volatility. OPN is high volume & oversold in a downtrend, while BARD has positive momentum in an uptrend. Which looks more interesting? Share your thoughts! #CryptoComparison #Altcoins #MarketAnalysis #OPN #BARD
Not financial advice. DYOR.
Not financial advice. DYOR.
203
·
--
Comparing ZEN and FF, both showing strong 24h gains: ZEN +7.00% ($7.685), FF +6.24% ($0.15093). Both maintain bullish short-term trends above their SMAs. ZEN's 1-hour RSI is high at 72.02, suggesting it might be overbought. In contrast, FF's RSI at 61.53 looks healthier with room to grow. FF also leads in 24h volume (11.8M USDT vs ZEN's 8.6M USDT), indicating greater market interest. Both exhibited significant daily volatility. While ZEN appears stretched, FF shows robust volume and healthier momentum. Which are you watching? #CryptoComparison #ZEN #FF #TechnicalAnalysis #MarketUpdate
Not financial advice. DYOR.
Comparing ZEN and FF, both showing strong 24h gains: ZEN +7.00% ($7.685), FF +6.24% ($0.15093). Both maintain bullish short-term trends above their SMAs. ZEN's 1-hour RSI is high at 72.02, suggesting it might be overbought. In contrast, FF's RSI at 61.53 looks healthier with room to grow. FF also leads in 24h volume (11.8M USDT vs ZEN's 8.6M USDT), indicating greater market interest. Both exhibited significant daily volatility. While ZEN appears stretched, FF shows robust volume and healthier momentum. Which are you watching? #CryptoComparison #ZEN #FF #TechnicalAnalysis #MarketUpdate
Not financial advice. DYOR.
Not financial advice. DYOR.
141
·
--
Let's compare REUSDT vs BELUSDT! 🚀
RE (0.8147) has plunged -18.00% in 24h, hitting 0.7961. Its RSI at 20.92 signals deeply oversold conditions. 📉 Price is well below 1h SMA20 (0.891) and SMA50 (0.954), showing strong bearish momentum. A massive 24h volume of 66.3M USDT indicates high interest amidst this volatility. 🔴
Conversely, BEL (0.1705) is soaring 17.26% in 24h, peaking at 0.1938. Its RSI at 60.24 suggests healthy bullish momentum, not yet overbought. 📈 BEL trades above 1h SMA20 (0.165) and SMA50 (0.159), confirming its positive trend. Volume for BEL is 7.4M USDT, showing sustained buying interest. 🟢
Summary: RE shows high downside volatility and volume, potentially eyeing a bounce from oversold levels. BEL exhibits strong bullish momentum with solid volume. Two very different market narratives! 🔥
Which trend do you find more compelling? Drop a comment! 🎯
#CryptoComparison #REUSDT #BELUSDT #MarketAnalysis #CryptoTrading
Not financial advice. DYOR.
Let's compare REUSDT vs BELUSDT! 🚀
RE (0.8147) has plunged -18.00% in 24h, hitting 0.7961. Its RSI at 20.92 signals deeply oversold conditions. 📉 Price is well below 1h SMA20 (0.891) and SMA50 (0.954), showing strong bearish momentum. A massive 24h volume of 66.3M USDT indicates high interest amidst this volatility. 🔴
Conversely, BEL (0.1705) is soaring 17.26% in 24h, peaking at 0.1938. Its RSI at 60.24 suggests healthy bullish momentum, not yet overbought. 📈 BEL trades above 1h SMA20 (0.165) and SMA50 (0.159), confirming its positive trend. Volume for BEL is 7.4M USDT, showing sustained buying interest. 🟢
Summary: RE shows high downside volatility and volume, potentially eyeing a bounce from oversold levels. BEL exhibits strong bullish momentum with solid volume. Two very different market narratives! 🔥
Which trend do you find more compelling? Drop a comment! 🎯
#CryptoComparison #REUSDT #BELUSDT #MarketAnalysis #CryptoTrading
Not financial advice. DYOR.
RE (0.8147) has plunged -18.00% in 24h, hitting 0.7961. Its RSI at 20.92 signals deeply oversold conditions. 📉 Price is well below 1h SMA20 (0.891) and SMA50 (0.954), showing strong bearish momentum. A massive 24h volume of 66.3M USDT indicates high interest amidst this volatility. 🔴
Conversely, BEL (0.1705) is soaring 17.26% in 24h, peaking at 0.1938. Its RSI at 60.24 suggests healthy bullish momentum, not yet overbought. 📈 BEL trades above 1h SMA20 (0.165) and SMA50 (0.159), confirming its positive trend. Volume for BEL is 7.4M USDT, showing sustained buying interest. 🟢
Summary: RE shows high downside volatility and volume, potentially eyeing a bounce from oversold levels. BEL exhibits strong bullish momentum with solid volume. Two very different market narratives! 🔥
Which trend do you find more compelling? Drop a comment! 🎯
#CryptoComparison #REUSDT #BELUSDT #MarketAnalysis #CryptoTrading
Not financial advice. DYOR.
200
·
--
Daily crypto spotlight! Comparing TSLABUSDT & MSTRBUSDT.
TSLAB is up 3.58% at 348.57 USDT (vol 5.23M USDT). Its 1h RSI is 88.14, signaling strong momentum but overbought conditions. Price is well above its SMA 20 & SMA 50.
MSTRB, up 9.67% at 103.53 USDT (vol 8.97M USDT), shows higher gains & volume. Its 1h RSI is 81.85, also overbought but less extreme. Price is also well above its SMA 20 & SMA 50, showing more volatility.
Both exhibit strong bullish movement, pushing RSIs into overbought zones. MSTRB stands out with higher percentage gains and larger trading volume, suggesting more market excitement. TSLAB shows solid trend continuation.
Which one catches your eye more for recent performance? Share your thoughts below! 👇
#CryptoComparison #TSLAB #MSTRB #BinanceSquare
Not financial advice. DYOR.
Daily crypto spotlight! Comparing TSLABUSDT & MSTRBUSDT.
TSLAB is up 3.58% at 348.57 USDT (vol 5.23M USDT). Its 1h RSI is 88.14, signaling strong momentum but overbought conditions. Price is well above its SMA 20 & SMA 50.
MSTRB, up 9.67% at 103.53 USDT (vol 8.97M USDT), shows higher gains & volume. Its 1h RSI is 81.85, also overbought but less extreme. Price is also well above its SMA 20 & SMA 50, showing more volatility.
Both exhibit strong bullish movement, pushing RSIs into overbought zones. MSTRB stands out with higher percentage gains and larger trading volume, suggesting more market excitement. TSLAB shows solid trend continuation.
Which one catches your eye more for recent performance? Share your thoughts below! 👇
#CryptoComparison #TSLAB #MSTRB #BinanceSquare
Not financial advice. DYOR.
TSLAB is up 3.58% at 348.57 USDT (vol 5.23M USDT). Its 1h RSI is 88.14, signaling strong momentum but overbought conditions. Price is well above its SMA 20 & SMA 50.
MSTRB, up 9.67% at 103.53 USDT (vol 8.97M USDT), shows higher gains & volume. Its 1h RSI is 81.85, also overbought but less extreme. Price is also well above its SMA 20 & SMA 50, showing more volatility.
Both exhibit strong bullish movement, pushing RSIs into overbought zones. MSTRB stands out with higher percentage gains and larger trading volume, suggesting more market excitement. TSLAB shows solid trend continuation.
Which one catches your eye more for recent performance? Share your thoughts below! 👇
#CryptoComparison #TSLAB #MSTRB #BinanceSquare
Not financial advice. DYOR.
17
Log in to explore more content
Join global crypto users on Binance Square
⚡️ Get latest and useful information about crypto.
💬 Trusted by the world’s largest crypto exchange.
👍 Discover real insights from verified creators.
Email / Phone number
Trending Topics
1
#JobsReportRaisesHikeOdds
340,201 views
2,579 Discussing
2
#CPITestsDecemberRateOutlook
61,593 views
668 Discussing
3
#BitcoinRebounds$75KAsChipsLead
28,350 views
261 Discussing
4
#US Data Center Rules May Constrain AI Expansion
51,029 views
189 Discussing
5
#ARKPlans14ThematicETFsCoveringAIAndTokenizedMarkets
914 views
33 Discussing
6
#WillAnthropicListOnTime
90,864 views
1,032 Discussing
7
#WillUS-IranTensionsBoostSafe-HavenDemand?
28,575 views
289 Discussing
8
#BitcoinETFsSee$412MNetOutflows
7,210 views
49 Discussing
9
#HKSFCPlansToRestrictCryptoAndExchangeTerms
26,105 views
364 Discussing
10
#TradFiForBeginners
56,039 views
797 Discussing