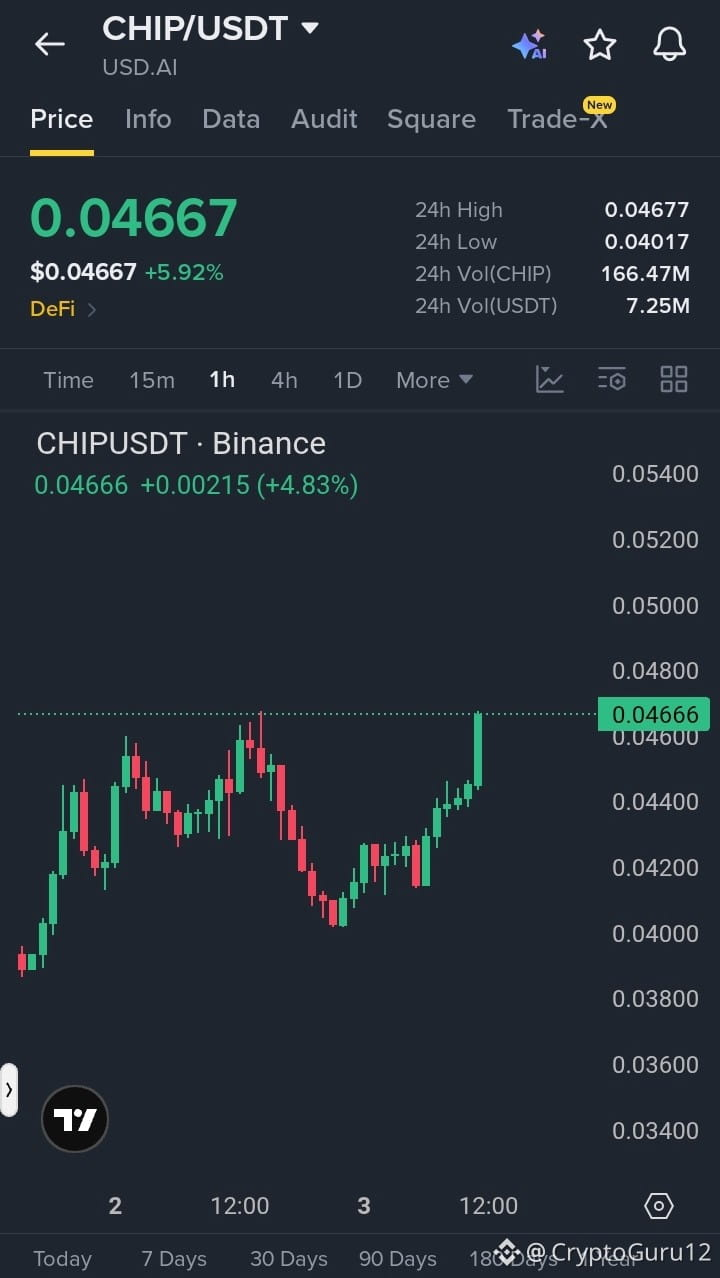
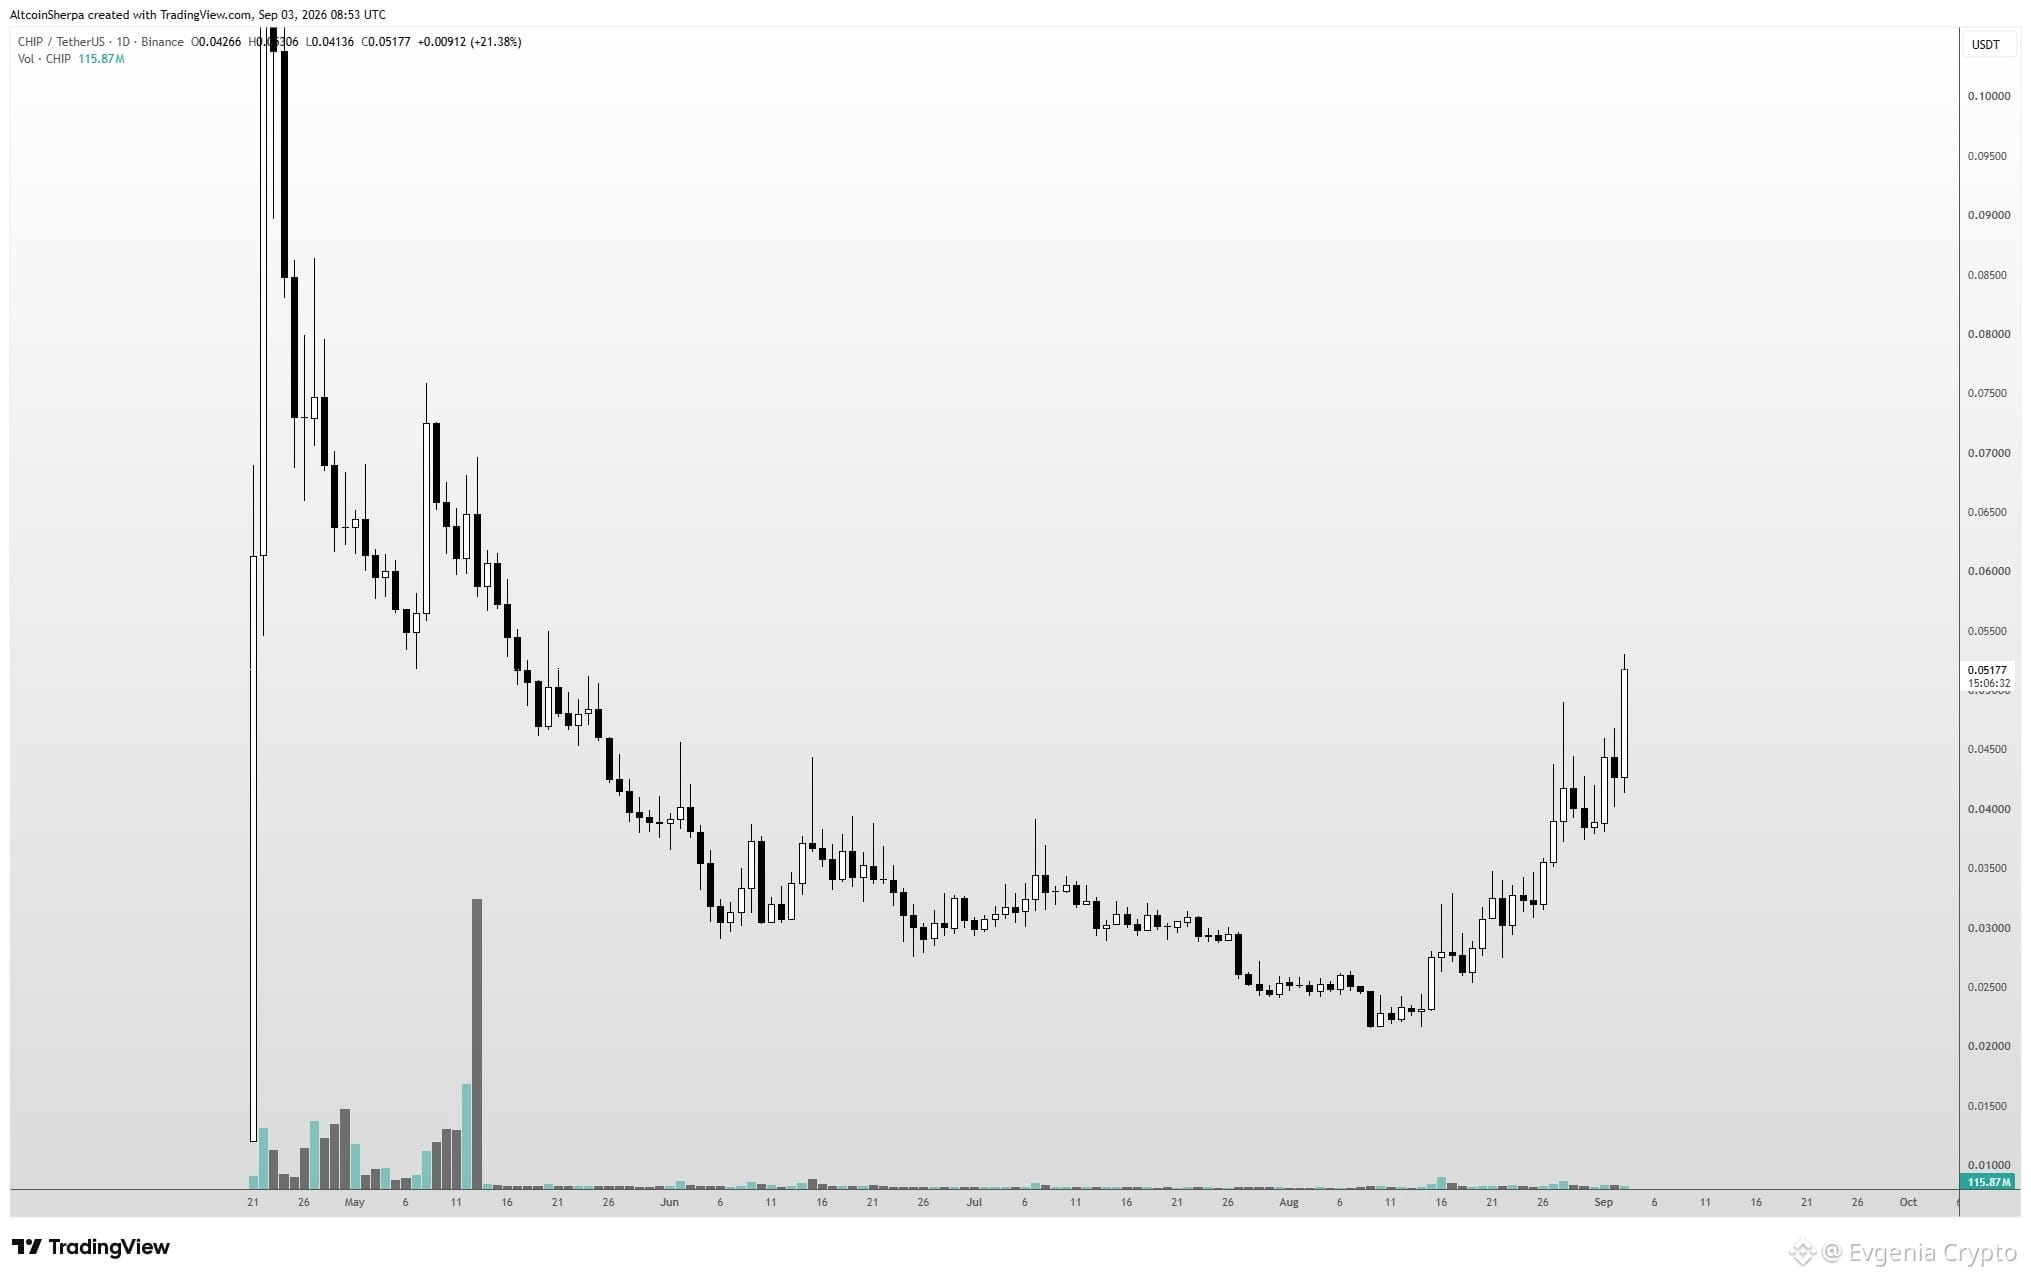
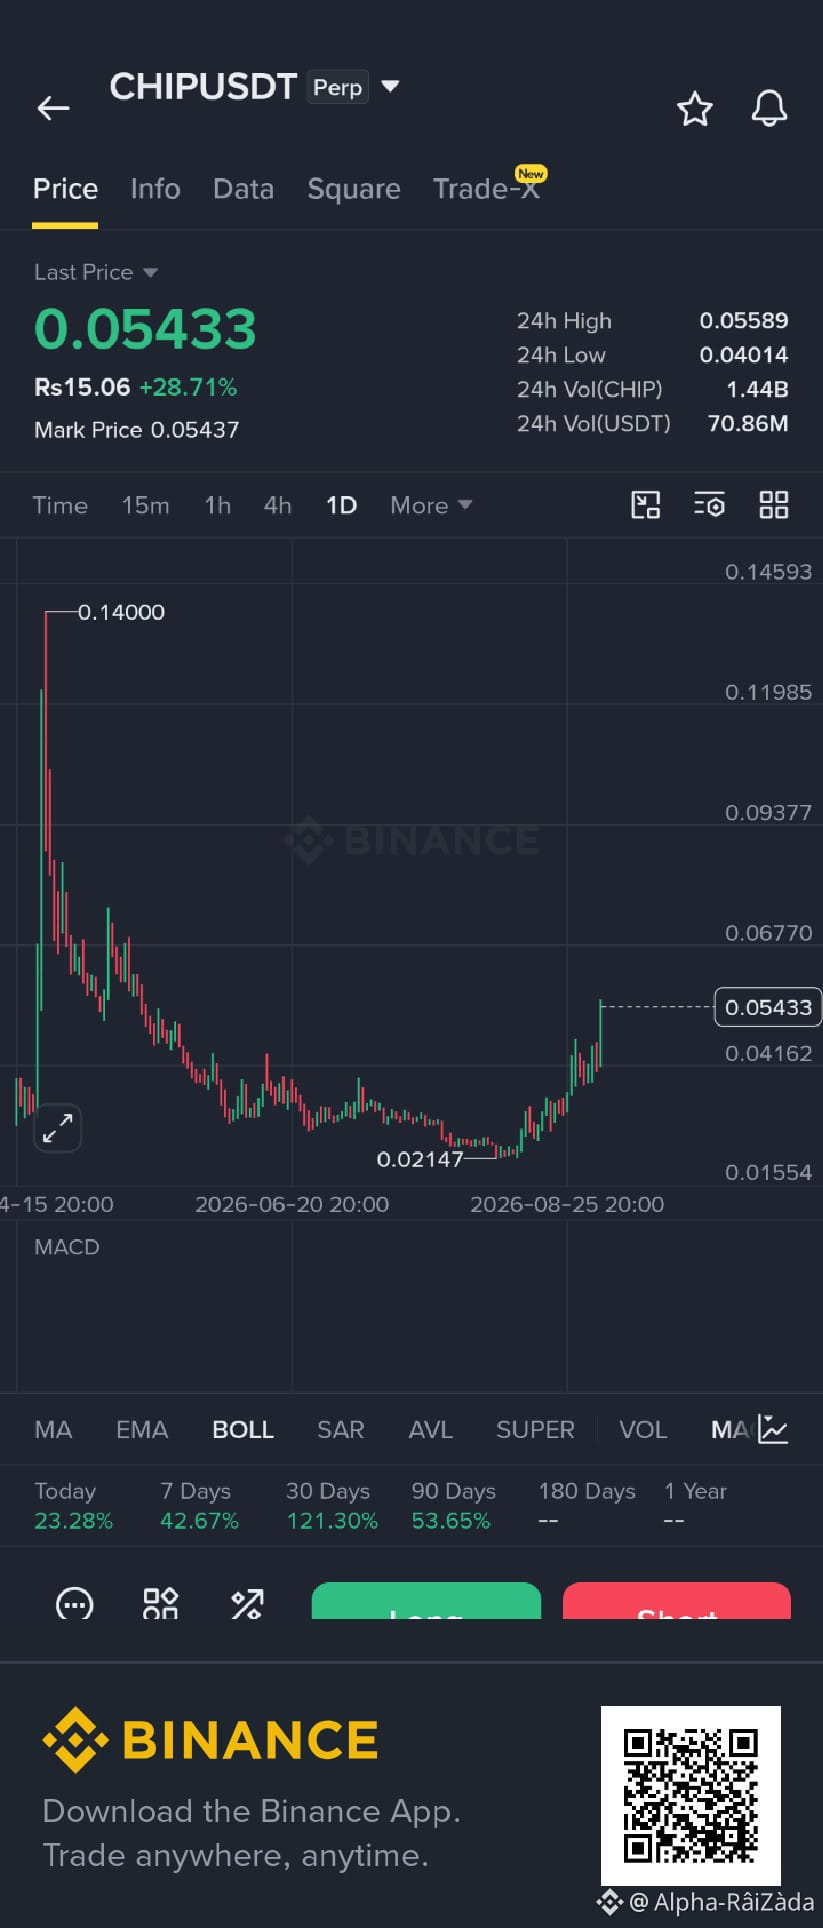
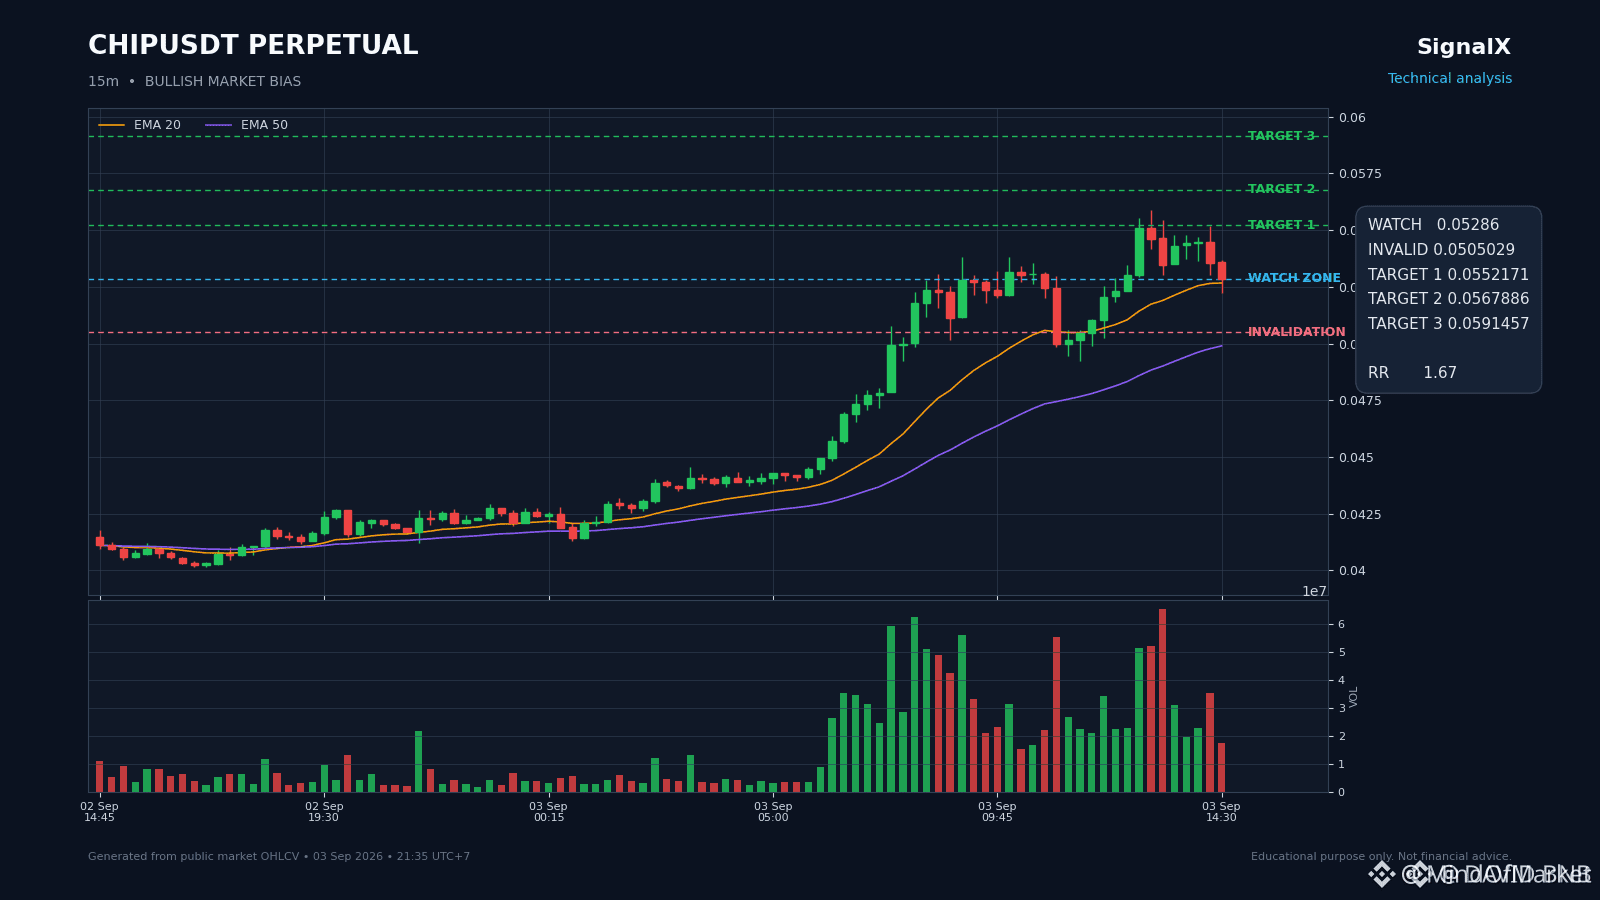
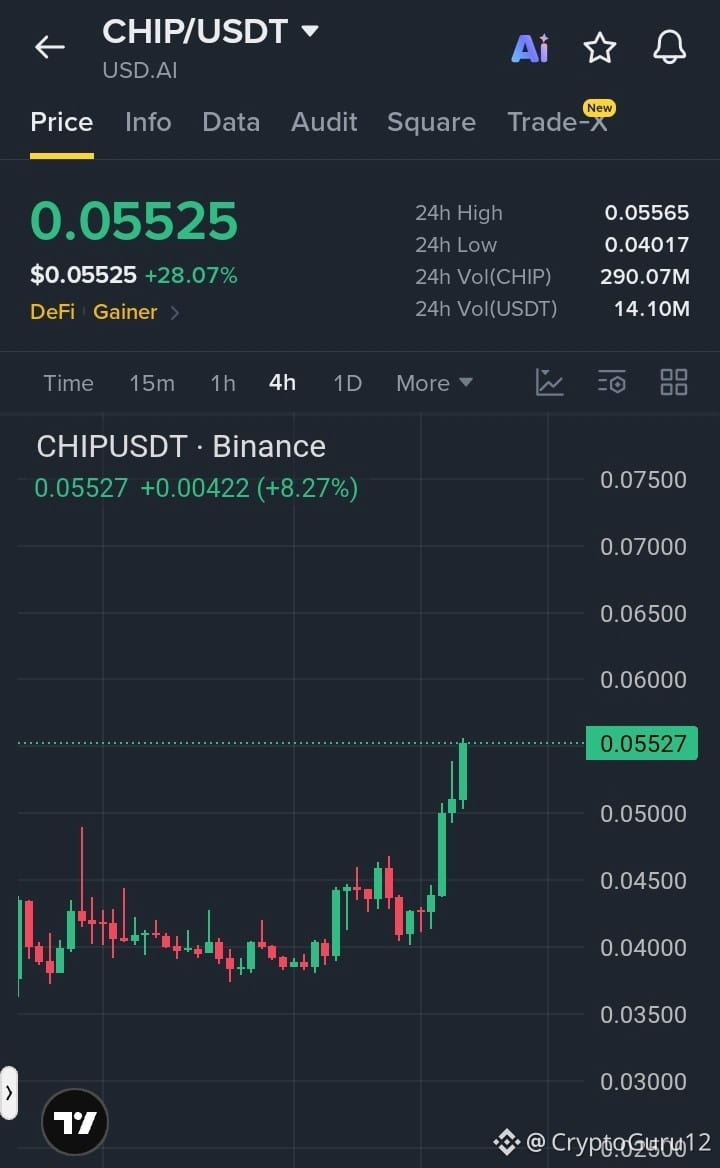
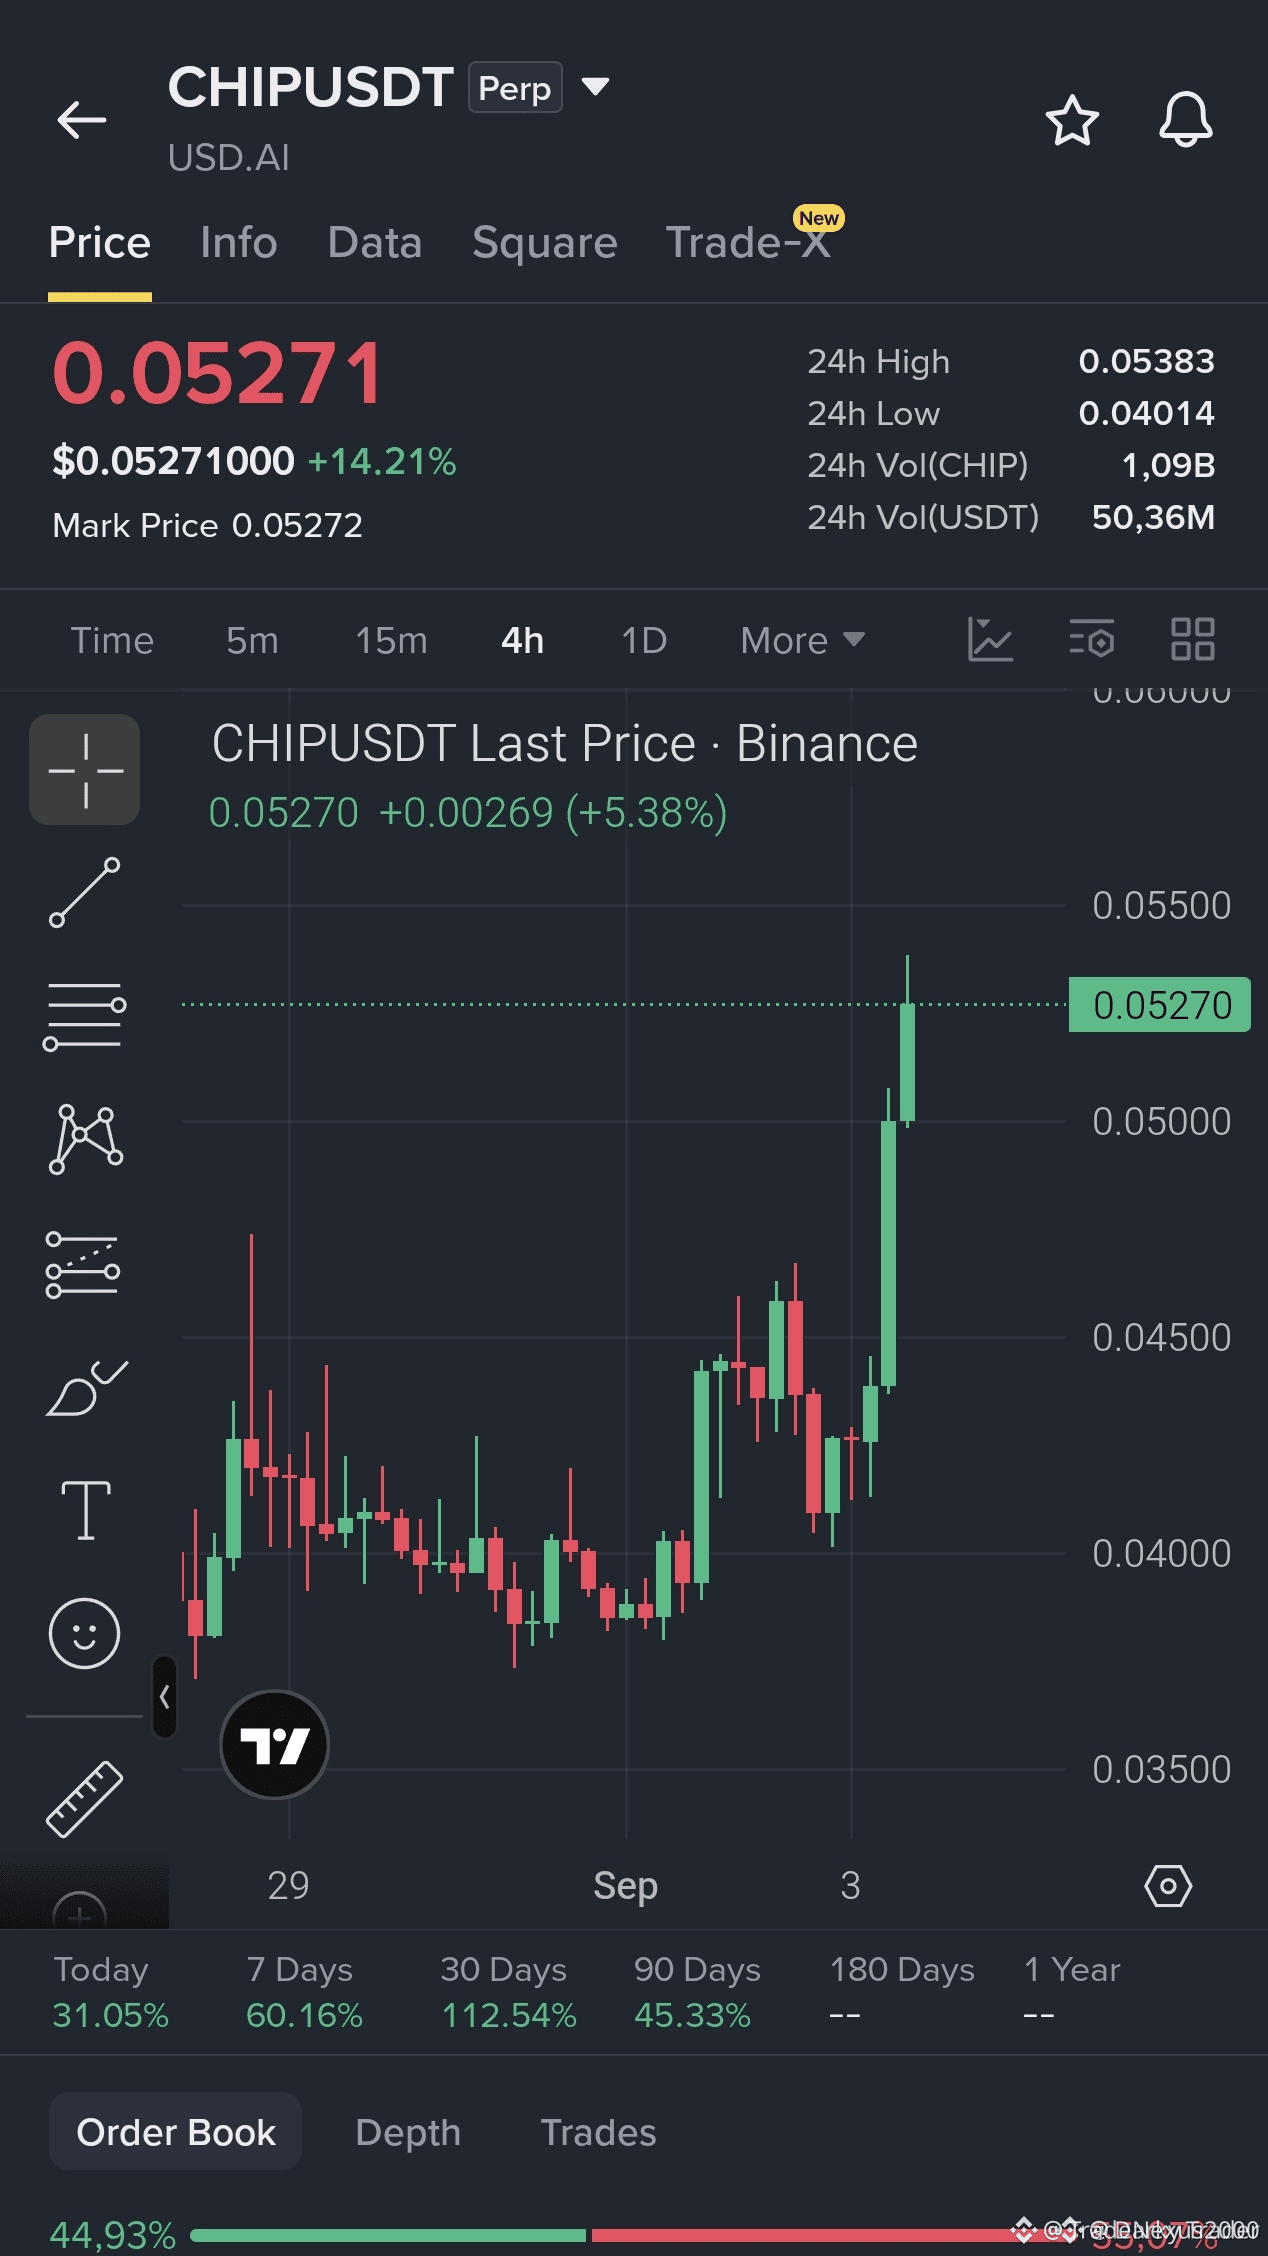
If right now you’re staring at this green candle, chances are you’re stuck in that “to board or not to board” kind of indecision—up 30% and still not in the trade, and that little itch in your mind is impossible to hide.
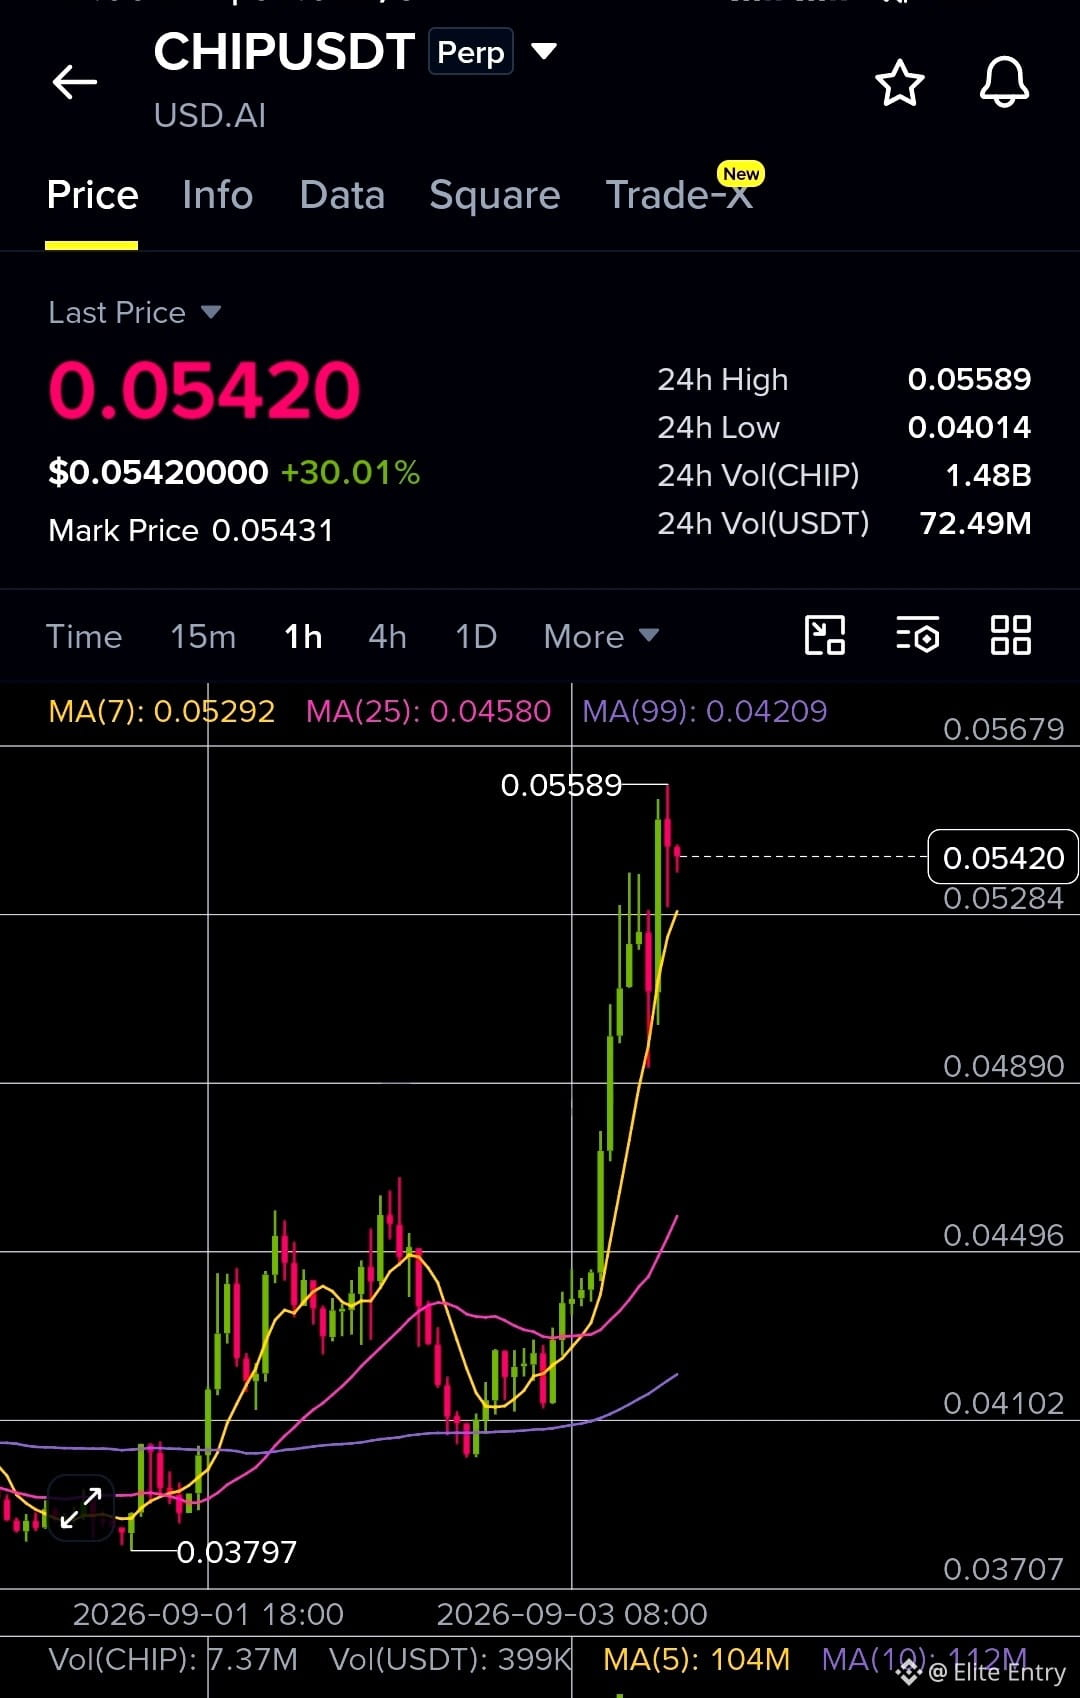
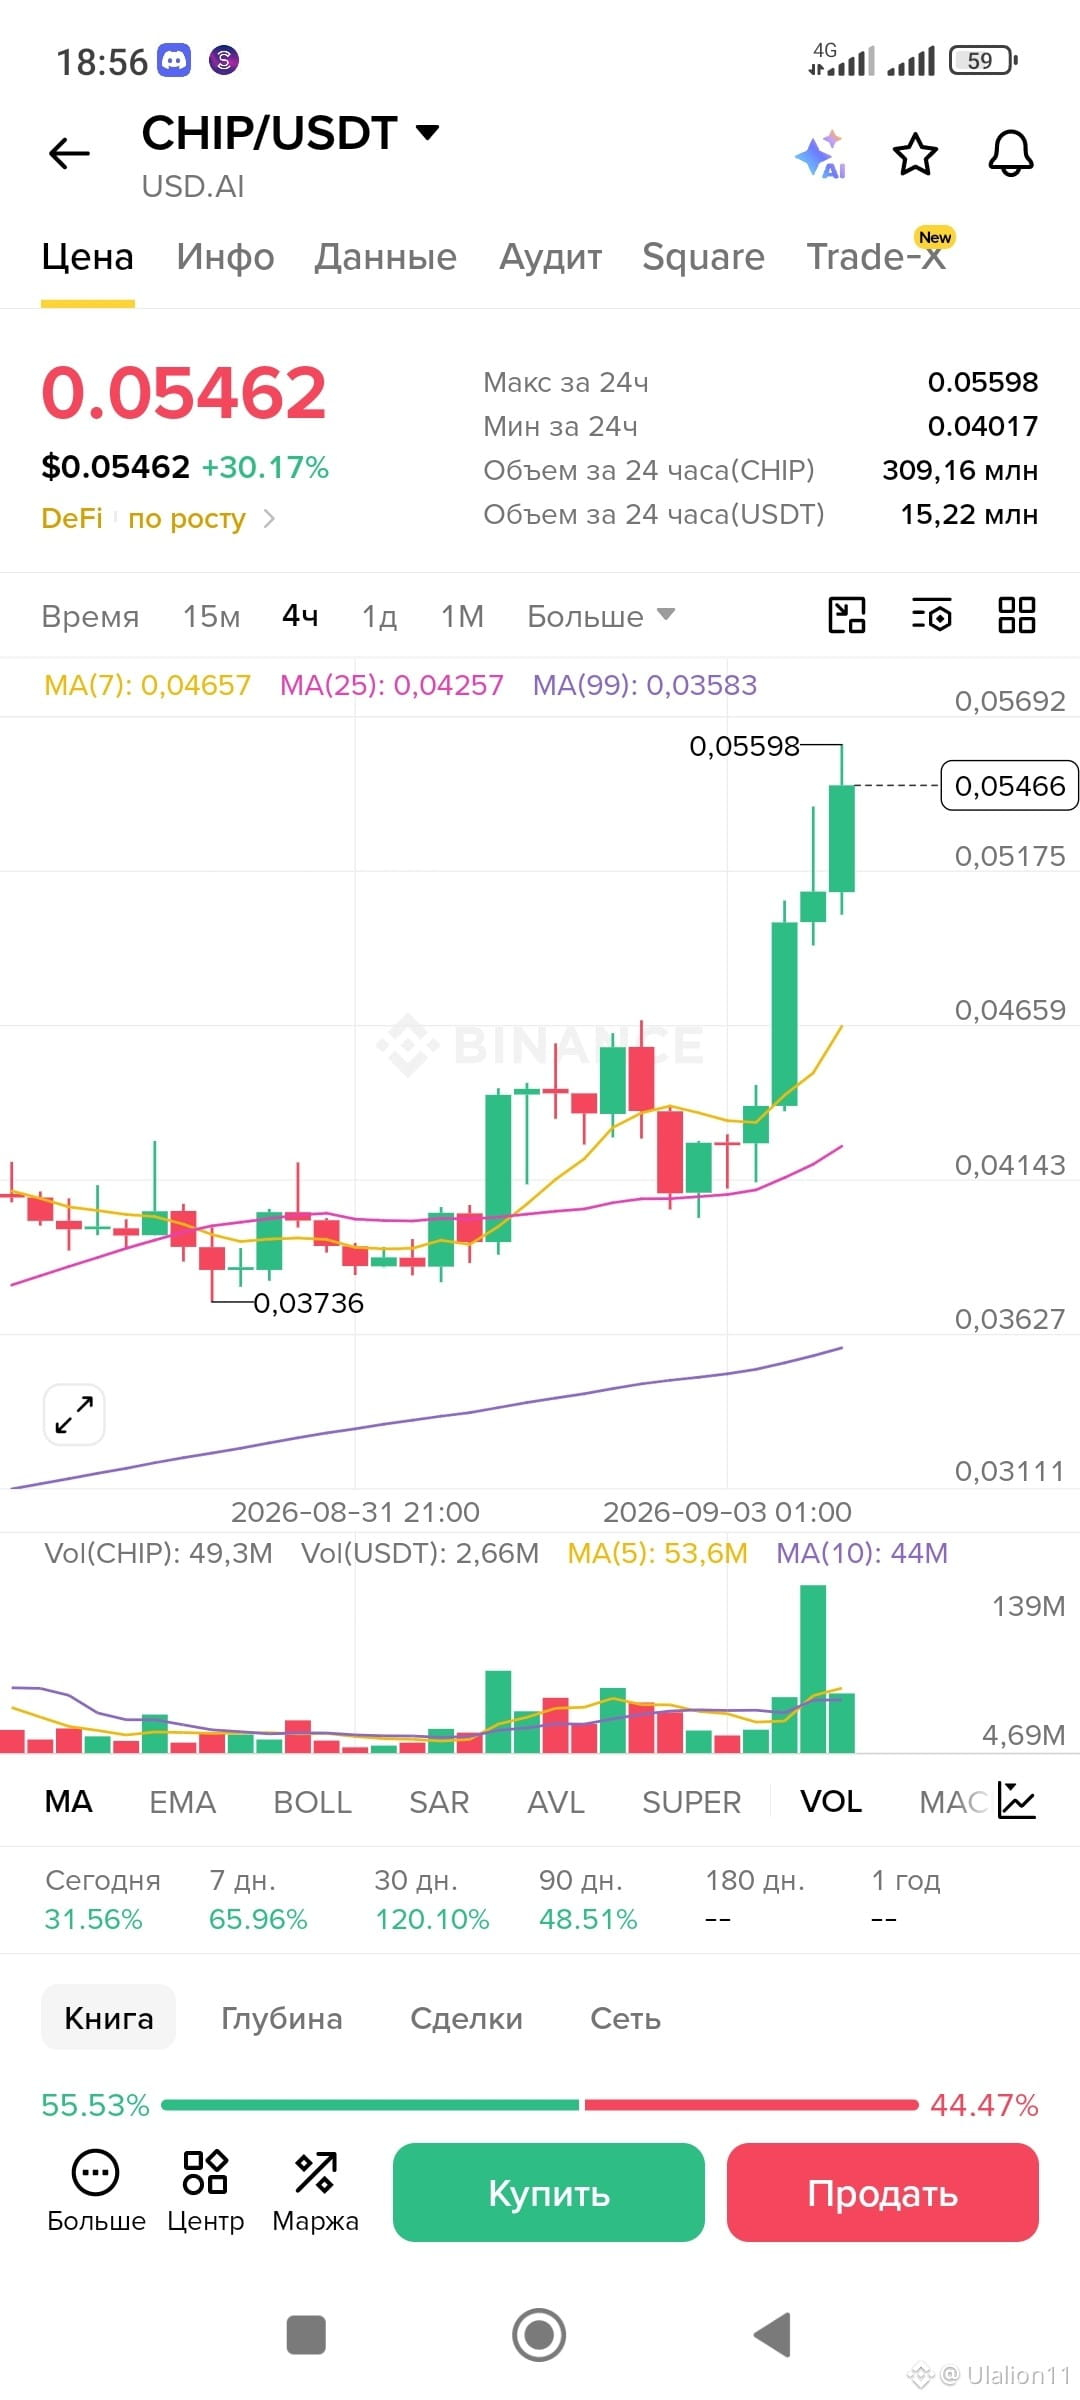
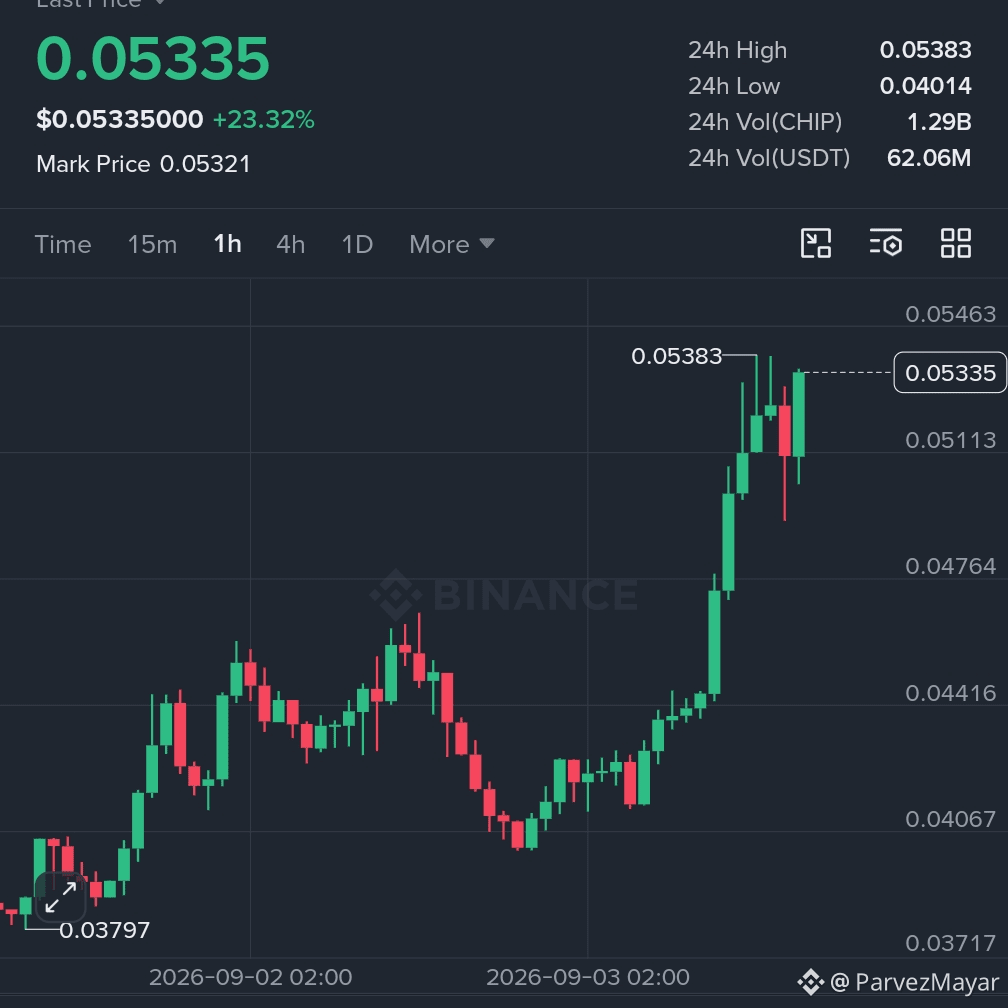
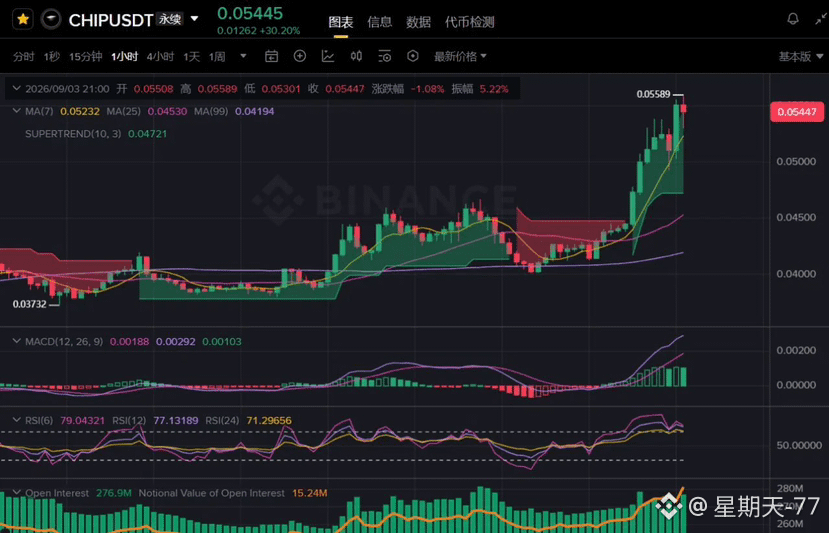
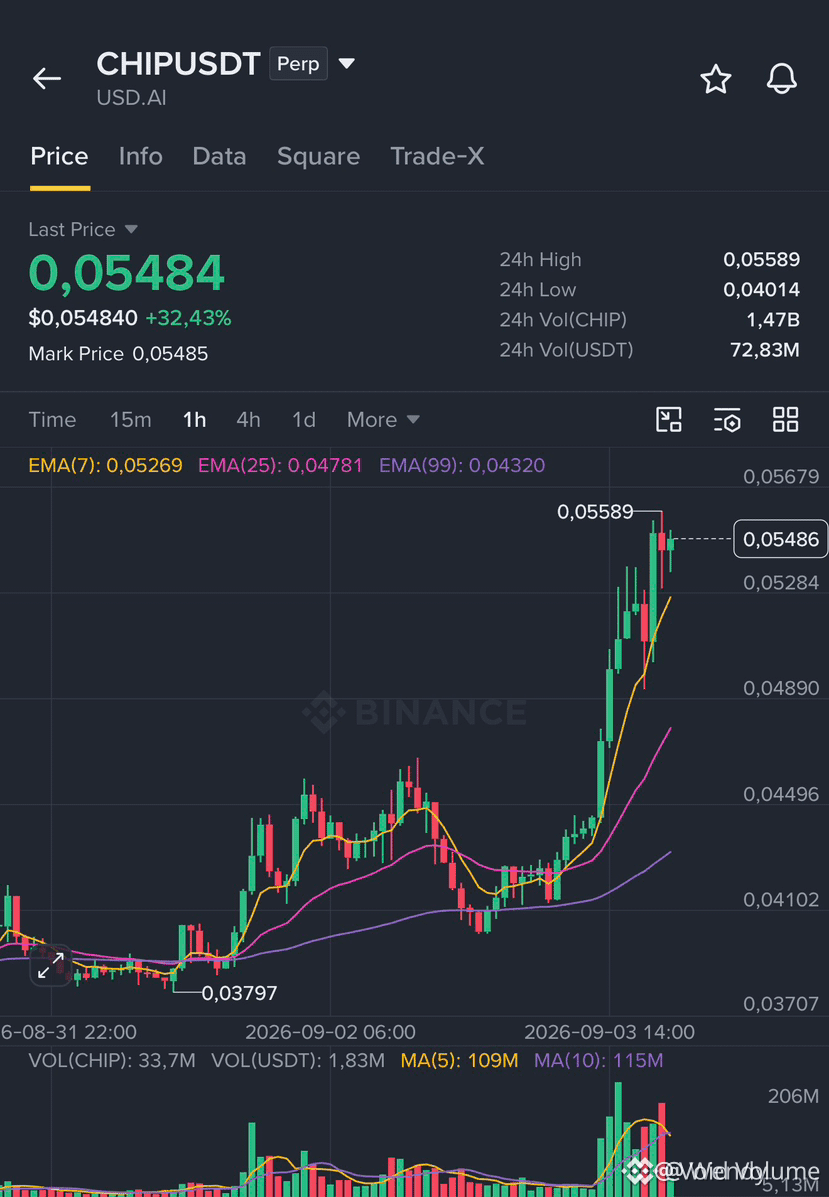
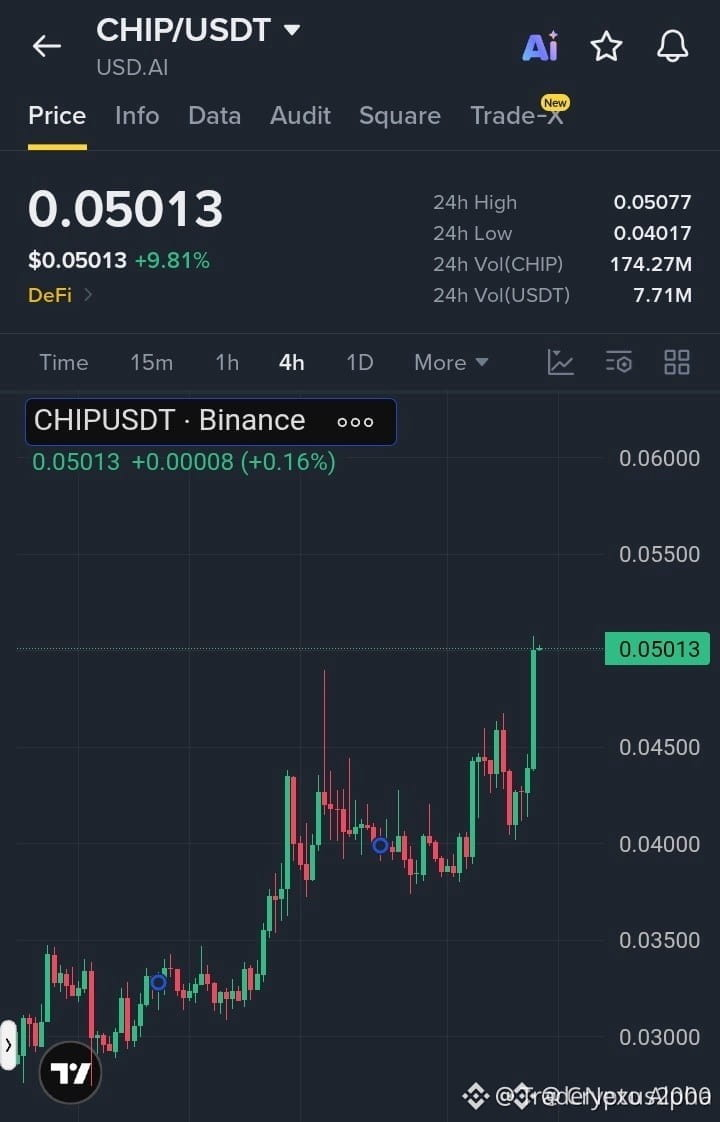
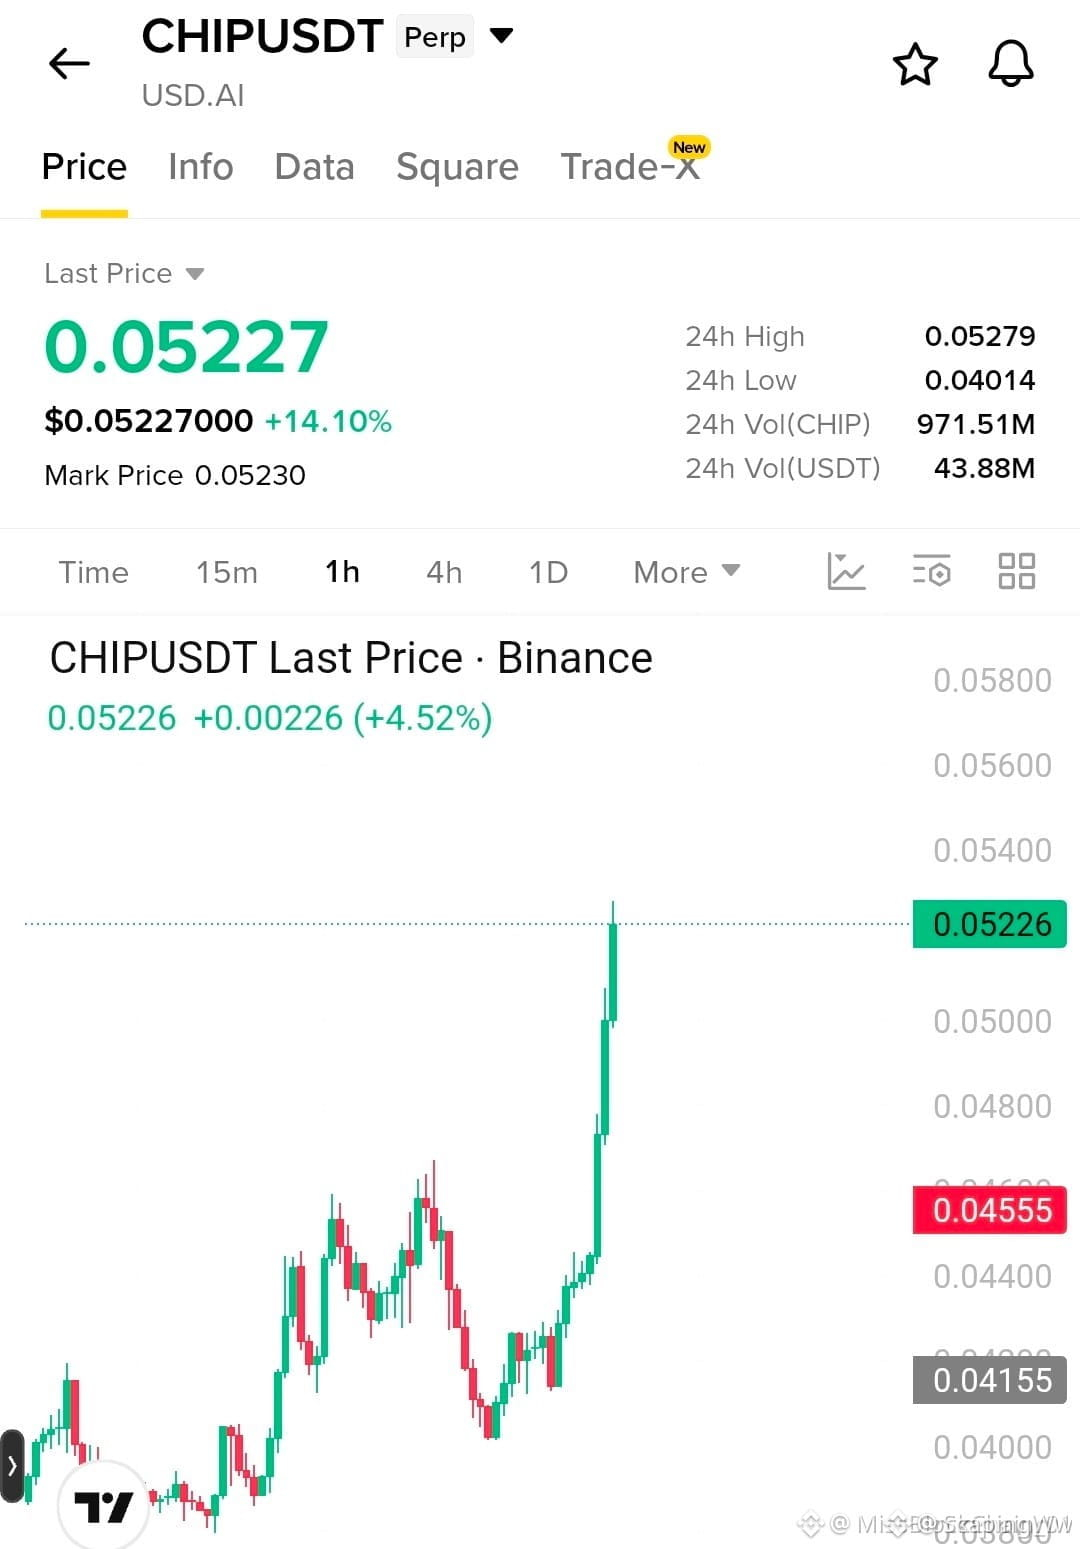
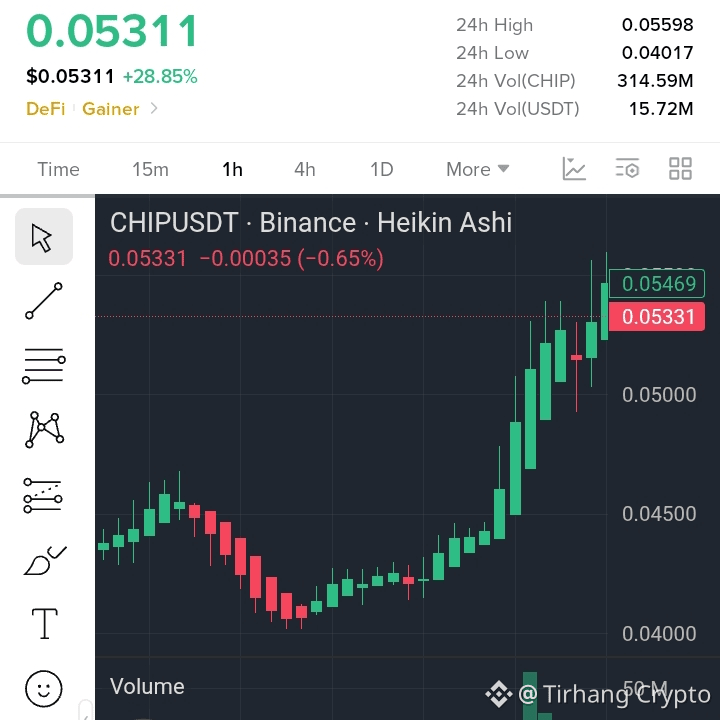
$CHIP , in the past 24 hours it’s up 30.2%: it surged from 0.03732 to a high of 0.05589, and the current price is 0.05445. Current 1-hour candle: it opened at 0.05508, climbed to 0.05589 and then pulled back, closing at 0.05447, down 1.08%, with an intraday range (amplitude) of 5.22%—“shaking” around the highs is the most straightforward message of this K-line.
On the indicator side: RSI(6), RSI(12), and RSI(24) are 79, 77, and 71 respectively—these three lines are all clustered in the overbought zone. The MACD histogram is still expanding, indicating that momentum hasn’t dissipated. Open Interest is also surging to a new high of 276.9M, suggesting this rally is accompanied by a large amount of new leverage involvement—not just spot-driven.
Historically, this kind of combination—“multiple indicators simultaneously overbought + Open Interest hitting a new high”—often corresponds to a phase when market sentiment is highly exuberant. But being overbought by itself doesn’t mean a reversal is imminent; “sentiment exhaustion” and “price topping out” are never the same thing. Between the two can be any length of time.
Old-timers looking at charts don’t really look at “should I jump in or not.” They look at “what are the people who are in this trade thinking right now?” With the moving averages fully diverging and price far away from all moving averages, it’s a classic “greed is written all over the face” situation. As for which direction it goes next, and for how long—no one can give you that conclusion, including me.
Are you feeling itchy to act right now, or are you already replaying what happened after your last chase higher?
Personal opinion, not investment advice
#chip #伊朗导弹无人机袭击科威特基地 #美国10年期美债收益率触及2023年11月来最高 $BTC $ETH