

#sol
sol
118.3M views
259,273 Discussing
Hot
Latest

·
--
Land Strategy | September 30th, Sola $SOL Today’s Trend Analysis
【Today’s Silk Road】
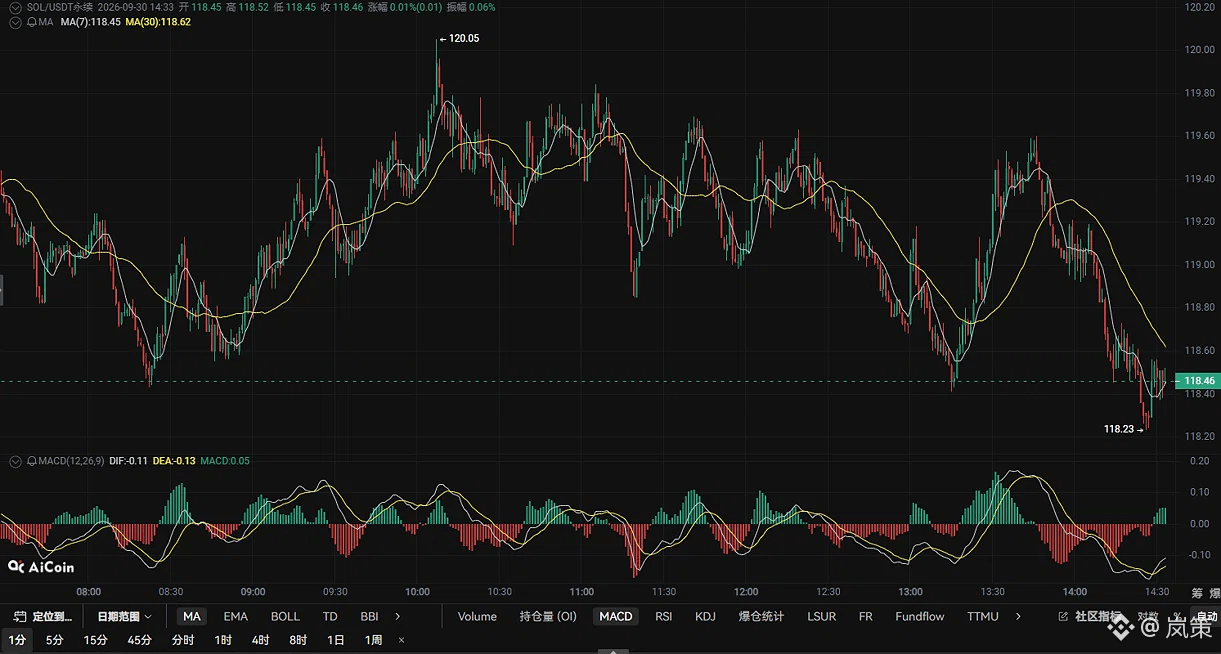
Entry: Buy on rebound 118.8—119.0 encountering resistance in the airspace, or buy on pullback 118.0—118.2 when it stabilizes.
Stop loss: For airspace orders, above 119.5; for long positions, below 117.5.
Take profit: First target 118.3, second target 117.8.
#sol
【Key Conclusion】
Sola fell from 120.05 in the morning all the way down to 118.23, then stabilized at a low level and rebounded to 118.46. Currently, below the MACD zero line, there are signs of a golden cross, indicating a short-term need for correction/repair. However, overhead moving averages are clearly suppressing price, so rebound strength is limited overall. The market is showing a bottom-searching recovery after a sharp selloff—not a one-way reversal. Support at 118.0 is the morning support zone; continuing to chase airspace opportunities there has extremely poor value.
#solana
【Trading Game Details】
Sola is volatile and impatient: it drops fast and rebounds fast. Chasing airspace at the current price may get swept from both above and below. Wait until it rebounds to 118.8—119.0 and hits resistance, then enter; target 118.3. If it gains volume and holds above 119.5, the Silk Road with airspace orders should be abandoned directly.
Land Strategy | September 30th, Sola $SOL Today’s Trend Analysis
【Today’s Silk Road】
Entry: Buy on rebound 118.8—119.0 encountering resistance in the airspace, or buy on pullback 118.0—118.2 when it stabilizes.
Stop loss: For airspace orders, above 119.5; for long positions, below 117.5.
Take profit: First target 118.3, second target 117.8.
#sol
【Key Conclusion】
Sola fell from 120.05 in the morning all the way down to 118.23, then stabilized at a low level and rebounded to 118.46. Currently, below the MACD zero line, there are signs of a golden cross, indicating a short-term need for correction/repair. However, overhead moving averages are clearly suppressing price, so rebound strength is limited overall. The market is showing a bottom-searching recovery after a sharp selloff—not a one-way reversal. Support at 118.0 is the morning support zone; continuing to chase airspace opportunities there has extremely poor value.
#solana
【Trading Game Details】
Sola is volatile and impatient: it drops fast and rebounds fast. Chasing airspace at the current price may get swept from both above and below. Wait until it rebounds to 118.8—119.0 and hits resistance, then enter; target 118.3. If it gains volume and holds above 119.5, the Silk Road with airspace orders should be abandoned directly.
【Today’s Silk Road】
Entry: Buy on rebound 118.8—119.0 encountering resistance in the airspace, or buy on pullback 118.0—118.2 when it stabilizes.
Stop loss: For airspace orders, above 119.5; for long positions, below 117.5.
Take profit: First target 118.3, second target 117.8.
#sol
【Key Conclusion】
Sola fell from 120.05 in the morning all the way down to 118.23, then stabilized at a low level and rebounded to 118.46. Currently, below the MACD zero line, there are signs of a golden cross, indicating a short-term need for correction/repair. However, overhead moving averages are clearly suppressing price, so rebound strength is limited overall. The market is showing a bottom-searching recovery after a sharp selloff—not a one-way reversal. Support at 118.0 is the morning support zone; continuing to chase airspace opportunities there has extremely poor value.
#solana
【Trading Game Details】
Sola is volatile and impatient: it drops fast and rebounds fast. Chasing airspace at the current price may get swept from both above and below. Wait until it rebounds to 118.8—119.0 and hits resistance, then enter; target 118.3. If it gains volume and holds above 119.5, the Silk Road with airspace orders should be abandoned directly.
2
1.1k

🔥 Analysis and monitoring of $SOL (Solana) — a buying opportunity
🟢 Instant trading
💰 Current price: 119.66$
🎯 First target: 121.50$
🎯 Second target: 123.00$
🎯 Third target: 124.95$
🎯 Fourth target: 128.50$
🛑 Stop loss: 116.00$
🗣️ Let’s talk a bit about the coin
Solana is one of the strong coins in the market, and its recent movement shows it’s trying to regain momentum after dropping from the 124.95$ area.
📊 Technical indicators
🔹 The moving averages indicator is near the price, which gives an opportunity for a new move if the price can hold above the 118$ area.
🔹 The MACD indicator has started improving and the current reading is positive, which may support the continuation of the rebound.
🔹 The RSI indicator is close to the 50 level, meaning there’s no overbought situation right now and the momentum is still able to improve.
💡 Tip
If the price confirms above the 118$ area and holds onto momentum, we may see an attempt to reach the targets gradually. It’s best not to rush the entry with the full amount.
⚠️ Warning
The market is volatile, and sticking to the stop loss is essential, especially if the price breaks the 116$ area.
#solana
#sol
{spot}(SOLUSDT)
🔥 Analysis and monitoring of $SOL (Solana) — a buying opportunity
🟢 Instant trading
💰 Current price: 119.66$
🎯 First target: 121.50$
🎯 Second target: 123.00$
🎯 Third target: 124.95$
🎯 Fourth target: 128.50$
🛑 Stop loss: 116.00$
🗣️ Let’s talk a bit about the coin
Solana is one of the strong coins in the market, and its recent movement shows it’s trying to regain momentum after dropping from the 124.95$ area.
📊 Technical indicators
🔹 The moving averages indicator is near the price, which gives an opportunity for a new move if the price can hold above the 118$ area.
🔹 The MACD indicator has started improving and the current reading is positive, which may support the continuation of the rebound.
🔹 The RSI indicator is close to the 50 level, meaning there’s no overbought situation right now and the momentum is still able to improve.
💡 Tip
If the price confirms above the 118$ area and holds onto momentum, we may see an attempt to reach the targets gradually. It’s best not to rush the entry with the full amount.
⚠️ Warning
The market is volatile, and sticking to the stop loss is essential, especially if the price breaks the 116$ area.
#solana
#sol
🟢 Instant trading
💰 Current price: 119.66$
🎯 First target: 121.50$
🎯 Second target: 123.00$
🎯 Third target: 124.95$
🎯 Fourth target: 128.50$
🛑 Stop loss: 116.00$
🗣️ Let’s talk a bit about the coin
Solana is one of the strong coins in the market, and its recent movement shows it’s trying to regain momentum after dropping from the 124.95$ area.
📊 Technical indicators
🔹 The moving averages indicator is near the price, which gives an opportunity for a new move if the price can hold above the 118$ area.
🔹 The MACD indicator has started improving and the current reading is positive, which may support the continuation of the rebound.
🔹 The RSI indicator is close to the 50 level, meaning there’s no overbought situation right now and the momentum is still able to improve.
💡 Tip
If the price confirms above the 118$ area and holds onto momentum, we may see an attempt to reach the targets gradually. It’s best not to rush the entry with the full amount.
⚠️ Warning
The market is volatile, and sticking to the stop loss is essential, especially if the price breaks the 116$ area.
#solana
#sol

1
1.3k

·
--
Disputed
My wallet watching me put more capital into Solana after promising that "this time I would actually diversify". 🫠💸
No joke, the $SOL thing has stopped being just speculation. Seeing the network break records with over 100 million active addresses in September shows that real people are using it. Whether it’s the madness of the memes, DeFi, or the Artificial Intelligence projects that are being built on top of it, the ecosystem is more alive than ever.
For me, it’s not a coin to trade the day’s scare; I hold it long-term because the speed and low fees keep winning over the competition.
#Crypto #Solana #SOL #Binance
{spot}(SOLUSDT)
My wallet watching me put more capital into Solana after promising that "this time I would actually diversify". 🫠💸
No joke, the $SOL thing has stopped being just speculation. Seeing the network break records with over 100 million active addresses in September shows that real people are using it. Whether it’s the madness of the memes, DeFi, or the Artificial Intelligence projects that are being built on top of it, the ecosystem is more alive than ever.
For me, it’s not a coin to trade the day’s scare; I hold it long-term because the speed and low fees keep winning over the competition.
#Crypto #Solana #SOL #Binance
No joke, the $SOL thing has stopped being just speculation. Seeing the network break records with over 100 million active addresses in September shows that real people are using it. Whether it’s the madness of the memes, DeFi, or the Artificial Intelligence projects that are being built on top of it, the ecosystem is more alive than ever.
For me, it’s not a coin to trade the day’s scare; I hold it long-term because the speed and low fees keep winning over the competition.
#Crypto #Solana #SOL #Binance
3
710

Verified
Article
🚨 SOLANA BREAKING: RECORD $188M ETF INFLOWS PUT SOL IN THE SPOTLIGHT🚨 SOLANA BREAKING: INSTITUTIONAL MONEY JUST HIT A RECORD
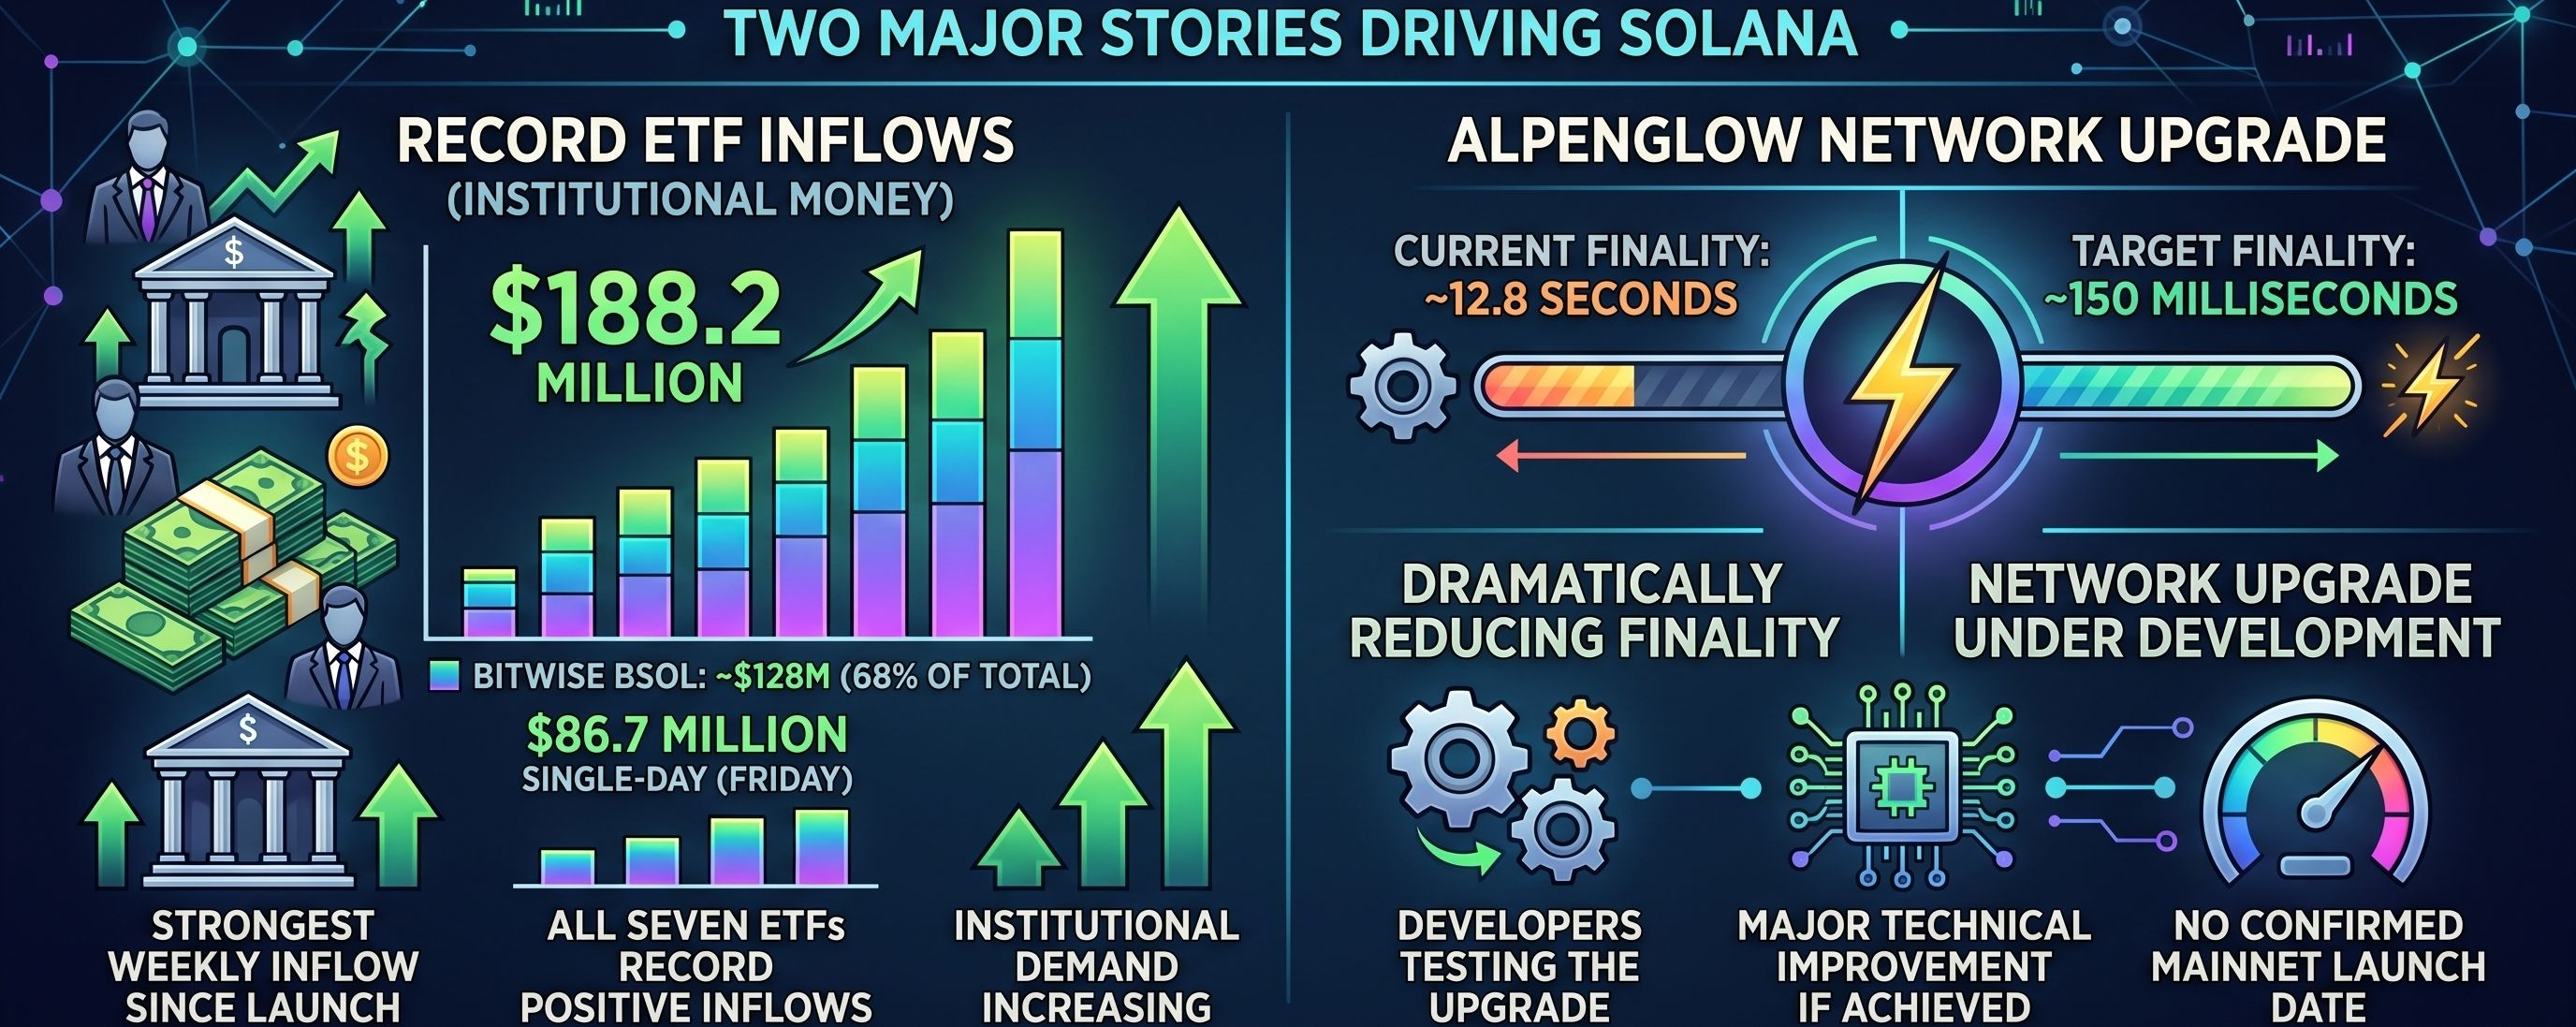
Solana is getting fresh attention from institutional investors after U.S. spot Solana ETFs recorded a record $188.2 million in net inflows last week.
💰 RECORD WEEKLY INFLOWS
The $188.2 million figure marks the strongest weekly inflow since Solana ETFs launched.
Even more interesting:
📊 All seven Solana ETFs recorded positive inflows.
🔥 Friday alone saw around $86.7 million in net inflows, making it the strongest single-day inflow since the products launched.
One of the biggest contributors was Bitwise’s BSOL, which attracted roughly $128 million during the week — around 68% of the total weekly inflows.
⚙️ BUT THE ETF STORY ISN’T THE ONLY DEVELOPMENT
Solana is also moving toward a major network upgrade known as Alpenglow.
Developers are testing the upgrade with the goal of dramatically reducing transaction finality.
Solana’s current finality process can take around 12.8 seconds, while Alpenglow is targeting finality of roughly 150 milliseconds.
If the targeted performance is achieved after deployment, it could represent a major technical improvement for the network.
However, Alpenglow is still being tested, and there is currently no confirmed mainnet launch date.
🎯 WHY THIS MATTERS
Solana now has two major stories developing at the same time:
🏦 Record institutional ETF inflows
⚙️ A major network upgrade under development
That combination is putting SOL firmly on the market’s radar.
⚠️ But there is an important point to remember:
Record ETF inflows do not guarantee that SOL’s price will continue higher.
The bigger question is whether institutional demand can remain strong after this record week — and whether Alpenglow can deliver the improvements developers are targeting.
👀 THE BIGGER SOLANA STORY
Solana is becoming more than just a price-movement story.
Institutional demand is increasing through regulated investment products, while developers are simultaneously working on major improvements to the underlying network.
The next phase could depend on whether these two stories continue to develop together.
$SOL
#SOL #Solana #blackchain #BTC #cryptouniverseofficial
🚨 SOLANA BREAKING: RECORD $188M ETF INFLOWS PUT SOL IN THE SPOTLIGHT
🚨 SOLANA BREAKING: INSTITUTIONAL MONEY JUST HIT A RECORD
Solana is getting fresh attention from institutional investors after U.S. spot Solana ETFs recorded a record $188.2 million in net inflows last week.
💰 RECORD WEEKLY INFLOWS
The $188.2 million figure marks the strongest weekly inflow since Solana ETFs launched.
Even more interesting:
📊 All seven Solana ETFs recorded positive inflows.
🔥 Friday alone saw around $86.7 million in net inflows, making it the strongest single-day inflow since the products launched.
One of the biggest contributors was Bitwise’s BSOL, which attracted roughly $128 million during the week — around 68% of the total weekly inflows.
⚙️ BUT THE ETF STORY ISN’T THE ONLY DEVELOPMENT
Solana is also moving toward a major network upgrade known as Alpenglow.
Developers are testing the upgrade with the goal of dramatically reducing transaction finality.
Solana’s current finality process can take around 12.8 seconds, while Alpenglow is targeting finality of roughly 150 milliseconds.
If the targeted performance is achieved after deployment, it could represent a major technical improvement for the network.
However, Alpenglow is still being tested, and there is currently no confirmed mainnet launch date.
🎯 WHY THIS MATTERS
Solana now has two major stories developing at the same time:
🏦 Record institutional ETF inflows
⚙️ A major network upgrade under development
That combination is putting SOL firmly on the market’s radar.
⚠️ But there is an important point to remember:
Record ETF inflows do not guarantee that SOL’s price will continue higher.
The bigger question is whether institutional demand can remain strong after this record week — and whether Alpenglow can deliver the improvements developers are targeting.
👀 THE BIGGER SOLANA STORY
Solana is becoming more than just a price-movement story.
Institutional demand is increasing through regulated investment products, while developers are simultaneously working on major improvements to the underlying network.
The next phase could depend on whether these two stories continue to develop together.
$SOL
#SOL #Solana #blackchain #BTC #cryptouniverseofficial
Solana is getting fresh attention from institutional investors after U.S. spot Solana ETFs recorded a record $188.2 million in net inflows last week.
💰 RECORD WEEKLY INFLOWS
The $188.2 million figure marks the strongest weekly inflow since Solana ETFs launched.
Even more interesting:
📊 All seven Solana ETFs recorded positive inflows.
🔥 Friday alone saw around $86.7 million in net inflows, making it the strongest single-day inflow since the products launched.
One of the biggest contributors was Bitwise’s BSOL, which attracted roughly $128 million during the week — around 68% of the total weekly inflows.
⚙️ BUT THE ETF STORY ISN’T THE ONLY DEVELOPMENT
Solana is also moving toward a major network upgrade known as Alpenglow.
Developers are testing the upgrade with the goal of dramatically reducing transaction finality.
Solana’s current finality process can take around 12.8 seconds, while Alpenglow is targeting finality of roughly 150 milliseconds.
If the targeted performance is achieved after deployment, it could represent a major technical improvement for the network.
However, Alpenglow is still being tested, and there is currently no confirmed mainnet launch date.
🎯 WHY THIS MATTERS
Solana now has two major stories developing at the same time:
🏦 Record institutional ETF inflows
⚙️ A major network upgrade under development
That combination is putting SOL firmly on the market’s radar.
⚠️ But there is an important point to remember:
Record ETF inflows do not guarantee that SOL’s price will continue higher.
The bigger question is whether institutional demand can remain strong after this record week — and whether Alpenglow can deliver the improvements developers are targeting.
👀 THE BIGGER SOLANA STORY
Solana is becoming more than just a price-movement story.
Institutional demand is increasing through regulated investment products, while developers are simultaneously working on major improvements to the underlying network.
The next phase could depend on whether these two stories continue to develop together.
$SOL
#SOL #Solana #blackchain #BTC #cryptouniverseofficial
AngelOfCrypto_-:
nice
2
1.1k


·
--
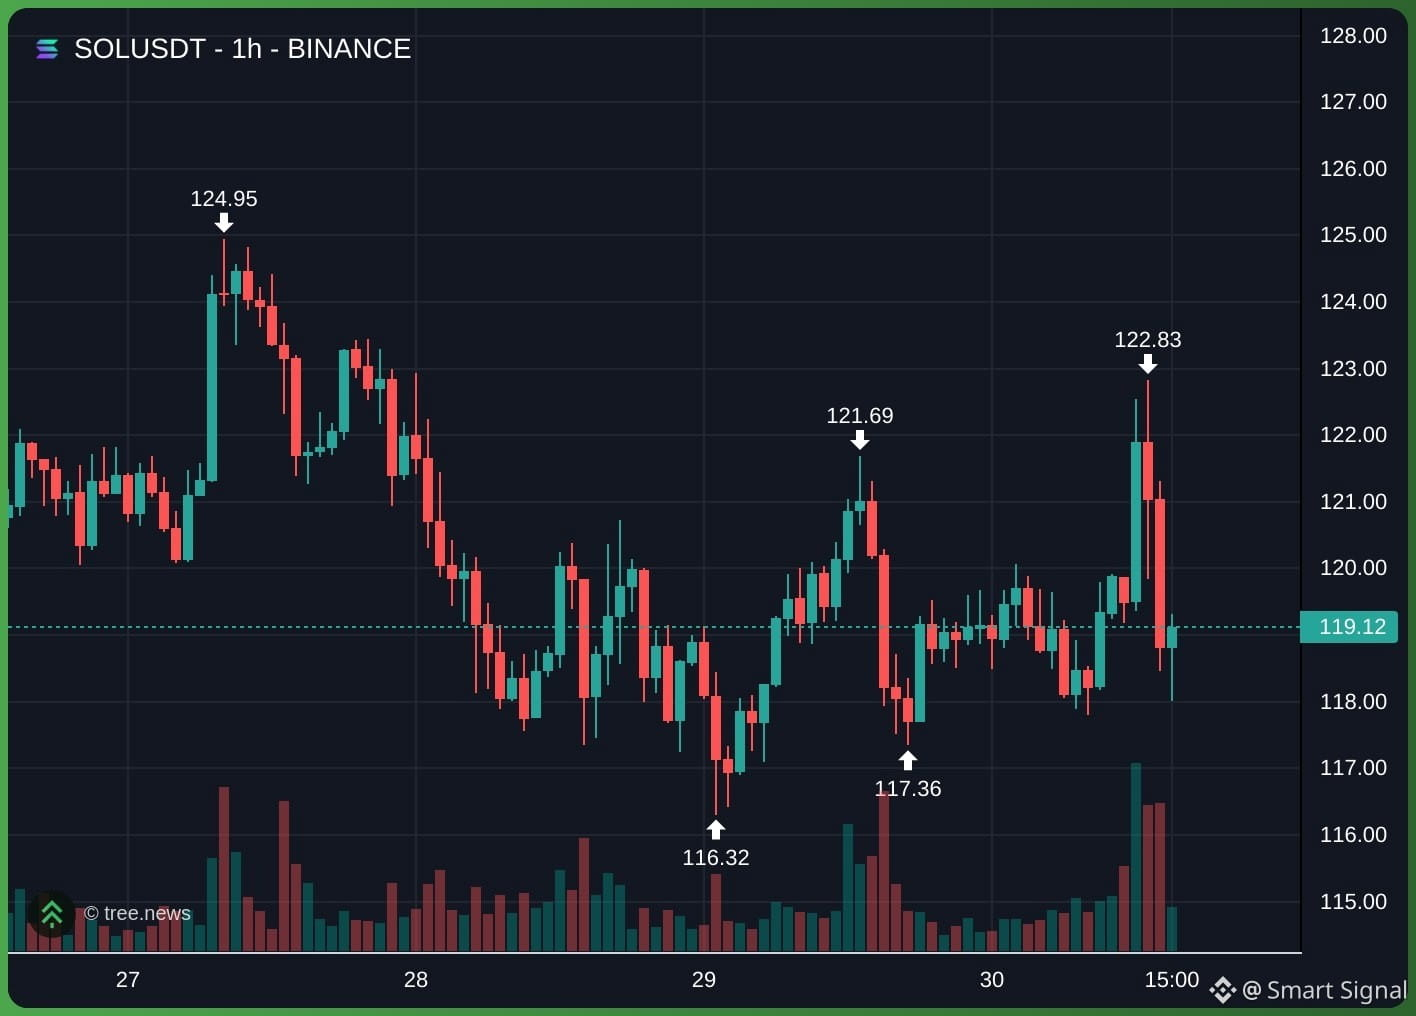
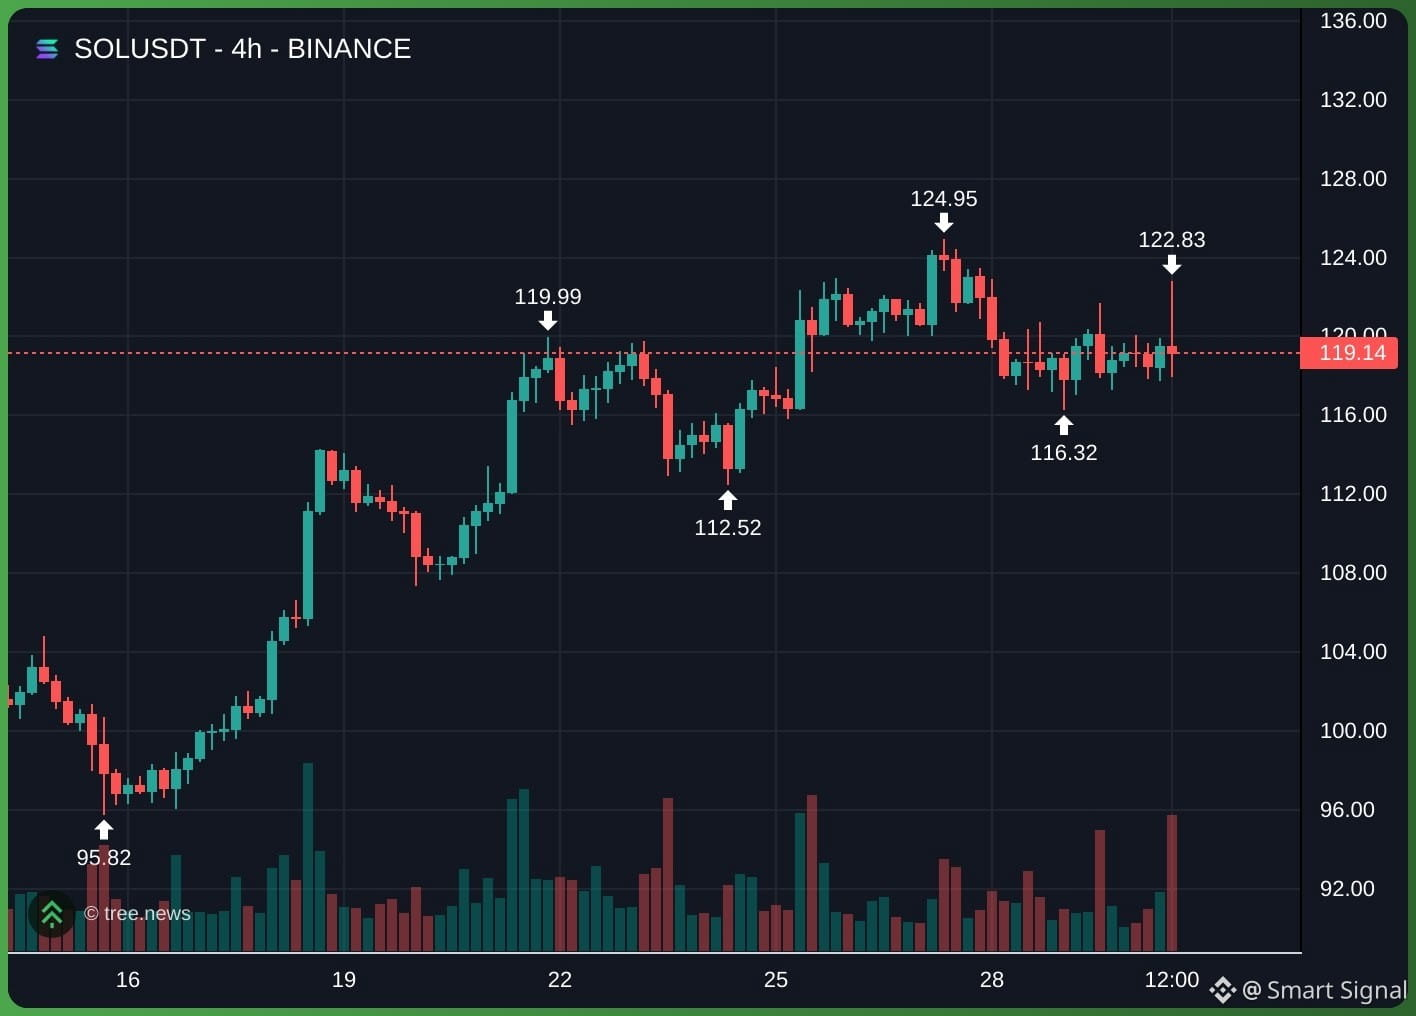
$SOL is entering a sideways consolidation phase within a wide range from 116 to 124.
· The crucial hard support zone to hold is 112. If this zone is lost, the medium-term uptrend will be threatened.
· Selling pressure at the 122 zone is very clear, as evidenced by long upper wicks with high volume, indicating that sellers are controlling this resistance level.
🎯 TRADING SET UP
· $SOL Scenario Long (Buying the accumulation dip) - Catching the rebound 📈
· Condition: Price successfully retests 116 - 117 support zone and prints a bullish reversal candle
· Entry: 116 to 117
· SL: below 112 (recent medium-term bottom)
· TP: Target 1 at 122; Target 2 at 124
· $SOL Scenario Short (Selling the rally) - Catching the correction 📉
· Condition: Price recovers to 122 - 124 resistance zone but faces strong rejection
· Entry: 122 to 124
· SL: above 128 (above recent peak)
· TP: Target 1 at 120; Target 2 at 116. If it breaks 116, the next target is 112
Support me just Trade here👇
{future}(SOLUSDT)
#sol #Solana
$SOL is entering a sideways consolidation phase within a wide range from 116 to 124.
· The crucial hard support zone to hold is 112. If this zone is lost, the medium-term uptrend will be threatened.
· Selling pressure at the 122 zone is very clear, as evidenced by long upper wicks with high volume, indicating that sellers are controlling this resistance level.
🎯 TRADING SET UP
· $SOL Scenario Long (Buying the accumulation dip) - Catching the rebound 📈
· Condition: Price successfully retests 116 - 117 support zone and prints a bullish reversal candle
· Entry: 116 to 117
· SL: below 112 (recent medium-term bottom)
· TP: Target 1 at 122; Target 2 at 124
· $SOL Scenario Short (Selling the rally) - Catching the correction 📉
· Condition: Price recovers to 122 - 124 resistance zone but faces strong rejection
· Entry: 122 to 124
· SL: above 128 (above recent peak)
· TP: Target 1 at 120; Target 2 at 116. If it breaks 116, the next target is 112
Support me just Trade here👇
#sol #Solana
· The crucial hard support zone to hold is 112. If this zone is lost, the medium-term uptrend will be threatened.
· Selling pressure at the 122 zone is very clear, as evidenced by long upper wicks with high volume, indicating that sellers are controlling this resistance level.
🎯 TRADING SET UP
· $SOL Scenario Long (Buying the accumulation dip) - Catching the rebound 📈
· Condition: Price successfully retests 116 - 117 support zone and prints a bullish reversal candle
· Entry: 116 to 117
· SL: below 112 (recent medium-term bottom)
· TP: Target 1 at 122; Target 2 at 124
· $SOL Scenario Short (Selling the rally) - Catching the correction 📉
· Condition: Price recovers to 122 - 124 resistance zone but faces strong rejection
· Entry: 122 to 124
· SL: above 128 (above recent peak)
· TP: Target 1 at 120; Target 2 at 116. If it breaks 116, the next target is 112
Support me just Trade here👇
#sol #Solana
689

Peace be upon you, dear friends. We’re with you to follow the live technical movements of the fresh Solana (SOL$ ) coin today.
📊 Real-time Market Update (Spot):
Solana shows excellent consolidation and a positively ascending momentum, with trading currently steady above the 121.50$ levels. This move provides investors with excellent accumulation signals to build strong investment positions in the medium term in the safer Spot market.
{spot}(SOLUSDT)
📈 The technical levels we are carefully monitoring:
• Key support zones: strong and stable around the 119.20$ levels, which act as a bounce point and good protection for the current buy orders.
• Near-term targets: if the current momentum is maintained and we break the nearby resistance levels at 123.80$, we expect continuation toward the 126.00$ levels.
💡 Our steady investment rule:
We always remind you of the importance of protecting your portfolio. We focus entirely on buying and gradual strengthening through Spot trades, and we decisively stay away from the risks of leverage and futures.
👇 Follow the price movement and seize the opportunity:
Press the SOL$ coin button attached below to follow the chart and start immediately and safely, and share with us in the comments: what is your next target for Solana?
Write2Earn#
Solana#
#SOL #CryptoTrading
BinanceSquare#
Peace be upon you, dear friends. We’re with you to follow the live technical movements of the fresh Solana (SOL$ ) coin today.
📊 Real-time Market Update (Spot):
Solana shows excellent consolidation and a positively ascending momentum, with trading currently steady above the 121.50$ levels. This move provides investors with excellent accumulation signals to build strong investment positions in the medium term in the safer Spot market.
📈 The technical levels we are carefully monitoring:
• Key support zones: strong and stable around the 119.20$ levels, which act as a bounce point and good protection for the current buy orders.
• Near-term targets: if the current momentum is maintained and we break the nearby resistance levels at 123.80$, we expect continuation toward the 126.00$ levels.
💡 Our steady investment rule:
We always remind you of the importance of protecting your portfolio. We focus entirely on buying and gradual strengthening through Spot trades, and we decisively stay away from the risks of leverage and futures.
👇 Follow the price movement and seize the opportunity:
Press the SOL$ coin button attached below to follow the chart and start immediately and safely, and share with us in the comments: what is your next target for Solana?
Write2Earn#
Solana#
#SOL #CryptoTrading
BinanceSquare#
📊 Real-time Market Update (Spot):
Solana shows excellent consolidation and a positively ascending momentum, with trading currently steady above the 121.50$ levels. This move provides investors with excellent accumulation signals to build strong investment positions in the medium term in the safer Spot market.
📈 The technical levels we are carefully monitoring:
• Key support zones: strong and stable around the 119.20$ levels, which act as a bounce point and good protection for the current buy orders.
• Near-term targets: if the current momentum is maintained and we break the nearby resistance levels at 123.80$, we expect continuation toward the 126.00$ levels.
💡 Our steady investment rule:
We always remind you of the importance of protecting your portfolio. We focus entirely on buying and gradual strengthening through Spot trades, and we decisively stay away from the risks of leverage and futures.
👇 Follow the price movement and seize the opportunity:
Press the SOL$ coin button attached below to follow the chart and start immediately and safely, and share with us in the comments: what is your next target for Solana?
Write2Earn#
Solana#
#SOL #CryptoTrading
BinanceSquare#
381

·
--
🚨 3 hidden gems under the radar:
🔥 Which one do you expect to be the most active? And why?
👇 Write your choice in the comments
$SOL — shows notable momentum, and this performance may continue if liquidity improves and the price holds its key technical support levels. In contrast, momentum could weaken if liquidity drops or the price breaks through major support levels.
$BNB — is seeing increased activity; the continuation of this trend could be supported by the price staying above support levels and by rising trading volumes. However, weak trading or the loss of these supports may limit upside opportunities and increase the chances of a pullback.
$XRP — is moving within a relatively calmer range; it could gain bullish momentum if it breaks resistance levels along with a rise in trading volume. Meanwhile, breaking support levels could cause a clear shift in trend and increase selling pressure.
Before making any decision, you should monitor trading volumes and support/resistance levels, along with changes in liquidity, market volatility, and the risk of losses. This content is not a buy or sell recommendation, as the digital asset market carries high risks.
#sol #bnb #xrp
🚨 3 hidden gems under the radar:
🔥 Which one do you expect to be the most active? And why?
👇 Write your choice in the comments
$SOL — shows notable momentum, and this performance may continue if liquidity improves and the price holds its key technical support levels. In contrast, momentum could weaken if liquidity drops or the price breaks through major support levels.
$BNB — is seeing increased activity; the continuation of this trend could be supported by the price staying above support levels and by rising trading volumes. However, weak trading or the loss of these supports may limit upside opportunities and increase the chances of a pullback.
$XRP — is moving within a relatively calmer range; it could gain bullish momentum if it breaks resistance levels along with a rise in trading volume. Meanwhile, breaking support levels could cause a clear shift in trend and increase selling pressure.
Before making any decision, you should monitor trading volumes and support/resistance levels, along with changes in liquidity, market volatility, and the risk of losses. This content is not a buy or sell recommendation, as the digital asset market carries high risks.
#sol #bnb #xrp
🔥 Which one do you expect to be the most active? And why?
👇 Write your choice in the comments
$SOL — shows notable momentum, and this performance may continue if liquidity improves and the price holds its key technical support levels. In contrast, momentum could weaken if liquidity drops or the price breaks through major support levels.
$BNB — is seeing increased activity; the continuation of this trend could be supported by the price staying above support levels and by rising trading volumes. However, weak trading or the loss of these supports may limit upside opportunities and increase the chances of a pullback.
$XRP — is moving within a relatively calmer range; it could gain bullish momentum if it breaks resistance levels along with a rise in trading volume. Meanwhile, breaking support levels could cause a clear shift in trend and increase selling pressure.
Before making any decision, you should monitor trading volumes and support/resistance levels, along with changes in liquidity, market volatility, and the risk of losses. This content is not a buy or sell recommendation, as the digital asset market carries high risks.
#sol #bnb #xrp
1
2
229
·
--
Bearish
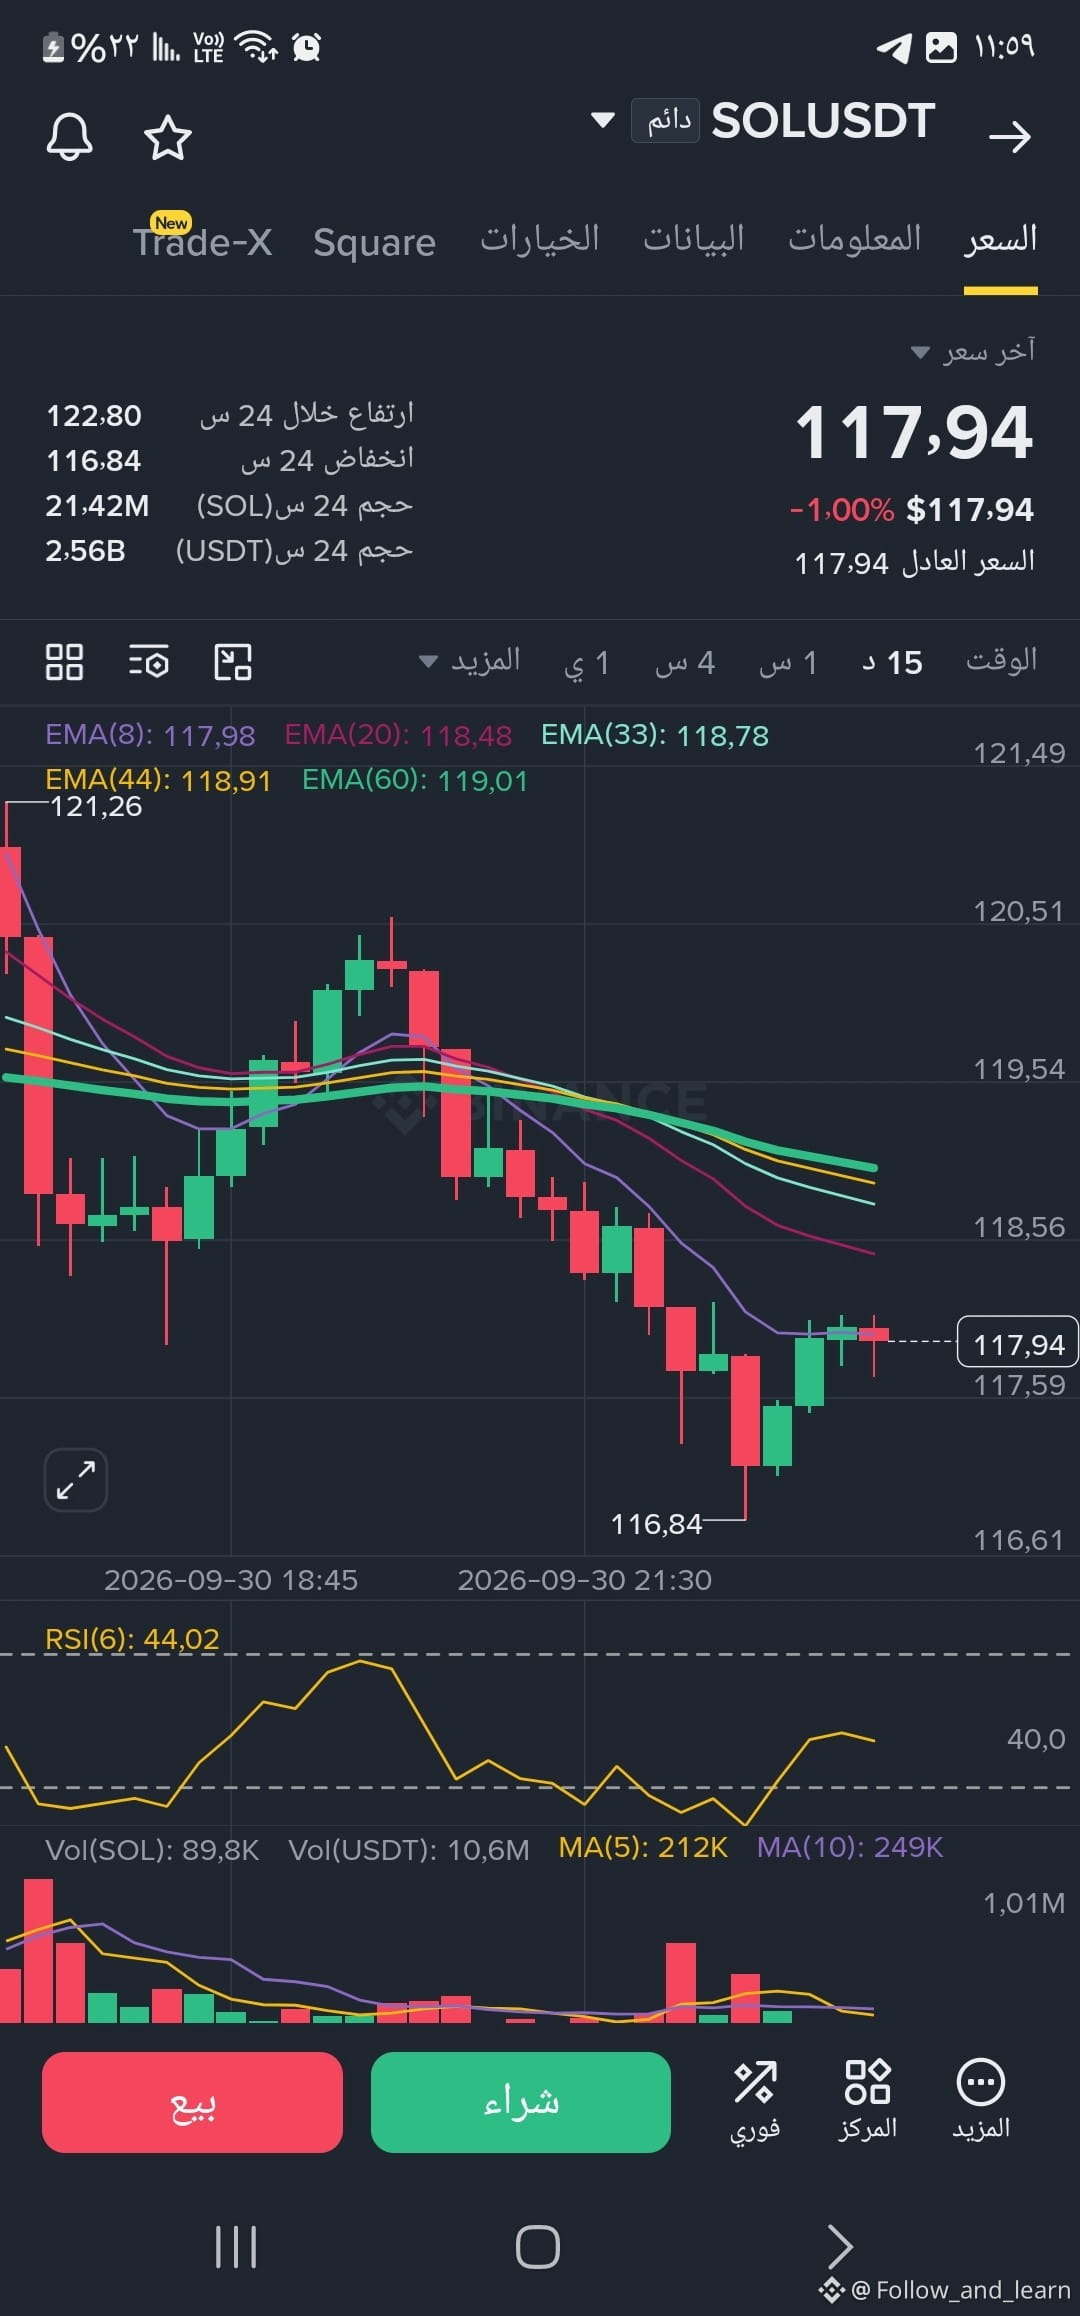
#sol | short 🔴 | 15d
Entry: 118.03
SL: 119.083
TP1: 116.714 | TP2: 115.925 | TP3: 114.872
Entry reference only; no chasing. Setup is canceled at SL.
Technical setup only.
{future}(SOLUSDT)
Not financial advice. Do your own research.
$SOL
#sol | short 🔴 | 15d
Entry: 118.03
SL: 119.083
TP1: 116.714 | TP2: 115.925 | TP3: 114.872
Entry reference only; no chasing. Setup is canceled at SL.
Technical setup only.
Not financial advice. Do your own research.
$SOL
Entry: 118.03
SL: 119.083
TP1: 116.714 | TP2: 115.925 | TP3: 114.872
Entry reference only; no chasing. Setup is canceled at SL.
Technical setup only.
Not financial advice. Do your own research.
$SOL
1
407

·
--
$SOL I’ll crouch here for a moment.
I just took a look: the current momentum ranks #1, with 15m +0.13%, 1h +0.40%, volume ratio 8.14x, and the 24h trading value is about 342M. The price is hovering around 118.15.
To be honest, there could be a little more here, but don’t make your position too heavy. I’d rather wait and see if it clarifies the direction a bit more.
I feel like we can take another look—what about you?
#SOL #热门币种 #行情分析 #Crypto #BinanceSquare
$SOL I’ll crouch here for a moment.
I just took a look: the current momentum ranks #1, with 15m +0.13%, 1h +0.40%, volume ratio 8.14x, and the 24h trading value is about 342M. The price is hovering around 118.15.
To be honest, there could be a little more here, but don’t make your position too heavy. I’d rather wait and see if it clarifies the direction a bit more.
I feel like we can take another look—what about you?
#SOL #热门币种 #行情分析 #Crypto #BinanceSquare
I just took a look: the current momentum ranks #1, with 15m +0.13%, 1h +0.40%, volume ratio 8.14x, and the 24h trading value is about 342M. The price is hovering around 118.15.
To be honest, there could be a little more here, but don’t make your position too heavy. I’d rather wait and see if it clarifies the direction a bit more.
I feel like we can take another look—what about you?
#SOL #热门币种 #行情分析 #Crypto #BinanceSquare
12

·
--
Verified
🚨 SOL JUST GOT FASTER — AND MOST PEOPLE MISSED IT
Solana has reduced its target slot time from 400ms to 250ms.
That means the network is already operating with a faster block-production target, while the much bigger Alpenglow upgrade is still being tested.
And there’s another signal:
U.S. spot Solana ETFs just recorded a record $188M weekly inflow, with every fund attracting new money.
So SOL currently has two very different catalysts developing at the same time:
Faster infrastructure.
Record institutional flows.
The interesting part is what happens when the market starts pricing both together.
🚨 SOL UPDATE: Network speed is improving while institutional demand hits a record week. Click the $SOL setup below 🫵🏻 to review the market structure and watch the next reaction.
$SOL
{future}(SOLUSDT)
#SOL #solana #Write2Earn
🚨 SOL JUST GOT FASTER — AND MOST PEOPLE MISSED IT
Solana has reduced its target slot time from 400ms to 250ms.
That means the network is already operating with a faster block-production target, while the much bigger Alpenglow upgrade is still being tested.
And there’s another signal:
U.S. spot Solana ETFs just recorded a record $188M weekly inflow, with every fund attracting new money.
So SOL currently has two very different catalysts developing at the same time:
Faster infrastructure.
Record institutional flows.
The interesting part is what happens when the market starts pricing both together.
🚨 SOL UPDATE: Network speed is improving while institutional demand hits a record week. Click the $SOL setup below 🫵🏻 to review the market structure and watch the next reaction.
$SOL
#SOL #solana #Write2Earn
Solana has reduced its target slot time from 400ms to 250ms.
That means the network is already operating with a faster block-production target, while the much bigger Alpenglow upgrade is still being tested.
And there’s another signal:
U.S. spot Solana ETFs just recorded a record $188M weekly inflow, with every fund attracting new money.
So SOL currently has two very different catalysts developing at the same time:
Faster infrastructure.
Record institutional flows.
The interesting part is what happens when the market starts pricing both together.
🚨 SOL UPDATE: Network speed is improving while institutional demand hits a record week. Click the $SOL setup below 🫵🏻 to review the market structure and watch the next reaction.
$SOL
#SOL #solana #Write2Earn

1
547

·
--
Article
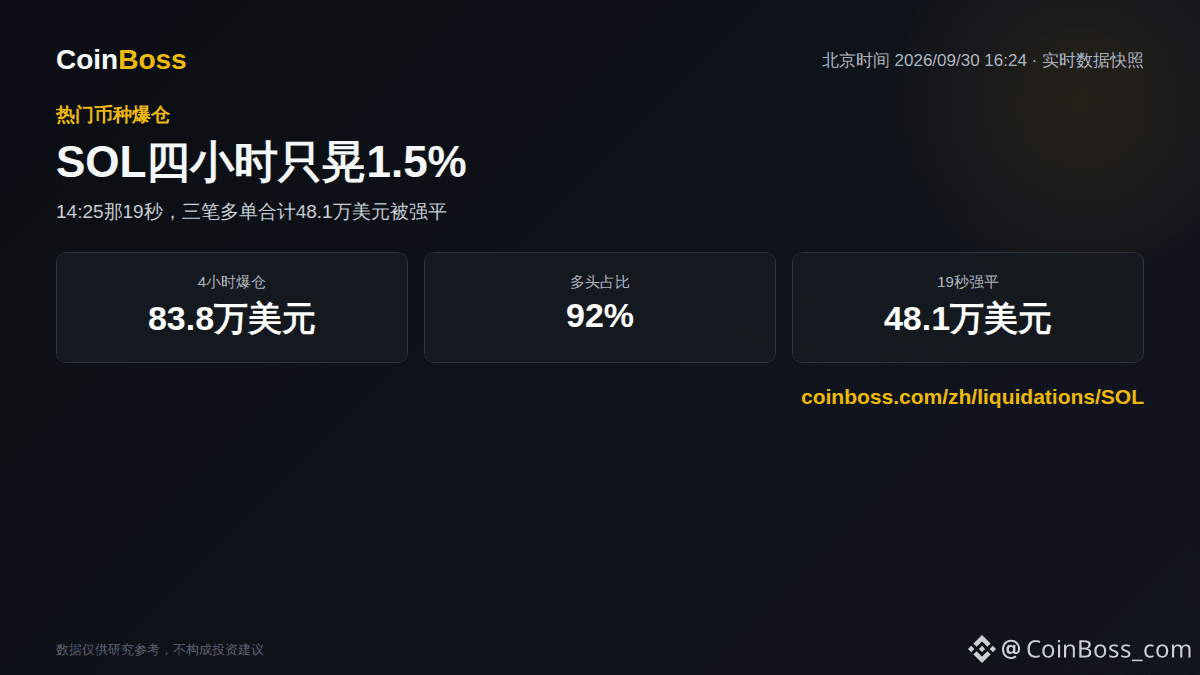
SOL wobbled only 1.5% in four hours, and $481,000 in long orders were wiped out in 19 secondsIn these four hours, SOL barely moved, yet almost all of what got liquidated was long positions.
In the recent four hours, Binance Perpetual’s highest was 119.6 and the lowest was 117.80, a spread of only about 1.5%. If we extend it to 24 hours, SOL has fallen by roughly 1.3%, and the current price is around 118.
With only this much fluctuation, a four-hour liquidation wiped out $838,000—longs accounted for 92%, with a total of 156 orders.
The most concentrated moment was at 14:25 in those 19 seconds. Two OKX orders and one from Binance long position were liquidated back-to-back, totaling $481,000, accounting for 62% of the four-hour long liquidations. At that moment, the price only dipped to 118.23, indicating these leveraged positions were opened with very high leverage—one small pullback wasn’t enough to hold.
SOL wobbled only 1.5% in four hours, and $481,000 in long orders were wiped out in 19 seconds
In these four hours, SOL barely moved, yet almost all of what got liquidated was long positions.
In the recent four hours, Binance Perpetual’s highest was 119.6 and the lowest was 117.80, a spread of only about 1.5%. If we extend it to 24 hours, SOL has fallen by roughly 1.3%, and the current price is around 118.
With only this much fluctuation, a four-hour liquidation wiped out $838,000—longs accounted for 92%, with a total of 156 orders.
The most concentrated moment was at 14:25 in those 19 seconds. Two OKX orders and one from Binance long position were liquidated back-to-back, totaling $481,000, accounting for 62% of the four-hour long liquidations. At that moment, the price only dipped to 118.23, indicating these leveraged positions were opened with very high leverage—one small pullback wasn’t enough to hold.
In the recent four hours, Binance Perpetual’s highest was 119.6 and the lowest was 117.80, a spread of only about 1.5%. If we extend it to 24 hours, SOL has fallen by roughly 1.3%, and the current price is around 118.
With only this much fluctuation, a four-hour liquidation wiped out $838,000—longs accounted for 92%, with a total of 156 orders.
The most concentrated moment was at 14:25 in those 19 seconds. Two OKX orders and one from Binance long position were liquidated back-to-back, totaling $481,000, accounting for 62% of the four-hour long liquidations. At that moment, the price only dipped to 118.23, indicating these leveraged positions were opened with very high leverage—one small pullback wasn’t enough to hold.
165
·
--
$SOL Don’t rush; it doesn’t feel stable yet.
Current price 118.13, 15m -0.27%, 1h -0.03%, volume ratio 10.51x, 24h trading value about 281M.
If you ask me, we can be a bit cautious here, but don’t take too heavy a position. I’d rather wait for it to move and show a clear direction.
Is anyone here brave enough to take it?
#SOL #热门币种 #行情分析 #Crypto #BinanceSquare
$SOL Don’t rush; it doesn’t feel stable yet.
Current price 118.13, 15m -0.27%, 1h -0.03%, volume ratio 10.51x, 24h trading value about 281M.
If you ask me, we can be a bit cautious here, but don’t take too heavy a position. I’d rather wait for it to move and show a clear direction.
Is anyone here brave enough to take it?
#SOL #热门币种 #行情分析 #Crypto #BinanceSquare
Current price 118.13, 15m -0.27%, 1h -0.03%, volume ratio 10.51x, 24h trading value about 281M.
If you ask me, we can be a bit cautious here, but don’t take too heavy a position. I’d rather wait for it to move and show a clear direction.
Is anyone here brave enough to take it?
#SOL #热门币种 #行情分析 #Crypto #BinanceSquare
83

·
--
Bullish
$SOL SOL, 7-day shock $200.
The market never waits for everyone to be ready.
When sentiment, capital, and the trend begin to resonate, the real acceleration often only needs a few big bullish candles.
$120 is just the starting point, $150 is the acceleration zone,
next stop — $200.
Don’t blink—SOL’s rhythm may have just started.
#sol
$SOL SOL, 7-day shock $200.
The market never waits for everyone to be ready.
When sentiment, capital, and the trend begin to resonate, the real acceleration often only needs a few big bullish candles.
$120 is just the starting point, $150 is the acceleration zone,
next stop — $200.
Don’t blink—SOL’s rhythm may have just started.
#sol
The market never waits for everyone to be ready.
When sentiment, capital, and the trend begin to resonate, the real acceleration often only needs a few big bullish candles.
$120 is just the starting point, $150 is the acceleration zone,
next stop — $200.
Don’t blink—SOL’s rhythm may have just started.
#sol

Bertie财神保佑:
你胡说八道,人家懒得理你
3
4
1.6k

{spot}(SOLUSDT)
Update $SOL | The bounce happens by the millimeter, and liquidity returns strongly! 🚀 Positive momentum
My fellow followers, the Solana coin ($SOL) once again proves that respecting technical levels is the foundation of profit! The price is rebounding strongly from the 116$ levels we warned you about, and it has now reached 119.39$! 🔥
• What happened? The expected corrective scenario worked perfectly, and the price is now trading above the midpoint of the Bollinger Bands (MB) at 119.31$, giving a clear safety signal.
• MACD indicator explosion: as we noted earlier, the indicator has now officially turned positive (0.03) with the rise of the liquidity line, confirming bulls are currently in control.
• Next target: Eyes are now on the upper Bollinger Band (UP) line near the 120.94$ levels, along with breaking above the previous high at 121.69$.
💡 Reminder: The professional trader is the one who waited for the bounce signal we talked about in the previous post and captured the profits—without rushing into random entries!
⚔️ The question of the hour for partners of success:
Did you take advantage of the bounce point at 116$ and enter the trade with us? And what are your next targets for Solana?
👇
#سولانا #solana #بينانس #تداول #Crypto #SOL
Update $SOL | The bounce happens by the millimeter, and liquidity returns strongly! 🚀 Positive momentum
My fellow followers, the Solana coin ($SOL ) once again proves that respecting technical levels is the foundation of profit! The price is rebounding strongly from the 116$ levels we warned you about, and it has now reached 119.39$! 🔥
• What happened? The expected corrective scenario worked perfectly, and the price is now trading above the midpoint of the Bollinger Bands (MB) at 119.31$, giving a clear safety signal.
• MACD indicator explosion: as we noted earlier, the indicator has now officially turned positive (0.03) with the rise of the liquidity line, confirming bulls are currently in control.
• Next target: Eyes are now on the upper Bollinger Band (UP) line near the 120.94$ levels, along with breaking above the previous high at 121.69$.
💡 Reminder: The professional trader is the one who waited for the bounce signal we talked about in the previous post and captured the profits—without rushing into random entries!
⚔️ The question of the hour for partners of success:
Did you take advantage of the bounce point at 116$ and enter the trade with us? And what are your next targets for Solana?
👇
#سولانا #solana #بينانس #تداول #Crypto #SOL
My fellow followers, the Solana coin ($SOL ) once again proves that respecting technical levels is the foundation of profit! The price is rebounding strongly from the 116$ levels we warned you about, and it has now reached 119.39$! 🔥
• What happened? The expected corrective scenario worked perfectly, and the price is now trading above the midpoint of the Bollinger Bands (MB) at 119.31$, giving a clear safety signal.
• MACD indicator explosion: as we noted earlier, the indicator has now officially turned positive (0.03) with the rise of the liquidity line, confirming bulls are currently in control.
• Next target: Eyes are now on the upper Bollinger Band (UP) line near the 120.94$ levels, along with breaking above the previous high at 121.69$.
💡 Reminder: The professional trader is the one who waited for the bounce signal we talked about in the previous post and captured the profits—without rushing into random entries!
⚔️ The question of the hour for partners of success:
Did you take advantage of the bounce point at 116$ and enter the trade with us? And what are your next targets for Solana?
👇
#سولانا #solana #بينانس #تداول #Crypto #SOL
محمد العمري - عملات رقمية
·
--
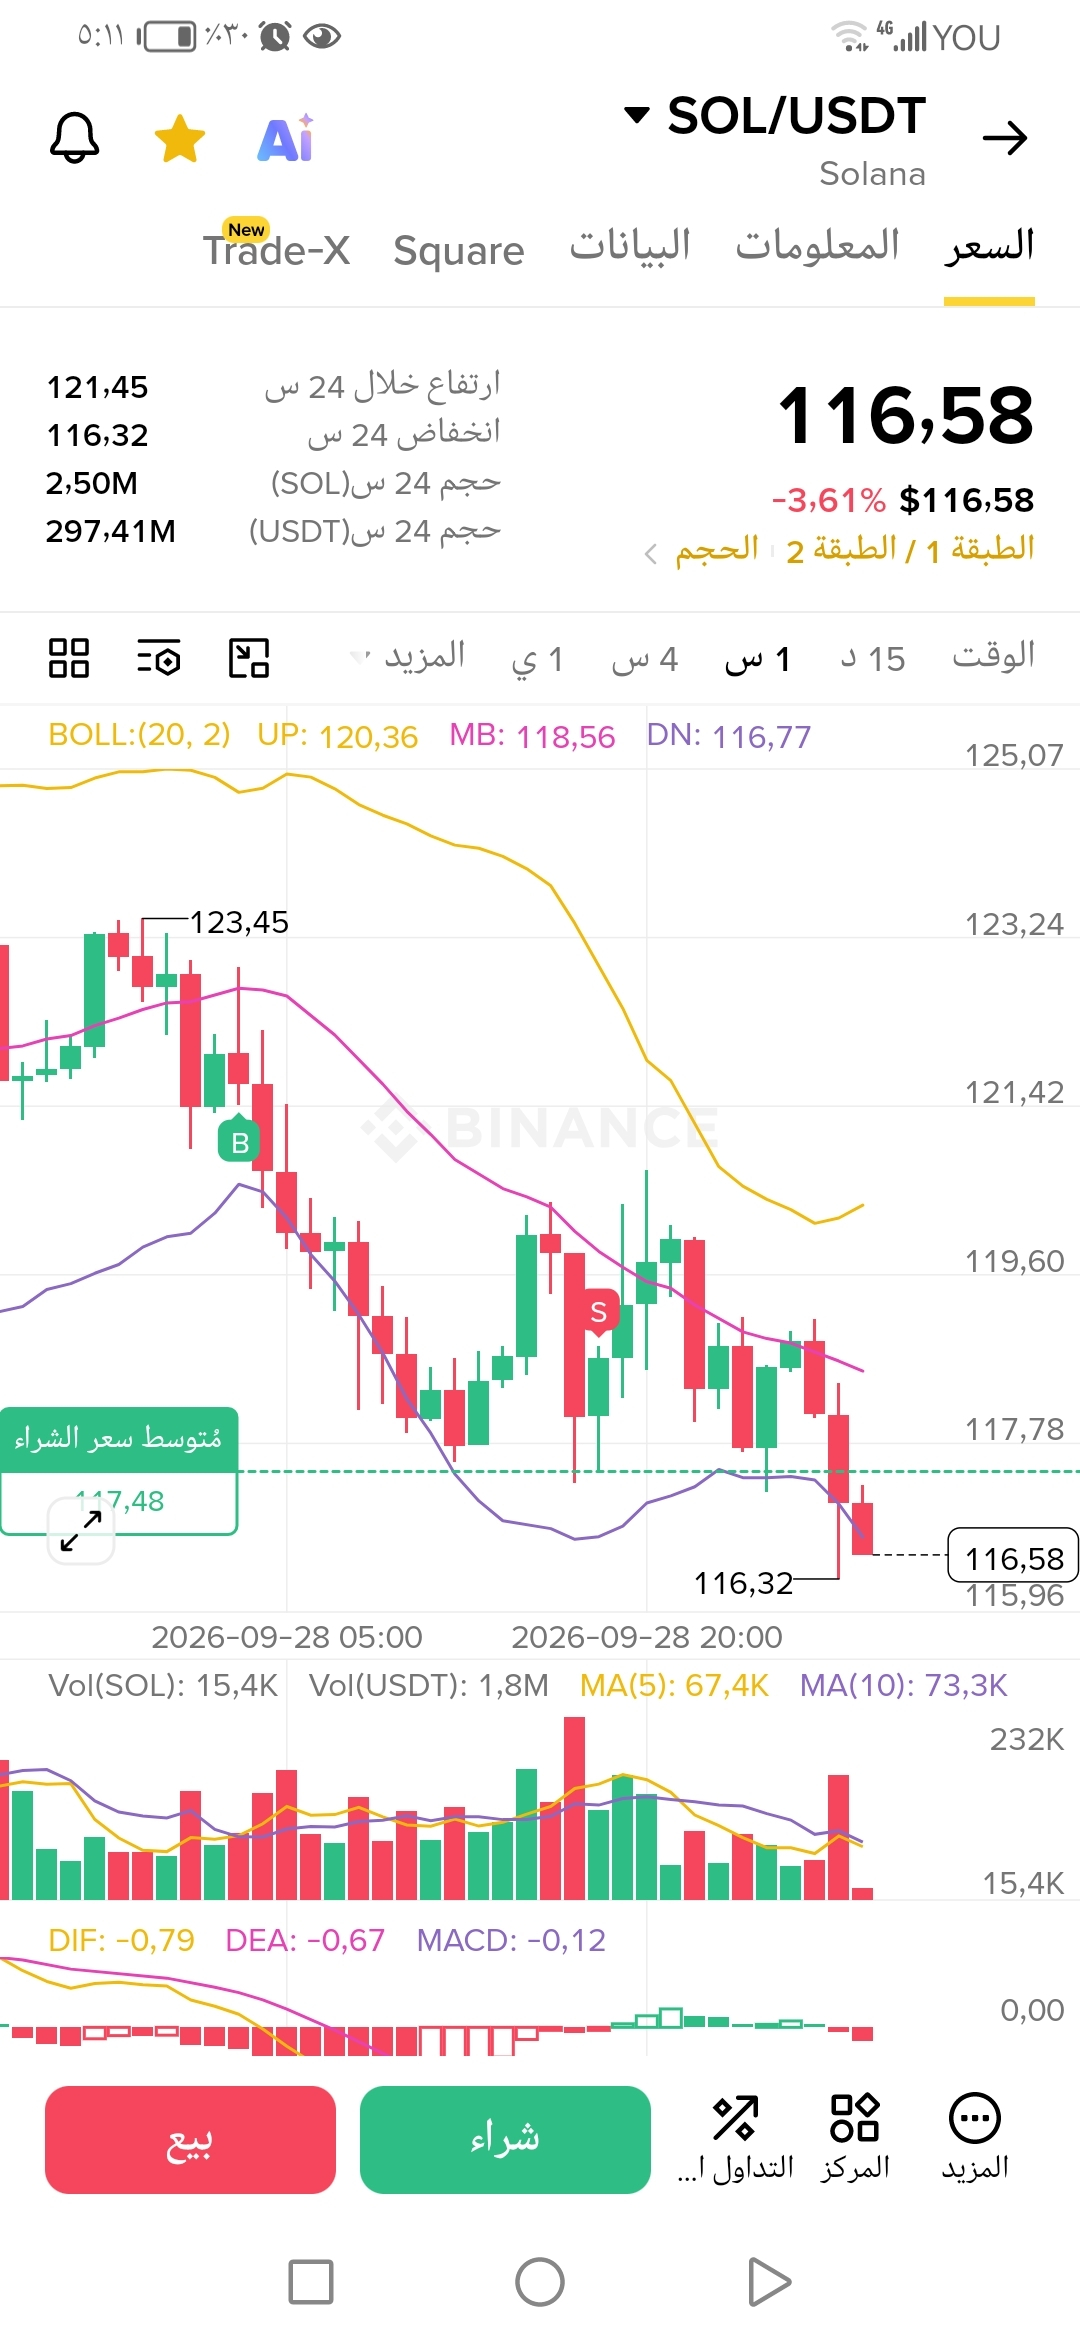
Fast update on Solana coin ($SOL ) | Are we getting close to the bottom?
Solana is currently trading at $116.58, down 3.61%, moving directly toward its lowest levels over the past 24 hours at $116.32.
📊 Quick technical read:
• Support & Resistance: The price is currently breaking below the lower band of the Bollinger indicator (DN: 116.77), placing the coin in an oversold zone in the short term, awaiting a rebound signal.
• MACD indicator: Negative momentum is持续 (MACD: -0.12) below the zero line, requiring caution and not rushing into random entries.
💡 Advice to followers:
Watch the close of the current candle; holding above the $116 levels could open the door for a corrective bounce upward, while breaking it requires activating risk management plans precisely
#سولانا #Solana #solana #بينانس #Trading #Crypto
1
624

·
--
I’m leaving this here before $SOL makes its next move.
{spot}(SOLUSDT)
Not a prediction.
Not a signal.
Just one question:
When you look at this chart, what is the ONE thing that feels “wrong”?
Don’t give me a price target.
Don’t say “bullish” or “bearish”.
Tell me the one detail you noticed first.
I’ll come back to this post when the chart changes.
$SOL
#sol #solana #solanAnalysis #solanamarketupdate #BuyOrSell
I’m leaving this here before $SOL makes its next move.
Not a prediction.
Not a signal.
Just one question:
When you look at this chart, what is the ONE thing that feels “wrong”?
Don’t give me a price target.
Don’t say “bullish” or “bearish”.
Tell me the one detail you noticed first.
I’ll come back to this post when the chart changes.
$SOL
#sol #solana #solanAnalysis #solanamarketupdate #BuyOrSell
Not a prediction.
Not a signal.
Just one question:
When you look at this chart, what is the ONE thing that feels “wrong”?
Don’t give me a price target.
Don’t say “bullish” or “bearish”.
Tell me the one detail you noticed first.
I’ll come back to this post when the chart changes.
$SOL
#sol #solana #solanAnalysis #solanamarketupdate #BuyOrSell
1
59

·
--
Bullish
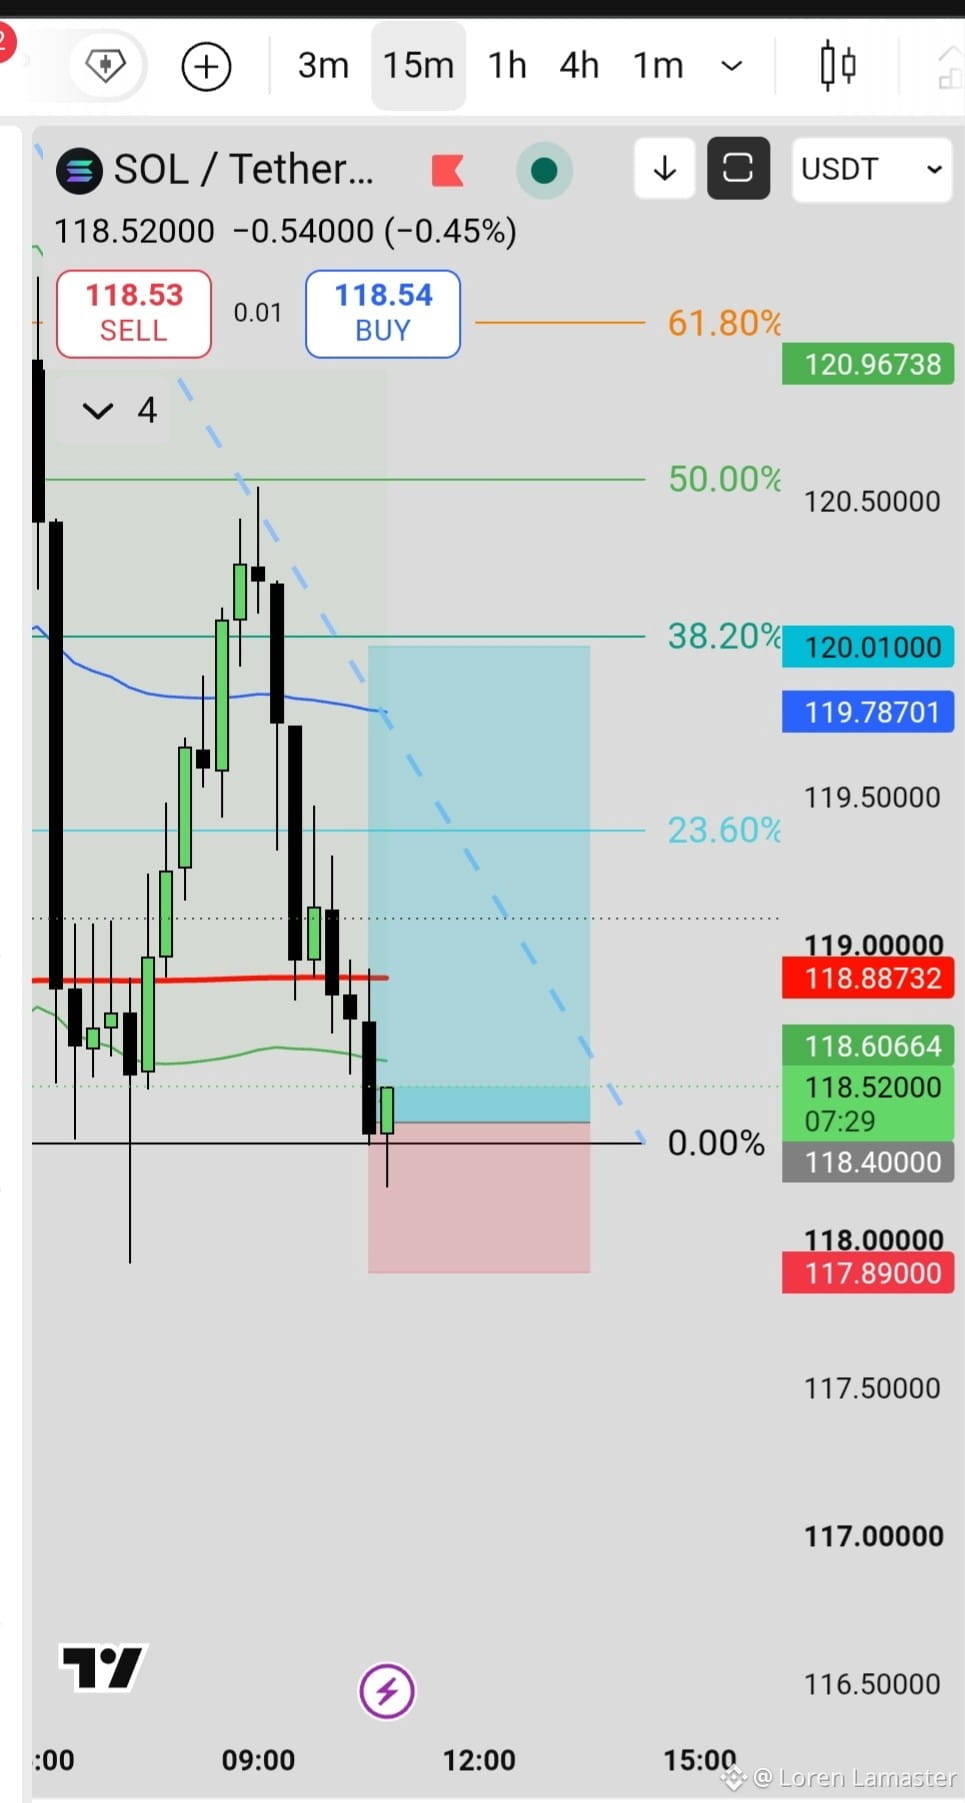
🚨 SOL LONG SETUP 🚨
SOL is looking interesting here 👀🔥
📉 Price has been heavily sold off and looks oversold 🛡️ Holding around a key support zone 📊 Selling pressure may be getting exhausted ⚡ If support holds, a bounce could be on the table
I’m watching for a LONG entry here. 📈
Don’t blindly chase though — wait for confirmation and manage your risk. 🧠
SOL bulls, this could be the setup you’ve been waiting for 👀🚀👇
{spot}(SOLUSDT)
Entry: 118.20-118.40
SL: 117.80
TP: 120
Don’t miss out — but don’t overleverage either. ⚠️
#sol #Binance #Long
🚨 SOL LONG SETUP 🚨
SOL is looking interesting here 👀🔥
📉 Price has been heavily sold off and looks oversold 🛡️ Holding around a key support zone 📊 Selling pressure may be getting exhausted ⚡ If support holds, a bounce could be on the table
I’m watching for a LONG entry here. 📈
Don’t blindly chase though — wait for confirmation and manage your risk. 🧠
SOL bulls, this could be the setup you’ve been waiting for 👀🚀👇
Entry: 118.20-118.40
SL: 117.80
TP: 120
Don’t miss out — but don’t overleverage either. ⚠️
#sol #Binance #Long
SOL is looking interesting here 👀🔥
📉 Price has been heavily sold off and looks oversold 🛡️ Holding around a key support zone 📊 Selling pressure may be getting exhausted ⚡ If support holds, a bounce could be on the table
I’m watching for a LONG entry here. 📈
Don’t blindly chase though — wait for confirmation and manage your risk. 🧠
SOL bulls, this could be the setup you’ve been waiting for 👀🚀👇
Entry: 118.20-118.40
SL: 117.80
TP: 120
Don’t miss out — but don’t overleverage either. ⚠️
#sol #Binance #Long
1
1
475

·
--
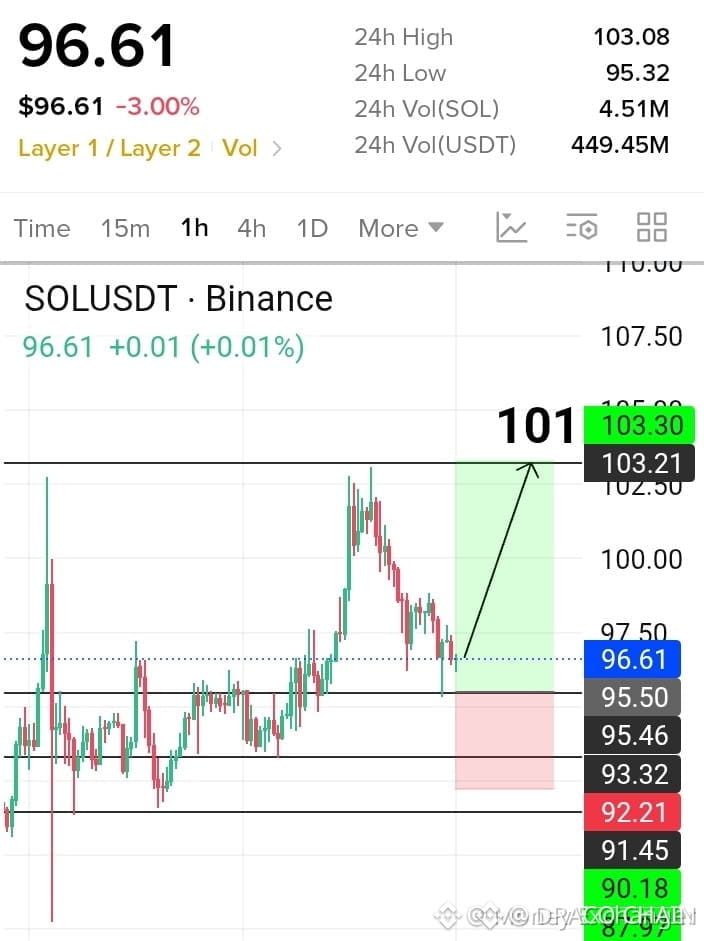
🚨 $SOL RECLAIMS KEY LIQUIDITY DISCOUNT AFTER SHARP PULLBACK DISPLACEMENT! ⚡
Entry: 96.59 ⚡
Target: 101 🚀
Stop Loss: 93.98 ⚠️
📌 Institutional order flow reveals a clean liquidity sweep following the recent pullback, driving $SOL straight into a high-confluence demand block around 96.59. 🔍 Aggressive sell-side pressure is showing immediate signs of absorption as smart money captures discounted inventory before the next structural expansion.
💡 With risk strictly defined below local invalidation, the path of least resistance points toward an inefficiency fill toward overhead targets. 💬 Are you capturing this structural discount or waiting for confirmed breakout velocity above 100? 👇
⚠️ Not financial advice. Always manage your risk. 🛡️
🏷️ #SOL #Solana #CryptoAnalysis #MarketStructure #TradeSetup
🎯 🦈
🚨 $SOL RECLAIMS KEY LIQUIDITY DISCOUNT AFTER SHARP PULLBACK DISPLACEMENT! ⚡
Entry: 96.59 ⚡
Target: 101 🚀
Stop Loss: 93.98 ⚠️
📌 Institutional order flow reveals a clean liquidity sweep following the recent pullback, driving $SOL straight into a high-confluence demand block around 96.59. 🔍 Aggressive sell-side pressure is showing immediate signs of absorption as smart money captures discounted inventory before the next structural expansion.
💡 With risk strictly defined below local invalidation, the path of least resistance points toward an inefficiency fill toward overhead targets. 💬 Are you capturing this structural discount or waiting for confirmed breakout velocity above 100? 👇
⚠️ Not financial advice. Always manage your risk. 🛡️
🏷️ #SOL #Solana #CryptoAnalysis #MarketStructure #TradeSetup
🎯 🦈
Entry: 96.59 ⚡
Target: 101 🚀
Stop Loss: 93.98 ⚠️
📌 Institutional order flow reveals a clean liquidity sweep following the recent pullback, driving $SOL straight into a high-confluence demand block around 96.59. 🔍 Aggressive sell-side pressure is showing immediate signs of absorption as smart money captures discounted inventory before the next structural expansion.
💡 With risk strictly defined below local invalidation, the path of least resistance points toward an inefficiency fill toward overhead targets. 💬 Are you capturing this structural discount or waiting for confirmed breakout velocity above 100? 👇
⚠️ Not financial advice. Always manage your risk. 🛡️
🏷️ #SOL #Solana #CryptoAnalysis #MarketStructure #TradeSetup
🎯 🦈
7

·
--
The money has already entered the market—what breath does SOL still need?
First, look at real inflows: over the past week, U.S. spot ETFs saw net inflows of about $190 million. All seven products recorded inflows, which carries far more weight than just a sentence about “sentiment improving.” But since roughly 68% of the capital is concentrated in a single issuer, the next thing to watch is whether the buying pressure can keep spreading—rather than counting last week’s inflows again as future buying.
Next, look at how enterprises adopt this line: the reserve mechanism converts part of on-chain and off-chain service revenues into tokens and deposits them into the reserve. That gives business growth a traceable transmission path. Going forward, what matters is the actual conversion of revenue—not treating every partnership announcement as an equal amount of buying.
One more thing to distinguish is the quality of revenue: higher trading activity doesn’t necessarily translate into the same amount of income per trade. Fee rates and trading structure will affect where buybacks come from. What’s needed now is to see demand improving and prices stabilizing together—don’t rush to convert the bustle into potential upside space. #SOL #LINK #HYPE #cryptocurrency
The money has already entered the market—what breath does SOL still need?
First, look at real inflows: over the past week, U.S. spot ETFs saw net inflows of about $190 million. All seven products recorded inflows, which carries far more weight than just a sentence about “sentiment improving.” But since roughly 68% of the capital is concentrated in a single issuer, the next thing to watch is whether the buying pressure can keep spreading—rather than counting last week’s inflows again as future buying.
Next, look at how enterprises adopt this line: the reserve mechanism converts part of on-chain and off-chain service revenues into tokens and deposits them into the reserve. That gives business growth a traceable transmission path. Going forward, what matters is the actual conversion of revenue—not treating every partnership announcement as an equal amount of buying.
One more thing to distinguish is the quality of revenue: higher trading activity doesn’t necessarily translate into the same amount of income per trade. Fee rates and trading structure will affect where buybacks come from. What’s needed now is to see demand improving and prices stabilizing together—don’t rush to convert the bustle into potential upside space. #SOL #LINK #HYPE #cryptocurrency
First, look at real inflows: over the past week, U.S. spot ETFs saw net inflows of about $190 million. All seven products recorded inflows, which carries far more weight than just a sentence about “sentiment improving.” But since roughly 68% of the capital is concentrated in a single issuer, the next thing to watch is whether the buying pressure can keep spreading—rather than counting last week’s inflows again as future buying.
Next, look at how enterprises adopt this line: the reserve mechanism converts part of on-chain and off-chain service revenues into tokens and deposits them into the reserve. That gives business growth a traceable transmission path. Going forward, what matters is the actual conversion of revenue—not treating every partnership announcement as an equal amount of buying.
One more thing to distinguish is the quality of revenue: higher trading activity doesn’t necessarily translate into the same amount of income per trade. Fee rates and trading structure will affect where buybacks come from. What’s needed now is to see demand improving and prices stabilizing together—don’t rush to convert the bustle into potential upside space. #SOL #LINK #HYPE #cryptocurrency
82

·
--
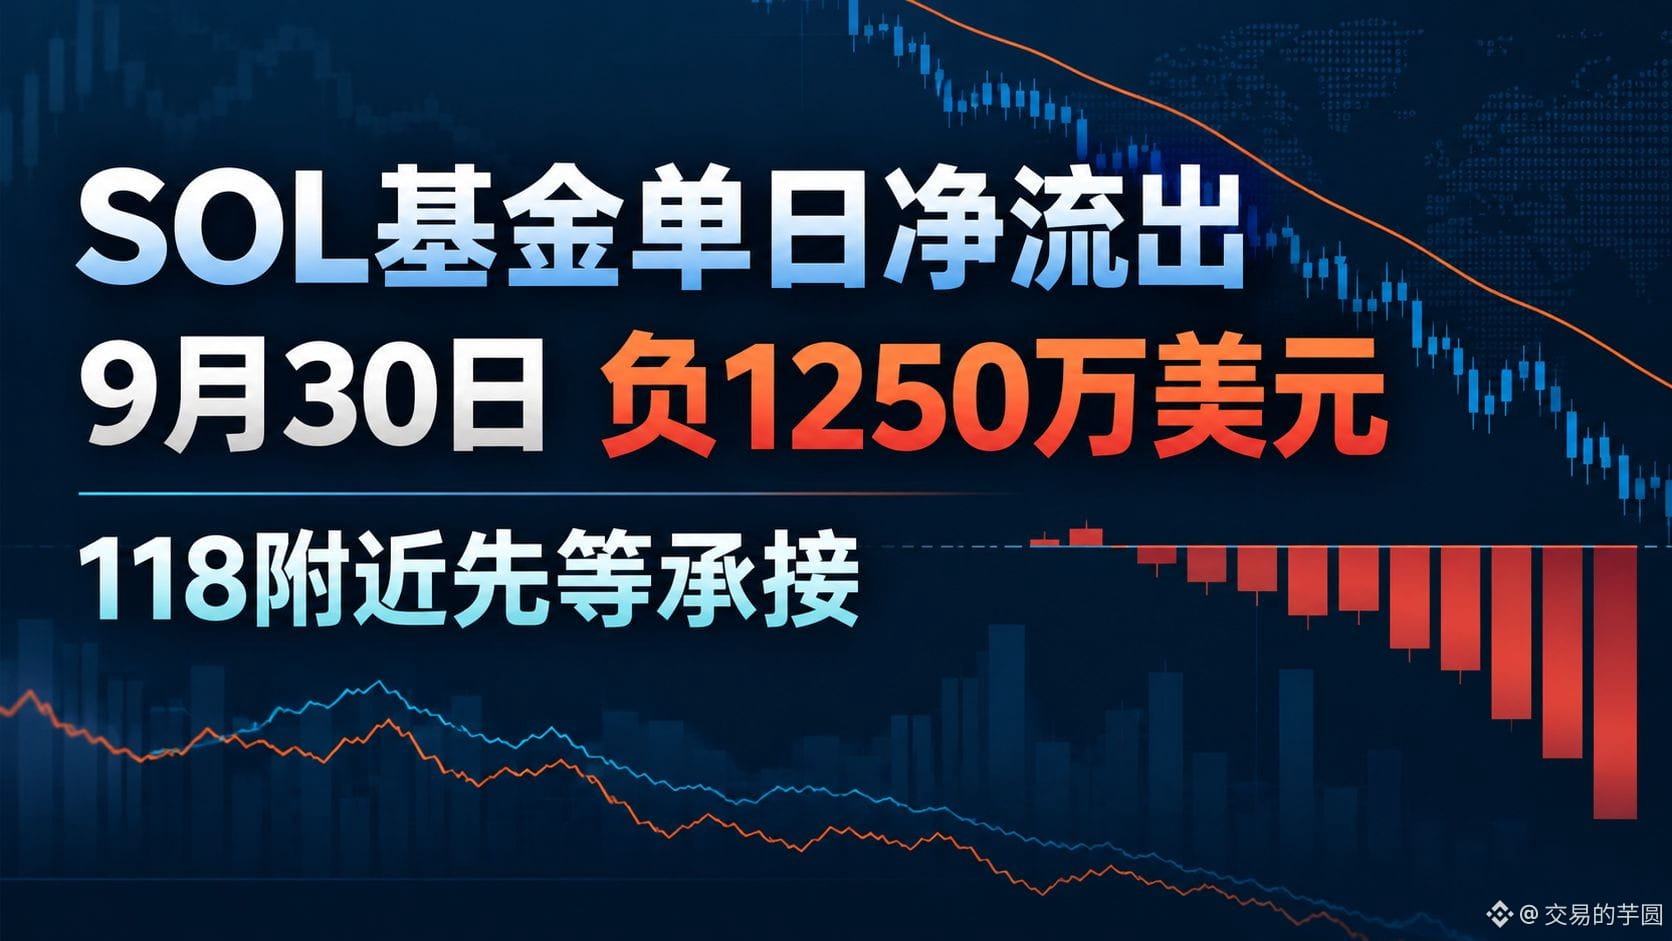
SOL fund subscriptions/redemptions turn into a single-day net outflow|After BSOL catch-up filing, total is -12.5 million USD|Around 118 I’ll wait for the buyers to take it
My stance is fairly cautious: this isn’t evidence of a full, across-the-board retreat of institutional SOL funds, but neither can we stick to the earlier judgment based only on seeing two products. Farside’s latest table lists all seven SOL-related fund products in the U.S. as of September 30. The total net outflow that day was 12.5 million USD. BSOL saw an outflow of 8.9 million USD, VSOL and MSOL each outflowed 3.2 million USD, and FSOL had an inflow of 2.8 million USD; the remaining slots report zero. Earlier, the page only showed FSOL and MSOL figures, which offset to roughly -0.4 million USD; now that the data is completed, the conclusion changes materially. In this round, what I’m looking at is the disclosure progress, not treating two versions of the same day’s data as two separate waves of fund flow.
Why does it matter? Subscription/redemption activity affects a product manager’s needs for configuring spot holdings, collateral, or inventory, and it offers a window into institutions’ marginal risk appetite. But a single-day net outflow doesn’t mean an equal amount of SOL is immediately dumped on exchanges, and you can’t conclude that all holders are selling from this table. FSOL still had inflows, which also indicates a divergence across products. What I care more about is whether the next two trading days continue to see net outflows, and whether spot can absorb that expectation in key price zones.
How the market reacts should also be viewed separately. At the time of writing, Binance SOL/USDT is around $118.04, down about 1.13% over 24 hours, trading in a range of $117.06 to $122.83. Price is nearing the intraday low, but you can’t attribute the whole decline solely to fund data; the broader BTC direction, macro rate expectations, and altcoin overall risk appetite are changing at the same time. The forum’s trending hot list still has a “alt season index” topic, but the mere presence of search and discussion heat doesn’t offset the outflows already reported. I don’t treat the hot list as buy orders here.
If I were trading myself, I wouldn’t pick a bottom directly around 118, and I also wouldn’t chase a short. I’d only consider spot or low-risk exposure, with a preset maximum of 3% of total funds allocated to SOL. If it reclaims 119.50 and holds 119 on the pullback, then I’d try longs with no more than 1.5%; only after a breakout above 121 would I add up to 3%. First target: 121.80. Second target: 122.80—take half off at the first target. Initial stop-loss is set below 117.00. If after a rebound price falls back to 119 and volume/traction weakens, I’ll cut position early. If two consecutive four-hour closes fall below 117, I’ll fully exit and cancel the long plan. If the next trading day’s fund data continues to show a clear net outflow and price breaks 117, even if an entry was triggered, I won’t hold it stubbornly. Conversely, if price stabilizes at 119.50 and the subsequent fund data improves, I’ll撤销 (remove) the short-term cautious bias, but I still won’t assume a bull market restart in advance—decisions will follow the trigger conditions.
Data sources: Farside SOL fund funding/flow table; Binance SOL/USDT spot quotes. Data updates with the page; the entry price is not a record of executed trades. #AltcoinSeasonIndexHoldsAbove60For5Days #SOL
The above is only my personal market observation and does not constitute investment advice.
SOL fund subscriptions/redemptions turn into a single-day net outflow|After BSOL catch-up filing, total is -12.5 million USD|Around 118 I’ll wait for the buyers to take it
My stance is fairly cautious: this isn’t evidence of a full, across-the-board retreat of institutional SOL funds, but neither can we stick to the earlier judgment based only on seeing two products. Farside’s latest table lists all seven SOL-related fund products in the U.S. as of September 30. The total net outflow that day was 12.5 million USD. BSOL saw an outflow of 8.9 million USD, VSOL and MSOL each outflowed 3.2 million USD, and FSOL had an inflow of 2.8 million USD; the remaining slots report zero. Earlier, the page only showed FSOL and MSOL figures, which offset to roughly -0.4 million USD; now that the data is completed, the conclusion changes materially. In this round, what I’m looking at is the disclosure progress, not treating two versions of the same day’s data as two separate waves of fund flow.
Why does it matter? Subscription/redemption activity affects a product manager’s needs for configuring spot holdings, collateral, or inventory, and it offers a window into institutions’ marginal risk appetite. But a single-day net outflow doesn’t mean an equal amount of SOL is immediately dumped on exchanges, and you can’t conclude that all holders are selling from this table. FSOL still had inflows, which also indicates a divergence across products. What I care more about is whether the next two trading days continue to see net outflows, and whether spot can absorb that expectation in key price zones.
How the market reacts should also be viewed separately. At the time of writing, Binance SOL/USDT is around $118.04, down about 1.13% over 24 hours, trading in a range of $117.06 to $122.83. Price is nearing the intraday low, but you can’t attribute the whole decline solely to fund data; the broader BTC direction, macro rate expectations, and altcoin overall risk appetite are changing at the same time. The forum’s trending hot list still has a “alt season index” topic, but the mere presence of search and discussion heat doesn’t offset the outflows already reported. I don’t treat the hot list as buy orders here.
If I were trading myself, I wouldn’t pick a bottom directly around 118, and I also wouldn’t chase a short. I’d only consider spot or low-risk exposure, with a preset maximum of 3% of total funds allocated to SOL. If it reclaims 119.50 and holds 119 on the pullback, then I’d try longs with no more than 1.5%; only after a breakout above 121 would I add up to 3%. First target: 121.80. Second target: 122.80—take half off at the first target. Initial stop-loss is set below 117.00. If after a rebound price falls back to 119 and volume/traction weakens, I’ll cut position early. If two consecutive four-hour closes fall below 117, I’ll fully exit and cancel the long plan. If the next trading day’s fund data continues to show a clear net outflow and price breaks 117, even if an entry was triggered, I won’t hold it stubbornly. Conversely, if price stabilizes at 119.50 and the subsequent fund data improves, I’ll撤销 (remove) the short-term cautious bias, but I still won’t assume a bull market restart in advance—decisions will follow the trigger conditions.
Data sources: Farside SOL fund funding/flow table; Binance SOL/USDT spot quotes. Data updates with the page; the entry price is not a record of executed trades. #AltcoinSeasonIndexHoldsAbove60For5Days #SOL
The above is only my personal market observation and does not constitute investment advice.
My stance is fairly cautious: this isn’t evidence of a full, across-the-board retreat of institutional SOL funds, but neither can we stick to the earlier judgment based only on seeing two products. Farside’s latest table lists all seven SOL-related fund products in the U.S. as of September 30. The total net outflow that day was 12.5 million USD. BSOL saw an outflow of 8.9 million USD, VSOL and MSOL each outflowed 3.2 million USD, and FSOL had an inflow of 2.8 million USD; the remaining slots report zero. Earlier, the page only showed FSOL and MSOL figures, which offset to roughly -0.4 million USD; now that the data is completed, the conclusion changes materially. In this round, what I’m looking at is the disclosure progress, not treating two versions of the same day’s data as two separate waves of fund flow.
Why does it matter? Subscription/redemption activity affects a product manager’s needs for configuring spot holdings, collateral, or inventory, and it offers a window into institutions’ marginal risk appetite. But a single-day net outflow doesn’t mean an equal amount of SOL is immediately dumped on exchanges, and you can’t conclude that all holders are selling from this table. FSOL still had inflows, which also indicates a divergence across products. What I care more about is whether the next two trading days continue to see net outflows, and whether spot can absorb that expectation in key price zones.
How the market reacts should also be viewed separately. At the time of writing, Binance SOL/USDT is around $118.04, down about 1.13% over 24 hours, trading in a range of $117.06 to $122.83. Price is nearing the intraday low, but you can’t attribute the whole decline solely to fund data; the broader BTC direction, macro rate expectations, and altcoin overall risk appetite are changing at the same time. The forum’s trending hot list still has a “alt season index” topic, but the mere presence of search and discussion heat doesn’t offset the outflows already reported. I don’t treat the hot list as buy orders here.
If I were trading myself, I wouldn’t pick a bottom directly around 118, and I also wouldn’t chase a short. I’d only consider spot or low-risk exposure, with a preset maximum of 3% of total funds allocated to SOL. If it reclaims 119.50 and holds 119 on the pullback, then I’d try longs with no more than 1.5%; only after a breakout above 121 would I add up to 3%. First target: 121.80. Second target: 122.80—take half off at the first target. Initial stop-loss is set below 117.00. If after a rebound price falls back to 119 and volume/traction weakens, I’ll cut position early. If two consecutive four-hour closes fall below 117, I’ll fully exit and cancel the long plan. If the next trading day’s fund data continues to show a clear net outflow and price breaks 117, even if an entry was triggered, I won’t hold it stubbornly. Conversely, if price stabilizes at 119.50 and the subsequent fund data improves, I’ll撤销 (remove) the short-term cautious bias, but I still won’t assume a bull market restart in advance—decisions will follow the trigger conditions.
Data sources: Farside SOL fund funding/flow table; Binance SOL/USDT spot quotes. Data updates with the page; the entry price is not a record of executed trades. #AltcoinSeasonIndexHoldsAbove60For5Days #SOL
The above is only my personal market observation and does not constitute investment advice.
3

·
--
Bullish
$ETH holds on, $SOL weakens first: risk appetite in major coins is starting to diverge.
Binance market snapshot around 10:05–10:10 on October 1 (Taiwan time):
• ETH around $2,685, up 0.41% over the past 24 hours
• BTC around $83,422, nearly flat over the past 24 hours
• SOL around $117.97, down 1.44% over the past 24 hours
This isn’t enough to prove that funds are rotating from SOL to ETH, but it does at least suggest that after yesterday’s PCE, the price action hasn’t broadly spread to high-risk assets.
Next, watch three conditions:
• ETH breaks through and holds above 2,737: only then can bullish strength be confirmed as continuing.
• SOL reclaims 120 and then breaks above 122.5: that would be a sign that risk appetite for major coins is starting to re-expand.
• ETH falls below 2,657 while SOL loses 117.2: be alert for the divergence to evolve into an overall weakening.
At 22:00 tonight (Taiwan time), there will also be U.S. ISM Manufacturing data. Before the release, the relative strength in the morning could still reverse; what’s more worth watching right now isn’t who’s rising faster, but who fails to hold their lows first.
Do you think funds will rotate toward ETH, or is SOL just lagging in the short term?
#ETH #sol #BTC
$ETH
{future}(ETHUSDT)
$SOL
{future}(SOLUSDT)
$ETH holds on, $SOL weakens first: risk appetite in major coins is starting to diverge.
Binance market snapshot around 10:05–10:10 on October 1 (Taiwan time):
• ETH around $2,685, up 0.41% over the past 24 hours
• BTC around $83,422, nearly flat over the past 24 hours
• SOL around $117.97, down 1.44% over the past 24 hours
This isn’t enough to prove that funds are rotating from SOL to ETH, but it does at least suggest that after yesterday’s PCE, the price action hasn’t broadly spread to high-risk assets.
Next, watch three conditions:
• ETH breaks through and holds above 2,737: only then can bullish strength be confirmed as continuing.
• SOL reclaims 120 and then breaks above 122.5: that would be a sign that risk appetite for major coins is starting to re-expand.
• ETH falls below 2,657 while SOL loses 117.2: be alert for the divergence to evolve into an overall weakening.
At 22:00 tonight (Taiwan time), there will also be U.S. ISM Manufacturing data. Before the release, the relative strength in the morning could still reverse; what’s more worth watching right now isn’t who’s rising faster, but who fails to hold their lows first.
Do you think funds will rotate toward ETH, or is SOL just lagging in the short term?
#ETH #sol #BTC
$ETH
$SOL
Binance market snapshot around 10:05–10:10 on October 1 (Taiwan time):
• ETH around $2,685, up 0.41% over the past 24 hours
• BTC around $83,422, nearly flat over the past 24 hours
• SOL around $117.97, down 1.44% over the past 24 hours
This isn’t enough to prove that funds are rotating from SOL to ETH, but it does at least suggest that after yesterday’s PCE, the price action hasn’t broadly spread to high-risk assets.
Next, watch three conditions:
• ETH breaks through and holds above 2,737: only then can bullish strength be confirmed as continuing.
• SOL reclaims 120 and then breaks above 122.5: that would be a sign that risk appetite for major coins is starting to re-expand.
• ETH falls below 2,657 while SOL loses 117.2: be alert for the divergence to evolve into an overall weakening.
At 22:00 tonight (Taiwan time), there will also be U.S. ISM Manufacturing data. Before the release, the relative strength in the morning could still reverse; what’s more worth watching right now isn’t who’s rising faster, but who fails to hold their lows first.
Do you think funds will rotate toward ETH, or is SOL just lagging in the short term?
#ETH #sol #BTC
$ETH
$SOL

1
280
Log in to explore more content
Join global crypto users on Binance Square
⚡️ Get latest and useful information about crypto.
💬 Trusted by the world’s largest crypto exchange.
👍 Discover real insights from verified creators.
Email / Phone number
Trending Topics
1
#RubioOrdersIranDelegationToLeaveUS
0 views
0 Discussing
2
#MetaMaskExitsLidoValidatorsAfterSecurityIncident
15,366 views
411 Discussing
3
#MicronBeatsEarningsLiftsGuidance
13,674 views
366 Discussing
4
#CFTCSubmitsTwoEventContractRulesToWhiteHouse
12,340 views
341 Discussing
5
#BitcoinClears$85200
28,503 views
310 Discussing
6
#AltcoinSeasonIndexHoldsAbove60For5Days
140,473 views
1,837 Discussing
7
#USADPAdds90000JobsInSeptember
64,540 views
1,051 Discussing
8
#USCorePCEEasesTo3%InAugust
44,408 views
713 Discussing
9
#KospiPostsWorstQuarterSince2020
25,227 views
596 Discussing
10
#SECToClarifyOnChainFundraisingRules
63,064 views
795 Discussing