
#79
79
66,119 views
54 Discussing
Hot
Latest

·
--
🐱 Meow Bro’s Market Watch: BTC -5.6% in 24h, while Lighter (LIT) is down just 1.4%—a rare “holds-up-well” pick among trending coins!
📊 Data:
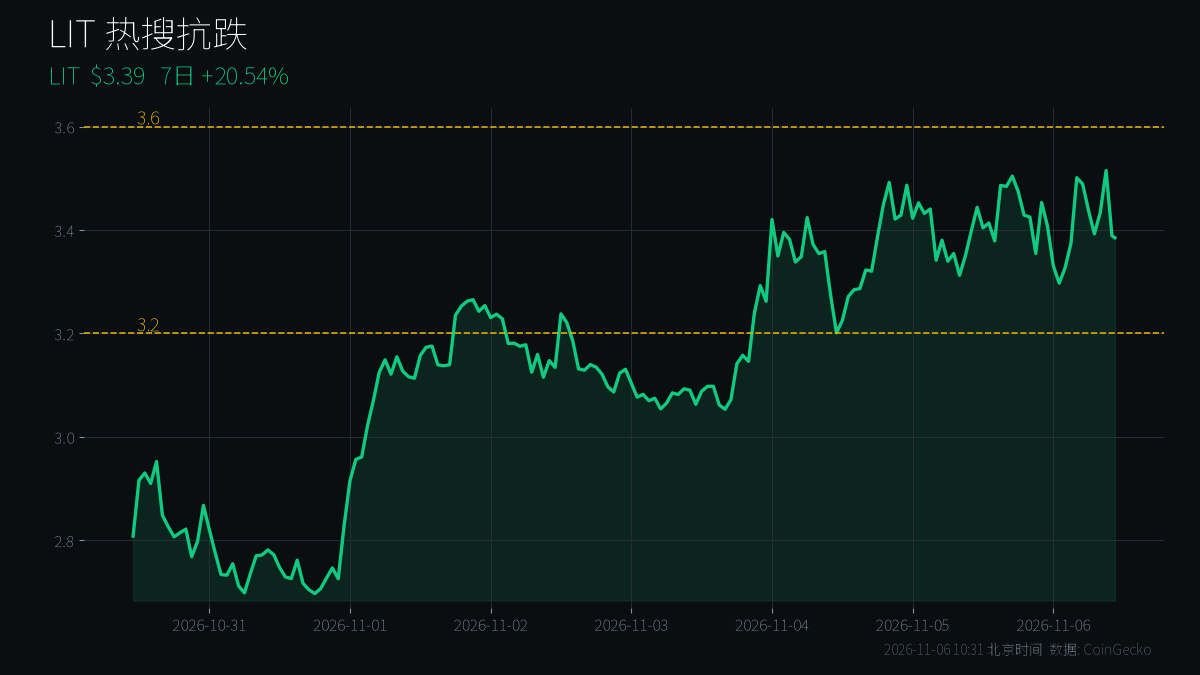
• LIT is currently around $3.375, ranked #7 among CoinGecko trending coins and #79 by market cap
• 24h: -1.4%; +4.6% against BTC and +6.8% against ETH
• Other coins on the list: NEAR -8.2%, PENGU -9.2%. It’s holding up best amid the broad sell-off
• Fear & Greed Index: 28 (Fear)
🔍 Meow Bro’s take:
Holding up well ≠ going up. When the market is fearful, money tends to crowd into perpetual DEXs with a strong narrative and revenue—but liquidity is thin. If BTC takes another hit, coins that have held up may catch up on the downside even faster.
Watch two levels: if it holds $3.2, that could signal stabilization; only a high-volume breakout above $3.6 would confirm a stronger trend.
👉 Do you think coins holding up well are genuinely strong, or have they just not had their turn to fall? Let’s chat in the comments.
$LIT $BTC $ETH
#链上数据 #山寨币 #TrendingCoins
For personal views only; not investment advice
🐱 Meow Bro’s Market Watch: BTC -5.6% in 24h, while Lighter (LIT) is down just 1.4%—a rare “holds-up-well” pick among trending coins!
📊 Data:
• LIT is currently around $3.375, ranked #7 among CoinGecko trending coins and #79 by market cap
• 24h: -1.4%; +4.6% against BTC and +6.8% against ETH
• Other coins on the list: NEAR -8.2%, PENGU -9.2%. It’s holding up best amid the broad sell-off
• Fear & Greed Index: 28 (Fear)
🔍 Meow Bro’s take:
Holding up well ≠ going up. When the market is fearful, money tends to crowd into perpetual DEXs with a strong narrative and revenue—but liquidity is thin. If BTC takes another hit, coins that have held up may catch up on the downside even faster.
Watch two levels: if it holds $3.2, that could signal stabilization; only a high-volume breakout above $3.6 would confirm a stronger trend.
👉 Do you think coins holding up well are genuinely strong, or have they just not had their turn to fall? Let’s chat in the comments.
$LIT $BTC $ETH
#链上数据 #山寨币 #TrendingCoins
For personal views only; not investment advice
📊 Data:
• LIT is currently around $3.375, ranked #7 among CoinGecko trending coins and #79 by market cap
• 24h: -1.4%; +4.6% against BTC and +6.8% against ETH
• Other coins on the list: NEAR -8.2%, PENGU -9.2%. It’s holding up best amid the broad sell-off
• Fear & Greed Index: 28 (Fear)
🔍 Meow Bro’s take:
Holding up well ≠ going up. When the market is fearful, money tends to crowd into perpetual DEXs with a strong narrative and revenue—but liquidity is thin. If BTC takes another hit, coins that have held up may catch up on the downside even faster.
Watch two levels: if it holds $3.2, that could signal stabilization; only a high-volume breakout above $3.6 would confirm a stronger trend.
👉 Do you think coins holding up well are genuinely strong, or have they just not had their turn to fall? Let’s chat in the comments.
$LIT $BTC $ETH
#链上数据 #山寨币 #TrendingCoins
For personal views only; not investment advice
4

·
--
$PROM long position entered! 50X leverage, average entry price 5.765, target 6.117, current ROE is taking off 🚀
🎯 Live trade
$PROM USDT perpetual · LONG · 50X
Average entry price 5.765 → targets 6.117 / 6.356
Stop loss 5.600, risk-reward ratio 2.8:1
🧠 Entry rationale (LLM strategy #79 confluence confirmed)
1h bullish trend established, RSI 57.9—no chasing highs
15m pullback is only 1.28% away from EMA20; 5m volume contraction, RVOL 0.58x
Aggressive buying rebounded to 49.3%, stabilization signal appeared
Broader market choppy but leaning bullish, score 56.2; already rebounded 6.18% from the low
LIMIT order placed at pullback level 5.7646; refusing to chase a reversal at the highs
🛡️ Risk management rules
Holding window: 25–45 minutes
ROE <20% after 45 minutes triggers a time-based circuit breaker
Large winning positions are exempt from forced exits—let profits run
I didn’t chase shorts into the left-side overbought conditions on this trade. I waited for right-side confluence before acting—the timing feels great 😎
Did you catch this move? Show off your PROM positions in the comments 👇
#币安合约 #实盘战报 #量化交易 #PROM
$PROM long position entered! 50X leverage, average entry price 5.765, target 6.117, current ROE is taking off 🚀
🎯 Live trade
$PROM USDT perpetual · LONG · 50X
Average entry price 5.765 → targets 6.117 / 6.356
Stop loss 5.600, risk-reward ratio 2.8:1
🧠 Entry rationale (LLM strategy #79 confluence confirmed)
1h bullish trend established, RSI 57.9—no chasing highs
15m pullback is only 1.28% away from EMA20; 5m volume contraction, RVOL 0.58x
Aggressive buying rebounded to 49.3%, stabilization signal appeared
Broader market choppy but leaning bullish, score 56.2; already rebounded 6.18% from the low
LIMIT order placed at pullback level 5.7646; refusing to chase a reversal at the highs
🛡️ Risk management rules
Holding window: 25–45 minutes
ROE <20% after 45 minutes triggers a time-based circuit breaker
Large winning positions are exempt from forced exits—let profits run
I didn’t chase shorts into the left-side overbought conditions on this trade. I waited for right-side confluence before acting—the timing feels great 😎
Did you catch this move? Show off your PROM positions in the comments 👇
#币安合约 #实盘战报 #量化交易 #PROM
🎯 Live trade
$PROM USDT perpetual · LONG · 50X
Average entry price 5.765 → targets 6.117 / 6.356
Stop loss 5.600, risk-reward ratio 2.8:1
🧠 Entry rationale (LLM strategy #79 confluence confirmed)
1h bullish trend established, RSI 57.9—no chasing highs
15m pullback is only 1.28% away from EMA20; 5m volume contraction, RVOL 0.58x
Aggressive buying rebounded to 49.3%, stabilization signal appeared
Broader market choppy but leaning bullish, score 56.2; already rebounded 6.18% from the low
LIMIT order placed at pullback level 5.7646; refusing to chase a reversal at the highs
🛡️ Risk management rules
Holding window: 25–45 minutes
ROE <20% after 45 minutes triggers a time-based circuit breaker
Large winning positions are exempt from forced exits—let profits run
I didn’t chase shorts into the left-side overbought conditions on this trade. I waited for right-side confluence before acting—the timing feels great 😎
Did you catch this move? Show off your PROM positions in the comments 👇
#币安合约 #实盘战报 #量化交易 #PROM
135

·
--
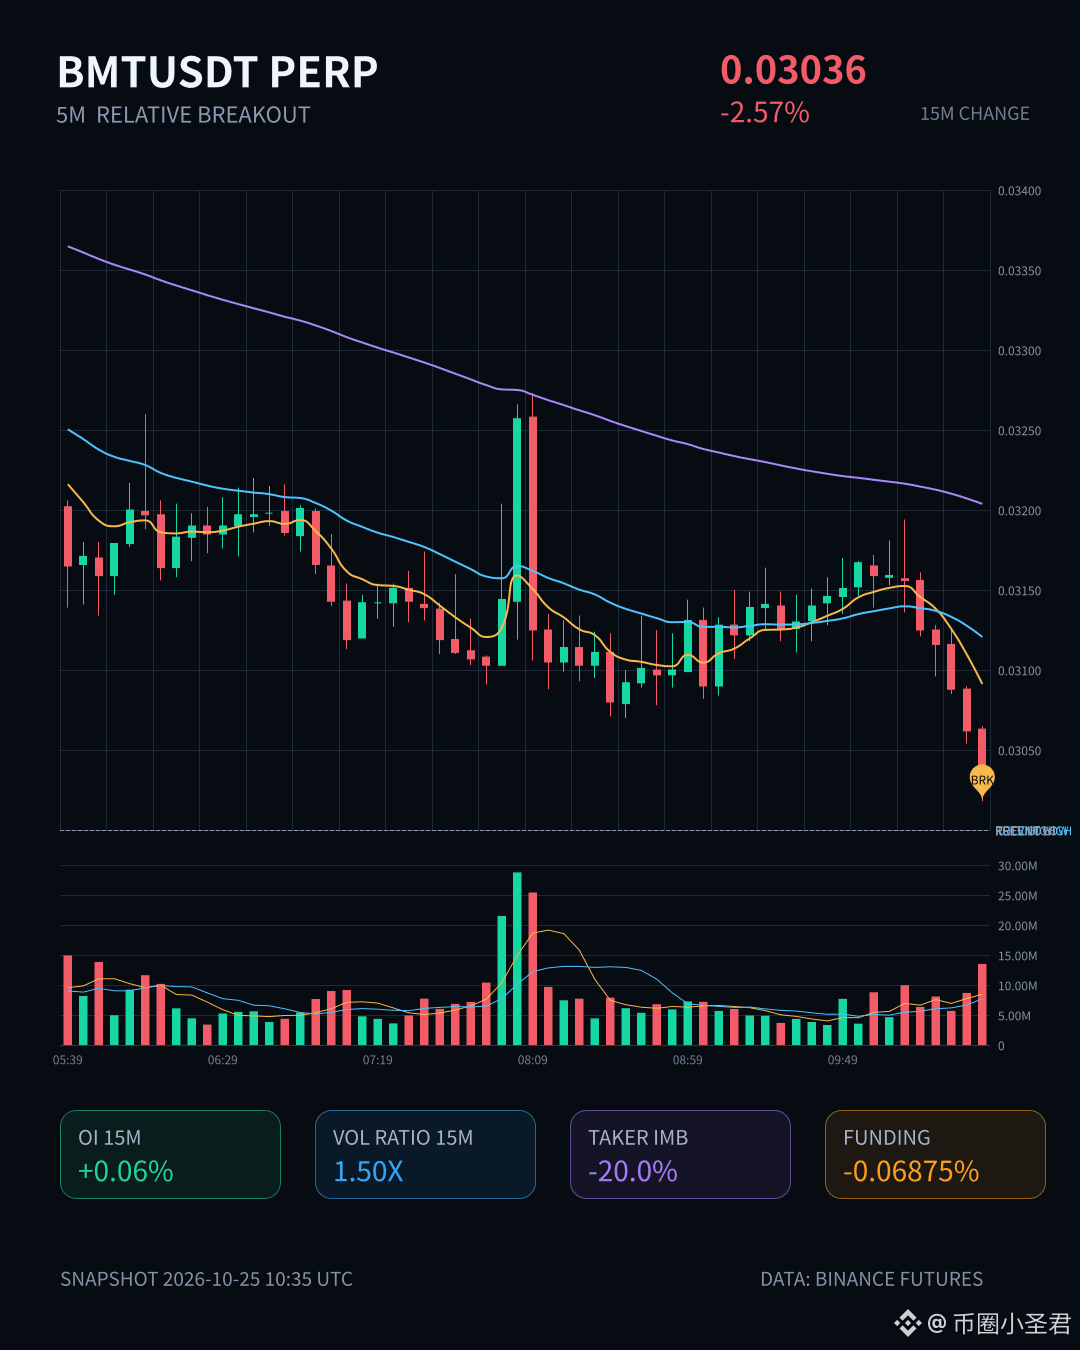
$BMT This 15m sell-off is interesting. -2.57% isn't huge, but volume hit 1.5x, the aggressive trade imbalance was -20%, and the buy/sell ratio was 0.67—clearly, someone was actively pushing the price down. The price broke below the lower bound of the last 20 5m candles, which counts as a short breakdown structurally.
However, OI looks a bit mixed: 15m futures OI edged up 0.06%, while 1h OI fell 0.34%; notional changes were negative across the board. My read is that price falling while OI ticks up looks more like new shorts piling in with leverage than longs closing out in a panic, especially given the clear aggressive selling pressure. But 1h OI is shrinking, which suggests leveraged traders are pulling back overall, and even those chasing shorts aren't going in heavily.
24h trading volume is 222M, and liquidity is decent—not the kind of market that gets pierced with one poke. The anomaly percentile is 55%, ranked #79 across the whole pool, so it's not extreme; it looks more like sentiment has just started to heat up. At this level, chasing shorts depends on whether price can hold below the lower bound; otherwise, you could end up as fuel for a false breakout. I'll watch for now—no rush to buy or short.
$BMT This 15m sell-off is interesting. -2.57% isn't huge, but volume hit 1.5x, the aggressive trade imbalance was -20%, and the buy/sell ratio was 0.67—clearly, someone was actively pushing the price down. The price broke below the lower bound of the last 20 5m candles, which counts as a short breakdown structurally.
However, OI looks a bit mixed: 15m futures OI edged up 0.06%, while 1h OI fell 0.34%; notional changes were negative across the board. My read is that price falling while OI ticks up looks more like new shorts piling in with leverage than longs closing out in a panic, especially given the clear aggressive selling pressure. But 1h OI is shrinking, which suggests leveraged traders are pulling back overall, and even those chasing shorts aren't going in heavily.
24h trading volume is 222M, and liquidity is decent—not the kind of market that gets pierced with one poke. The anomaly percentile is 55%, ranked #79 across the whole pool, so it's not extreme; it looks more like sentiment has just started to heat up. At this level, chasing shorts depends on whether price can hold below the lower bound; otherwise, you could end up as fuel for a false breakout. I'll watch for now—no rush to buy or short.
However, OI looks a bit mixed: 15m futures OI edged up 0.06%, while 1h OI fell 0.34%; notional changes were negative across the board. My read is that price falling while OI ticks up looks more like new shorts piling in with leverage than longs closing out in a panic, especially given the clear aggressive selling pressure. But 1h OI is shrinking, which suggests leveraged traders are pulling back overall, and even those chasing shorts aren't going in heavily.
24h trading volume is 222M, and liquidity is decent—not the kind of market that gets pierced with one poke. The anomaly percentile is 55%, ranked #79 across the whole pool, so it's not extreme; it looks more like sentiment has just started to heat up. At this level, chasing shorts depends on whether price can hold below the lower bound; otherwise, you could end up as fuel for a false breakout. I'll watch for now—no rush to buy or short.

·
--
ARX surges 2.5% at a key time! What happened? Key levels to watch15:57 (2 minutes ago): ARX surged 2.5% at a key time (5-minute window 15:52→15:57). As of 16:00:21, the current price is 0.2468, down 1.0% over 24h. Other assets moving at the same time included CAKE and PLAY.
📅 Data as of 16:00:21 (event trigger times are shown in each item; prices are live snapshots from the time of writing)
📌 In a nutshell: Moves during key periods (K-line closes / U.S. market opens and closes) often involve institutional participation, making the signals more credible.
Market overview: BTC 83,560.90 (-0.38%) · ETH 2,511.21 (-0.82%); across the market, 115 assets rose and 376 fell over 24h; top gainer over 24h: TRUTH +49.13%; top loser: APR -25.49%.
ARX surges 2.5% at a key time! What happened? Key levels to watch
15:57 (2 minutes ago): ARX surged 2.5% at a key time (5-minute window 15:52→15:57). As of 16:00:21, the current price is 0.2468, down 1.0% over 24h. Other assets moving at the same time included CAKE and PLAY.
📅 Data as of 16:00:21 (event trigger times are shown in each item; prices are live snapshots from the time of writing)
📌 In a nutshell: Moves during key periods (K-line closes / U.S. market opens and closes) often involve institutional participation, making the signals more credible.
Market overview: BTC 83,560.90 (-0.38%) · ETH 2,511.21 (-0.82%); across the market, 115 assets rose and 376 fell over 24h; top gainer over 24h: TRUTH +49.13%; top loser: APR -25.49%.
📅 Data as of 16:00:21 (event trigger times are shown in each item; prices are live snapshots from the time of writing)
📌 In a nutshell: Moves during key periods (K-line closes / U.S. market opens and closes) often involve institutional participation, making the signals more credible.
Market overview: BTC 83,560.90 (-0.38%) · ETH 2,511.21 (-0.82%); across the market, 115 assets rose and 376 fell over 24h; top gainer over 24h: TRUTH +49.13%; top loser: APR -25.49%.
29
·
--
W Surges 4.0% in 5 Minutes! What Happened? Key Levels HereAt 21:56 (5 minutes ago), W surged 4.0% in 5 minutes (5-minute window: 21:51→21:56). As of 22:01:31, the price is 0.02592, up 49.4% in 24h. Other coins making moves around the same time include RSR and STRK.
📅 Data as of 22:01:31 (event trigger times are shown in each item; prices are live snapshots at the time of writing)
📌 In a nutshell: Short-term momentum is concentrated, and pullbacks can come quickly—placing orders in batches is steadier than chasing the price
Market overview: BTC 82,939.60(-0.12%) · ETH 2,540.38(+1.55%); across the market, 176 coins rose and 314 fell in 24h; top 24h gainer: RSR +52.84%; biggest loser: LUMIA -23.45%.
W Surges 4.0% in 5 Minutes! What Happened? Key Levels Here
At 21:56 (5 minutes ago), W surged 4.0% in 5 minutes (5-minute window: 21:51→21:56). As of 22:01:31, the price is 0.02592, up 49.4% in 24h. Other coins making moves around the same time include RSR and STRK.
📅 Data as of 22:01:31 (event trigger times are shown in each item; prices are live snapshots at the time of writing)
📌 In a nutshell: Short-term momentum is concentrated, and pullbacks can come quickly—placing orders in batches is steadier than chasing the price
Market overview: BTC 82,939.60(-0.12%) · ETH 2,540.38(+1.55%); across the market, 176 coins rose and 314 fell in 24h; top 24h gainer: RSR +52.84%; biggest loser: LUMIA -23.45%.
📅 Data as of 22:01:31 (event trigger times are shown in each item; prices are live snapshots at the time of writing)
📌 In a nutshell: Short-term momentum is concentrated, and pullbacks can come quickly—placing orders in batches is steadier than chasing the price
Market overview: BTC 82,939.60(-0.12%) · ETH 2,540.38(+1.55%); across the market, 176 coins rose and 314 fell in 24h; top 24h gainer: RSR +52.84%; biggest loser: LUMIA -23.45%.
6
·
--
AGT surges 4.1% in 5 minutes! What happened? Key levels to watch21:27 (2 minutes ago): AGT surged 4.1% within 5 minutes (5-minute window 21:22→21:27). As of 21:30:47, the current price is 0.01581, down 11.3% over 24h. Other tokens with notable moves during the same period include SXT and STRK.
📅 Data as of 21:30:47 (event trigger times are noted in each item; prices are real-time snapshots taken when this was written)
📌 In a nutshell: Short-term momentum is concentrated, and pullbacks can come quickly—placing staggered limit orders is steadier than chasing highs.
Market overview: BTC 82,445.00(-0.73%) · ETH 2,521.87(+0.72%); across the market, 158 gainers / 334 losers over 24h; top gainer GTC+48.72%, biggest loser LUMIA-24.87%.
AGT surges 4.1% in 5 minutes! What happened? Key levels to watch
21:27 (2 minutes ago): AGT surged 4.1% within 5 minutes (5-minute window 21:22→21:27). As of 21:30:47, the current price is 0.01581, down 11.3% over 24h. Other tokens with notable moves during the same period include SXT and STRK.
📅 Data as of 21:30:47 (event trigger times are noted in each item; prices are real-time snapshots taken when this was written)
📌 In a nutshell: Short-term momentum is concentrated, and pullbacks can come quickly—placing staggered limit orders is steadier than chasing highs.
Market overview: BTC 82,445.00(-0.73%) · ETH 2,521.87(+0.72%); across the market, 158 gainers / 334 losers over 24h; top gainer GTC+48.72%, biggest loser LUMIA-24.87%.
📅 Data as of 21:30:47 (event trigger times are noted in each item; prices are real-time snapshots taken when this was written)
📌 In a nutshell: Short-term momentum is concentrated, and pullbacks can come quickly—placing staggered limit orders is steadier than chasing highs.
Market overview: BTC 82,445.00(-0.73%) · ETH 2,521.87(+0.72%); across the market, 158 gainers / 334 losers over 24h; top gainer GTC+48.72%, biggest loser LUMIA-24.87%.
8
·
--
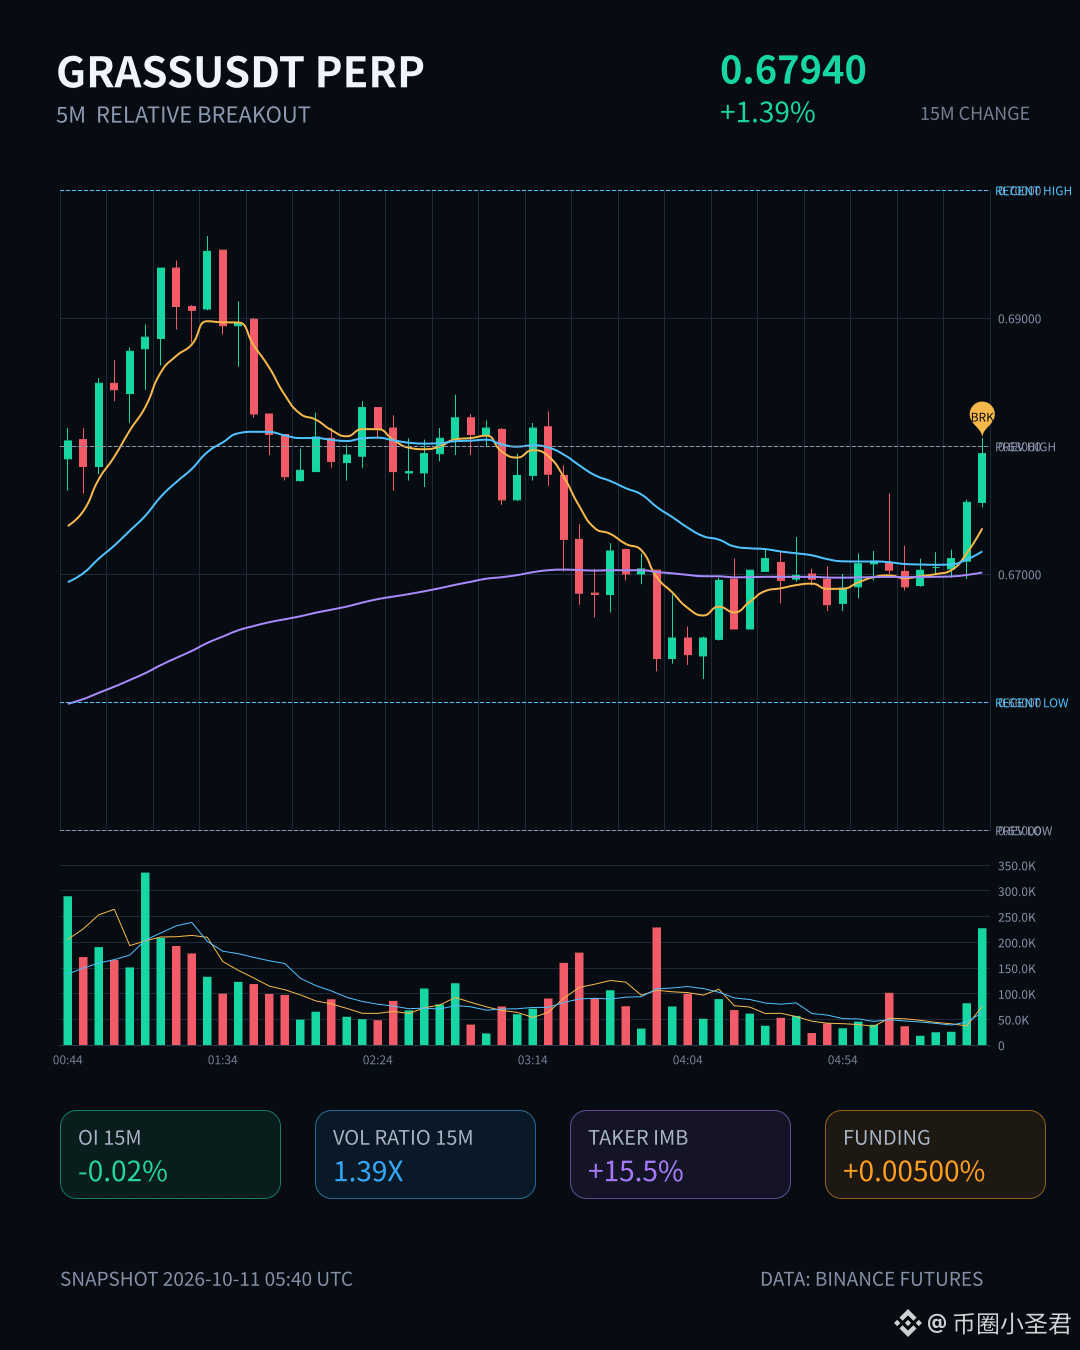
$GRASS Just now, the 5m candle closed above the upper bound of the range formed by nearly 20 candles. Aggressive buying is clearly dominant, with a buy/sell ratio of 1.37—capital is driving the move.
One detail is worth watching: OI is falling rather than rising, down 0.02% on 15m contracts and 0.03% on 1h contracts. Price is rising while open interest is falling, a combination that looks more like a short-covering rally than fresh longs entering and building positions.
The anomaly percentile across the entire pool is #79.6, and the notional change is #30. These aren’t top-tier signals, but given the breakout structure, it’s worth watching in the short term to see whether volume follows through.
If OI continues to lag, the sustainability of this short-covering rally is questionable.
$GRASS Just now, the 5m candle closed above the upper bound of the range formed by nearly 20 candles. Aggressive buying is clearly dominant, with a buy/sell ratio of 1.37—capital is driving the move.
One detail is worth watching: OI is falling rather than rising, down 0.02% on 15m contracts and 0.03% on 1h contracts. Price is rising while open interest is falling, a combination that looks more like a short-covering rally than fresh longs entering and building positions.
The anomaly percentile across the entire pool is #79.6, and the notional change is #30. These aren’t top-tier signals, but given the breakout structure, it’s worth watching in the short term to see whether volume follows through.
If OI continues to lag, the sustainability of this short-covering rally is questionable.
One detail is worth watching: OI is falling rather than rising, down 0.02% on 15m contracts and 0.03% on 1h contracts. Price is rising while open interest is falling, a combination that looks more like a short-covering rally than fresh longs entering and building positions.
The anomaly percentile across the entire pool is #79.6, and the notional change is #30. These aren’t top-tier signals, but given the breakout structure, it’s worth watching in the short term to see whether volume follows through.
If OI continues to lag, the sustainability of this short-covering rally is questionable.
8
·
--
GUN surges 1.5% at a key time! What happened? Key levels to watchAt 23:59 (2 minutes ago), GUN surged 1.5% at a key time (5-minute window: 23:54→23:59). As of 00:01:48, its current price was 0.002989, up 6.6% over 24h. Other assets with notable moves in the same batch included APT and YB.
📅 Data as of 00:01:48 (event trigger times are noted for each item; prices are real-time snapshots taken when this was written)
📌 In a nutshell: Notable moves during key periods (such as candle closes and U.S. stock market openings and closings) often involve institutional participation, making these signals more credible.
Market overview: BTC 82,996.30 (+0.28%) · ETH 2,510.41 (+0.98%); across the market, 313 assets rose and 43 fell over 24h; top gainer: LUMIA +36.14%, top loser: SENT -8.86%.
GUN surges 1.5% at a key time! What happened? Key levels to watch
At 23:59 (2 minutes ago), GUN surged 1.5% at a key time (5-minute window: 23:54→23:59). As of 00:01:48, its current price was 0.002989, up 6.6% over 24h. Other assets with notable moves in the same batch included APT and YB.
📅 Data as of 00:01:48 (event trigger times are noted for each item; prices are real-time snapshots taken when this was written)
📌 In a nutshell: Notable moves during key periods (such as candle closes and U.S. stock market openings and closings) often involve institutional participation, making these signals more credible.
Market overview: BTC 82,996.30 (+0.28%) · ETH 2,510.41 (+0.98%); across the market, 313 assets rose and 43 fell over 24h; top gainer: LUMIA +36.14%, top loser: SENT -8.86%.
📅 Data as of 00:01:48 (event trigger times are noted for each item; prices are real-time snapshots taken when this was written)
📌 In a nutshell: Notable moves during key periods (such as candle closes and U.S. stock market openings and closings) often involve institutional participation, making these signals more credible.
Market overview: BTC 82,996.30 (+0.28%) · ETH 2,510.41 (+0.98%); across the market, 313 assets rose and 43 fell over 24h; top gainer: LUMIA +36.14%, top loser: SENT -8.86%.
93
·
--
CTSI surged 11% in a jump! Can you chase after moves like this?21:37 (22 minutes ago) CTSI surged by 11% within 15 minutes (15-minute window 21:22→21:37). As of 21:59:37, the current price is 0.03663, up 27.2% over 24h. Other coins in the same batch of movers include SKL and ETHFI.
📅 Data as of 21:59:37 (event trigger time is noted on each item; prices are real-time snapshots at the time of writing).
📌 One-line takeaway: The 15-minute trend is amplified—decide where to set your stop-loss before the trend starts.
Market Overview: BTC 82,158.00(-1.26%) · ETH 2,520.97(-1.92%); 247 gainers / 108 decliners across the market over the past 24h; Top gainer OGN +97.71%, top decliner MINA -15.65%.
CTSI surged 11% in a jump! Can you chase after moves like this?
21:37 (22 minutes ago) CTSI surged by 11% within 15 minutes (15-minute window 21:22→21:37). As of 21:59:37, the current price is 0.03663, up 27.2% over 24h. Other coins in the same batch of movers include SKL and ETHFI.
📅 Data as of 21:59:37 (event trigger time is noted on each item; prices are real-time snapshots at the time of writing).
📌 One-line takeaway: The 15-minute trend is amplified—decide where to set your stop-loss before the trend starts.
Market Overview: BTC 82,158.00(-1.26%) · ETH 2,520.97(-1.92%); 247 gainers / 108 decliners across the market over the past 24h; Top gainer OGN +97.71%, top decliner MINA -15.65%.
📅 Data as of 21:59:37 (event trigger time is noted on each item; prices are real-time snapshots at the time of writing).
📌 One-line takeaway: The 15-minute trend is amplified—decide where to set your stop-loss before the trend starts.
Market Overview: BTC 82,158.00(-1.26%) · ETH 2,520.97(-1.92%); 247 gainers / 108 decliners across the market over the past 24h; Top gainer OGN +97.71%, top decliner MINA -15.65%.
1

Is the meme coin scene shifting again? 🐧🚀 Traders are eyeing these hot trending coins today: - $PUMP (#79) launch frenzy - $PENGU (#111) penguin heat - $ETH (#2) core strength Which one wins? #MemeCoins #Crypto Not Financial Advice (DYOR)
Is the meme coin scene shifting again? 🐧🚀 Traders are eyeing these hot trending coins today: - $PUMP (#79) launch frenzy - $PENGU (#111) penguin heat - $ETH (#2) core strength Which one wins? #MemeCoins #Crypto Not Financial Advice (DYOR)

121

·
--
$PUMP At this position right now, in the past 30 days it’s risen 52%, but it’s still 77% away from the ATH. In the last 24 hours it’s up 10%, with the price moving to around 0.002—just one breath away from the recent 0.002058. If you only look at the last 7 days, a 2% increase is almost equivalent to no move at all—the whole market is really saying: “The bounce happened, but it hasn’t held.”
What I care about more is volume. After it spiked to 156M on July 21, it shrank, and even though it’s returned to around 80M in the last two days, compared with that earlier volume-spiking bullish candle, it’s already a whole level lower. Its market cap ranks #79, exceeding 790 million, but the 24h trading volume is only a bit above 10% of the market cap—liquidity isn’t dead, but it doesn’t look like someone is aggressively accumulating.
From the 30-day trend, the move from $0.00135 to $0.002 has been quite stubborn. It did dip back to around $0.00138 in the middle, but every time it rebounded, it didn’t come with a truly heavy volume spike. I’m more inclined to think this is short-term money trading over a new narrative for meme-platform coins, rather than institutions or smart money making strategic buys. The real thing to confirm is whether this bounce can turn $0.002 into a new support level, instead of tagging it once and then flipping.
The biggest risk is hidden in the distance to the ATH: a 77% drawdown means everything above is trapped capital. Every rebound back above 0.002 will face overhead supply as that trapped position releases. If over the next few days the trading volume can’t rise again—and it falls back below 50M—then this 10% gain is very likely just another rebound leg, not a trend reversal.
One unresolved contradiction: in this PUMP rally, is it fresh capital rebuilding positions and preparing to break the previous high, or is it merely a technical repair after short-covering? The answer lies in what happens to $0.002 over the coming days—but at this stage, the data isn’t enough to tell.
$PUMP At this position right now, in the past 30 days it’s risen 52%, but it’s still 77% away from the ATH. In the last 24 hours it’s up 10%, with the price moving to around 0.002—just one breath away from the recent 0.002058. If you only look at the last 7 days, a 2% increase is almost equivalent to no move at all—the whole market is really saying: “The bounce happened, but it hasn’t held.”
What I care about more is volume. After it spiked to 156M on July 21, it shrank, and even though it’s returned to around 80M in the last two days, compared with that earlier volume-spiking bullish candle, it’s already a whole level lower. Its market cap ranks #79, exceeding 790 million, but the 24h trading volume is only a bit above 10% of the market cap—liquidity isn’t dead, but it doesn’t look like someone is aggressively accumulating.
From the 30-day trend, the move from $0.00135 to $0.002 has been quite stubborn. It did dip back to around $0.00138 in the middle, but every time it rebounded, it didn’t come with a truly heavy volume spike. I’m more inclined to think this is short-term money trading over a new narrative for meme-platform coins, rather than institutions or smart money making strategic buys. The real thing to confirm is whether this bounce can turn $0.002 into a new support level, instead of tagging it once and then flipping.
The biggest risk is hidden in the distance to the ATH: a 77% drawdown means everything above is trapped capital. Every rebound back above 0.002 will face overhead supply as that trapped position releases. If over the next few days the trading volume can’t rise again—and it falls back below 50M—then this 10% gain is very likely just another rebound leg, not a trend reversal.
One unresolved contradiction: in this PUMP rally, is it fresh capital rebuilding positions and preparing to break the previous high, or is it merely a technical repair after short-covering? The answer lies in what happens to $0.002 over the coming days—but at this stage, the data isn’t enough to tell.
What I care about more is volume. After it spiked to 156M on July 21, it shrank, and even though it’s returned to around 80M in the last two days, compared with that earlier volume-spiking bullish candle, it’s already a whole level lower. Its market cap ranks #79, exceeding 790 million, but the 24h trading volume is only a bit above 10% of the market cap—liquidity isn’t dead, but it doesn’t look like someone is aggressively accumulating.
From the 30-day trend, the move from $0.00135 to $0.002 has been quite stubborn. It did dip back to around $0.00138 in the middle, but every time it rebounded, it didn’t come with a truly heavy volume spike. I’m more inclined to think this is short-term money trading over a new narrative for meme-platform coins, rather than institutions or smart money making strategic buys. The real thing to confirm is whether this bounce can turn $0.002 into a new support level, instead of tagging it once and then flipping.
The biggest risk is hidden in the distance to the ATH: a 77% drawdown means everything above is trapped capital. Every rebound back above 0.002 will face overhead supply as that trapped position releases. If over the next few days the trading volume can’t rise again—and it falls back below 50M—then this 10% gain is very likely just another rebound leg, not a trend reversal.
One unresolved contradiction: in this PUMP rally, is it fresh capital rebuilding positions and preparing to break the previous high, or is it merely a technical repair after short-covering? The answer lies in what happens to $0.002 over the coming days—but at this stage, the data isn’t enough to tell.
16
·
--
$ALGO this spot gives me a feeling that’s more worth watching than the previous few bounces—but intuition needs data to back it up, otherwise it’s just emotion.
Looking at the past 30 days of price action, the $0.077–0.08 range has been repeatedly tested, with volume mostly hovering between 15–25M. But over the last 16 hours from yesterday to today, trading volume suddenly doubled to 34M. Price pulled back from 0.08 to 0.085 while it also hit Trending. This isn’t a single lone bullish candle; it’s more like mild consolidation after a low-level volume expansion and turnover.
Market cap #79, about 97% away from ATH—at this level, sell pressure isn’t as heavy as you’d imagine. Or rather, the sell-side has basically rotated to a new group.
What I care about most is: who is the counterparty in this trade? If it’s short-term speculative money, volume will be hard to sustain. If there’s smart money accumulating at the low, then over the next few days we should see price gradually hold up against the supply zone around 0.086–0.088, and volume shouldn’t quickly fade back.
The risk is this: in the past 30 days, every time the rally got near 0.086, it was pushed back. After volume expanded, it was often followed by a declining move on shrinking volume. If this time is the same script—volume falling back below 20M within three days—then it’s just short-covering, not a trend reversal.
Will my thesis fail? I’d look at two conditions: daily trading volume staying below 20M for three consecutive days, or price breaking back below 0.078. If both show up, I’ll stop focusing on this and wait for the next setup. You now have the same data I do—so you can decide for yourself: is this volume build-up power accumulation or just turnover?
$ALGO this spot gives me a feeling that’s more worth watching than the previous few bounces—but intuition needs data to back it up, otherwise it’s just emotion.
Looking at the past 30 days of price action, the $0.077–0.08 range has been repeatedly tested, with volume mostly hovering between 15–25M. But over the last 16 hours from yesterday to today, trading volume suddenly doubled to 34M. Price pulled back from 0.08 to 0.085 while it also hit Trending. This isn’t a single lone bullish candle; it’s more like mild consolidation after a low-level volume expansion and turnover.
Market cap #79, about 97% away from ATH—at this level, sell pressure isn’t as heavy as you’d imagine. Or rather, the sell-side has basically rotated to a new group.
What I care about most is: who is the counterparty in this trade? If it’s short-term speculative money, volume will be hard to sustain. If there’s smart money accumulating at the low, then over the next few days we should see price gradually hold up against the supply zone around 0.086–0.088, and volume shouldn’t quickly fade back.
The risk is this: in the past 30 days, every time the rally got near 0.086, it was pushed back. After volume expanded, it was often followed by a declining move on shrinking volume. If this time is the same script—volume falling back below 20M within three days—then it’s just short-covering, not a trend reversal.
Will my thesis fail? I’d look at two conditions: daily trading volume staying below 20M for three consecutive days, or price breaking back below 0.078. If both show up, I’ll stop focusing on this and wait for the next setup. You now have the same data I do—so you can decide for yourself: is this volume build-up power accumulation or just turnover?
Looking at the past 30 days of price action, the $0.077–0.08 range has been repeatedly tested, with volume mostly hovering between 15–25M. But over the last 16 hours from yesterday to today, trading volume suddenly doubled to 34M. Price pulled back from 0.08 to 0.085 while it also hit Trending. This isn’t a single lone bullish candle; it’s more like mild consolidation after a low-level volume expansion and turnover.
Market cap #79, about 97% away from ATH—at this level, sell pressure isn’t as heavy as you’d imagine. Or rather, the sell-side has basically rotated to a new group.
What I care about most is: who is the counterparty in this trade? If it’s short-term speculative money, volume will be hard to sustain. If there’s smart money accumulating at the low, then over the next few days we should see price gradually hold up against the supply zone around 0.086–0.088, and volume shouldn’t quickly fade back.
The risk is this: in the past 30 days, every time the rally got near 0.086, it was pushed back. After volume expanded, it was often followed by a declining move on shrinking volume. If this time is the same script—volume falling back below 20M within three days—then it’s just short-covering, not a trend reversal.
Will my thesis fail? I’d look at two conditions: daily trading volume staying below 20M for three consecutive days, or price breaking back below 0.078. If both show up, I’ll stop focusing on this and wait for the next setup. You now have the same data I do—so you can decide for yourself: is this volume build-up power accumulation or just turnover?
35


·
--
We're excited to share the latest trending tokens with our community 🚀. According to CoinGecko, top tokens include Bonk, Backpack, and NEAR Protocol.
We've seen significant movement in the market, with LAB and Bitcoin leading the pack. Hyperliquid and Venice Token are also making waves, with market cap ranks of #10 and #79 respectively. Notable tokens include BONK, BP, and NEAR, with market cap ranks of #112, #377, and #31.
As we continue to monitor the market, we're seeing opportunities for growth and investment 💡. Our community is active and engaged, and we're confident in our ability to navigate the crypto space 📈. We're committed to providing the latest updates and insights to help our users make informed decisions.
$PORTAL, $GENIUS, $APR
We're excited to share the latest trending tokens with our community 🚀. According to CoinGecko, top tokens include Bonk, Backpack, and NEAR Protocol.
We've seen significant movement in the market, with LAB and Bitcoin leading the pack. Hyperliquid and Venice Token are also making waves, with market cap ranks of #10 and #79 respectively. Notable tokens include BONK, BP, and NEAR, with market cap ranks of #112, #377, and #31.
As we continue to monitor the market, we're seeing opportunities for growth and investment 💡. Our community is active and engaged, and we're confident in our ability to navigate the crypto space 📈. We're committed to providing the latest updates and insights to help our users make informed decisions.
$PORTAL , $GENIUS , $APR
We've seen significant movement in the market, with LAB and Bitcoin leading the pack. Hyperliquid and Venice Token are also making waves, with market cap ranks of #10 and #79 respectively. Notable tokens include BONK, BP, and NEAR, with market cap ranks of #112, #377, and #31.
As we continue to monitor the market, we're seeing opportunities for growth and investment 💡. Our community is active and engaged, and we're confident in our ability to navigate the crypto space 📈. We're committed to providing the latest updates and insights to help our users make informed decisions.
$PORTAL , $GENIUS , $APR
11

$67.34M volume/24h: $VVV is liquid, but the risk lies in entering late.
Current price is around $18.43, up 9.05643%/24h, close to the upper edge of the daily range $16.70–$18.50. As the price approaches the session high, the attractive part is easily visible; what needs consideration is the potential pullback if buying pressure doesn't hold.
Market cap $859.88M, rank #79 → the interest level is already significant enough for stronger short-term volatility. Previous technicals emphasized that the structure is still dependent on holding the breakout zone; therefore, I won't interpret this rise as a one-way signal.
With $VVV, I prioritize watching if the price can hold near the highs or slide back into the middle of the 24h range. Which scenario are you leaning towards? #VVV $VVV #Crypto #BinanceSquare #DYOR
$67.34M volume/24h: $VVV is liquid, but the risk lies in entering late.
Current price is around $18.43, up 9.05643%/24h, close to the upper edge of the daily range $16.70–$18.50. As the price approaches the session high, the attractive part is easily visible; what needs consideration is the potential pullback if buying pressure doesn't hold.
Market cap $859.88M, rank #79 → the interest level is already significant enough for stronger short-term volatility. Previous technicals emphasized that the structure is still dependent on holding the breakout zone; therefore, I won't interpret this rise as a one-way signal.
With $VVV , I prioritize watching if the price can hold near the highs or slide back into the middle of the 24h range. Which scenario are you leaning towards? #VVV $VVV #Crypto #BinanceSquare #DYOR
Current price is around $18.43, up 9.05643%/24h, close to the upper edge of the daily range $16.70–$18.50. As the price approaches the session high, the attractive part is easily visible; what needs consideration is the potential pullback if buying pressure doesn't hold.
Market cap $859.88M, rank #79 → the interest level is already significant enough for stronger short-term volatility. Previous technicals emphasized that the structure is still dependent on holding the breakout zone; therefore, I won't interpret this rise as a one-way signal.
With $VVV , I prioritize watching if the price can hold near the highs or slide back into the middle of the 24h range. Which scenario are you leaning towards? #VVV $VVV #Crypto #BinanceSquare #DYOR
259

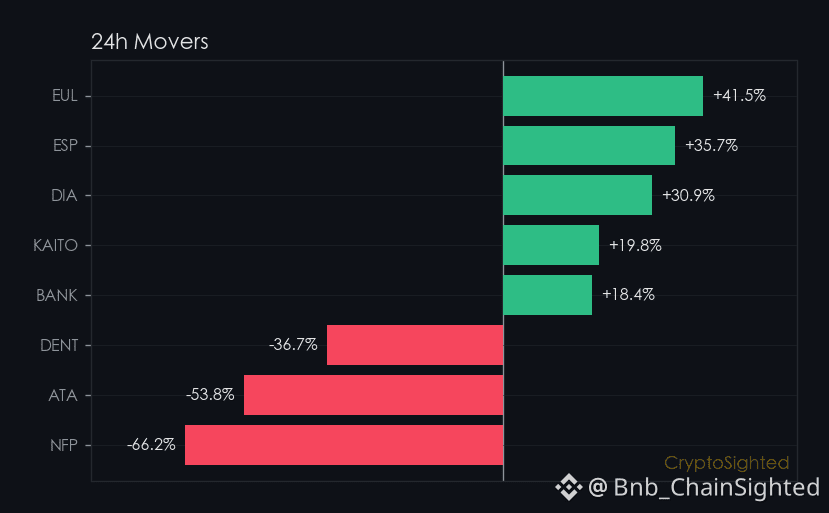
3.5% - that’s the jump $LTC made today, and it’s enough to stand out in a market that’s otherwise holding its breath.
LTC’s 3.45% rise over 24 hours isn’t just a move - it’s a break from the quiet.
The coin has surged past a 7-day range that had barely shifted by 1.1%, showing a clear departure from stagnation.
And this is happening on a day when most of the market is flat or even down.
The question now is: what’s behind it?
—
Not financial advice. DYOR.
📌 Gainers Radar · #79 · #Gainers #CryptoSighted $LTC
3.5% - that’s the jump $LTC made today, and it’s enough to stand out in a market that’s otherwise holding its breath.
LTC’s 3.45% rise over 24 hours isn’t just a move - it’s a break from the quiet.
The coin has surged past a 7-day range that had barely shifted by 1.1%, showing a clear departure from stagnation.
And this is happening on a day when most of the market is flat or even down.
The question now is: what’s behind it?
—
Not financial advice. DYOR.
📌 Gainers Radar · #79 · #Gainers #CryptoSighted $LTC
LTC’s 3.45% rise over 24 hours isn’t just a move - it’s a break from the quiet.
The coin has surged past a 7-day range that had barely shifted by 1.1%, showing a clear departure from stagnation.
And this is happening on a day when most of the market is flat or even down.
The question now is: what’s behind it?
—
Not financial advice. DYOR.
📌 Gainers Radar · #79 · #Gainers #CryptoSighted $LTC
517
Coinbase CEO Brian Armstrong recently mentioned agentic finance in a statement, noting that Base has processed over 100 million AI-powered payments.
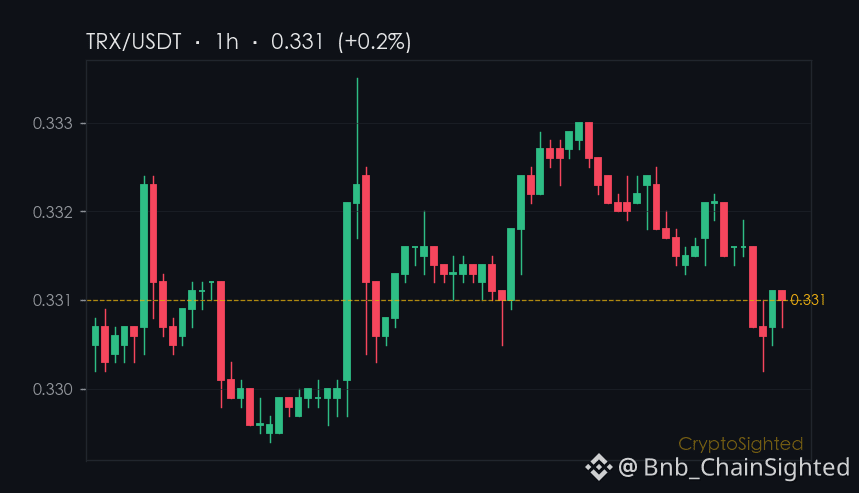
$TRX has remained relatively quiet on the surface, but on-chain data doesn’t show any major inflows or outflows. There are no sudden spikes in wallet activity or large transfers that would signal a shift in sentiment. It’s not that TRX is falling — it’s just not accelerating.
So here’s the real question: if AI is reshaping finance, where does TRX fit in — and is it ready for the ride?
—
Not financial advice. DYOR.
📌 News Take · #79 · #CryptoNews #CryptoSighted $TRX
Coinbase CEO Brian Armstrong recently mentioned agentic finance in a statement, noting that Base has processed over 100 million AI-powered payments.
$TRX has remained relatively quiet on the surface, but on-chain data doesn’t show any major inflows or outflows. There are no sudden spikes in wallet activity or large transfers that would signal a shift in sentiment. It’s not that TRX is falling — it’s just not accelerating.
So here’s the real question: if AI is reshaping finance, where does TRX fit in — and is it ready for the ride?
—
Not financial advice. DYOR.
📌 News Take · #79 · #CryptoNews #CryptoSighted $TRX
$TRX has remained relatively quiet on the surface, but on-chain data doesn’t show any major inflows or outflows. There are no sudden spikes in wallet activity or large transfers that would signal a shift in sentiment. It’s not that TRX is falling — it’s just not accelerating.
So here’s the real question: if AI is reshaping finance, where does TRX fit in — and is it ready for the ride?
—
Not financial advice. DYOR.
📌 News Take · #79 · #CryptoNews #CryptoSighted $TRX
116

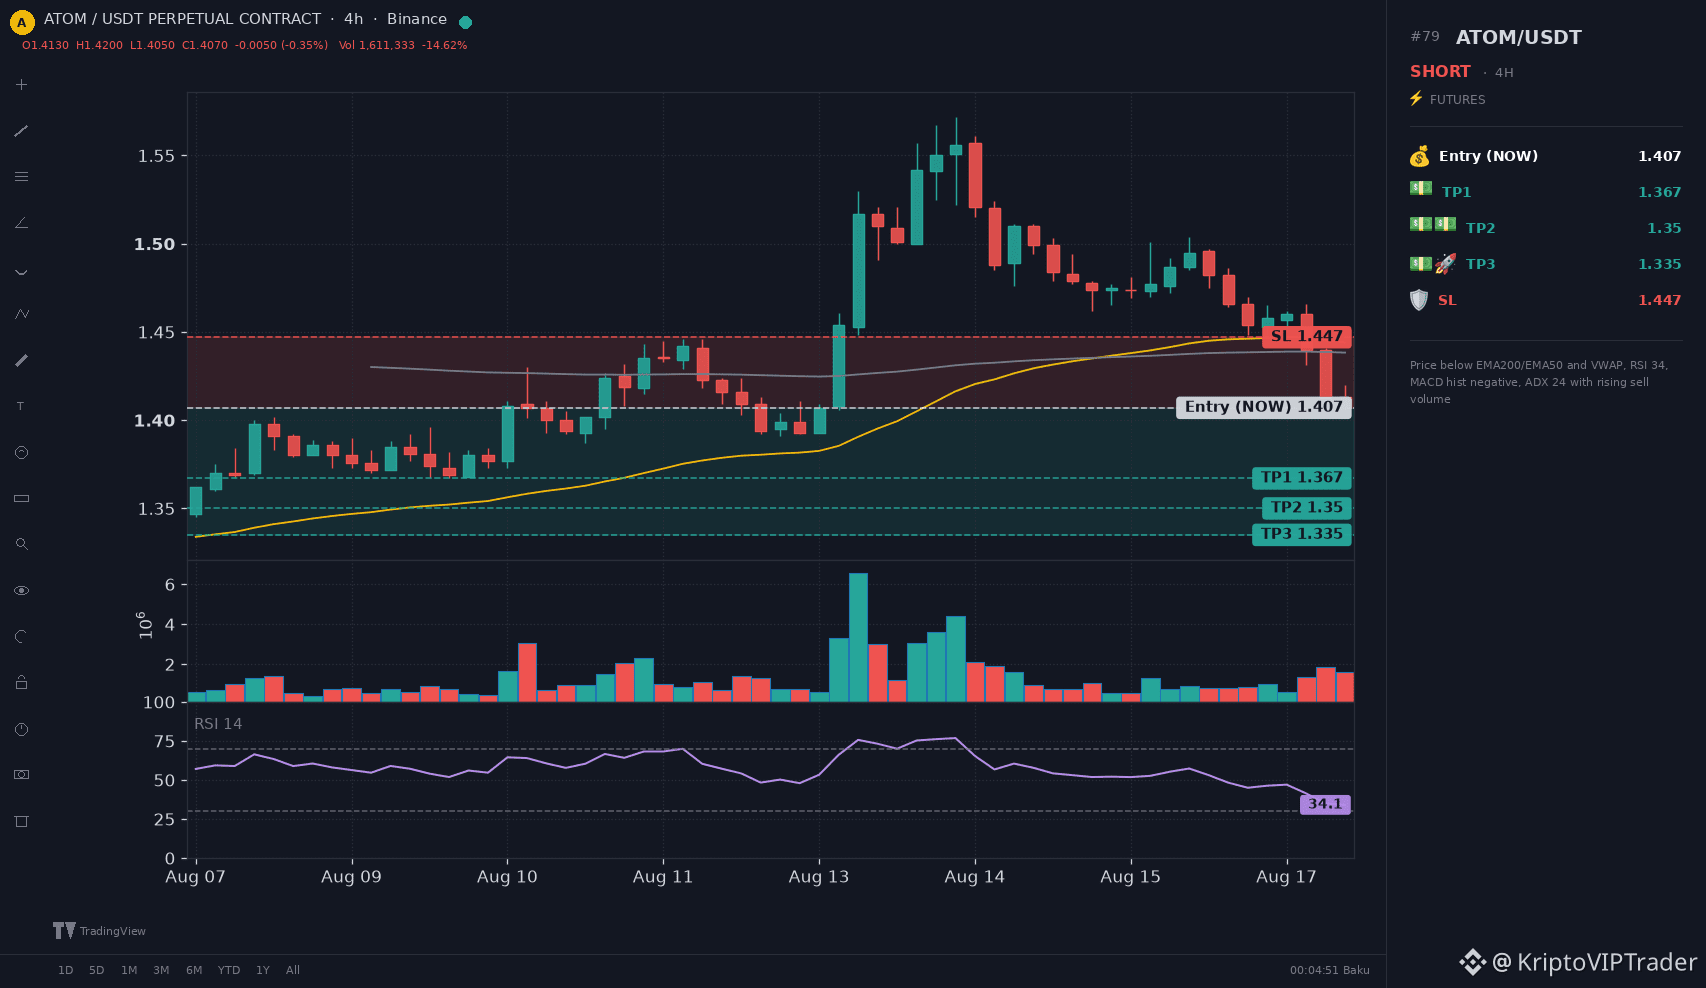
🔖 #79 · 18.08.26 00:02
🔴 SHORT 🐻 | $ATOM 💰 | ⏱ Candle: 4H · ⚡️ FUTURES
{future}(ATOMUSDT)
❗️ Duration: up to 5 days
📊 Entry: 1.407 (Enter NOW)
🎯 TP1: 1.367 (+2.8%)
🎯 TP2: 1.350 (+4.1%)
🎯 TP3: 1.335 (+5.1%) — wait for additional profit
🛡 SL: 1.447 (-2.8%)
⚖️ R/R 1:1.0-1.8
⚡️ Leverage: 5x-10x (isolated)
🧠 Price below EMA200/EMA50 and VWAP, RSI 34, MACD hist negative, ADX 24 with rising sell volume
⚠️ Max 5% position · Max 10% stop-loss risk
Not financial advice — personal analysis only.
#ATOMUSDT #short #futures
🔖 #79 · 18.08.26 00:02
🔴 SHORT 🐻 | $ATOM 💰 | ⏱ Candle: 4H · ⚡️ FUTURES
❗️ Duration: up to 5 days
📊 Entry: 1.407 (Enter NOW)
🎯 TP1: 1.367 (+2.8%)
🎯 TP2: 1.350 (+4.1%)
🎯 TP3: 1.335 (+5.1%) — wait for additional profit
🛡 SL: 1.447 (-2.8%)
⚖️ R/R 1:1.0-1.8
⚡️ Leverage: 5x-10x (isolated)
🧠 Price below EMA200/EMA50 and VWAP, RSI 34, MACD hist negative, ADX 24 with rising sell volume
⚠️ Max 5% position · Max 10% stop-loss risk
Not financial advice — personal analysis only.
#ATOMUSDT #short #futures
🔴 SHORT 🐻 | $ATOM 💰 | ⏱ Candle: 4H · ⚡️ FUTURES
❗️ Duration: up to 5 days
📊 Entry: 1.407 (Enter NOW)
🎯 TP1: 1.367 (+2.8%)
🎯 TP2: 1.350 (+4.1%)
🎯 TP3: 1.335 (+5.1%) — wait for additional profit
🛡 SL: 1.447 (-2.8%)
⚖️ R/R 1:1.0-1.8
⚡️ Leverage: 5x-10x (isolated)
🧠 Price below EMA200/EMA50 and VWAP, RSI 34, MACD hist negative, ADX 24 with rising sell volume
⚠️ Max 5% position · Max 10% stop-loss risk
Not financial advice — personal analysis only.
#ATOMUSDT #short #futures
1
51

·
--
We're tracking the latest trends in the crypto space, and our community is excited about the recent developments. According to CoinGecko, Pudgy Penguins (PENGU) and Venice Token (VVV) are gaining attention, with market cap ranks #96 and #79 respectively.
We're seeing notable market cap ranks from Hyperliquid (HYPE) at #11 and NEAR Protocol (NEAR) at #35 🚀.
We're concluding that the crypto market is dynamic, with tokens like Zcash (ZEC) and Railgun (RAIL) also making waves, and our community is ready to adapt to these changes 💡, with a keen eye on Anoma (XAN) 📊, and we're looking forward to seeing what's next 🔜.
$NIL, $DEXE, $PLAY
We're tracking the latest trends in the crypto space, and our community is excited about the recent developments. According to CoinGecko, Pudgy Penguins (PENGU) and Venice Token (VVV) are gaining attention, with market cap ranks #96 and #79 respectively.
We're seeing notable market cap ranks from Hyperliquid (HYPE) at #11 and NEAR Protocol (NEAR) at #35 🚀.
We're concluding that the crypto market is dynamic, with tokens like Zcash (ZEC) and Railgun (RAIL) also making waves, and our community is ready to adapt to these changes 💡, with a keen eye on Anoma (XAN) 📊, and we're looking forward to seeing what's next 🔜.
$NIL , $DEXE , $PLAY
We're seeing notable market cap ranks from Hyperliquid (HYPE) at #11 and NEAR Protocol (NEAR) at #35 🚀.
We're concluding that the crypto market is dynamic, with tokens like Zcash (ZEC) and Railgun (RAIL) also making waves, and our community is ready to adapt to these changes 💡, with a keen eye on Anoma (XAN) 📊, and we're looking forward to seeing what's next 🔜.
$NIL , $DEXE , $PLAY
1
192

·
--
$RNDR Today I’ll make a quick fundamental note—no signal/call-outs.
Render’s current pricing looks more like the market is reassessing the strength of its narrative, rather than simply looking at candlestick colors.
Current price: $7.0300
Market cap: $790.7M
Rank: #79
FDV: $0.0000
7D / 30D: +2.8% / -9.8%
What I care about most is the supply structure:
Circulating supply is about 97.2%, so any future unlocks/supply pressure must be factored into the valuation.
Daily trend: Neutral/Consolidating ↔️
RSI: 51.2
Support: $5.6500
Resistance: $7.7300
My take: If $RNDR reclaims the resistance, the market will start assigning it a narrative premium; if it breaks below support, that would suggest the capital still isn’t willing to buy this story. NFA.
Do you think $RNDR is undervalued, or just another rebound trap?
$RNDR Today I’ll make a quick fundamental note—no signal/call-outs.
Render’s current pricing looks more like the market is reassessing the strength of its narrative, rather than simply looking at candlestick colors.
Current price: $7.0300
Market cap: $790.7M
Rank: #79
FDV: $0.0000
7D / 30D: +2.8% / -9.8%
What I care about most is the supply structure:
Circulating supply is about 97.2%, so any future unlocks/supply pressure must be factored into the valuation.
Daily trend: Neutral/Consolidating ↔️
RSI: 51.2
Support: $5.6500
Resistance: $7.7300
My take: If $RNDR reclaims the resistance, the market will start assigning it a narrative premium; if it breaks below support, that would suggest the capital still isn’t willing to buy this story. NFA.
Do you think $RNDR is undervalued, or just another rebound trap?
Render’s current pricing looks more like the market is reassessing the strength of its narrative, rather than simply looking at candlestick colors.
Current price: $7.0300
Market cap: $790.7M
Rank: #79
FDV: $0.0000
7D / 30D: +2.8% / -9.8%
What I care about most is the supply structure:
Circulating supply is about 97.2%, so any future unlocks/supply pressure must be factored into the valuation.
Daily trend: Neutral/Consolidating ↔️
RSI: 51.2
Support: $5.6500
Resistance: $7.7300
My take: If $RNDR reclaims the resistance, the market will start assigning it a narrative premium; if it breaks below support, that would suggest the capital still isn’t willing to buy this story. NFA.
Do you think $RNDR is undervalued, or just another rebound trap?
77
·
--
I've been tracking the latest trends on CoinGecko, and I'm excited to share my findings with you. The crypto market is always buzzing with new and interesting tokens, and I've got my eye on a few that are currently trending. According to CoinGecko, some of the top trending tokens include buy and retire (530A), Shiba Inu (SHIB), and Pons (PONS).
I'm seeing some significant market cap rankings, with Shiba Inu (SHIB) at #29, Pudgy Penguins (PENGU) at #111, and Pump.fun (PUMP) at #79. Solana (SOL) is also trending, with a market cap rank of #7, while Hyperliquid (HYPE) is at #10. These rankings can give us insight into which tokens are currently gaining traction. I've noticed that some of these tokens have seen significant % changes in their market cap, with some increasing by as much as 10% 🚀.
I'm looking forward to seeing how these trending tokens will perform in the coming days. As always, it's essential to do your own research before investing in any token 📊. With the crypto market constantly evolving, it's crucial to stay up-to-date with the latest trends and developments 💡. I'm excited to see what the future holds for these tokens 📈.
$ESP, $DIA, $ESP
I've been tracking the latest trends on CoinGecko, and I'm excited to share my findings with you. The crypto market is always buzzing with new and interesting tokens, and I've got my eye on a few that are currently trending. According to CoinGecko, some of the top trending tokens include buy and retire (530A), Shiba Inu (SHIB), and Pons (PONS).
I'm seeing some significant market cap rankings, with Shiba Inu (SHIB) at #29, Pudgy Penguins (PENGU) at #111, and Pump.fun (PUMP) at #79. Solana (SOL) is also trending, with a market cap rank of #7, while Hyperliquid (HYPE) is at #10. These rankings can give us insight into which tokens are currently gaining traction. I've noticed that some of these tokens have seen significant % changes in their market cap, with some increasing by as much as 10% 🚀.
I'm looking forward to seeing how these trending tokens will perform in the coming days. As always, it's essential to do your own research before investing in any token 📊. With the crypto market constantly evolving, it's crucial to stay up-to-date with the latest trends and developments 💡. I'm excited to see what the future holds for these tokens 📈.
$ESP , $DIA , $ESP
I'm seeing some significant market cap rankings, with Shiba Inu (SHIB) at #29, Pudgy Penguins (PENGU) at #111, and Pump.fun (PUMP) at #79. Solana (SOL) is also trending, with a market cap rank of #7, while Hyperliquid (HYPE) is at #10. These rankings can give us insight into which tokens are currently gaining traction. I've noticed that some of these tokens have seen significant % changes in their market cap, with some increasing by as much as 10% 🚀.
I'm looking forward to seeing how these trending tokens will perform in the coming days. As always, it's essential to do your own research before investing in any token 📊. With the crypto market constantly evolving, it's crucial to stay up-to-date with the latest trends and developments 💡. I'm excited to see what the future holds for these tokens 📈.
$ESP , $DIA , $ESP
111
Log in to explore more content
Join global crypto users on Binance Square
⚡️ Get latest and useful information about crypto.
💬 Trusted by the world’s largest crypto exchange.
👍 Discover real insights from verified creators.
Email / Phone number
Trending Topics
1
#BinanceReopensWithdrawalsForHYPE&APT
12,835 views
312 Discussing
2
#SouthKoreaDraftLawTargets15To20%ShareholderCap
18,473 views
228 Discussing
3
#TradFiForBeginners
126,359 views
1,341 Discussing
4
#KeplrAdvisesSocialLoginUsersToTransferAssets
16,659 views
286 Discussing
5
#TetherPlans€28.8MForJuventusCapitalIncrease
9,722 views
223 Discussing
6
#JobsReportRaisesHikeOdds
726,435 views
4,175 Discussing
7
#CPITestsDecemberRateOutlook
270,134 views
1,699 Discussing
8
#US Data Center Rules May Constrain AI Expansion
106,768 views
255 Discussing
9
#ARKPlans14ThematicETFsCoveringAIAndTokenizedMarkets
7,193 views
86 Discussing
10
#WillAnthropicListOnTime
235,921 views
1,794 Discussing