
#33
33
26,031 views
67 Discussing
Hot
Latest

·
--
Bullish
@MANTRA_Chain $MANTRA
@katievorhan
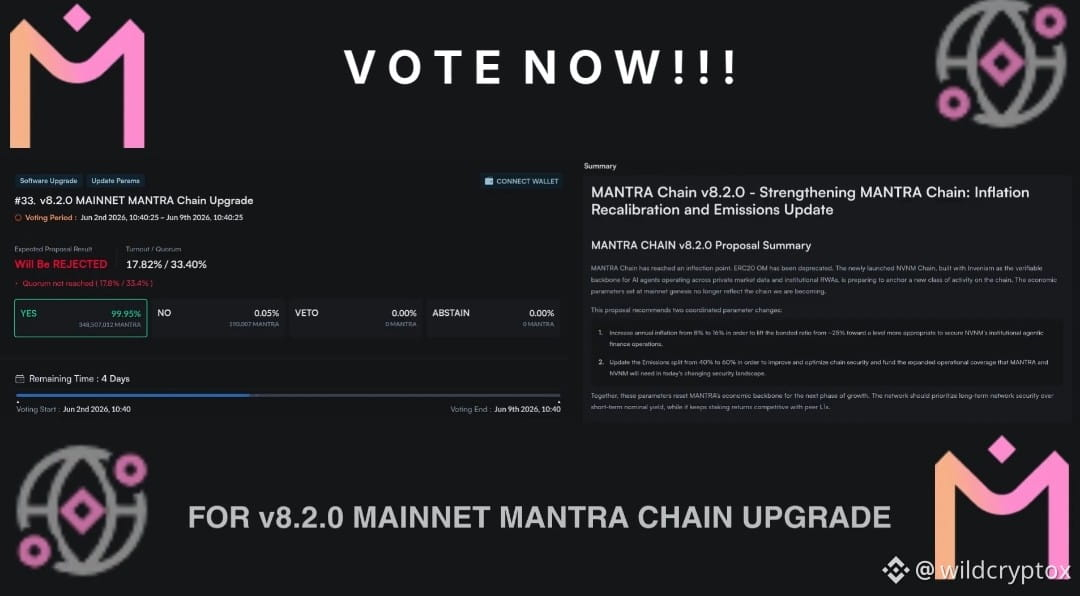
🚨 Kind Reminder: VOTE on the latest
@MANTRA_Chain 's Governance
Proposal #33 ‼️ >1 DAY LEFT ‼️
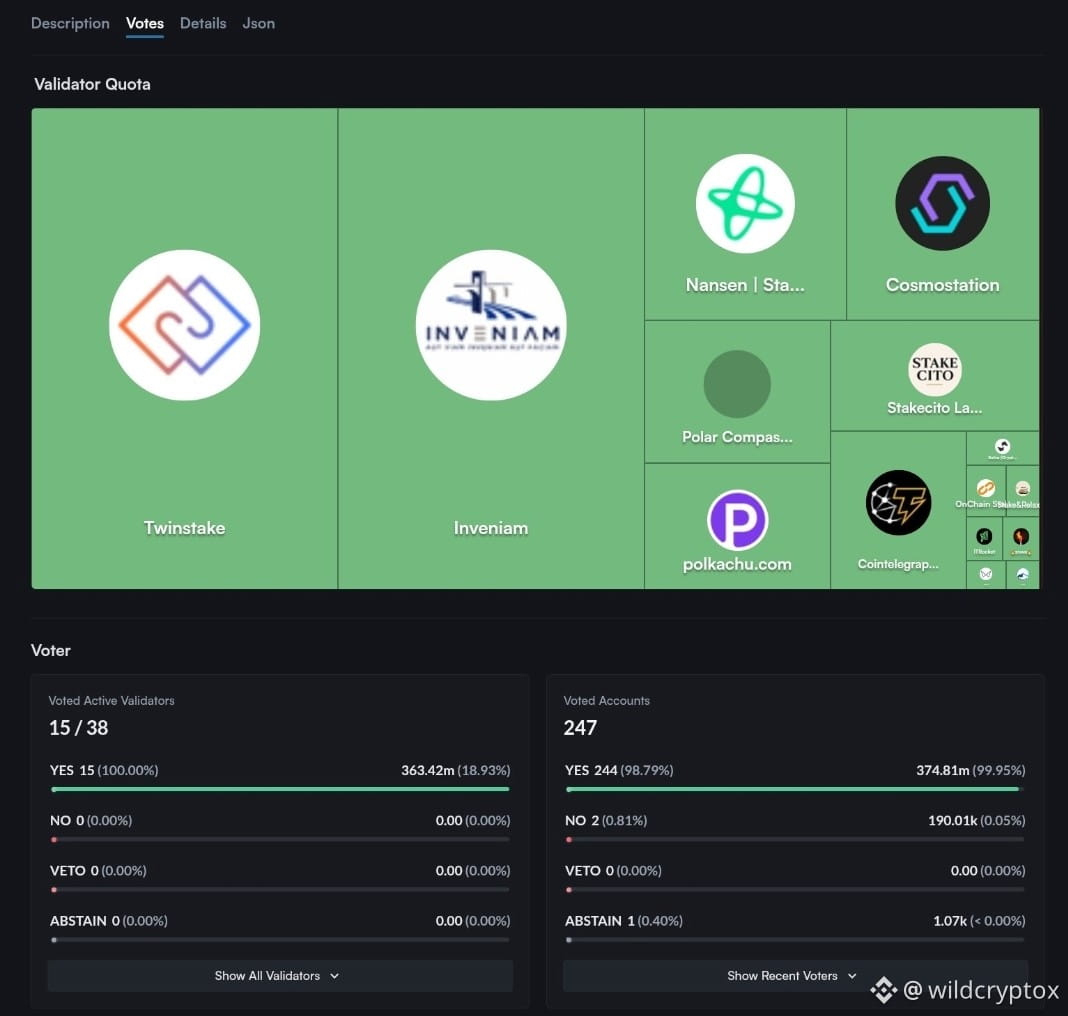
Current Stats 👇
🔹 15 out of 38 Active Validators voted "YES"
🔹 244 Individual Accounts Voted "YES"
🗳️ How to Vote on the @MANTRA_Chain 's Governance Proposal #33 in 5 Simple Steps 👇
1. Visit http://mintscan.io/mantra/proposals/33 or http://explorer.mantrachain.io/MANTRA/gov/33
2. Connect your @keplrwallet
& Select Active Proposal #33
3. Review Proposal Details
4. Click Vote and Select ''YES''
5. Sign the Approval Transaction with your connected wallet
Congratulations, you've successfully cast your vote.
$MANTRA 🕉 #DEFi #RWAs
@MANTRA $MANTRA
@Katie V Holmes
🚨 Kind Reminder: VOTE on the latest
@MANTRA 's Governance
Proposal #33 ‼️ >1 DAY LEFT ‼️
Current Stats 👇
🔹 15 out of 38 Active Validators voted "YES"
🔹 244 Individual Accounts Voted "YES"
🗳️ How to Vote on the @MANTRA 's Governance Proposal #33 in 5 Simple Steps 👇
1. Visit http://mintscan.io/mantra/proposals/33 or http://explorer.mantrachain.io/MANTRA/gov/33
2. Connect your @keplrwallet
& Select Active Proposal #33
3. Review Proposal Details
4. Click Vote and Select ''YES''
5. Sign the Approval Transaction with your connected wallet
Congratulations, you've successfully cast your vote.
$MANTRA 🕉 #DEFi #RWAs
@Katie V Holmes
🚨 Kind Reminder: VOTE on the latest
@MANTRA 's Governance
Proposal #33 ‼️ >1 DAY LEFT ‼️
Current Stats 👇
🔹 15 out of 38 Active Validators voted "YES"
🔹 244 Individual Accounts Voted "YES"
🗳️ How to Vote on the @MANTRA 's Governance Proposal #33 in 5 Simple Steps 👇
1. Visit http://mintscan.io/mantra/proposals/33 or http://explorer.mantrachain.io/MANTRA/gov/33
2. Connect your @keplrwallet
& Select Active Proposal #33
3. Review Proposal Details
4. Click Vote and Select ''YES''
5. Sign the Approval Transaction with your connected wallet
Congratulations, you've successfully cast your vote.
$MANTRA 🕉 #DEFi #RWAs
3
1
279

·
--
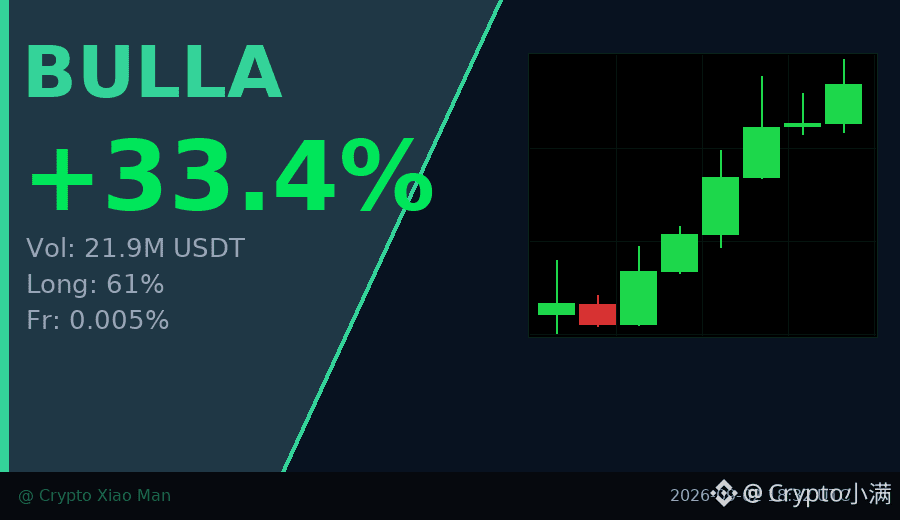
33% single-day rise, trading volume hits 21.90 million USDT — BULLA is acting a bit interesting today.
On the hourly chart, candles have been closing green in a row. The price has been pushed up from 0.017 to 0.0234, and the buy-side pressure is clearly accelerating.
However, the bulls already account for 61%, and the positions aren’t light. People chasing the price are starting to increase.
The funding rate is still only 0.005%, which suggests leverage hasn’t gone crazy yet—this is relatively healthy.
For a stock with a rise in both volume and price, the key is whether it can hold the 0.022 level next.
If it holds, the trend remains intact. If it doesn’t, short-term profit-takers may start to exit.
$BULLA #强势币 #33%涨幅
Click the small card below to quickly check the market 👇
33% single-day rise, trading volume hits 21.90 million USDT — BULLA is acting a bit interesting today.
On the hourly chart, candles have been closing green in a row. The price has been pushed up from 0.017 to 0.0234, and the buy-side pressure is clearly accelerating.
However, the bulls already account for 61%, and the positions aren’t light. People chasing the price are starting to increase.
The funding rate is still only 0.005%, which suggests leverage hasn’t gone crazy yet—this is relatively healthy.
For a stock with a rise in both volume and price, the key is whether it can hold the 0.022 level next.
If it holds, the trend remains intact. If it doesn’t, short-term profit-takers may start to exit.
$BULLA #强势币 #33%涨幅
Click the small card below to quickly check the market 👇
On the hourly chart, candles have been closing green in a row. The price has been pushed up from 0.017 to 0.0234, and the buy-side pressure is clearly accelerating.
However, the bulls already account for 61%, and the positions aren’t light. People chasing the price are starting to increase.
The funding rate is still only 0.005%, which suggests leverage hasn’t gone crazy yet—this is relatively healthy.
For a stock with a rise in both volume and price, the key is whether it can hold the 0.022 level next.
If it holds, the trend remains intact. If it doesn’t, short-term profit-takers may start to exit.
$BULLA #强势币 #33%涨幅
Click the small card below to quickly check the market 👇
77

See translation
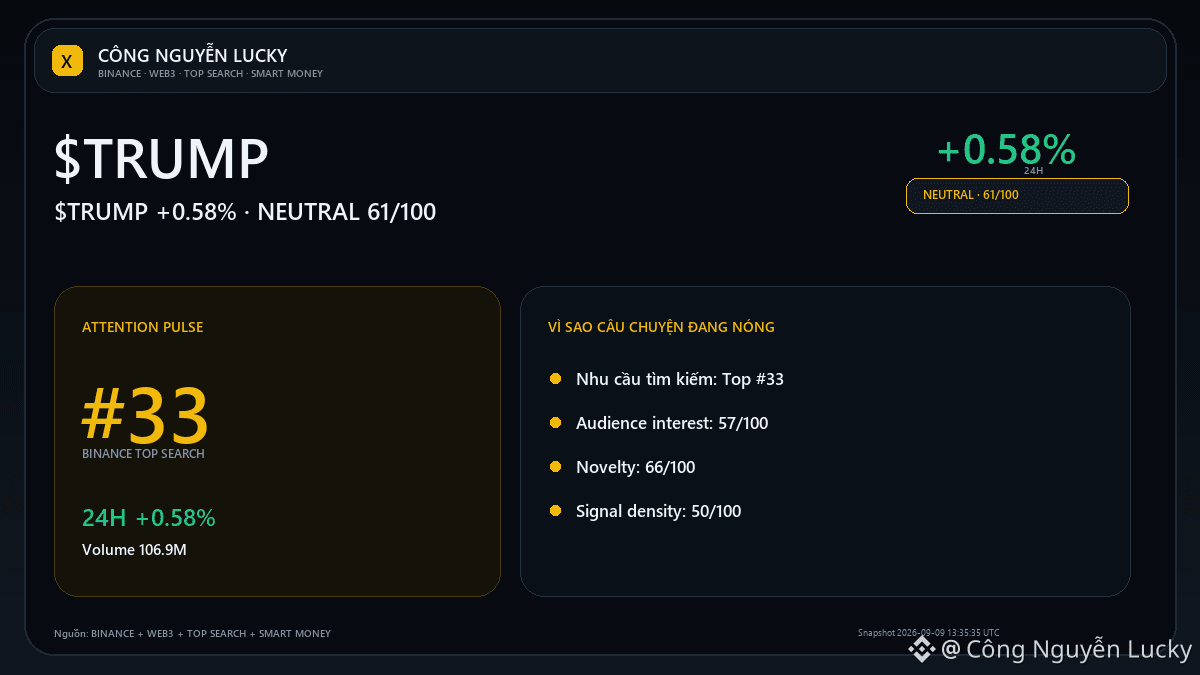
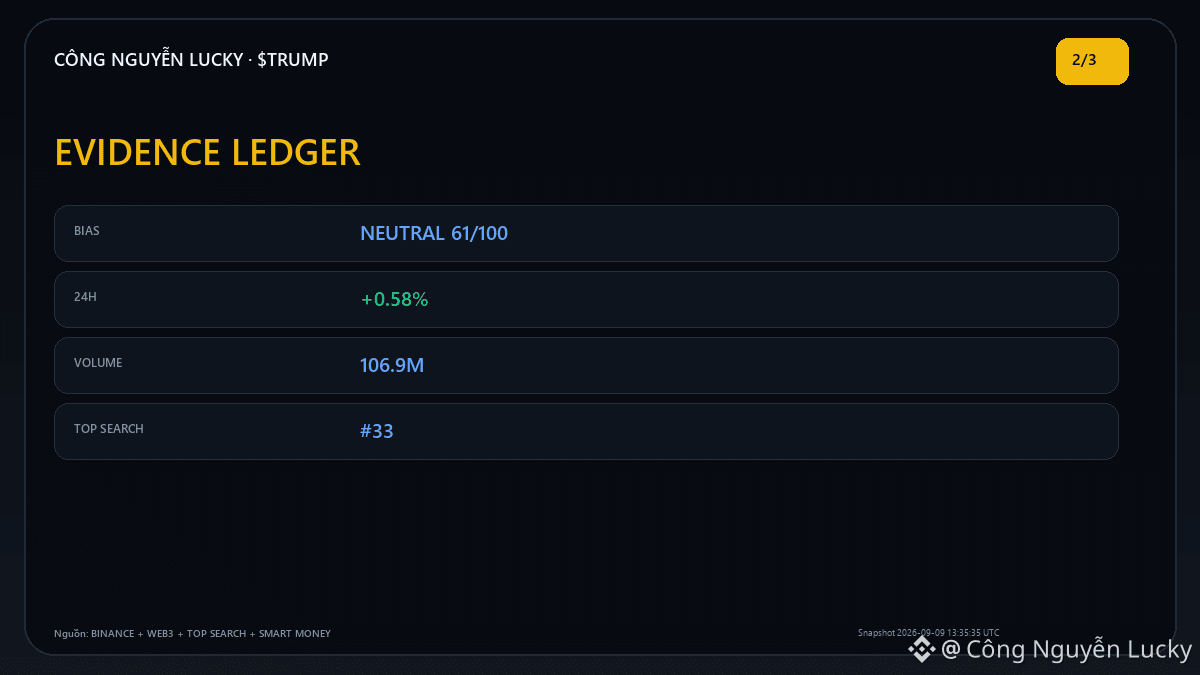
🗣️ $TRUMP đang có mức thảo luận xã hội bất thường trên Binance Web3. Tâm lý hiện: Positive.
Thị trường: 2.239 · 24h +0.58% · khối lượng ~106.9M USDT · 372,293 giao dịch.
Bối cảnh xã hội: Hunter Biden's Memecoin Launch, $LAPTOP Airdrop for $TRUMP Investors, Potential $LAPTOP Burn.
Sự chú ý xã hội có thể dẫn giá, nhưng cũng có thể là đám đông vào muộn.
Xác nhận: Vượt 2.282 với khối lượng mở rộng sẽ làm kịch bản tiếp diễn đáng tin hơn.
Phủ nhận: Không giữ được vùng cao và rơi lại dưới trung điểm 2.2335 sẽ làm kịch bản hạ nhiệt rõ hơn.
📌 Góc nhìn LONG/SHORT: **NEUTRAL · CHƯA RÕ · 61/100**.
Cơ sở chính: Smart Money ghi nhận dòng tiền ra.
Xác nhận thêm khi: chờ giá, volume và dòng tiền cùng chọn một hướng trước khi nâng độ tin cậy.
Hạ/hủy định hướng nếu: không ép LONG/SHORT khi các lớp dữ liệu còn mâu thuẫn.
💬 Nếu chỉ được chọn một dữ liệu để theo dõi $TRUMP trong vài giờ tới, anh/chị chọn gì?
🔎 **Evidence check — NEUTRAL 61/100**
• Giá 2.239; 24h +0.58%; volume 106.9M.
• Binance Top Search #33.
🧭 **Mốc cần theo dõi:** xác nhận: chờ giá, volume và dòng tiền cùng chọn một hướng trước khi nâng độ tin cậy · vô hiệu: không ép LONG/SHORT khi các lớp dữ liệu còn mâu thuẫn
Nguồn đối chiếu: Binance Futures Market + Binance Web3 Trending + Binance Top Search + Binance Social Hype + Binance Smart Money Inflow · snapshot 2026-09-09 13:35:35 UTC
⚠️ Phân tích thị trường mang tính tham khảo, không phải cam kết lợi nhuận. Mỗi người tự nghiên cứu (DYOR), tự quản trị rủi ro và tự chịu trách nhiệm với quyết định giao dịch.
$TRUMP
🗣️ $TRUMP đang có mức thảo luận xã hội bất thường trên Binance Web3. Tâm lý hiện: Positive.
Thị trường: 2.239 · 24h +0.58% · khối lượng ~106.9M USDT · 372,293 giao dịch.
Bối cảnh xã hội: Hunter Biden's Memecoin Launch, $LAPTOP Airdrop for $TRUMP Investors, Potential $LAPTOP Burn.
Sự chú ý xã hội có thể dẫn giá, nhưng cũng có thể là đám đông vào muộn.
Xác nhận: Vượt 2.282 với khối lượng mở rộng sẽ làm kịch bản tiếp diễn đáng tin hơn.
Phủ nhận: Không giữ được vùng cao và rơi lại dưới trung điểm 2.2335 sẽ làm kịch bản hạ nhiệt rõ hơn.
📌 Góc nhìn LONG/SHORT: **NEUTRAL · CHƯA RÕ · 61/100**.
Cơ sở chính: Smart Money ghi nhận dòng tiền ra.
Xác nhận thêm khi: chờ giá, volume và dòng tiền cùng chọn một hướng trước khi nâng độ tin cậy.
Hạ/hủy định hướng nếu: không ép LONG/SHORT khi các lớp dữ liệu còn mâu thuẫn.
💬 Nếu chỉ được chọn một dữ liệu để theo dõi $TRUMP trong vài giờ tới, anh/chị chọn gì?
🔎 **Evidence check — NEUTRAL 61/100**
• Giá 2.239; 24h +0.58%; volume 106.9M.
• Binance Top Search #33.
🧭 **Mốc cần theo dõi:** xác nhận: chờ giá, volume và dòng tiền cùng chọn một hướng trước khi nâng độ tin cậy · vô hiệu: không ép LONG/SHORT khi các lớp dữ liệu còn mâu thuẫn
Nguồn đối chiếu: Binance Futures Market + Binance Web3 Trending + Binance Top Search + Binance Social Hype + Binance Smart Money Inflow · snapshot 2026-09-09 13:35:35 UTC
⚠️ Phân tích thị trường mang tính tham khảo, không phải cam kết lợi nhuận. Mỗi người tự nghiên cứu (DYOR), tự quản trị rủi ro và tự chịu trách nhiệm với quyết định giao dịch.
$TRUMP
Thị trường: 2.239 · 24h +0.58% · khối lượng ~106.9M USDT · 372,293 giao dịch.
Bối cảnh xã hội: Hunter Biden's Memecoin Launch, $LAPTOP Airdrop for $TRUMP Investors, Potential $LAPTOP Burn.
Sự chú ý xã hội có thể dẫn giá, nhưng cũng có thể là đám đông vào muộn.
Xác nhận: Vượt 2.282 với khối lượng mở rộng sẽ làm kịch bản tiếp diễn đáng tin hơn.
Phủ nhận: Không giữ được vùng cao và rơi lại dưới trung điểm 2.2335 sẽ làm kịch bản hạ nhiệt rõ hơn.
📌 Góc nhìn LONG/SHORT: **NEUTRAL · CHƯA RÕ · 61/100**.
Cơ sở chính: Smart Money ghi nhận dòng tiền ra.
Xác nhận thêm khi: chờ giá, volume và dòng tiền cùng chọn một hướng trước khi nâng độ tin cậy.
Hạ/hủy định hướng nếu: không ép LONG/SHORT khi các lớp dữ liệu còn mâu thuẫn.
💬 Nếu chỉ được chọn một dữ liệu để theo dõi $TRUMP trong vài giờ tới, anh/chị chọn gì?
🔎 **Evidence check — NEUTRAL 61/100**
• Giá 2.239; 24h +0.58%; volume 106.9M.
• Binance Top Search #33.
🧭 **Mốc cần theo dõi:** xác nhận: chờ giá, volume và dòng tiền cùng chọn một hướng trước khi nâng độ tin cậy · vô hiệu: không ép LONG/SHORT khi các lớp dữ liệu còn mâu thuẫn
Nguồn đối chiếu: Binance Futures Market + Binance Web3 Trending + Binance Top Search + Binance Social Hype + Binance Smart Money Inflow · snapshot 2026-09-09 13:35:35 UTC
⚠️ Phân tích thị trường mang tính tham khảo, không phải cam kết lợi nhuận. Mỗi người tự nghiên cứu (DYOR), tự quản trị rủi ro và tự chịu trách nhiệm với quyết định giao dịch.
$TRUMP

143

·
--
$MARSCOIN 15 minutes it pulled more than 5, and the volume and energy were directly put to 1.78 times the usual level. At the close, it cleanly pierced the upper edge of the box formed by nearly 20 five-minute K-lines. Even more worth noting is that this time isn’t the old long-players dumping and distributing—price is rising, and OI is rising in sync. The 15M contract’s notional nominal increase is 265K, **which is a classic case of newly added leveraged long positions entering the factory with real money**. The aggressive buy pressure drove the spread up to 6.9%, and the buying is indeed even more ferocious.
That said, the short-term heat is there, but don’t get too carried away. Although the pool’s overall nominal change ranks at #33, the OI abnormal percentile is only 41.9%, indicating that the leveraged funds are still in the early stage of just starting up—not yet in a truly crowded, completely crazy phase. Right now this position falls under an “emotional release in the early breakout” phase. Whether it can evolve into a trend still depends on whether the subsequent volume can keep being absorbed; don’t let it surge up and then get pressed back by the spot market’s hands. I personally plan to watch first with a small position.
$MARSCOIN 15 minutes it pulled more than 5, and the volume and energy were directly put to 1.78 times the usual level. At the close, it cleanly pierced the upper edge of the box formed by nearly 20 five-minute K-lines. Even more worth noting is that this time isn’t the old long-players dumping and distributing—price is rising, and OI is rising in sync. The 15M contract’s notional nominal increase is 265K, **which is a classic case of newly added leveraged long positions entering the factory with real money**. The aggressive buy pressure drove the spread up to 6.9%, and the buying is indeed even more ferocious.
That said, the short-term heat is there, but don’t get too carried away. Although the pool’s overall nominal change ranks at #33, the OI abnormal percentile is only 41.9%, indicating that the leveraged funds are still in the early stage of just starting up—not yet in a truly crowded, completely crazy phase. Right now this position falls under an “emotional release in the early breakout” phase. Whether it can evolve into a trend still depends on whether the subsequent volume can keep being absorbed; don’t let it surge up and then get pressed back by the spot market’s hands. I personally plan to watch first with a small position.
That said, the short-term heat is there, but don’t get too carried away. Although the pool’s overall nominal change ranks at #33, the OI abnormal percentile is only 41.9%, indicating that the leveraged funds are still in the early stage of just starting up—not yet in a truly crowded, completely crazy phase. Right now this position falls under an “emotional release in the early breakout” phase. Whether it can evolve into a trend still depends on whether the subsequent volume can keep being absorbed; don’t let it surge up and then get pressed back by the spot market’s hands. I personally plan to watch first with a small position.
31
·
--
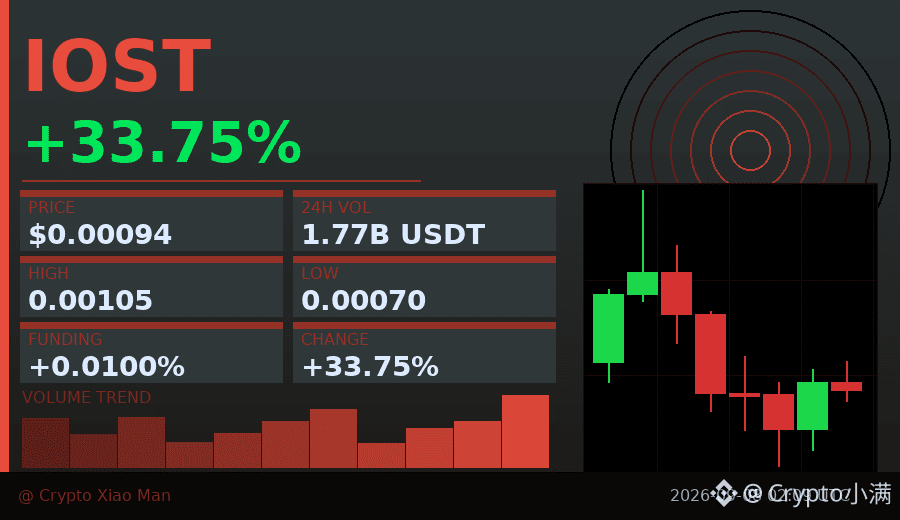
Behind the 33% surge, the funds are quietly withdrawing.
IOST did something a bit interesting in those 8 hours: the price moved from 0.00069 up to 0.00104, then fell back to 0.000936. The trading volume of 177 million USDT isn’t small, but judging by the candlestick chart trend, the overall move is weaker within those 8 hours.
More importantly, the long-to-short ratio is 53% versus 47%—the bulls only have a slight edge. The funding rate is 0.01% and is on the low side, which suggests there aren’t many people chasing the price; everyone is watching and waiting.
This kind of uptrend stall with increased volume plus sentiment polarization usually means that, in the short term, a direction will be chosen.
$IOST #资金分化 #33%
Click the small card below to quickly check the market👇
Behind the 33% surge, the funds are quietly withdrawing.
IOST did something a bit interesting in those 8 hours: the price moved from 0.00069 up to 0.00104, then fell back to 0.000936. The trading volume of 177 million USDT isn’t small, but judging by the candlestick chart trend, the overall move is weaker within those 8 hours.
More importantly, the long-to-short ratio is 53% versus 47%—the bulls only have a slight edge. The funding rate is 0.01% and is on the low side, which suggests there aren’t many people chasing the price; everyone is watching and waiting.
This kind of uptrend stall with increased volume plus sentiment polarization usually means that, in the short term, a direction will be chosen.
$IOST #资金分化 #33%
Click the small card below to quickly check the market👇
IOST did something a bit interesting in those 8 hours: the price moved from 0.00069 up to 0.00104, then fell back to 0.000936. The trading volume of 177 million USDT isn’t small, but judging by the candlestick chart trend, the overall move is weaker within those 8 hours.
More importantly, the long-to-short ratio is 53% versus 47%—the bulls only have a slight edge. The funding rate is 0.01% and is on the low side, which suggests there aren’t many people chasing the price; everyone is watching and waiting.
This kind of uptrend stall with increased volume plus sentiment polarization usually means that, in the short term, a direction will be chosen.
$IOST #资金分化 #33%
Click the small card below to quickly check the market👇
67
·
--
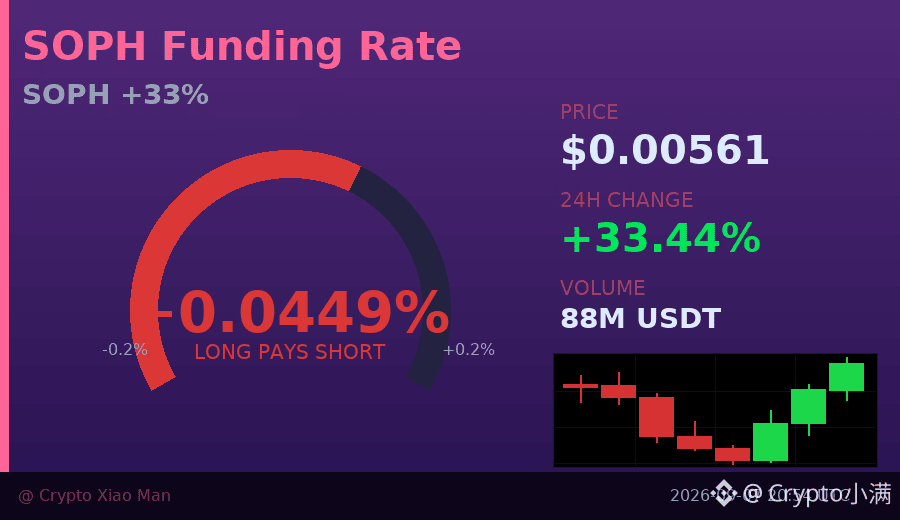
33% single-day gain, but what’s truly worth noting is that the funding rate has already risen to 0.045%.
Today, SOPH moved from 0.0041 to 0.0056, with trading volume of 87.9 million USDT. The hourly chart has been closing green consecutively—bulls are definitely gaining momentum.
That said, the long/short ratio of 56%/44% suggests positioning has started to skew. With this level of heat, chasing price up requires extra caution—if the funding rate keeps rising, the bulls’ cost basis will increase rapidly.
I prefer to wait until the funding rate pulls back to around 0.01%, or until the price retests the 0.0050 support level.
$SOPH #资金费率预警 #33%
Click the small card below to quickly view the market👇
33% single-day gain, but what’s truly worth noting is that the funding rate has already risen to 0.045%.
Today, SOPH moved from 0.0041 to 0.0056, with trading volume of 87.9 million USDT. The hourly chart has been closing green consecutively—bulls are definitely gaining momentum.
That said, the long/short ratio of 56%/44% suggests positioning has started to skew. With this level of heat, chasing price up requires extra caution—if the funding rate keeps rising, the bulls’ cost basis will increase rapidly.
I prefer to wait until the funding rate pulls back to around 0.01%, or until the price retests the 0.0050 support level.
$SOPH #资金费率预警 #33%
Click the small card below to quickly view the market👇
Today, SOPH moved from 0.0041 to 0.0056, with trading volume of 87.9 million USDT. The hourly chart has been closing green consecutively—bulls are definitely gaining momentum.
That said, the long/short ratio of 56%/44% suggests positioning has started to skew. With this level of heat, chasing price up requires extra caution—if the funding rate keeps rising, the bulls’ cost basis will increase rapidly.
I prefer to wait until the funding rate pulls back to around 0.01%, or until the price retests the 0.0050 support level.
$SOPH #资金费率预警 #33%
Click the small card below to quickly view the market👇
62
·
--
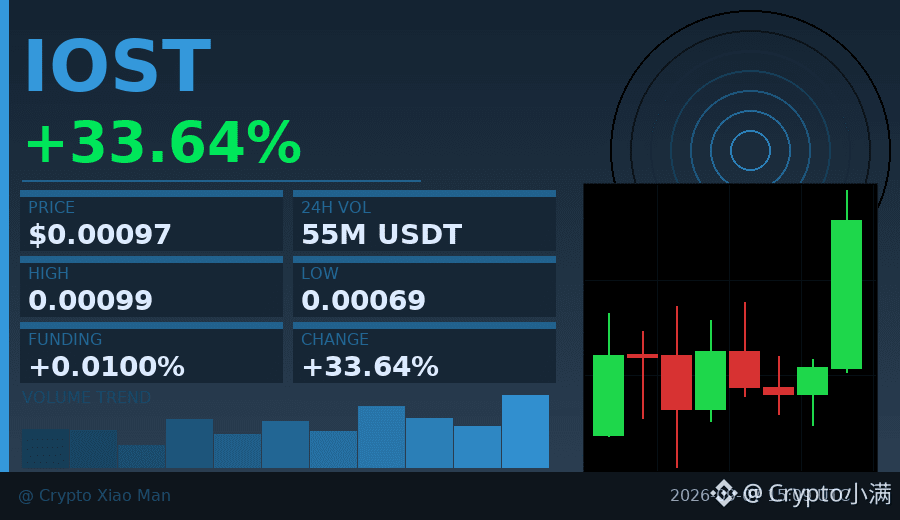
33% increase, but what’s truly noteworthy is that the funding rate is only 0.01%.
Today, IOST’s trading volume surged to 54.6 million U. The long/short ratio is 58% to 42%—longs are slightly dominant, but not to the point of overcrowding. The hourly chart has been closing in green continuously; the final candle also shows a clear volume expansion, indicating that capital is steadily flowing in rather than this being short-term speculation.
A combination of volume/price coordination + a low fee rate is often more worth tracking than simply pushing the price up.
$IOST #IOST #33.64%
Click the small card below to quickly view the market👇
33% increase, but what’s truly noteworthy is that the funding rate is only 0.01%.
Today, IOST’s trading volume surged to 54.6 million U. The long/short ratio is 58% to 42%—longs are slightly dominant, but not to the point of overcrowding. The hourly chart has been closing in green continuously; the final candle also shows a clear volume expansion, indicating that capital is steadily flowing in rather than this being short-term speculation.
A combination of volume/price coordination + a low fee rate is often more worth tracking than simply pushing the price up.
$IOST #IOST #33.64%
Click the small card below to quickly view the market👇
Today, IOST’s trading volume surged to 54.6 million U. The long/short ratio is 58% to 42%—longs are slightly dominant, but not to the point of overcrowding. The hourly chart has been closing in green continuously; the final candle also shows a clear volume expansion, indicating that capital is steadily flowing in rather than this being short-term speculation.
A combination of volume/price coordination + a low fee rate is often more worth tracking than simply pushing the price up.
$IOST #IOST #33.64%
Click the small card below to quickly view the market👇
26
·
--
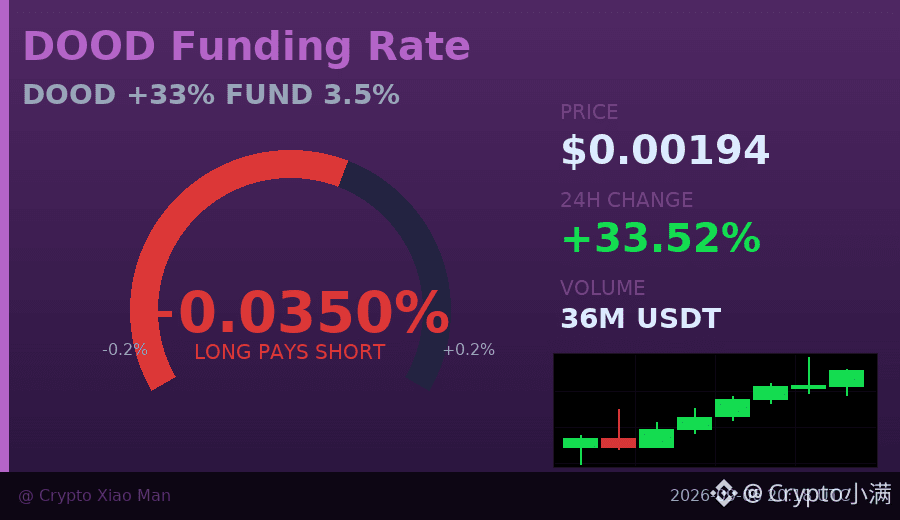
What does a funding rate surging to 3.5% mean? DOOD is up 33% today and making a lot of noise, but long positions are already crowded at 65%, and the hourly chart has printed three consecutive bullish candles.
At times like this, chasing the rally requires extra caution — with funding this high, the cost of holding long positions is rising quickly, and once momentum slows, the crowded longs may end up stampeding on each other.
Trading volume of 35.9 million USDT is not small, but the price has already pulled back a bit from the high of 0.002001. If strength continues, the funding rate will be pushed even higher; if a pullback comes, a 3.5% funding rate could make longs break first.
I’d lean toward waiting until the funding rate falls below 1% before taking a look, or waiting for the long/short ratio to return to around 55%. At the current level, the risk-reward ratio just isn’t attractive enough.
$DOOD #资金费率预警 #33%
Click the card below to quickly view the market👇
What does a funding rate surging to 3.5% mean? DOOD is up 33% today and making a lot of noise, but long positions are already crowded at 65%, and the hourly chart has printed three consecutive bullish candles.
At times like this, chasing the rally requires extra caution — with funding this high, the cost of holding long positions is rising quickly, and once momentum slows, the crowded longs may end up stampeding on each other.
Trading volume of 35.9 million USDT is not small, but the price has already pulled back a bit from the high of 0.002001. If strength continues, the funding rate will be pushed even higher; if a pullback comes, a 3.5% funding rate could make longs break first.
I’d lean toward waiting until the funding rate falls below 1% before taking a look, or waiting for the long/short ratio to return to around 55%. At the current level, the risk-reward ratio just isn’t attractive enough.
$DOOD #资金费率预警 #33%
Click the card below to quickly view the market👇
At times like this, chasing the rally requires extra caution — with funding this high, the cost of holding long positions is rising quickly, and once momentum slows, the crowded longs may end up stampeding on each other.
Trading volume of 35.9 million USDT is not small, but the price has already pulled back a bit from the high of 0.002001. If strength continues, the funding rate will be pushed even higher; if a pullback comes, a 3.5% funding rate could make longs break first.
I’d lean toward waiting until the funding rate falls below 1% before taking a look, or waiting for the long/short ratio to return to around 55%. At the current level, the risk-reward ratio just isn’t attractive enough.
$DOOD #资金费率预警 #33%
Click the card below to quickly view the market👇
72
·
--
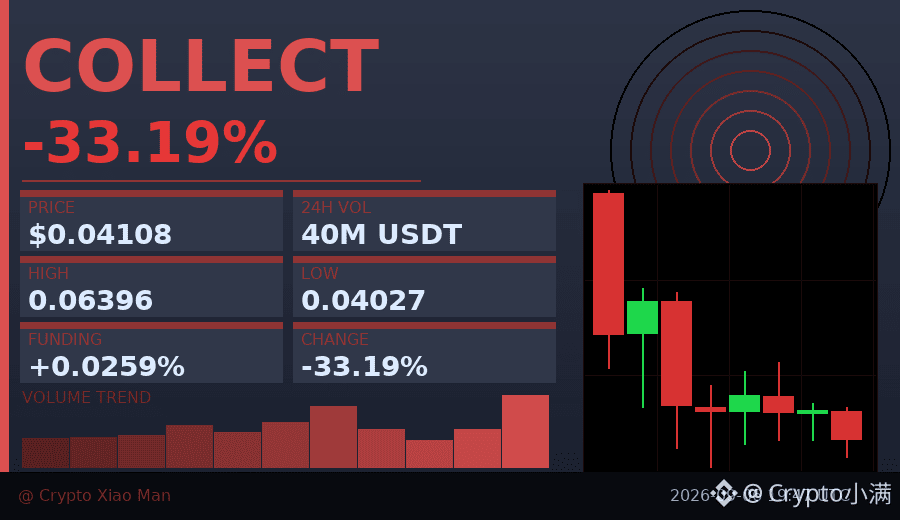
63% of people went long, and in the end it dropped 33% in 8 hours. This COLLECT move is a textbook crowded-trade squeeze.
The price was slammed from 0.064 straight down to 0.041, yet trading volume reached 39.6 million USDT. That means it wasn't that nobody was trading—it was a mass long-side stampede.
The funding rate is still positive at 0.02587%, but the candlestick has already formed a pattern of "overall weakness within 8 hours." At a time like this, continuing to hold longs is basically trying to catch a falling knife.
I've seen too many similar scripts: high position concentration + price breakdown = chain liquidations. Whether 0.041 can hold now depends on whether there will be capital willing to buy the dip in the next 2 hours.
$COLLECT #拥挤多头 #33% drop
Click the small card below to quickly view the market👇
63% of people went long, and in the end it dropped 33% in 8 hours. This COLLECT move is a textbook crowded-trade squeeze.
The price was slammed from 0.064 straight down to 0.041, yet trading volume reached 39.6 million USDT. That means it wasn't that nobody was trading—it was a mass long-side stampede.
The funding rate is still positive at 0.02587%, but the candlestick has already formed a pattern of "overall weakness within 8 hours." At a time like this, continuing to hold longs is basically trying to catch a falling knife.
I've seen too many similar scripts: high position concentration + price breakdown = chain liquidations. Whether 0.041 can hold now depends on whether there will be capital willing to buy the dip in the next 2 hours.
$COLLECT #拥挤多头 #33% drop
Click the small card below to quickly view the market👇
The price was slammed from 0.064 straight down to 0.041, yet trading volume reached 39.6 million USDT. That means it wasn't that nobody was trading—it was a mass long-side stampede.
The funding rate is still positive at 0.02587%, but the candlestick has already formed a pattern of "overall weakness within 8 hours." At a time like this, continuing to hold longs is basically trying to catch a falling knife.
I've seen too many similar scripts: high position concentration + price breakdown = chain liquidations. Whether 0.041 can hold now depends on whether there will be capital willing to buy the dip in the next 2 hours.
$COLLECT #拥挤多头 #33% drop
Click the small card below to quickly view the market👇
8

·
--
Do you also like numerology?
if so help me reach 30K
Hahaha
there will be a generous gift for you. #33
#teamleal33
Do you also like numerology?
if so help me reach 30K
Hahaha
there will be a generous gift for you. #33
#teamleal33
if so help me reach 30K
Hahaha
there will be a generous gift for you. #33
#teamleal33

Kandra Niese A7R3:
33
3.9k
30
258
3.9k

·
--
Bearish
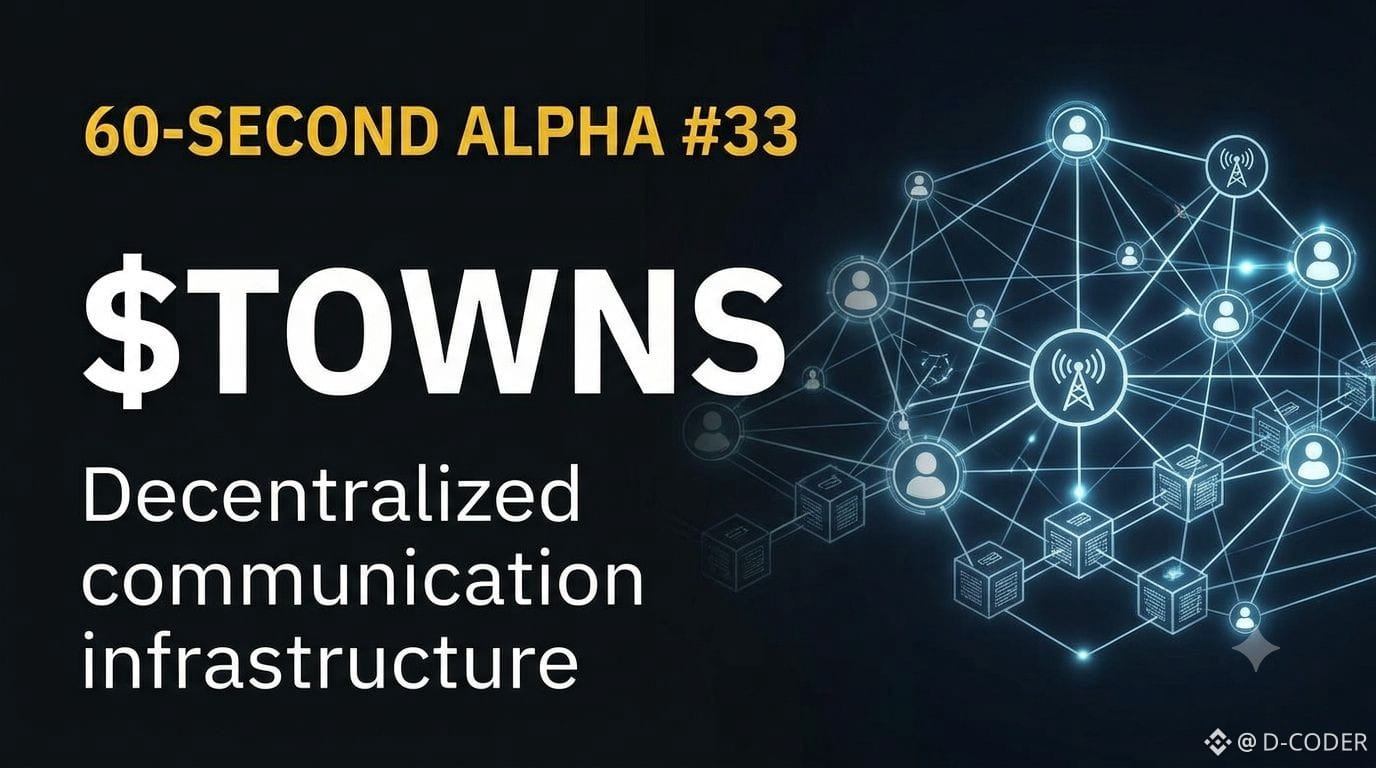
60-SECOND ALPHA #33 | $TOWNS
$TOWNS is trading around $0.0025, and there’s an interesting lesson behind the project. Towns is designed as decentralized communication infrastructure, with programmable communities called Spaces and on-chain membership and ownership features.
That makes TOWNS a useful example of how crypto can move beyond payments and trading into digital communication and community infrastructure.
Alpha: The strongest crypto narratives often start with a simple question: what real problem is the network trying to solve?
{future}(TOWNSUSDT)
60-SECOND ALPHA #33 | $TOWNS
$TOWNS is trading around $0.0025, and there’s an interesting lesson behind the project. Towns is designed as decentralized communication infrastructure, with programmable communities called Spaces and on-chain membership and ownership features.
That makes TOWNS a useful example of how crypto can move beyond payments and trading into digital communication and community infrastructure.
Alpha: The strongest crypto narratives often start with a simple question: what real problem is the network trying to solve?
$TOWNS is trading around $0.0025, and there’s an interesting lesson behind the project. Towns is designed as decentralized communication infrastructure, with programmable communities called Spaces and on-chain membership and ownership features.
That makes TOWNS a useful example of how crypto can move beyond payments and trading into digital communication and community infrastructure.
Alpha: The strongest crypto narratives often start with a simple question: what real problem is the network trying to solve?
193

Verified
the CFTC just moved to dismiss a CME lawsuit that was blocking crypto perpetual futures in the US.
$SUI is one of the coins that stands to benefit most if perps open up on regulated US venues. it is a layer 1 built by ex-Meta engineers, gaining ground in smart contracts and DeFi.
rank #33, $3.09B market cap, 4.1B of 10B max supply circulating, up 9.6% over the last 30 days. ATH around $5.35, roughly 7x from recent prices.
if regulated perps come to the US, which L1s do you think get listed first?
the CFTC just moved to dismiss a CME lawsuit that was blocking crypto perpetual futures in the US.
$SUI is one of the coins that stands to benefit most if perps open up on regulated US venues. it is a layer 1 built by ex-Meta engineers, gaining ground in smart contracts and DeFi.
rank #33, $3.09B market cap, 4.1B of 10B max supply circulating, up 9.6% over the last 30 days. ATH around $5.35, roughly 7x from recent prices.
if regulated perps come to the US, which L1s do you think get listed first?
$SUI is one of the coins that stands to benefit most if perps open up on regulated US venues. it is a layer 1 built by ex-Meta engineers, gaining ground in smart contracts and DeFi.
rank #33, $3.09B market cap, 4.1B of 10B max supply circulating, up 9.6% over the last 30 days. ATH around $5.35, roughly 7x from recent prices.
if regulated perps come to the US, which L1s do you think get listed first?
Louis Ssekiwala:
I just buy now
2
26
33.3k
·
--
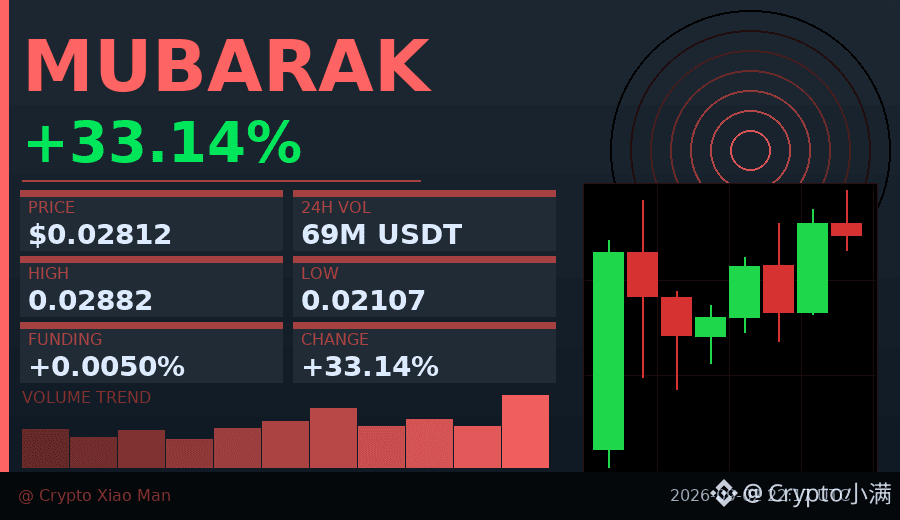
33% price increase, but there are actually more short sellers—this divergence is kind of interesting.
Today, MUBARAK is up 33.14%, spiking to $0.02882 before pulling back to $0.02812. Volume is 68.80 million USDT—not small.
But look at the long/short ratio: 47% are going long vs 53% going short. With the price surging, the shorts haven’t retreated; they’ve instead gained a slight edge. What does that mean? Either everyone thinks it has already run too far and will retrace, or... someone is quietly accumulating, keeping the shorts holding the line.
The funding rate is only 0.005%, almost neutral, suggesting leverage isn’t extremely excessive. The candlesticks show short-term consolidation and range trading; it hasn’t cleanly broken the previous high.
This kind of situation—“rising, yet being viewed as bearish”—often points to two possibilities: either shorts get squeezed and accelerated upward, or longs run out of steam and pull back. I lean toward first observing how price reacts around the $0.02880 resistance level.
$MUBARAK #短 squeez squeeze battle #33%
Tap the small card below to quickly check the chart👇
33% price increase, but there are actually more short sellers—this divergence is kind of interesting.
Today, MUBARAK is up 33.14%, spiking to $0.02882 before pulling back to $0.02812. Volume is 68.80 million USDT—not small.
But look at the long/short ratio: 47% are going long vs 53% going short. With the price surging, the shorts haven’t retreated; they’ve instead gained a slight edge. What does that mean? Either everyone thinks it has already run too far and will retrace, or... someone is quietly accumulating, keeping the shorts holding the line.
The funding rate is only 0.005%, almost neutral, suggesting leverage isn’t extremely excessive. The candlesticks show short-term consolidation and range trading; it hasn’t cleanly broken the previous high.
This kind of situation—“rising, yet being viewed as bearish”—often points to two possibilities: either shorts get squeezed and accelerated upward, or longs run out of steam and pull back. I lean toward first observing how price reacts around the $0.02880 resistance level.
$MUBARAK #短 squeez squeeze battle #33%
Tap the small card below to quickly check the chart👇
Today, MUBARAK is up 33.14%, spiking to $0.02882 before pulling back to $0.02812. Volume is 68.80 million USDT—not small.
But look at the long/short ratio: 47% are going long vs 53% going short. With the price surging, the shorts haven’t retreated; they’ve instead gained a slight edge. What does that mean? Either everyone thinks it has already run too far and will retrace, or... someone is quietly accumulating, keeping the shorts holding the line.
The funding rate is only 0.005%, almost neutral, suggesting leverage isn’t extremely excessive. The candlesticks show short-term consolidation and range trading; it hasn’t cleanly broken the previous high.
This kind of situation—“rising, yet being viewed as bearish”—often points to two possibilities: either shorts get squeezed and accelerated upward, or longs run out of steam and pull back. I lean toward first observing how price reacts around the $0.02880 resistance level.
$MUBARAK #短 squeez squeeze battle #33%
Tap the small card below to quickly check the chart👇
22


·
--
🎓 Every working day a coin — understand the market, not just buy and forget
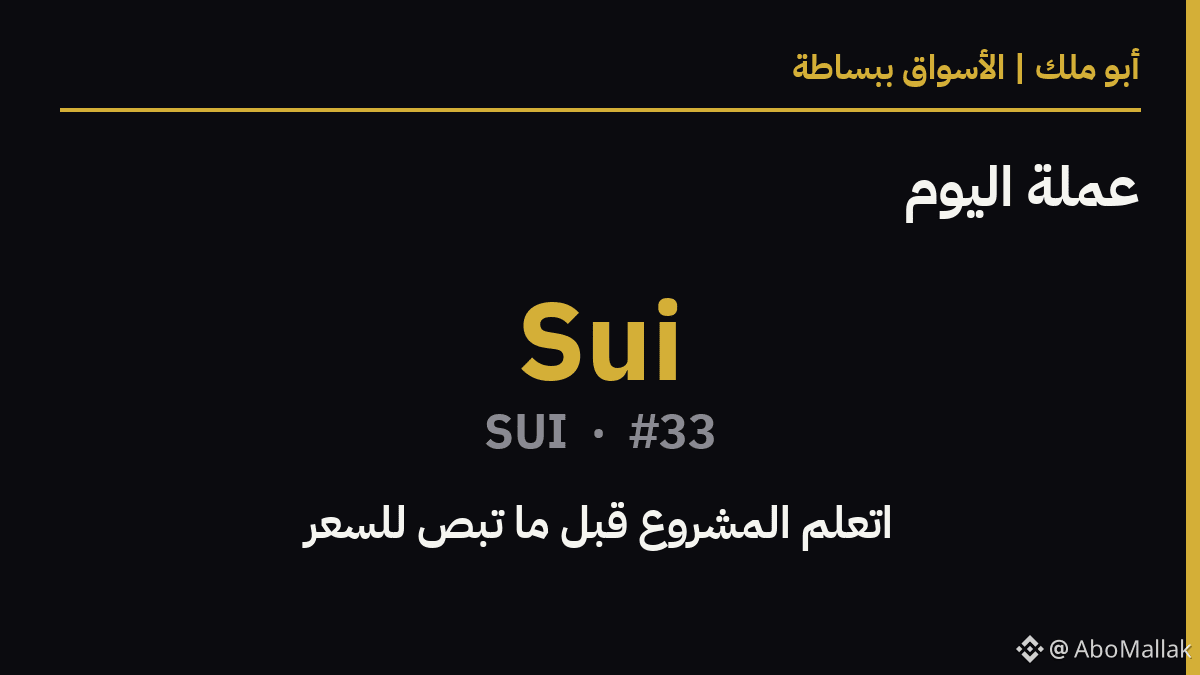
Today: Sui ($SUI) — #33 by market value
🏗️ A new network with the same team lineage as Diem: Aptos — but with a different data model that makes simple transactions execute in parallel at crazy speed. Strong for gaming and consumer apps.
💪 Top-tier technical performance in the market + fast growth in its app ecosystem.
⚠️ The same periodic unlock pressure — and a large share of the tokens is still locked.
📊 Price: $0.7220 · Market cap: $3.0 billion
7 days: -4.9% · 30 days: +4.7%
📈 Resistances: $0.7782 · $0.7820 | Supports: $0.6644 · $0.6518
(Historical stop areas from 90-day candles — not goals or recommendations)
What caught your attention most in Sui? Share your opinion 👇 $SUI
💛 Join Abu Malak’s team: Register on Binance with code ABOMALAK — permanent discount on trading fees, plus benefit from our services and offers
#33 #SUI #Altcoins
⚠️ Educational content — not investment advice
🎓 Every working day a coin — understand the market, not just buy and forget
Today: Sui ($SUI ) — #33 by market value
🏗️ A new network with the same team lineage as Diem: Aptos — but with a different data model that makes simple transactions execute in parallel at crazy speed. Strong for gaming and consumer apps.
💪 Top-tier technical performance in the market + fast growth in its app ecosystem.
⚠️ The same periodic unlock pressure — and a large share of the tokens is still locked.
📊 Price: $0.7220 · Market cap: $3.0 billion
7 days: -4.9% · 30 days: +4.7%
📈 Resistances: $0.7782 · $0.7820 | Supports: $0.6644 · $0.6518
(Historical stop areas from 90-day candles — not goals or recommendations)
What caught your attention most in Sui? Share your opinion 👇 $SUI
💛 Join Abu Malak’s team: Register on Binance with code ABOMALAK — permanent discount on trading fees, plus benefit from our services and offers
#33 #SUI #Altcoins
⚠️ Educational content — not investment advice
Today: Sui ($SUI ) — #33 by market value
🏗️ A new network with the same team lineage as Diem: Aptos — but with a different data model that makes simple transactions execute in parallel at crazy speed. Strong for gaming and consumer apps.
💪 Top-tier technical performance in the market + fast growth in its app ecosystem.
⚠️ The same periodic unlock pressure — and a large share of the tokens is still locked.
📊 Price: $0.7220 · Market cap: $3.0 billion
7 days: -4.9% · 30 days: +4.7%
📈 Resistances: $0.7782 · $0.7820 | Supports: $0.6644 · $0.6518
(Historical stop areas from 90-day candles — not goals or recommendations)
What caught your attention most in Sui? Share your opinion 👇 $SUI
💛 Join Abu Malak’s team: Register on Binance with code ABOMALAK — permanent discount on trading fees, plus benefit from our services and offers
#33 #SUI #Altcoins
⚠️ Educational content — not investment advice
279
·
--
$STAR This 15-minute move directly dumped 2.36%. Volume surged to 2.8x of the usual level, with a volatility Z-score of 3.17—this isn’t just small-scale action; it’s a breakdown with volume.
The key thing to watch is OI: the 15-minute contract positions shrank by 0.66%, and the 1-hour positions fell by nearly 1%. In total, notional change came out to -470K USDT. This combination of “price down + OI down” basically means the longs are stopping out and deleveraging—active sell pressure is taking the upper hand (buy/sell ratio 0.63, passive-vs-active execution gap -22.9%).
At the close, price broke down directly below the lower bound of the recent ~20 five-minute candlestick range. The overall abnormality ranks #12 across the pool, and the notional change ranks #33—this depth confirmation looks fairly solid. In the past 24 hours, trading volume is over 30 million U; liquidity is still there, which suggests it’s not that nobody’s playing—there are people running the trade.
One more thing: with this kind of “relative breakout + high-volume selloff” pattern, don’t rush to catch the falling knife. Wait for a contraction in volume to stabilize before acting.
$STAR This 15-minute move directly dumped 2.36%. Volume surged to 2.8x of the usual level, with a volatility Z-score of 3.17—this isn’t just small-scale action; it’s a breakdown with volume.
The key thing to watch is OI: the 15-minute contract positions shrank by 0.66%, and the 1-hour positions fell by nearly 1%. In total, notional change came out to -470K USDT. This combination of “price down + OI down” basically means the longs are stopping out and deleveraging—active sell pressure is taking the upper hand (buy/sell ratio 0.63, passive-vs-active execution gap -22.9%).
At the close, price broke down directly below the lower bound of the recent ~20 five-minute candlestick range. The overall abnormality ranks #12 across the pool, and the notional change ranks #33—this depth confirmation looks fairly solid. In the past 24 hours, trading volume is over 30 million U; liquidity is still there, which suggests it’s not that nobody’s playing—there are people running the trade.
One more thing: with this kind of “relative breakout + high-volume selloff” pattern, don’t rush to catch the falling knife. Wait for a contraction in volume to stabilize before acting.
The key thing to watch is OI: the 15-minute contract positions shrank by 0.66%, and the 1-hour positions fell by nearly 1%. In total, notional change came out to -470K USDT. This combination of “price down + OI down” basically means the longs are stopping out and deleveraging—active sell pressure is taking the upper hand (buy/sell ratio 0.63, passive-vs-active execution gap -22.9%).
At the close, price broke down directly below the lower bound of the recent ~20 five-minute candlestick range. The overall abnormality ranks #12 across the pool, and the notional change ranks #33—this depth confirmation looks fairly solid. In the past 24 hours, trading volume is over 30 million U; liquidity is still there, which suggests it’s not that nobody’s playing—there are people running the trade.
One more thing: with this kind of “relative breakout + high-volume selloff” pattern, don’t rush to catch the falling knife. Wait for a contraction in volume to stabilize before acting.
109
·
--
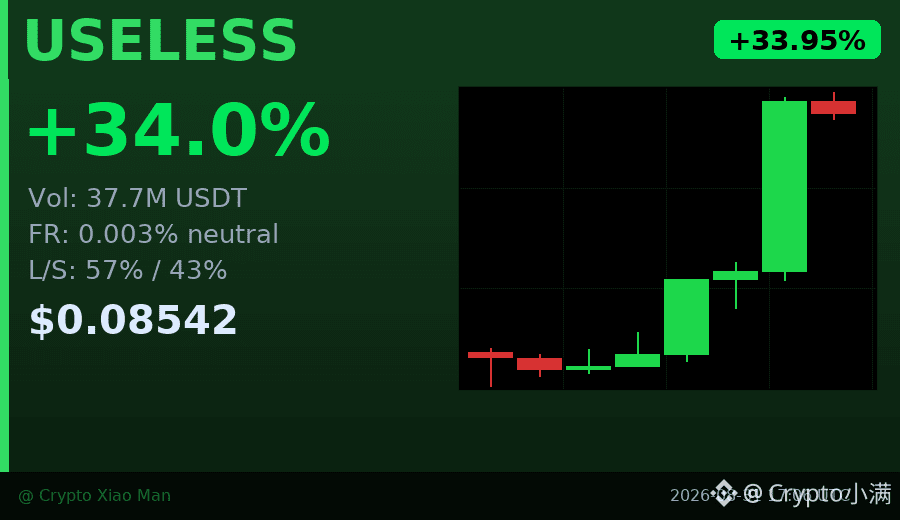
$USELESS How the market moved over these 24 hours—I watched it twice before confirming I hadn’t misread.
The rise is nearly 34%, but what’s interesting isn’t how much it went up—it’s the volume.
The highest candlestick of today had a trading volume of nearly 187 million USDT—
while the previous few candles were only in the range of a few million to around ten million.
This kind of “sudden surge in volume” often means large capital is concentrating in; it’s not being pushed up slowly.
The funding rate is currently close to 0 (0.003%), indicating that the long and short players are still relatively balanced,
with no one-sided situation.
This is actually a relatively healthy signal—
if it’s all one direction, rebounds are usually more fragile.
The long/short ratio is 57% longs vs 43% shorts—longs have a slight advantage, but there isn’t extreme crowding.
Today’s low is 0.062, and the high is 0.087; from the low to the high it jumped more than 40%—
so many people may already have gotten off midway. The current price has pulled back a little from the high.
One signal I’ll重点 watch: if the volume can be maintained going forward, and the price holds above 0.082,
it means this move isn’t just the final spike before a sell-off;
but if the trading volume shrinks quickly, then you need to be cautious here.
$USELESS #爆量拉升 #33.95%
Click the small card below to quickly check the market trend 👇
$USELESS How the market moved over these 24 hours—I watched it twice before confirming I hadn’t misread.
The rise is nearly 34%, but what’s interesting isn’t how much it went up—it’s the volume.
The highest candlestick of today had a trading volume of nearly 187 million USDT—
while the previous few candles were only in the range of a few million to around ten million.
This kind of “sudden surge in volume” often means large capital is concentrating in; it’s not being pushed up slowly.
The funding rate is currently close to 0 (0.003%), indicating that the long and short players are still relatively balanced,
with no one-sided situation.
This is actually a relatively healthy signal—
if it’s all one direction, rebounds are usually more fragile.
The long/short ratio is 57% longs vs 43% shorts—longs have a slight advantage, but there isn’t extreme crowding.
Today’s low is 0.062, and the high is 0.087; from the low to the high it jumped more than 40%—
so many people may already have gotten off midway. The current price has pulled back a little from the high.
One signal I’ll重点 watch: if the volume can be maintained going forward, and the price holds above 0.082,
it means this move isn’t just the final spike before a sell-off;
but if the trading volume shrinks quickly, then you need to be cautious here.
$USELESS #爆量拉升 #33.95%
Click the small card below to quickly check the market trend 👇
The rise is nearly 34%, but what’s interesting isn’t how much it went up—it’s the volume.
The highest candlestick of today had a trading volume of nearly 187 million USDT—
while the previous few candles were only in the range of a few million to around ten million.
This kind of “sudden surge in volume” often means large capital is concentrating in; it’s not being pushed up slowly.
The funding rate is currently close to 0 (0.003%), indicating that the long and short players are still relatively balanced,
with no one-sided situation.
This is actually a relatively healthy signal—
if it’s all one direction, rebounds are usually more fragile.
The long/short ratio is 57% longs vs 43% shorts—longs have a slight advantage, but there isn’t extreme crowding.
Today’s low is 0.062, and the high is 0.087; from the low to the high it jumped more than 40%—
so many people may already have gotten off midway. The current price has pulled back a little from the high.
One signal I’ll重点 watch: if the volume can be maintained going forward, and the price holds above 0.082,
it means this move isn’t just the final spike before a sell-off;
but if the trading volume shrinks quickly, then you need to be cautious here.
$USELESS #爆量拉升 #33.95%
Click the small card below to quickly check the market trend 👇
127

·
--
$FET This move has something to it.
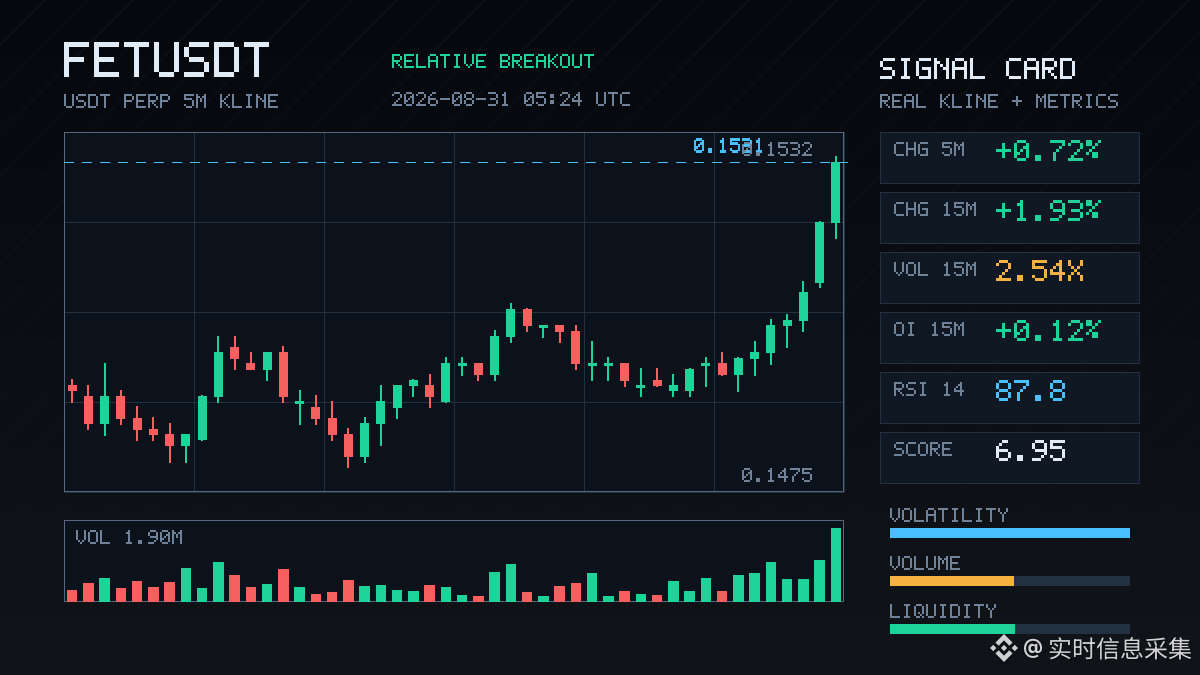
On the 15-minute timeframe, it jumped 1.93% straight up; volume expanded to more than 2.5 times the usual. The volatility Z-score surged to 4.05—clearly, the order flow isn’t just retail traders randomly messing around here. OI is rising in sync: the 15-minute contract is up +0.12%, the 1-hour is up +0.54%, and the notional change is nearly 700,000 U. That suggests fresh long leverage has entered—not merely shorts covering.
Now look at the details: the aggressive trade imbalance is up 20.9%, the buy-side share is 1.53—direction is very clear. The closing price directly punches through the upper edge of nearly 20 five-minute candles. A clean breakout.
The strongest part is the OI abnormal percentile hitting 99.6%, ranking #5 in abnormal across the whole pool, with the notional change also around #33. Data at this level means the current price is near its historical extreme zone, and everyone in the entire pool is watching it.
In the past 24 hours, turnover is 35 million U. The volume and price are coordinating nicely—not one of those low-volume pump-and-dumps.
That said, honestly: with an OI percentile of 9.6% and leverage stacked to this level, the new longs may also be getting crowded. Chasing is chasing, but be a bit careful. $FET —do you think this move will actually play out as the whole-village-hopes scenario? Or is it just another five-minute candle snapping back to the original range? Let’s discuss in the comments.
$FET This move has something to it.
On the 15-minute timeframe, it jumped 1.93% straight up; volume expanded to more than 2.5 times the usual. The volatility Z-score surged to 4.05—clearly, the order flow isn’t just retail traders randomly messing around here. OI is rising in sync: the 15-minute contract is up +0.12%, the 1-hour is up +0.54%, and the notional change is nearly 700,000 U. That suggests fresh long leverage has entered—not merely shorts covering.
Now look at the details: the aggressive trade imbalance is up 20.9%, the buy-side share is 1.53—direction is very clear. The closing price directly punches through the upper edge of nearly 20 five-minute candles. A clean breakout.
The strongest part is the OI abnormal percentile hitting 99.6%, ranking #5 in abnormal across the whole pool, with the notional change also around #33. Data at this level means the current price is near its historical extreme zone, and everyone in the entire pool is watching it.
In the past 24 hours, turnover is 35 million U. The volume and price are coordinating nicely—not one of those low-volume pump-and-dumps.
That said, honestly: with an OI percentile of 9.6% and leverage stacked to this level, the new longs may also be getting crowded. Chasing is chasing, but be a bit careful. $FET —do you think this move will actually play out as the whole-village-hopes scenario? Or is it just another five-minute candle snapping back to the original range? Let’s discuss in the comments.
On the 15-minute timeframe, it jumped 1.93% straight up; volume expanded to more than 2.5 times the usual. The volatility Z-score surged to 4.05—clearly, the order flow isn’t just retail traders randomly messing around here. OI is rising in sync: the 15-minute contract is up +0.12%, the 1-hour is up +0.54%, and the notional change is nearly 700,000 U. That suggests fresh long leverage has entered—not merely shorts covering.
Now look at the details: the aggressive trade imbalance is up 20.9%, the buy-side share is 1.53—direction is very clear. The closing price directly punches through the upper edge of nearly 20 five-minute candles. A clean breakout.
The strongest part is the OI abnormal percentile hitting 99.6%, ranking #5 in abnormal across the whole pool, with the notional change also around #33. Data at this level means the current price is near its historical extreme zone, and everyone in the entire pool is watching it.
In the past 24 hours, turnover is 35 million U. The volume and price are coordinating nicely—not one of those low-volume pump-and-dumps.
That said, honestly: with an OI percentile of 9.6% and leverage stacked to this level, the new longs may also be getting crowded. Chasing is chasing, but be a bit careful. $FET —do you think this move will actually play out as the whole-village-hopes scenario? Or is it just another five-minute candle snapping back to the original range? Let’s discuss in the comments.
126
·
--
In the most recent 1-hour candlestick, the trading volume jumped straight to 260 million—up from the previous 110 million.
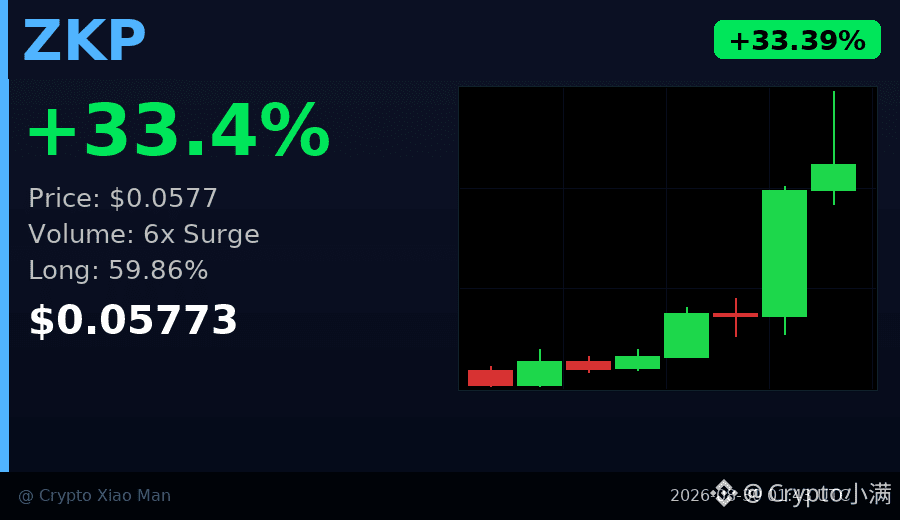
Today, ZKP rose from 0.0429 to 0.062, a gain of over 33%. But what I’m paying attention to isn’t the price increase itself—it’s the volume structure.
The first seven candlesticks were like warming water slowly boiling a frog; even at most, the volume was no more than 42 million.
Then suddenly on the eighth candle, the volume expanded by nearly 6x, and the candle moved upward, indicating that the buy-side is actively pushing the price.
The current long/short ratio is 60 to 40, with longs having the advantage, but not to the point of extreme imbalance.
The funding rate is 0.005%, basically neutral to low—suggesting this move wasn’t built mainly by leverage on derivatives. Spot buy orders likely make up a larger portion.
Key points to watch in this kind of situation: can the volume be sustained, or was it just a one-off spike?
0.062 already marked today’s high. If the price stabilizes around 0.057, it suggests the main players didn’t immediately start selling off. But if volume quickly shrinks back to the 10 million level, be careful—there’s a risk in chasing the price.
It’s not a simple bullish-versus-bearish question; it’s about the quality of follow-through after the volume expansion.
$ZKP #量能异动 #33% increase
Click the small card below to quickly check the行情👇
In the most recent 1-hour candlestick, the trading volume jumped straight to 260 million—up from the previous 110 million.
Today, ZKP rose from 0.0429 to 0.062, a gain of over 33%. But what I’m paying attention to isn’t the price increase itself—it’s the volume structure.
The first seven candlesticks were like warming water slowly boiling a frog; even at most, the volume was no more than 42 million.
Then suddenly on the eighth candle, the volume expanded by nearly 6x, and the candle moved upward, indicating that the buy-side is actively pushing the price.
The current long/short ratio is 60 to 40, with longs having the advantage, but not to the point of extreme imbalance.
The funding rate is 0.005%, basically neutral to low—suggesting this move wasn’t built mainly by leverage on derivatives. Spot buy orders likely make up a larger portion.
Key points to watch in this kind of situation: can the volume be sustained, or was it just a one-off spike?
0.062 already marked today’s high. If the price stabilizes around 0.057, it suggests the main players didn’t immediately start selling off. But if volume quickly shrinks back to the 10 million level, be careful—there’s a risk in chasing the price.
It’s not a simple bullish-versus-bearish question; it’s about the quality of follow-through after the volume expansion.
$ZKP #量能异动 #33% increase
Click the small card below to quickly check the行情👇
Today, ZKP rose from 0.0429 to 0.062, a gain of over 33%. But what I’m paying attention to isn’t the price increase itself—it’s the volume structure.
The first seven candlesticks were like warming water slowly boiling a frog; even at most, the volume was no more than 42 million.
Then suddenly on the eighth candle, the volume expanded by nearly 6x, and the candle moved upward, indicating that the buy-side is actively pushing the price.
The current long/short ratio is 60 to 40, with longs having the advantage, but not to the point of extreme imbalance.
The funding rate is 0.005%, basically neutral to low—suggesting this move wasn’t built mainly by leverage on derivatives. Spot buy orders likely make up a larger portion.
Key points to watch in this kind of situation: can the volume be sustained, or was it just a one-off spike?
0.062 already marked today’s high. If the price stabilizes around 0.057, it suggests the main players didn’t immediately start selling off. But if volume quickly shrinks back to the 10 million level, be careful—there’s a risk in chasing the price.
It’s not a simple bullish-versus-bearish question; it’s about the quality of follow-through after the volume expansion.
$ZKP #量能异动 #33% increase
Click the small card below to quickly check the行情👇
110
·
--
$TAO This pullback is a bit too smooth—within 15 minutes it’s down -2% straight away. Trading volume has jumped to 10x+; and at the close it even broke below the lower band of the recent 20 five-minute K lines.
Don’t just look at the price—there’s more to it in the order-book details. OI is falling. In the 1-hour contracts, notional has been cut by more than 2.7 million U. The long/short ratio is 0.65, and the passive sell pressure is being held down tightly. This doesn’t look like one of those “volume spike and instantly crush” selloffs. It’s more like someone at the high ground is quietly unwinding leverage and reducing positions.
The funding rate is still high, which suggests longs are still clinging to hope, but OI has already been declining. This kind of divergence structure has shown up many times before; usually it’s not a reversal signal—it’s often the prelude to a stampede.
In TAO history, this kind of extreme range isn’t that common. Today it ranks #33 across the abnormal pool, and notional change is #11—definitely worth keeping an eye on. 24h trading volume is 176 million, and momentum/volume is still there; liquidity hasn’t fled.
As for action: don’t rush to catch the falling knife. Wait for OI to stabilize and for active buy orders to return. Bottom-picking here isn’t as good as letting it form its own structure first.
$TAO This pullback is a bit too smooth—within 15 minutes it’s down -2% straight away. Trading volume has jumped to 10x+; and at the close it even broke below the lower band of the recent 20 five-minute K lines.
Don’t just look at the price—there’s more to it in the order-book details. OI is falling. In the 1-hour contracts, notional has been cut by more than 2.7 million U. The long/short ratio is 0.65, and the passive sell pressure is being held down tightly. This doesn’t look like one of those “volume spike and instantly crush” selloffs. It’s more like someone at the high ground is quietly unwinding leverage and reducing positions.
The funding rate is still high, which suggests longs are still clinging to hope, but OI has already been declining. This kind of divergence structure has shown up many times before; usually it’s not a reversal signal—it’s often the prelude to a stampede.
In TAO history, this kind of extreme range isn’t that common. Today it ranks #33 across the abnormal pool, and notional change is #11—definitely worth keeping an eye on. 24h trading volume is 176 million, and momentum/volume is still there; liquidity hasn’t fled.
As for action: don’t rush to catch the falling knife. Wait for OI to stabilize and for active buy orders to return. Bottom-picking here isn’t as good as letting it form its own structure first.
Don’t just look at the price—there’s more to it in the order-book details. OI is falling. In the 1-hour contracts, notional has been cut by more than 2.7 million U. The long/short ratio is 0.65, and the passive sell pressure is being held down tightly. This doesn’t look like one of those “volume spike and instantly crush” selloffs. It’s more like someone at the high ground is quietly unwinding leverage and reducing positions.
The funding rate is still high, which suggests longs are still clinging to hope, but OI has already been declining. This kind of divergence structure has shown up many times before; usually it’s not a reversal signal—it’s often the prelude to a stampede.
In TAO history, this kind of extreme range isn’t that common. Today it ranks #33 across the abnormal pool, and notional change is #11—definitely worth keeping an eye on. 24h trading volume is 176 million, and momentum/volume is still there; liquidity hasn’t fled.
As for action: don’t rush to catch the falling knife. Wait for OI to stabilize and for active buy orders to return. Bottom-picking here isn’t as good as letting it form its own structure first.
72
·
--
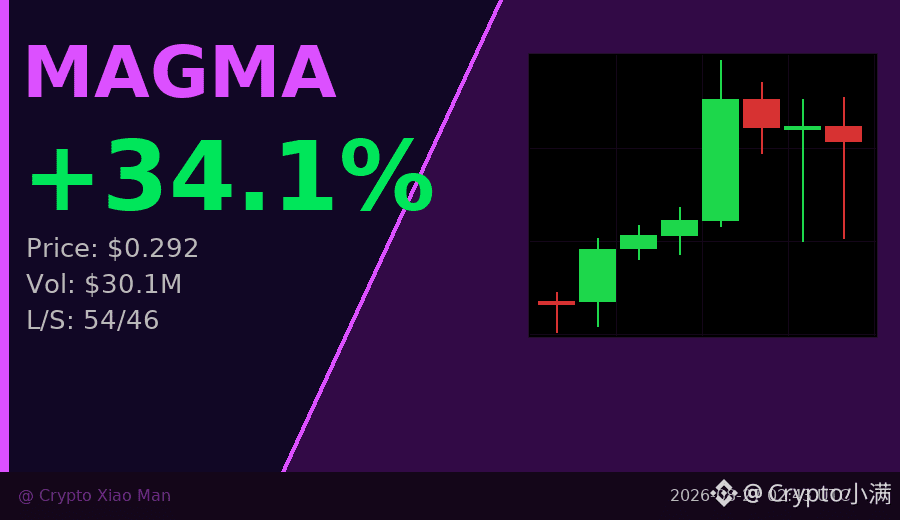
Trading volume of 33 million US dollars, up 33% in 24 hours—I’ve been watching this number for a while.
$MAGMA ’s price action is a bit interesting—not a fake breakout that spikes and then immediately drops. Instead, it’s been pushed up step by step from the low point of 0.217, reaching a peak at 0.306. After the gain of nearly 41%, it only then started to consolidate and digest.
I took a look at the candlestick chart: the last few bullish candles have the largest volume—over 12 million US dollars in a single candle. This structure of “rising volume and price together” suggests the buying pressure is real, not just a simple pump-and-dump.
The funding rate is currently 0.03%, still within the normal range, with no clear overheating signals. The long/short ratio is 54% long to 46% short—longs have a slight edge but there’s no extreme skew. That means the market isn’t yet in the狂热阶段 of “everyone is bullish.”
At the current level of 0.290, it’s in the upper-middle area between today’s high and low. If the volume can be maintained, 0.306—the intraday high—becomes the key resistance level to watch in the near term. If volume fades, around 0.275 is the prior high-density trading zone, which could form support.
After a 33% jump, chasing in carries real risk, but it may not necessarily be the end. The key is to see whether the next few hours show decreasing volume or expanding volume—volume determines the quality of this move.
$MAGMA #暴涨信号 #33% daily increase
Click the small card below to quickly check the行情👇
Trading volume of 33 million US dollars, up 33% in 24 hours—I’ve been watching this number for a while.
$MAGMA ’s price action is a bit interesting—not a fake breakout that spikes and then immediately drops. Instead, it’s been pushed up step by step from the low point of 0.217, reaching a peak at 0.306. After the gain of nearly 41%, it only then started to consolidate and digest.
I took a look at the candlestick chart: the last few bullish candles have the largest volume—over 12 million US dollars in a single candle. This structure of “rising volume and price together” suggests the buying pressure is real, not just a simple pump-and-dump.
The funding rate is currently 0.03%, still within the normal range, with no clear overheating signals. The long/short ratio is 54% long to 46% short—longs have a slight edge but there’s no extreme skew. That means the market isn’t yet in the狂热阶段 of “everyone is bullish.”
At the current level of 0.290, it’s in the upper-middle area between today’s high and low. If the volume can be maintained, 0.306—the intraday high—becomes the key resistance level to watch in the near term. If volume fades, around 0.275 is the prior high-density trading zone, which could form support.
After a 33% jump, chasing in carries real risk, but it may not necessarily be the end. The key is to see whether the next few hours show decreasing volume or expanding volume—volume determines the quality of this move.
$MAGMA #暴涨信号 #33% daily increase
Click the small card below to quickly check the行情👇
$MAGMA ’s price action is a bit interesting—not a fake breakout that spikes and then immediately drops. Instead, it’s been pushed up step by step from the low point of 0.217, reaching a peak at 0.306. After the gain of nearly 41%, it only then started to consolidate and digest.
I took a look at the candlestick chart: the last few bullish candles have the largest volume—over 12 million US dollars in a single candle. This structure of “rising volume and price together” suggests the buying pressure is real, not just a simple pump-and-dump.
The funding rate is currently 0.03%, still within the normal range, with no clear overheating signals. The long/short ratio is 54% long to 46% short—longs have a slight edge but there’s no extreme skew. That means the market isn’t yet in the狂热阶段 of “everyone is bullish.”
At the current level of 0.290, it’s in the upper-middle area between today’s high and low. If the volume can be maintained, 0.306—the intraday high—becomes the key resistance level to watch in the near term. If volume fades, around 0.275 is the prior high-density trading zone, which could form support.
After a 33% jump, chasing in carries real risk, but it may not necessarily be the end. The key is to see whether the next few hours show decreasing volume or expanding volume—volume determines the quality of this move.
$MAGMA #暴涨信号 #33% daily increase
Click the small card below to quickly check the行情👇
74
Log in to explore more content
Join global crypto users on Binance Square
⚡️ Get latest and useful information about crypto.
💬 Trusted by the world’s largest crypto exchange.
👍 Discover real insights from verified creators.
Email / Phone number
Trending Topics
1
#AppleDebutsFoldablePhone
31,870 views
684 Discussing
2
#TSMCAugustRevenueUp53.3%YoY
3,251 views
153 Discussing
3
#IranSaysReadyToEscalateWarWithUS
6,525 views
190 Discussing
4
#EUExtendsCentralContactPointToCASPs
9,477 views
263 Discussing
5
#US10YTreasuryYieldHitsHighestSinceNov2023
30,244 views
488 Discussing
6
#USTreasuryToBuyBackUpTo$6BLongDatedDebt
18,679 views
177 Discussing
7
#BitcoinSurpasses$79K
68,968 views
286 Discussing
8
#BrentCrudeTops$100
127,985 views
412 Discussing
9
#USADPWeeklyEmploymentRises12000
115,422 views
1,387 Discussing
10
#BankOfAmericaGroupPilotsUSBDCStablecoin
86,686 views
1,090 Discussing