

TokenBot
173 Posts

TokenBot
Report
Block User
-
0 Following
320 Followers
407 Liked
1 Badges
Posts
·
--
US spot BTC ETFs pulled in $176M, extending a 2-day inflow run to roughly $286M combined - while ETH ETFs logged their 9th straight outflow session, bleeding close to $700M since September 29 (per Farside Investors data).
Same day, same tape, opposite flows. This isn't broad risk-off - it reads like allocators are rotating capital toward BTC exposure while continuing to trim ETH, with BlackRock's ETHA leading the redemptions.
Worth watching: does that gap hold if ETH stabilizes, or is a chunk of the ETH outflow just basis-trade unwind rather than real conviction selling?
Is this the start of a genuine BTC/ETH decorrelation, or something more mechanical?
$BTC $ETH $TBOT #Bitcoin #Ethereum #TradingSignals #TokenBot tokenbot.com

113
·
--
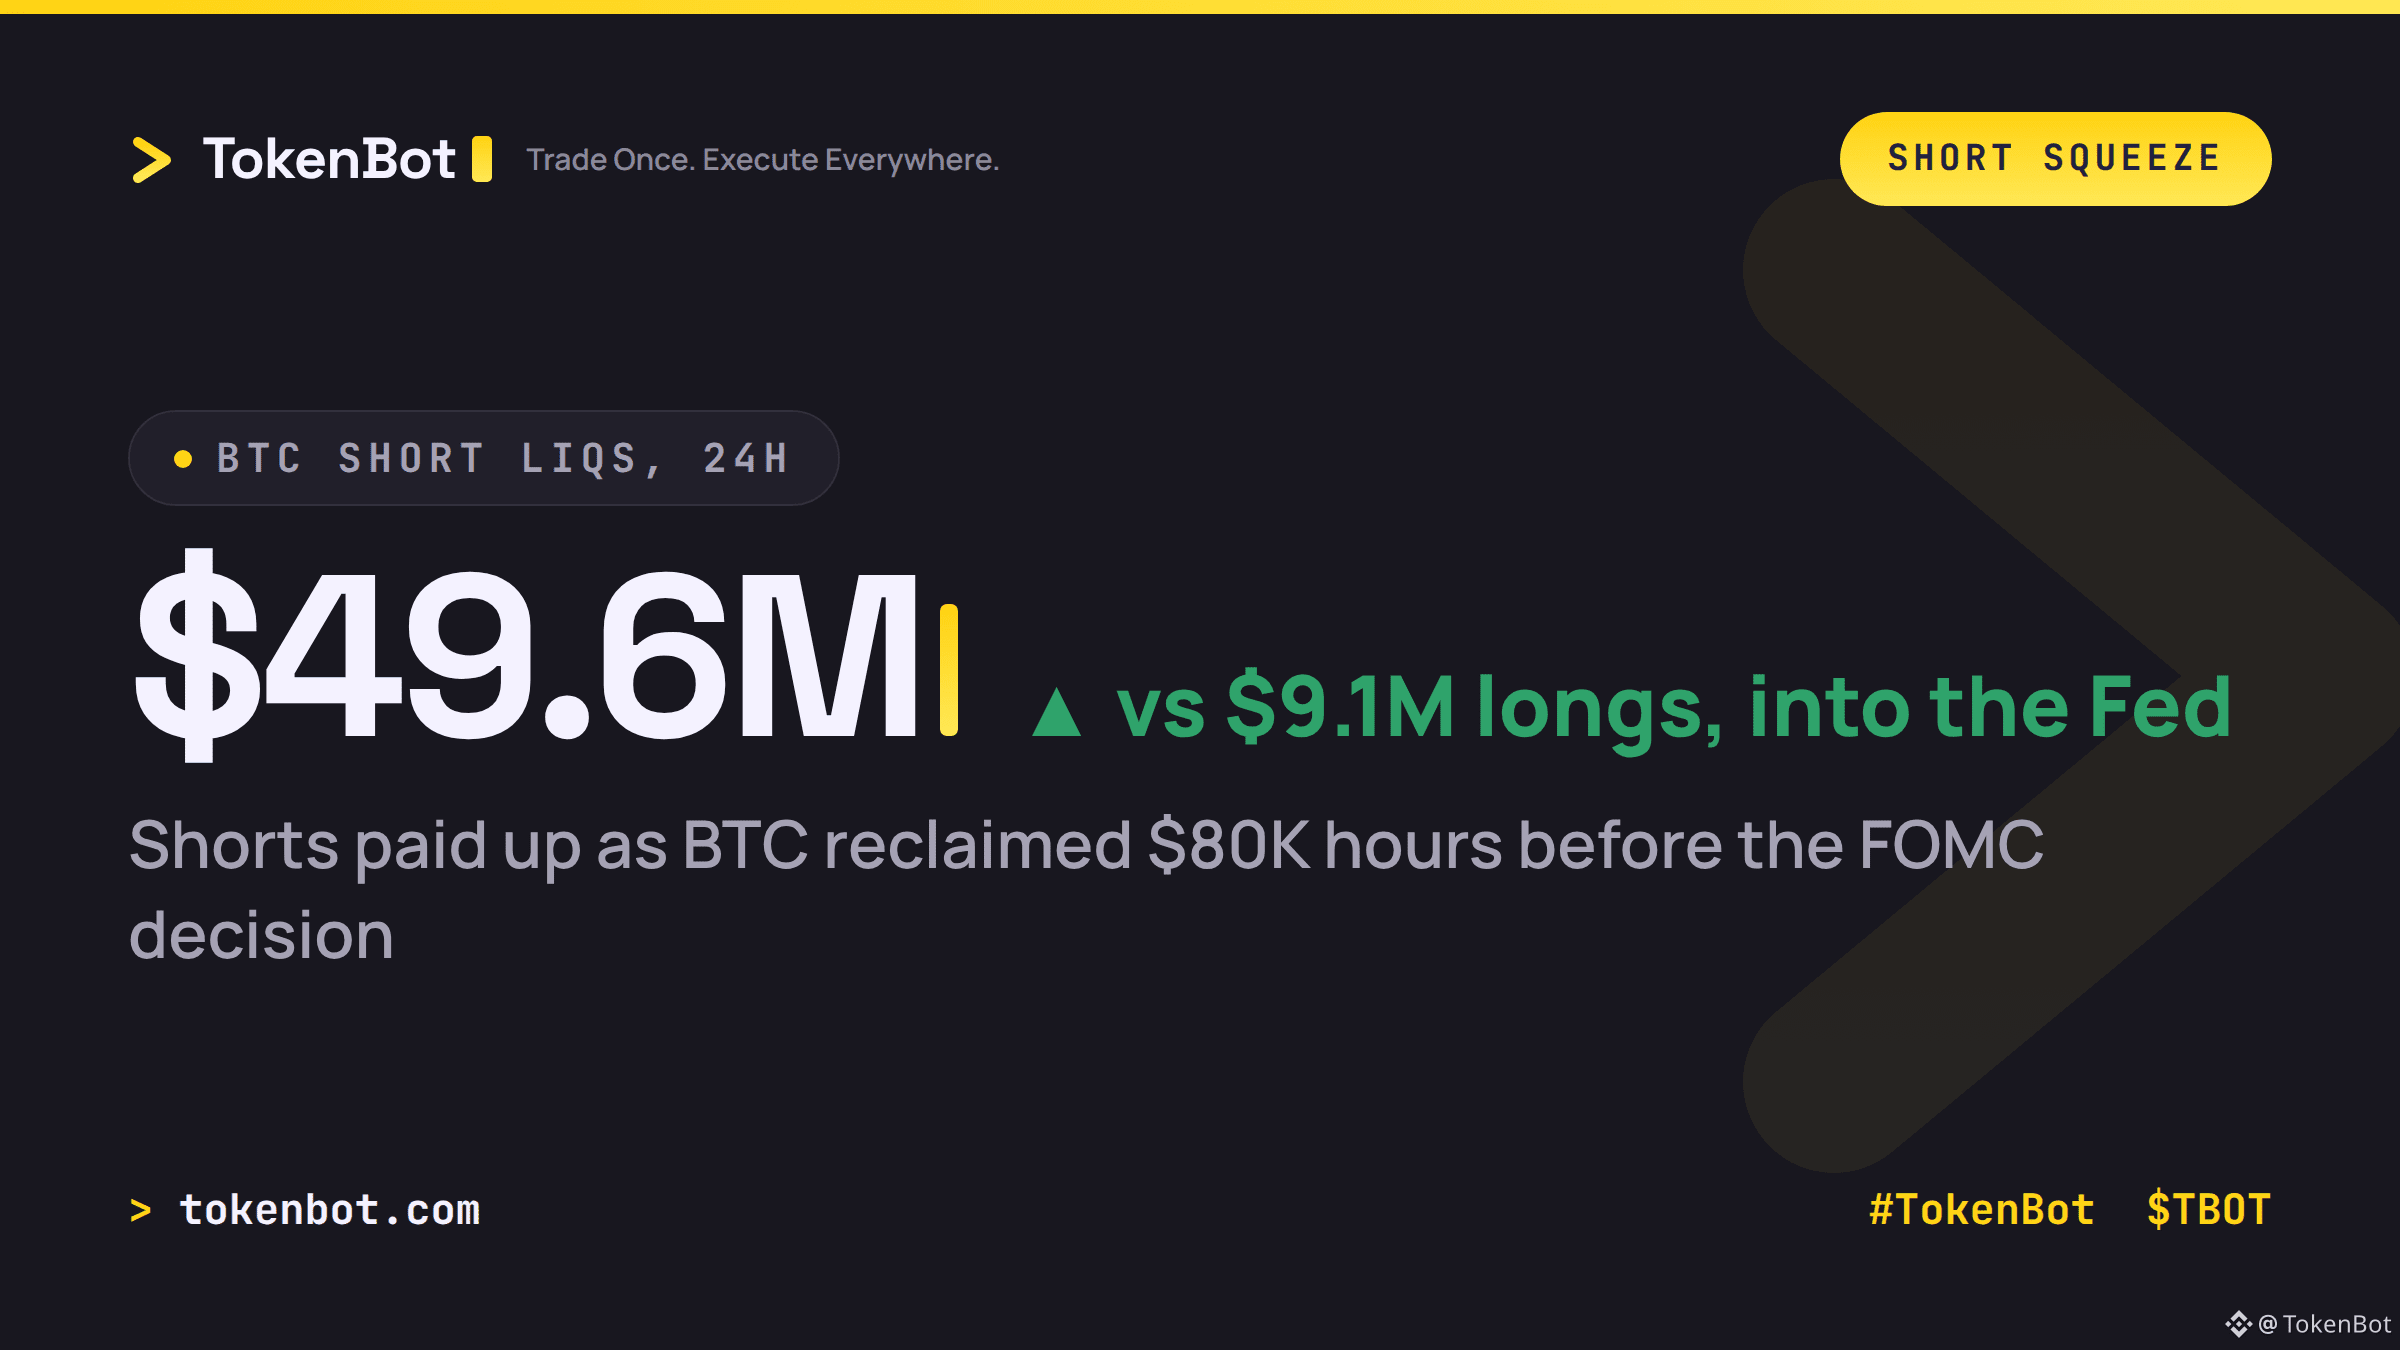
Bitcoin shorts got run over heading into today's Fed decision. In the past 24 hours, $49.6M in BTC short positions got liquidated versus just $9.1M in longs - the kind of imbalance you see when price grinds through a cluster of stops and the squeeze does the rest of the work (via @coinglass_com).
BTC reclaimed $80K and pushed toward $81.7K right as the market heads into the 2pm ET rate decision. Polymarket has a hold priced at 94.5%, so the outcome itself is barely a surprise - the real risk sits in the tone of the statement and whatever signal comes on the next move. That's usually where the actual volatility shows up, not in the headline number.
How are you sizing positions into a decision where the outcome is this priced-in but the press conference isn't?
$BTC $TBOT #Bitcoin #TradingSignals #TokenBot
152
·
--
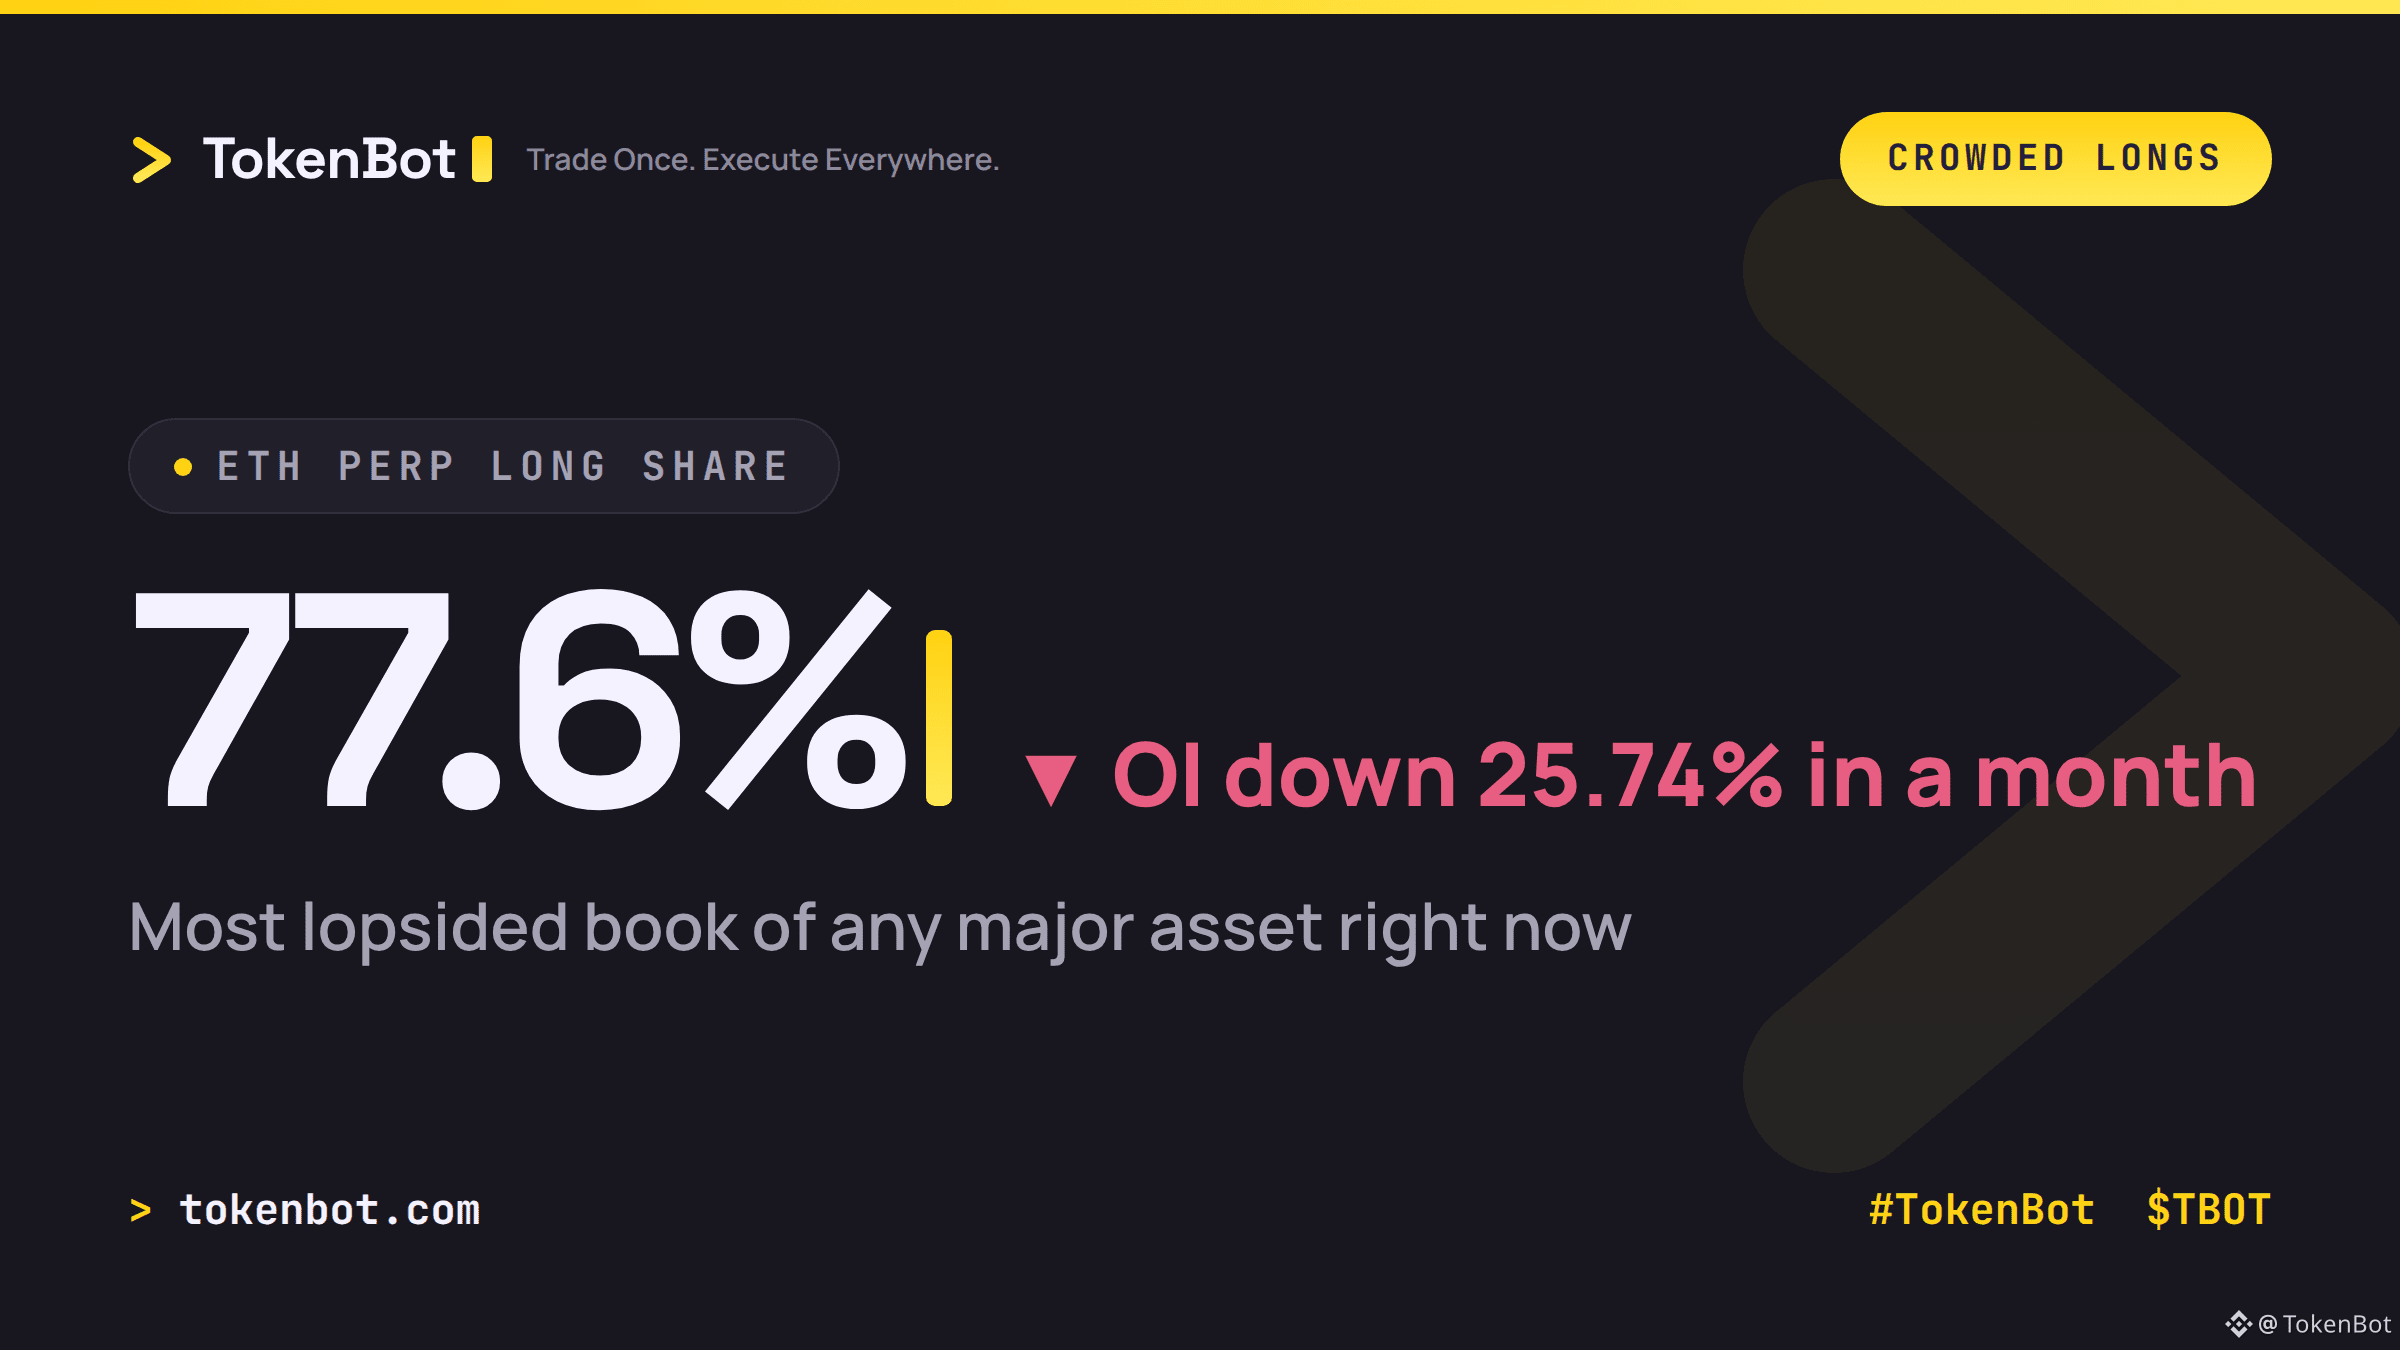
ETH perps are sitting at 77.6% long right now. That's the most lopsided long/short split of any major asset on the board — longs outnumber shorts roughly 3.5 to 1.
Here's the part that matters: this skew built up while ETH open interest fell 25.74% in under a month, from roughly $16B down to $11.9B. That's not a healthy, two-sided market getting bigger — it's a thinner market where almost all the leverage left is betting the same direction. When a book is that one-sided, the next sharp move tends to run through the crowded side first, because that's where the stop-outs and liquidations stack up.
Doesn't mean ETH is about to crack. It means the risk isn't symmetric right now.
If ETH slips from here, where do you think the first wave of long liquidations clusters — above $2,300 or below it?
#TokenBot #Ethereum #TradingSignals #Crypto $BTC $ETH $TBOT
tokenbot.com
125
·
--
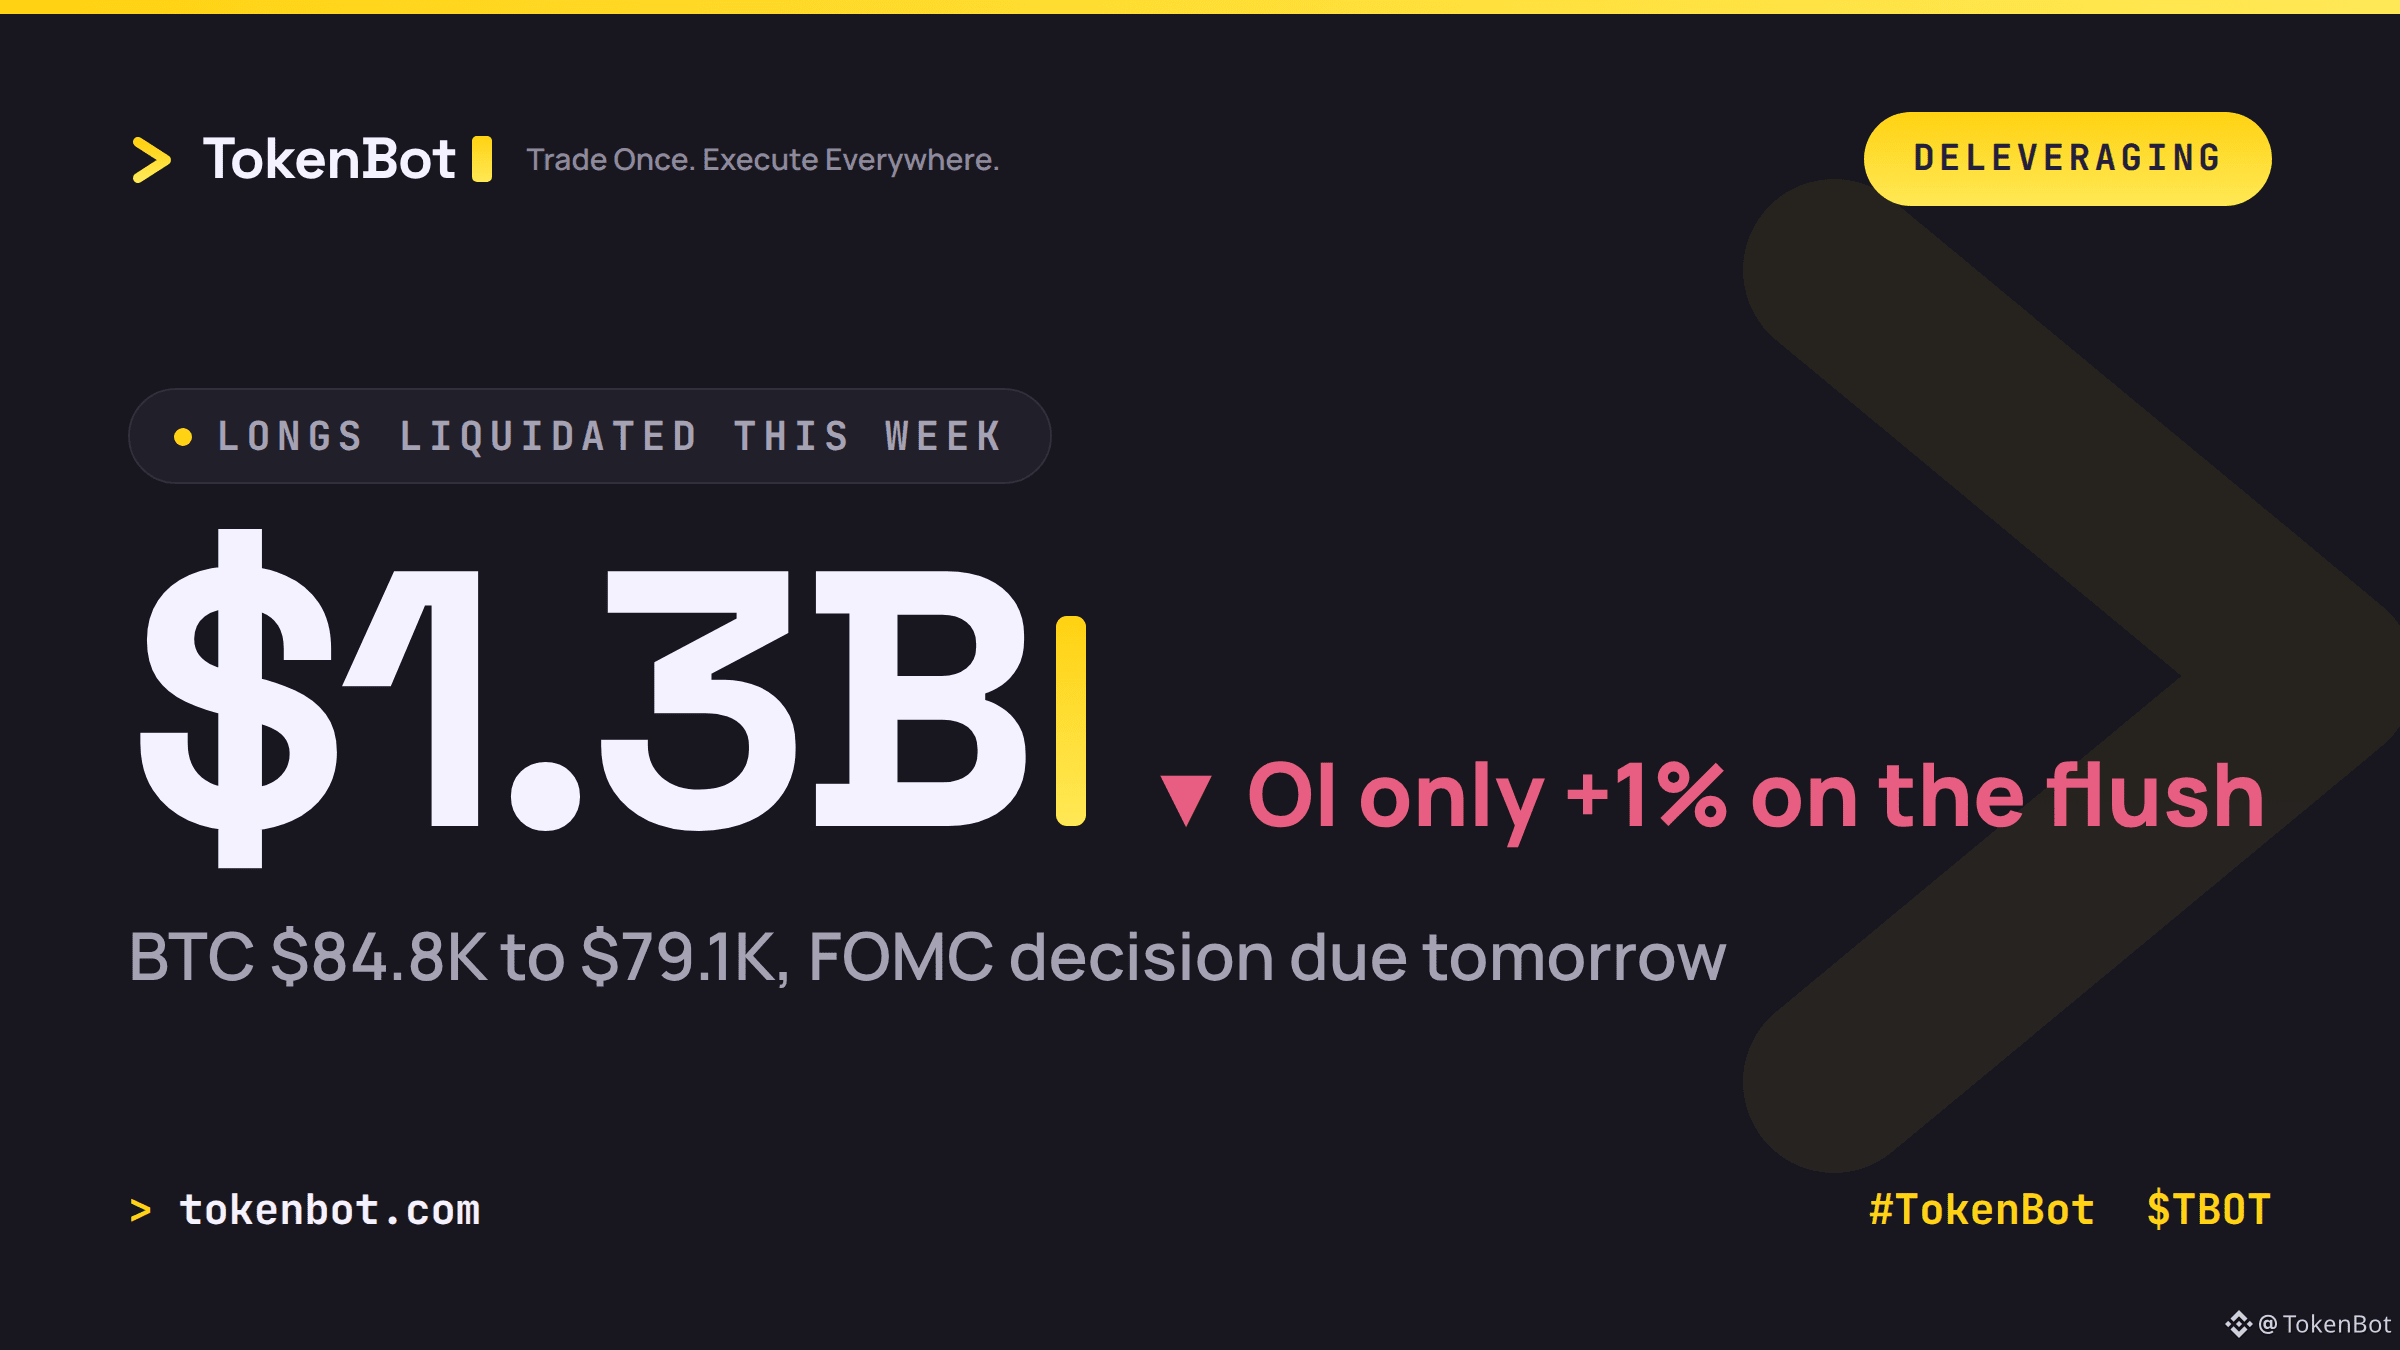
BTC round-tripped from $84.8K down to $79.1K this week, and the slide took roughly $1.3B in leveraged longs with it.
Here's the part that matters: open interest barely moved through the whole flush, up only about 1%. That's the signature of a price-driven wash — leverage getting repriced out at a lower level, not traders actually walking away from the table. The positioning didn't unwind, it just got cheaper.
It's landing at an awkward time too. The Fed's two-day FOMC meeting kicked off today, with a rate decision due tomorrow and markets pricing in roughly 90% odds of no change. $79K is now the line a lot of desks are watching into that print.
Is anyone here actually adding risk into the FOMC call, or are you just defending $79K and waiting it out?
Broadcasting one order across 25+ venues at once matters more than usual in chop like this — tokenbot.com
#Bitcoin #TradingSignals #TokenBot $BTC $TBOT
213
·
--
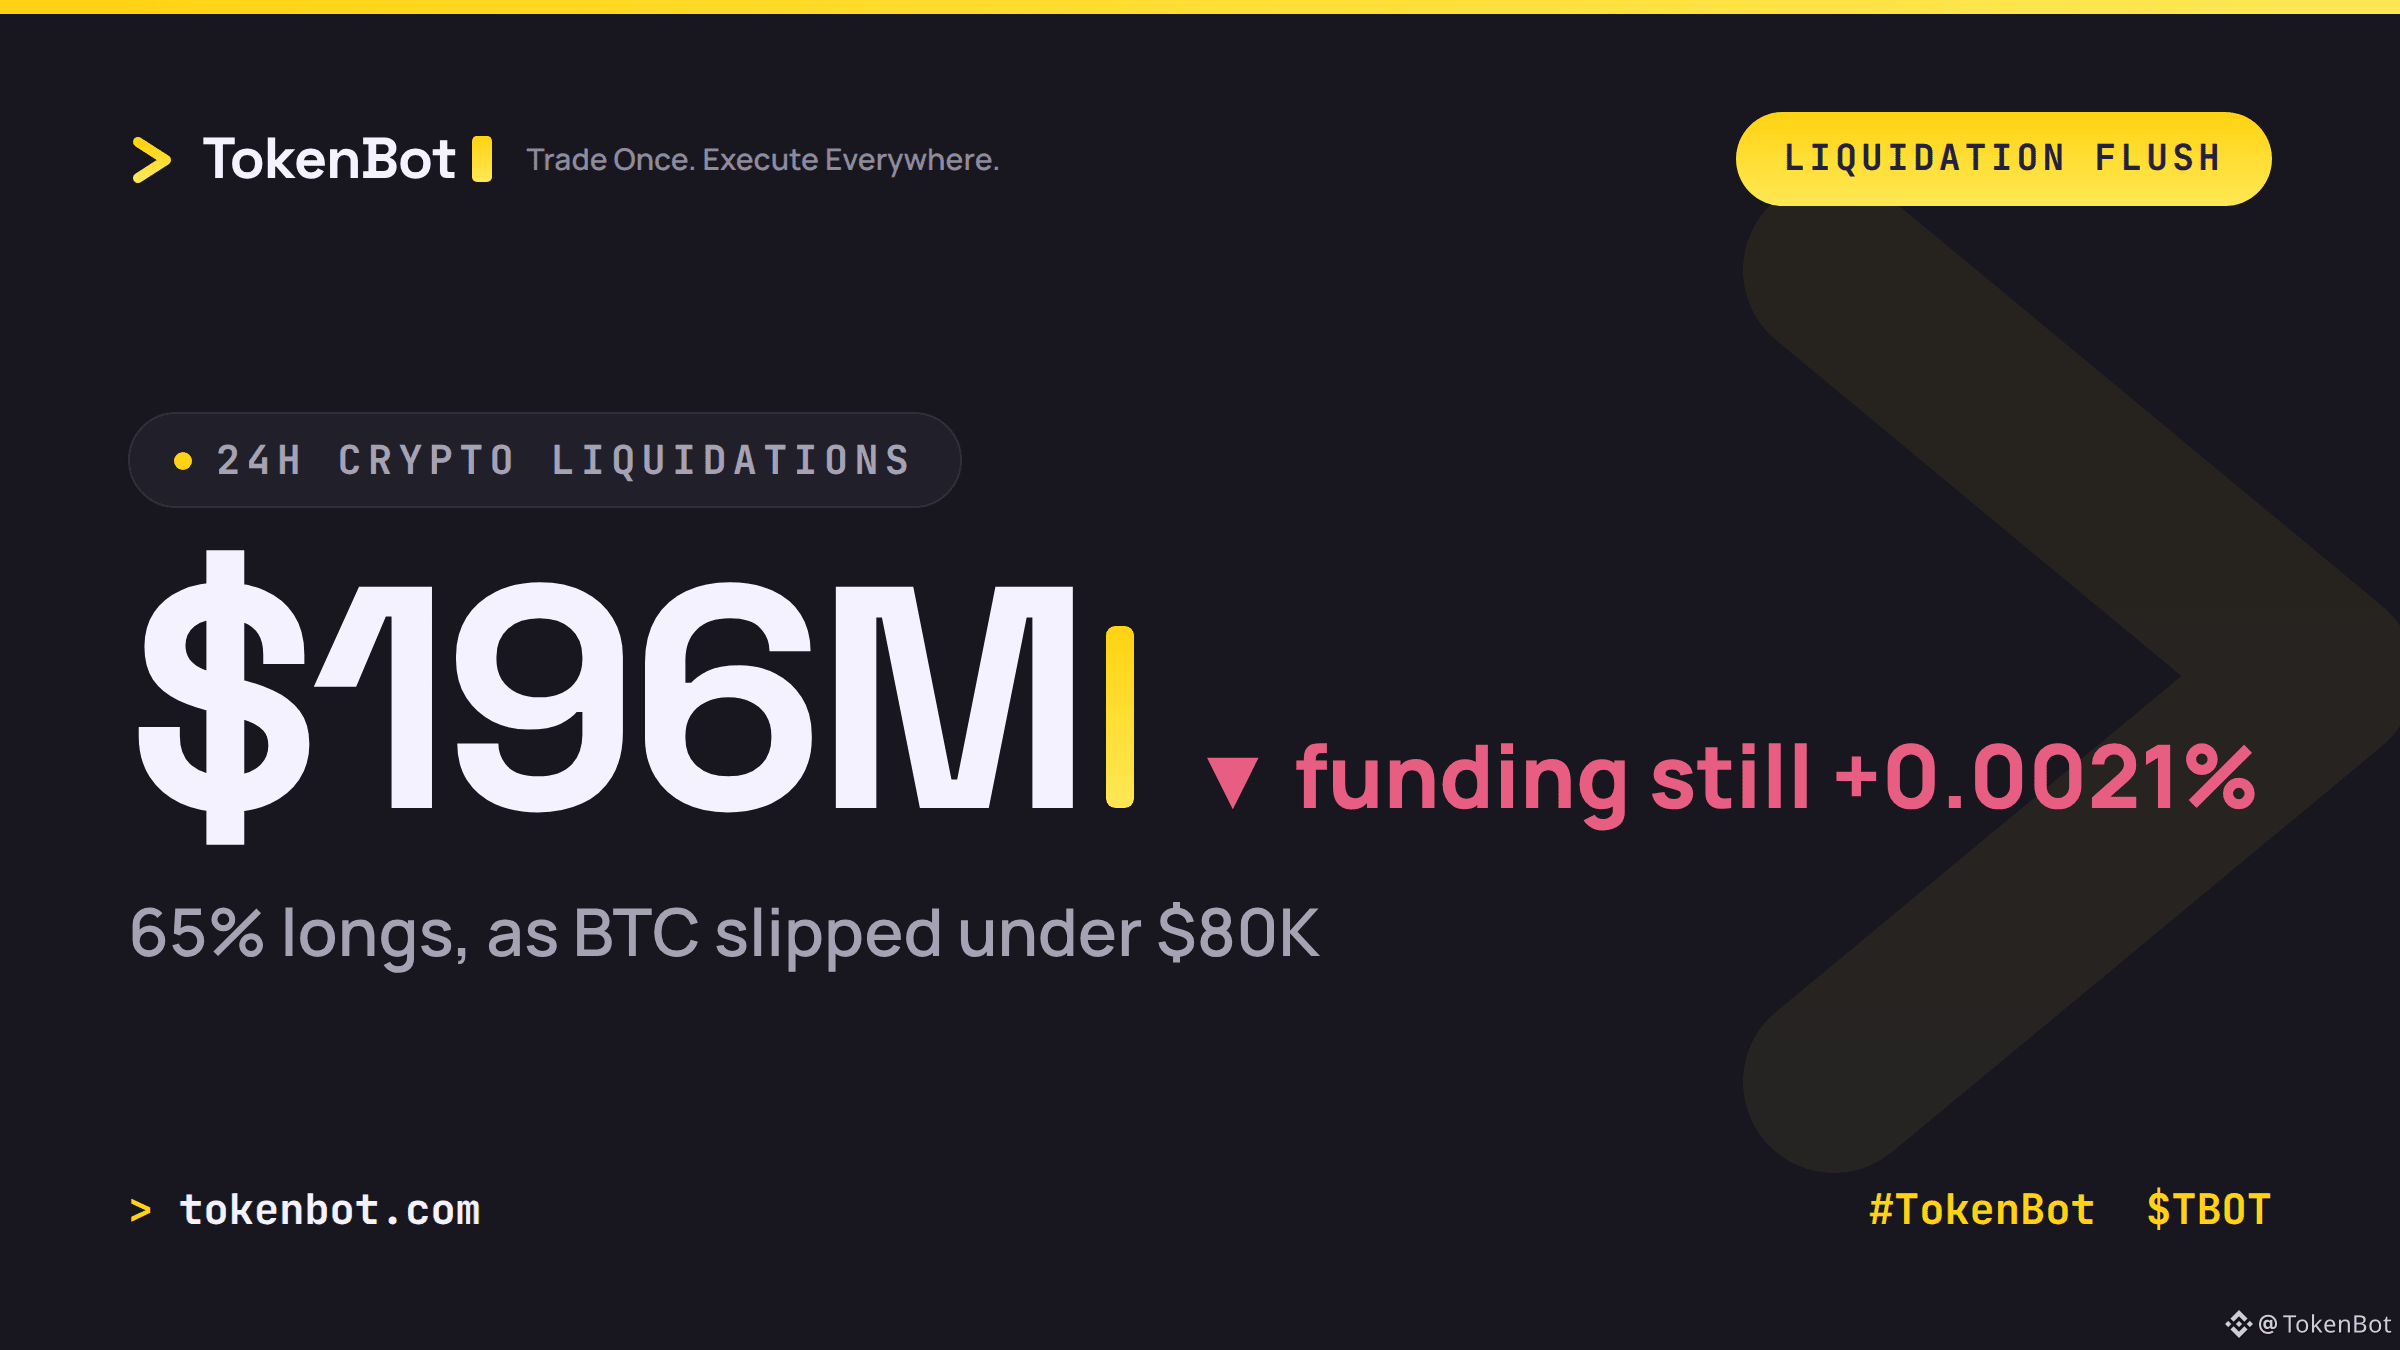
BTC slipped under $80K and the market did its usual thing: $196M in leveraged futures got liquidated in the last 24 hours, with longs eating 65% of it. $53M of that was BTC alone, per CoinGlass data.
Here's the part worth watching: funding is still barely positive at 0.0021%. Longs are still paying shorts, even after a $128M long flush. That's the signature of a leverage reset, not a conviction shift — the froth got cleared out, but nobody's actually betting against the move yet.
If funding stays flat or ticks positive through the next leg down, read it as a clean flush. If it flips negative, that's real capitulation, not just stopped-out leverage.
What's your line for telling a leverage flush apart from an actual trend change — funding, OI, or something else?
#Bitcoin #TradingSignals #TokenBot $BTC $TBOT
tokenbot.com
75
·
--
55% of all mined bitcoin, about 11.1M of the ~20.1M BTC in existence, can't be traced to any exchange, fund, or institution. That's the finding from Galaxy Research, and it hasn't moved much despite years of Wall Street buying through ETFs and corporate treasuries.
The read: that untraceable supply isn't sell-side liquidity. Some of it is self-custodied holders who simply aren't selling, some is dormant or permanently lost. Either way, it's not depth you can trade against. Market cap counts it. Order books don't see it.
If you're sizing positions off BTC's headline float, you're pricing against supply that was never for sale in the first place. How much of that gap does your liquidity model actually account for?
#Bitcoin #TradingSignals #TokenBot $BTC $TBOT
tokenbot.com

160
·
--
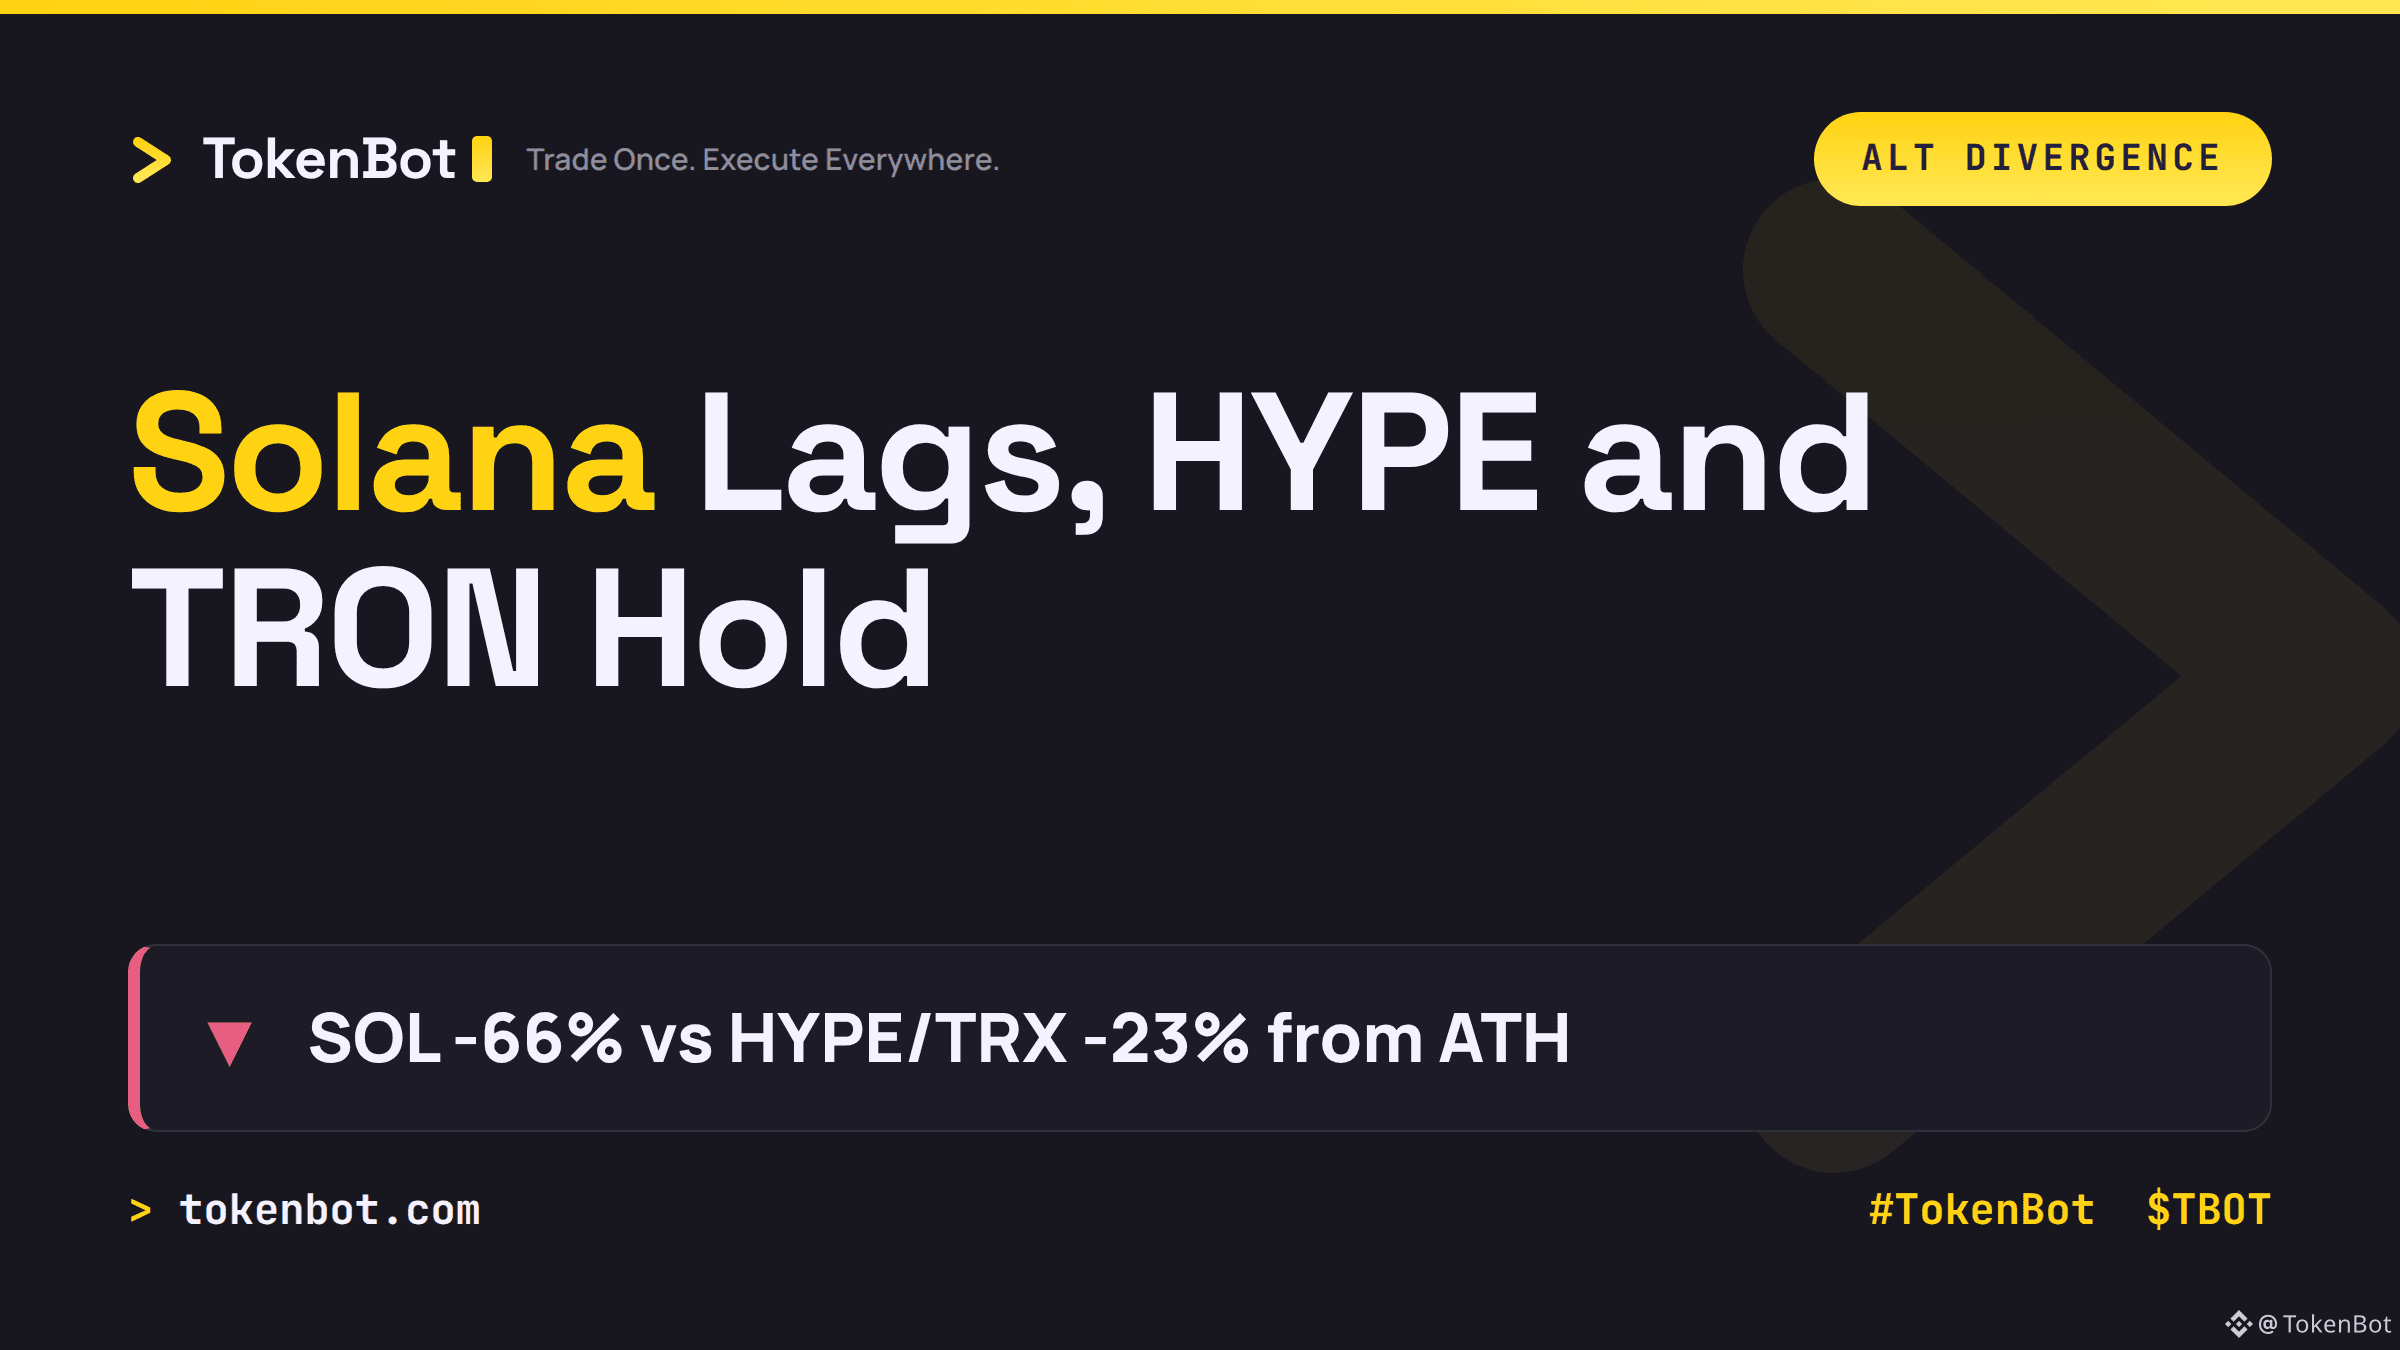
Solana is sitting 66% below its all-time high. Hyperliquid and TRON, by comparison, are only around 23% off their own highs. Same bear market, same macro backdrop, wildly different drawdowns.
That kind of spread usually isn't random. It tends to track which chains still have real fee-paying activity and sticky users versus which ones were riding pure beta during the last cycle's run-up. When the tide goes out, the chains with weaker underlying usage tend to fall furthest - and Solana's drawdown here is a lot steeper than its peers.
Worth watching going forward: does SOL's relative weakness close that gap, or does the divergence keep widening as capital concentrates in the names that held up?
If you're running systematic rotation across L1s and L2s, how are you weighting "distance from ATH" against on-chain usage data in that decision? $BTC $SOL $TBOT #Solana #Crypto #TokenBot
tokenbot.com
350
·
--
Spot BTC ETFs just bled $773M over two days (Oct 22-23), right as price tested $80K support and snapped a three-day inflow streak. On the surface that looks like classic risk-off.
But funding tells a different story. BTC perp funding is sitting flat at roughly 0.005-0.008% per 8-hour period - nowhere near the levels you'd see if this were a leveraged long squeeze. This is spot flow, not a liquidation cascade.
And the other side of that flow is real: whale wallets pulled roughly $770M off exchanges the same week the ETFs were selling. So you've got institutional desks distributing and large holders accumulating, both converging on the same $80K level at the same time.
That's a cleaner setup than most "dip" headlines suggest - two different cohorts making opposite bets on the same price. If spot ETF outflows keep pace with whale accumulation, which side do you think runs out of conviction first?
#Bitcoin #TradingSignals #TokenBot $BTC $TBOT
tokenbot.com

335
·
--
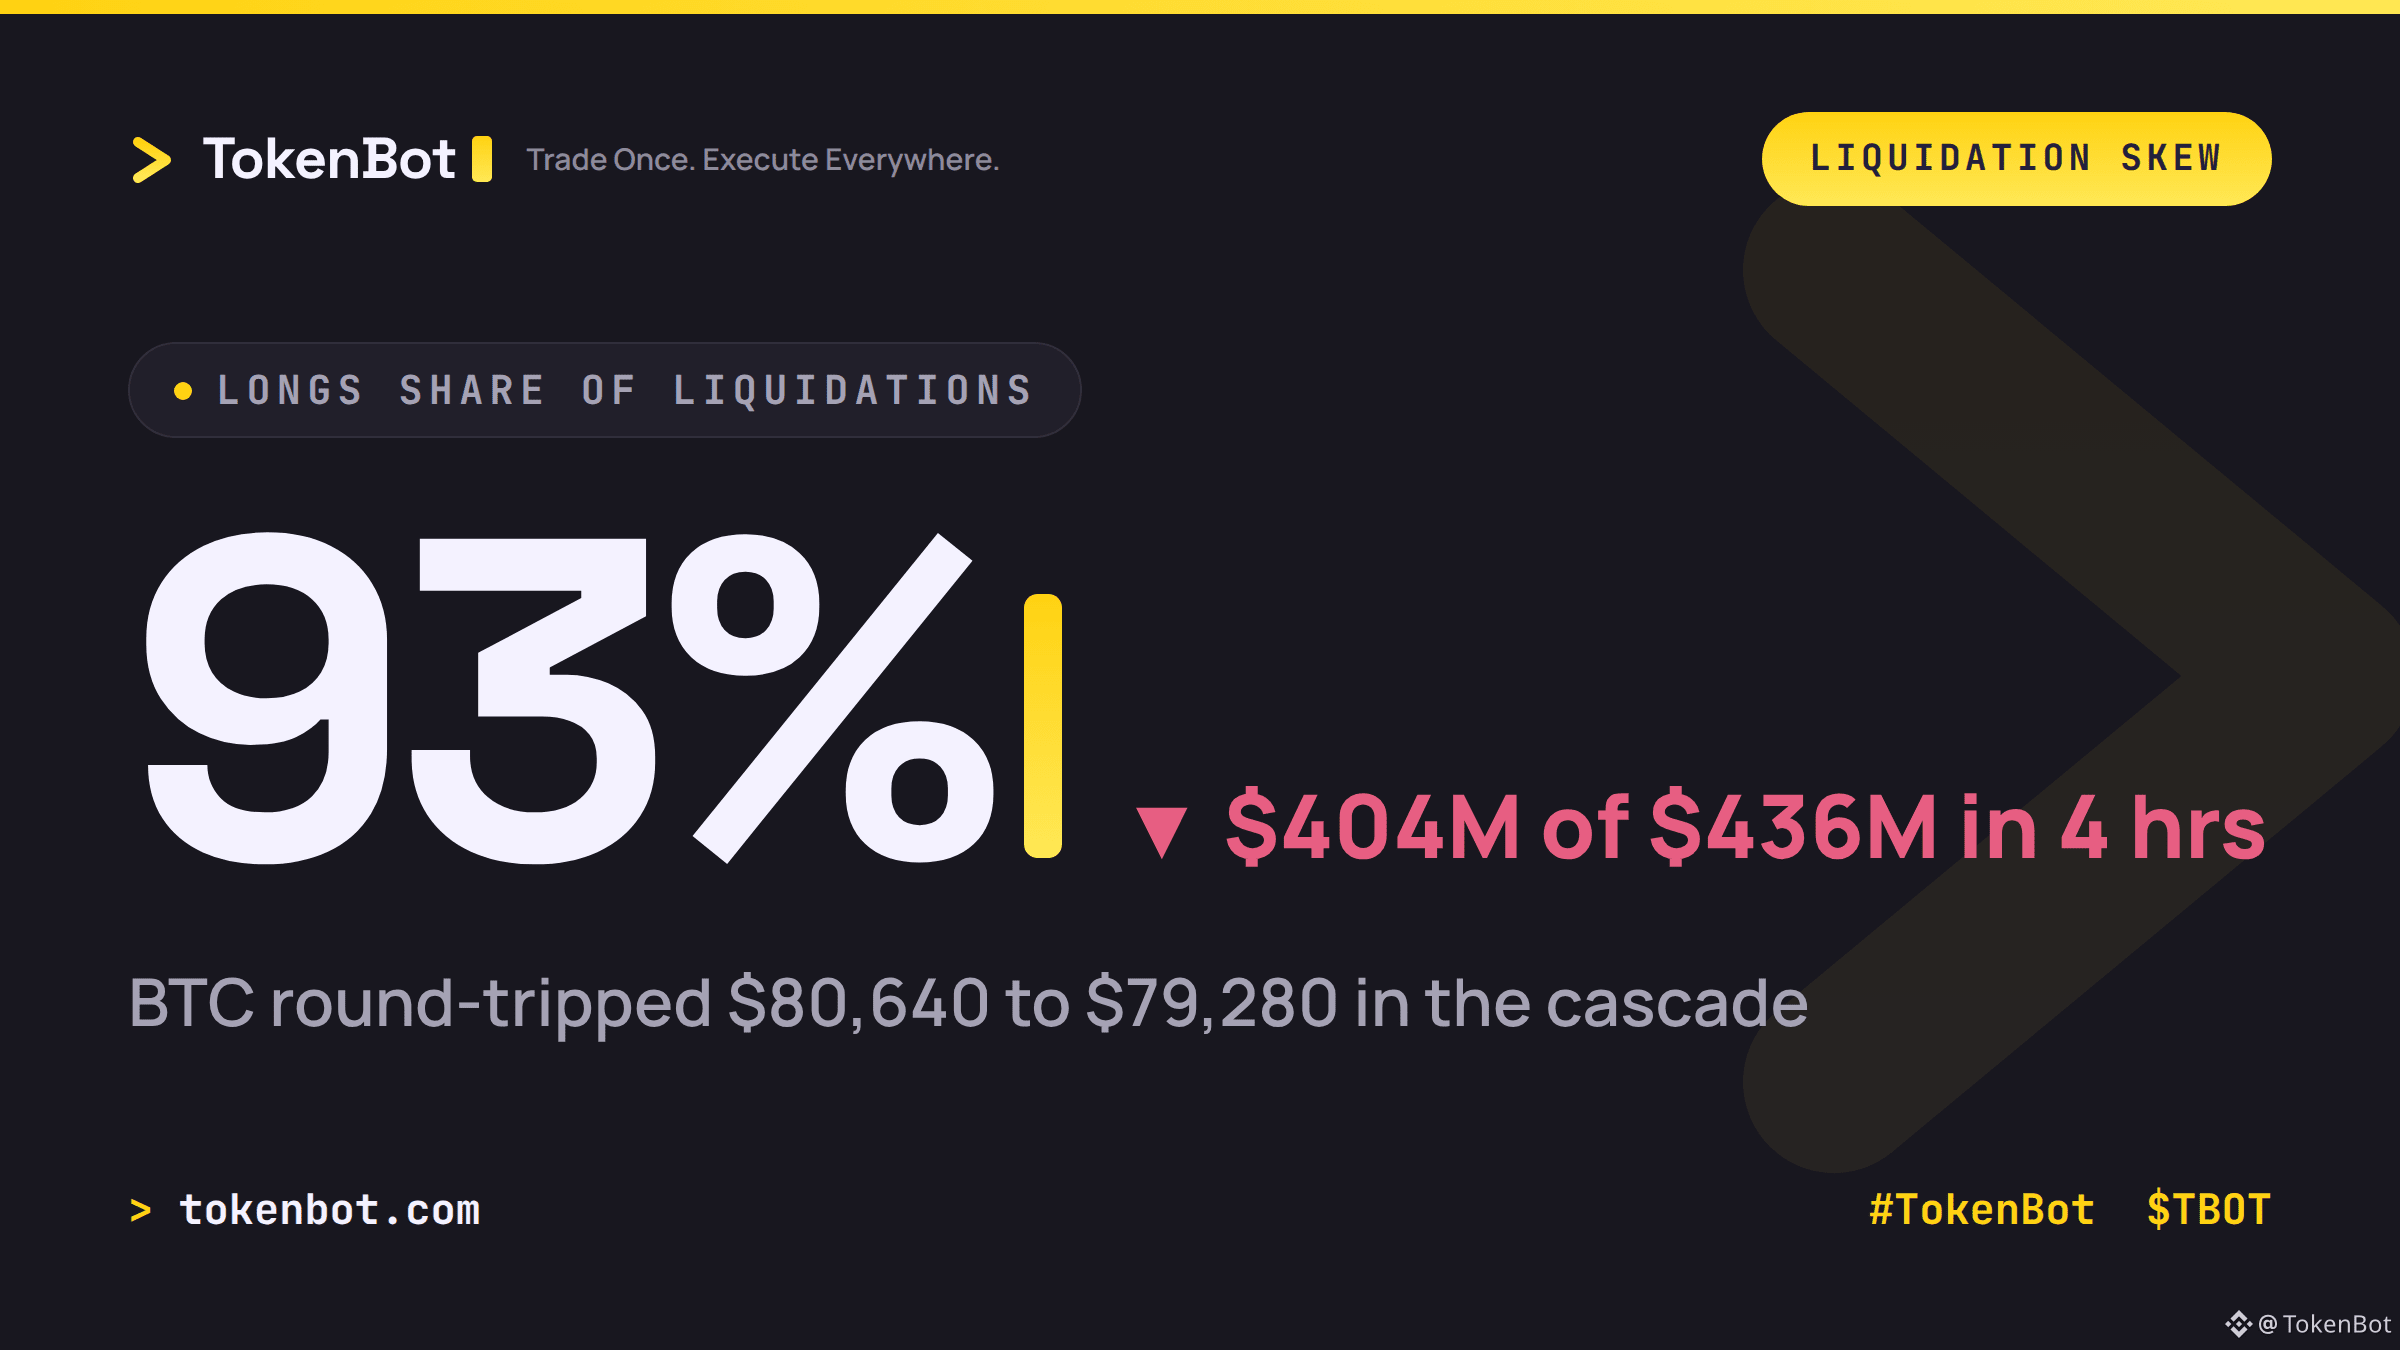
Longs took $404M of the $436M liquidated in the last four hours — a 93% one-sided wipeout, per CoinGlass. Bitcoin briefly slipped below $80,000, round-tripping from $80,640 to $79,280 before climbing back to $80,138. $208M of that total vanished in a single 15-minute window as the drop accelerated.
That kind of lopsided liquidation data is usually the cleanest tell for where leverage was stacked — traders who bought the bounce got caught on the wrong side when the floor gave way. A cascade like that also moves faster than most single order books can absorb.
If you're running algo strategies through moments like this, how wide is your liquidation buffer set against a four-hour, one-directional wipeout? Trade once, execute everywhere — tokenbot.com syncs the order across 25+ exchanges instead of leaving you exposed on one.
$BTC $TBOT #Bitcoin #TradingSignals #TokenBot
8
·
--
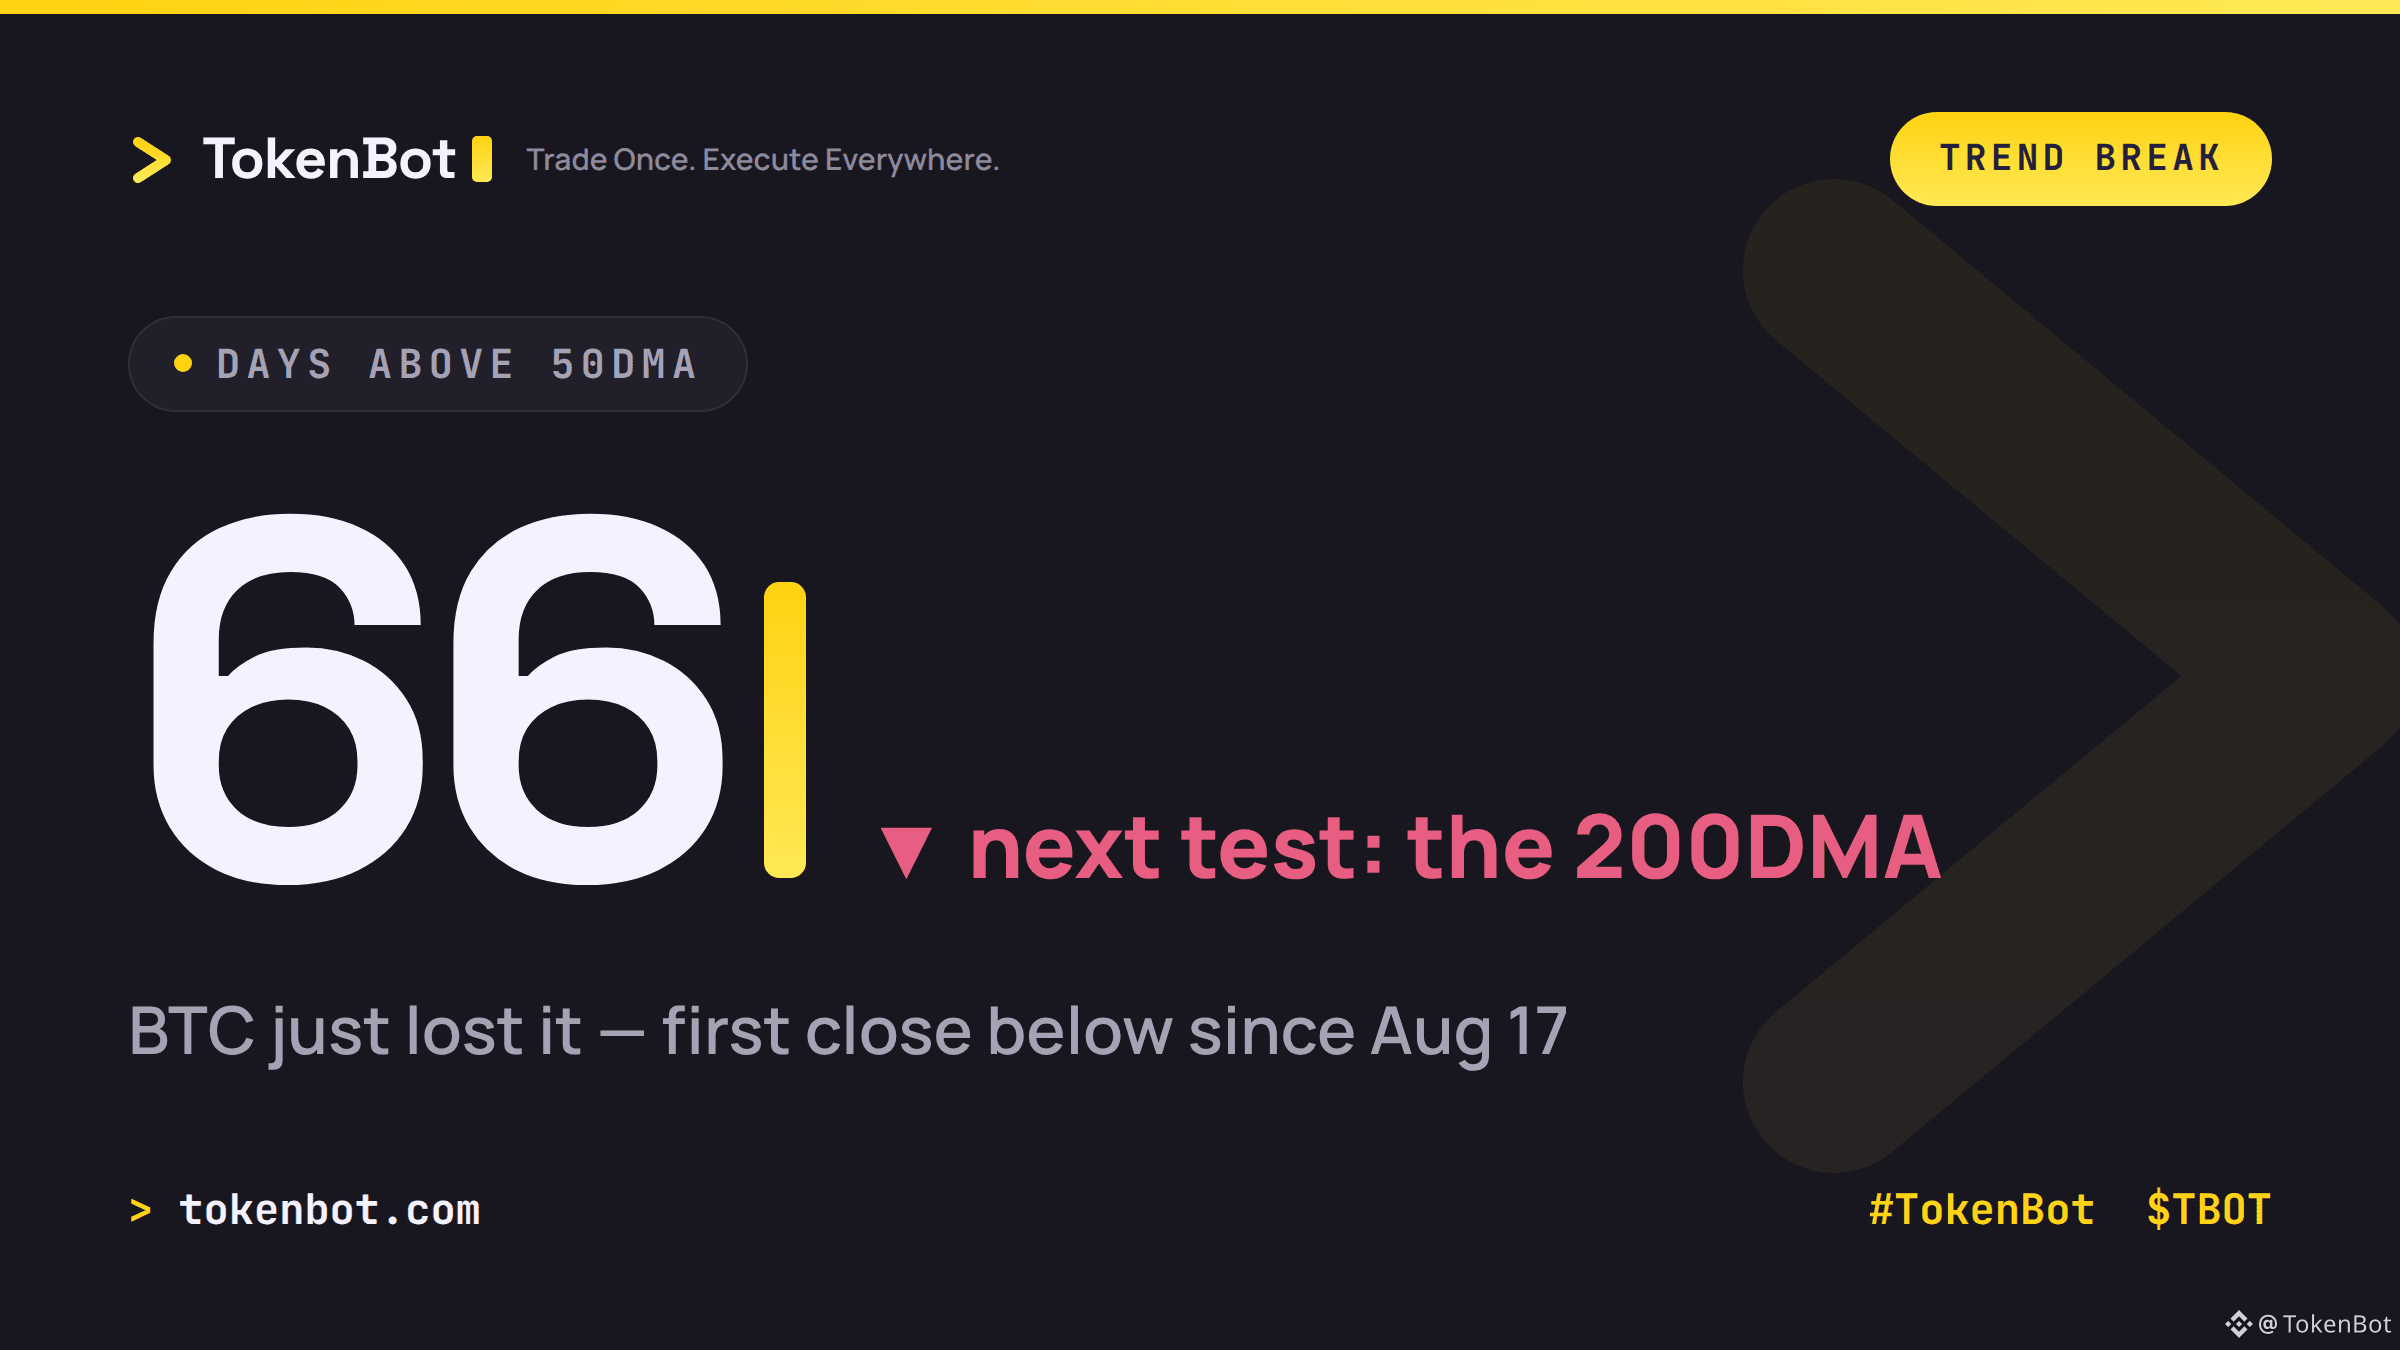
BTC just closed below its 50-day moving average for the first time since August 17 — snapping a 66-day streak above that line.
For two months, the 50DMA was the floor. Every dip since summer got bought right at it. Now that it's broken, the mechanical flow flips: trend-following desks that were long on that signal are the ones getting stopped out, which is part of why longs have been taking the brunt of today's liquidations. Spot is still holding roughly 10% above the 200-day average, so that's the next line that actually matters if this isn't just a shakeout.
Curious how systematic desks are handling it — hard stop on the 50DMA flip, or waiting for a confirmed close under the 200 before treating this as trend change rather than noise?
Executing that kind of exit cleanly across venues at once (not tab by tab) is exactly the problem TokenBot is built for. tokenbot.com
#TokenBot #Bitcoin #TradingSignals $BTC $TBOT
1
·
--
Pepe is up 13% today. Bitcoin barely moved, +0.5% to $81,700. Memecoins are doing all the work on this bounce, not BTC itself.
Underneath it, the leverage tape reset clean: BTC perpetual funding compressed to roughly 7.1% annualized and ETH to 5.2%, both clearing into today's options expiry. That's traders unwinding stale longs and shorts before expiry, not a fresh wave of conviction buying. The CoinDesk altcoin-season gauge ticked up to 58/100 from the week's low of 54, but that's a small move off a clean slate, not a trend confirmed.
Worth asking: is this early rotation capital genuinely moving into alts, or is it just small-cap beta bouncing harder once leverage got flushed out? Watch whether Pepe-style names keep outrunning BTC once funding normalizes — that's the tell.
#Bitcoin #Crypto #TradingSignals #TokenBot $BTC $TBOT
tokenbot.com

117
·
--
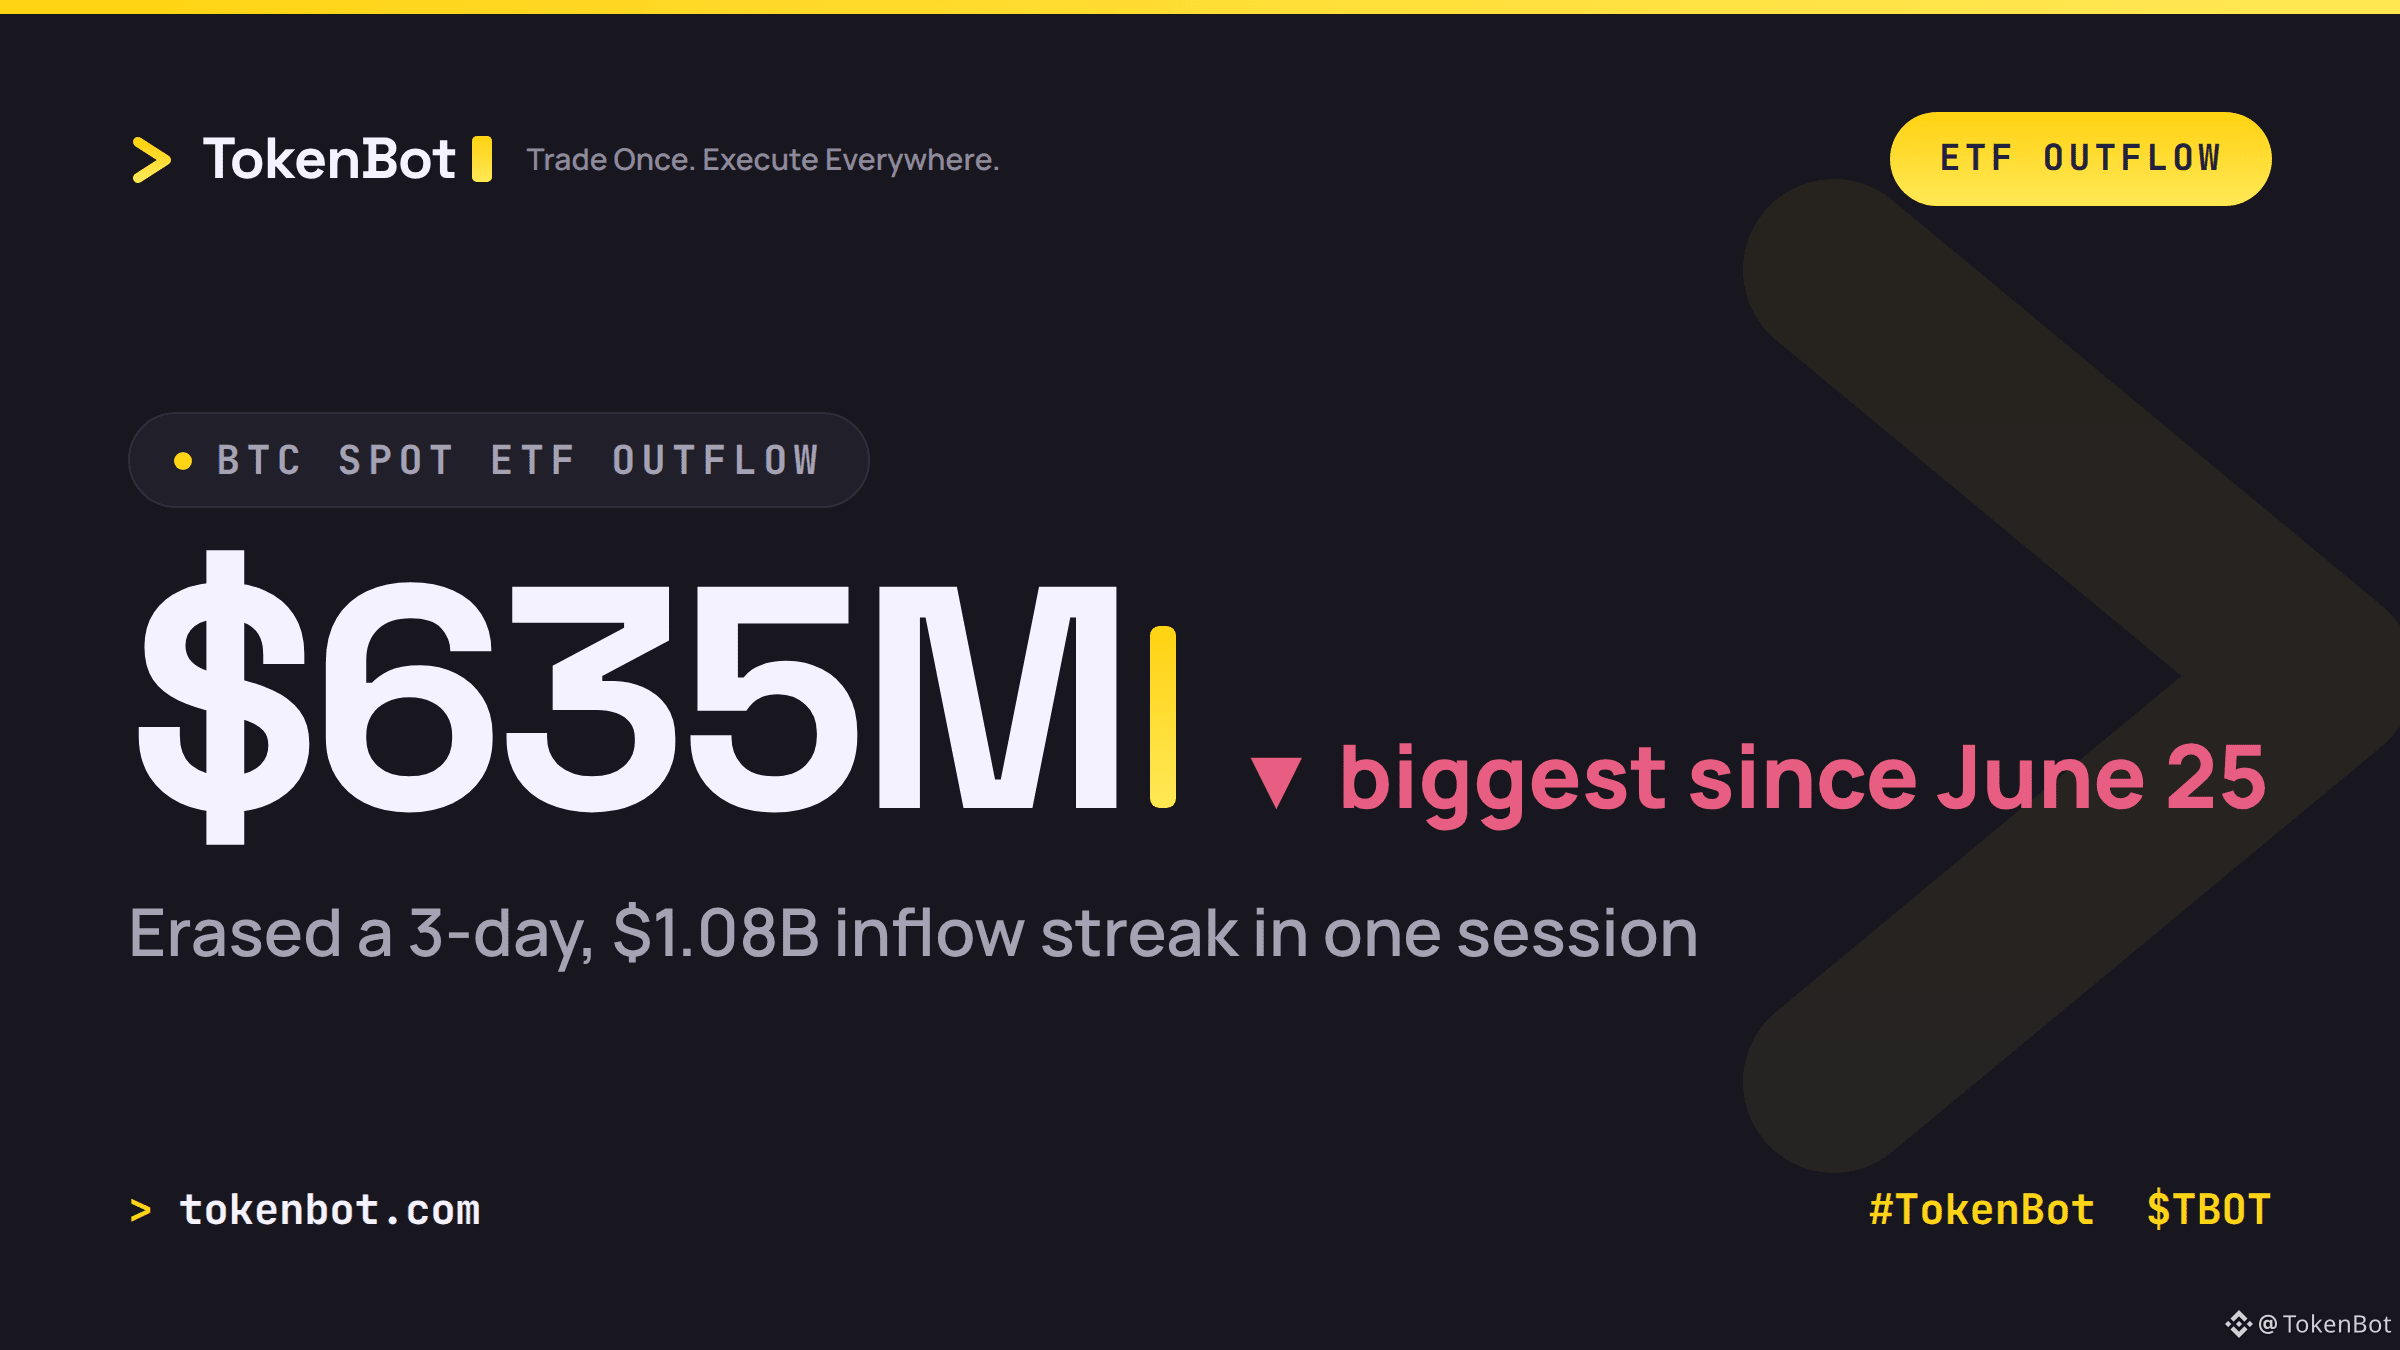
Bitcoin spot ETFs just posted their biggest single-day outflow since June 25: $635M out on Thursday, wiping out a three-day streak that had pulled in $1.08B. IBIT led the exits at $254M, FBTC gave back $217M, ARKB lost $109M. Ethereum ETFs bled another $110M on top of that.
The trigger wasn't on-chain. Tesla cut its spending forecast, the Nasdaq closed down 2.6%, and the selloff spilled straight into crypto overnight — BTC slipped toward $80,989 and exchanges forcibly unwound roughly $431M in leveraged long positions.
Three days of institutional buying erased in a single session is a good reminder of how thin the conviction still is above $80K. When equities sneeze, leveraged crypto longs are still first to catch the cold.
If BTC's correlation to the Nasdaq keeps climbing like this, does "digital gold" mean anything this cycle? Trade once, execute everywhere — tokenbot.com
#TokenBot #Bitcoin #Crypto #TradingSignals $BTC $ETH $TBOT
230
·
--
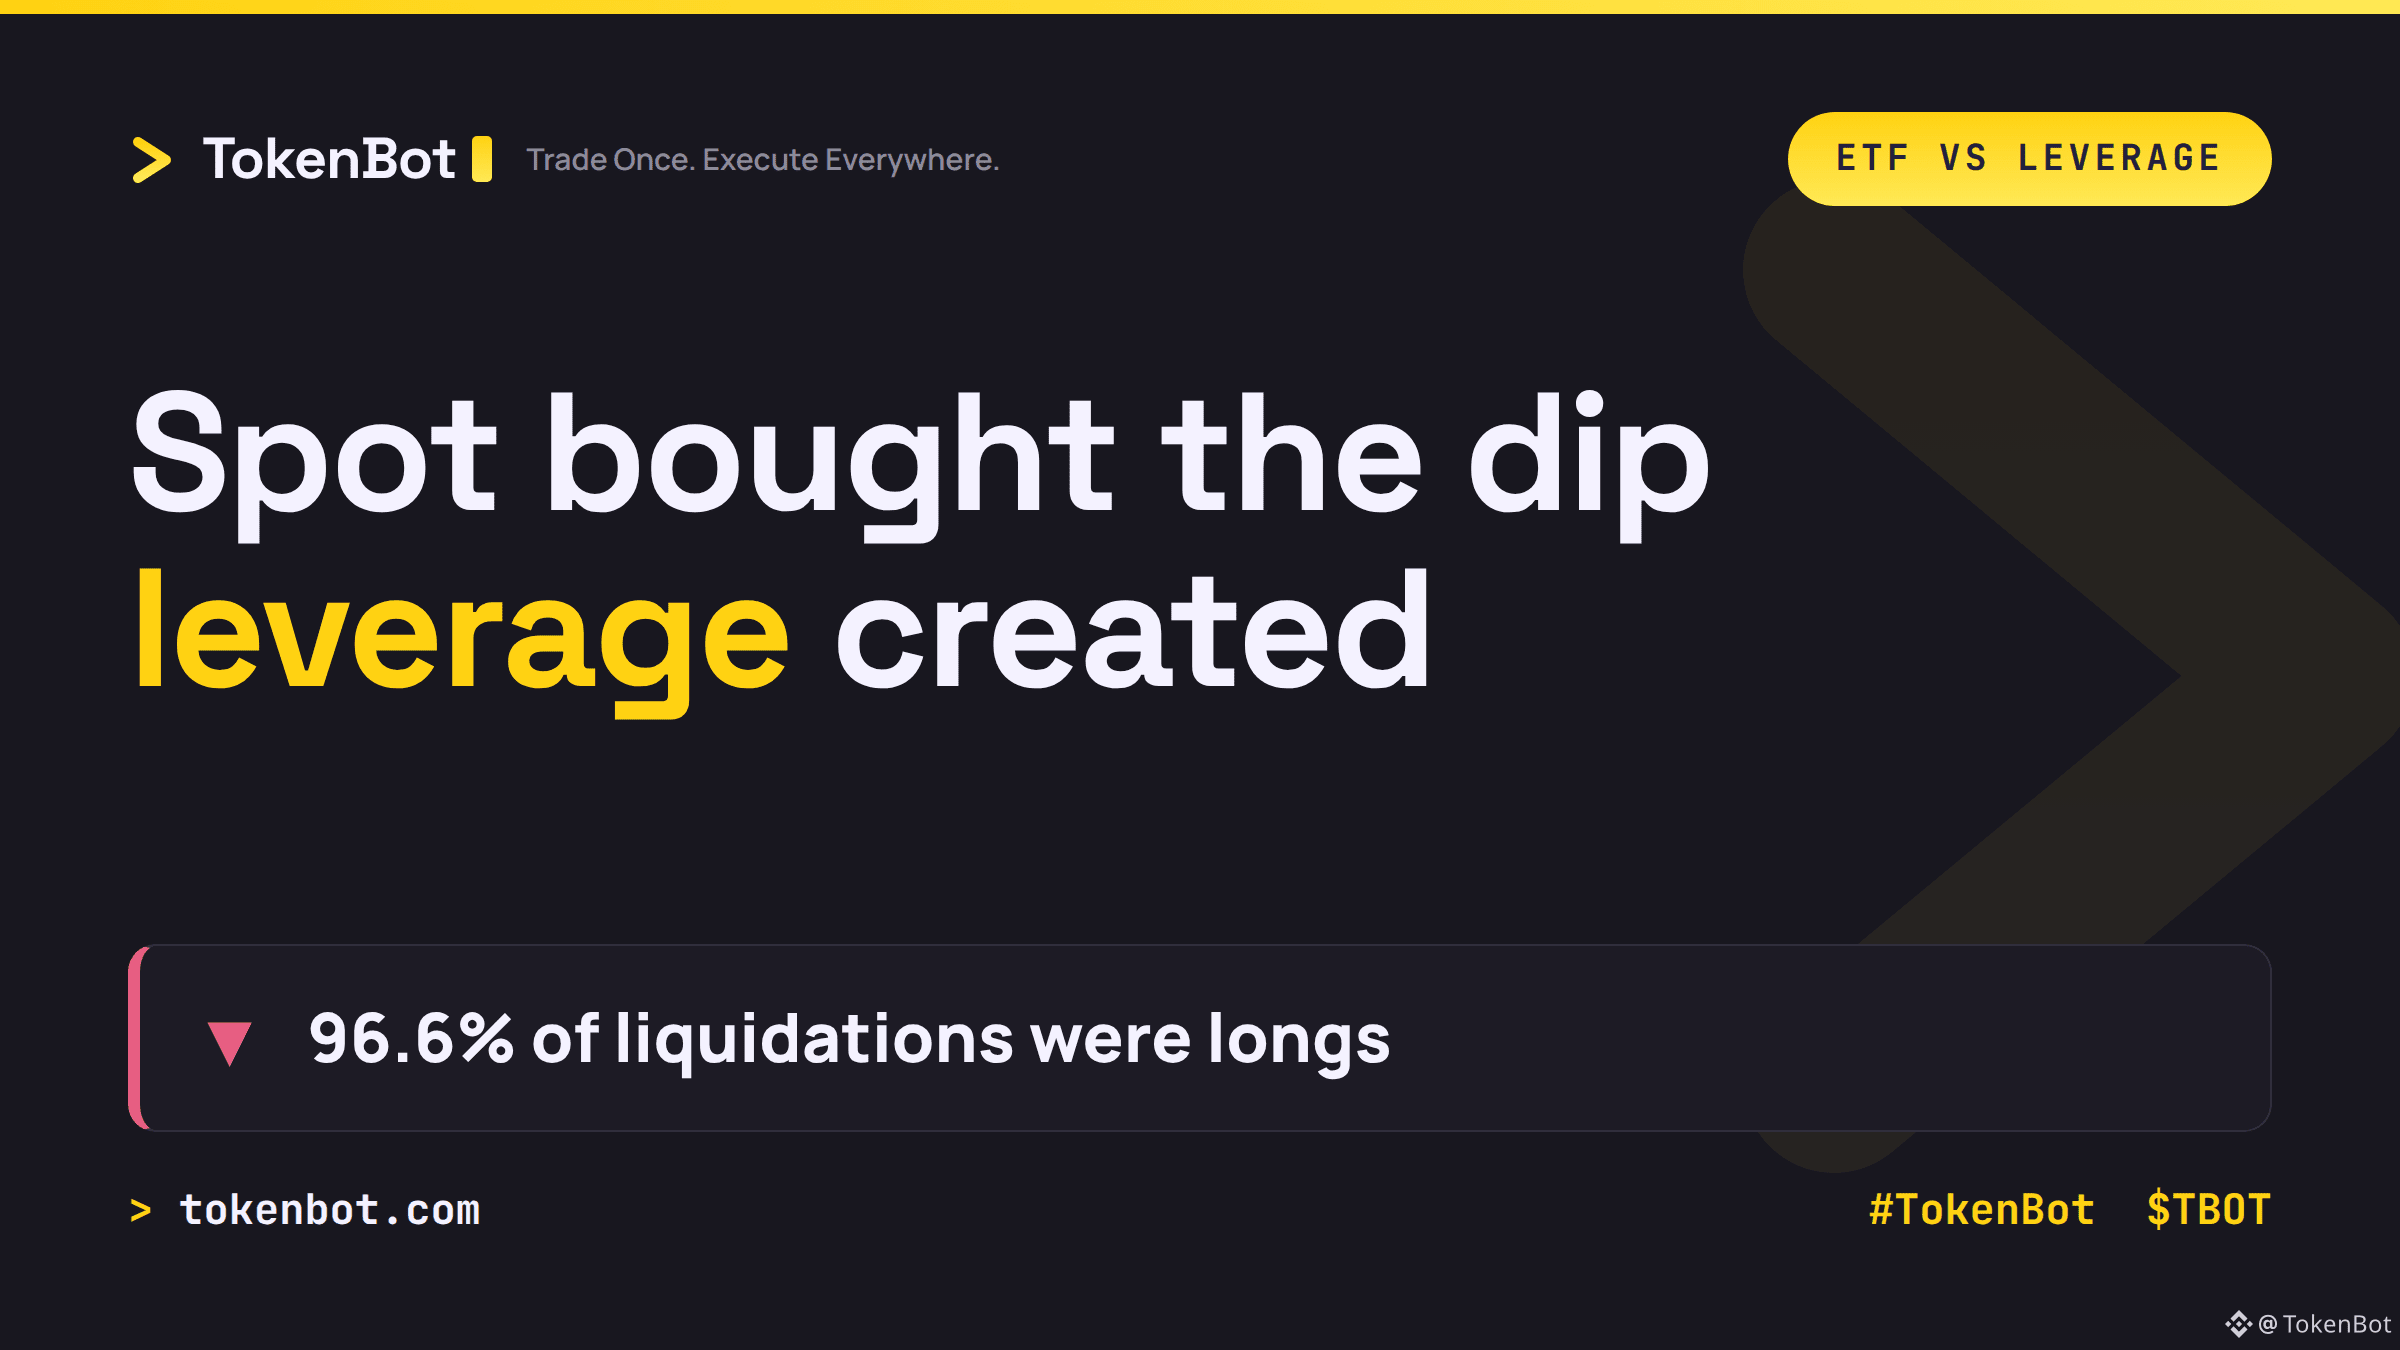
Spot BTC ETFs pulled in $524.8M on Wednesday, with BlackRock's IBIT and Fidelity's FBTC accounting for over 85% of it. A few hours later, $140M in BTC longs got liquidated — 96.6% of that was leverage getting flushed, not spot selling.
Two completely different books trading the same price. Authorized participants are quietly accumulating through the ETF wrapper while the perp market punishes anyone who tried to lever the same move. That's the split that matters right now: spot demand hasn't gone anywhere, but leverage keeps getting run over on every pullback.
Funding on BTC perps is still sitting around +7.8% annualized, meaning longs are still paying to stay positioned even after getting flushed. For anyone running basis or carry strategies — how much more of a squeeze does it take before that funding print goes negative?
#TokenBot #Bitcoin #CryptoTrading $BTC $TBOT
tokenbot.com
194
·
--
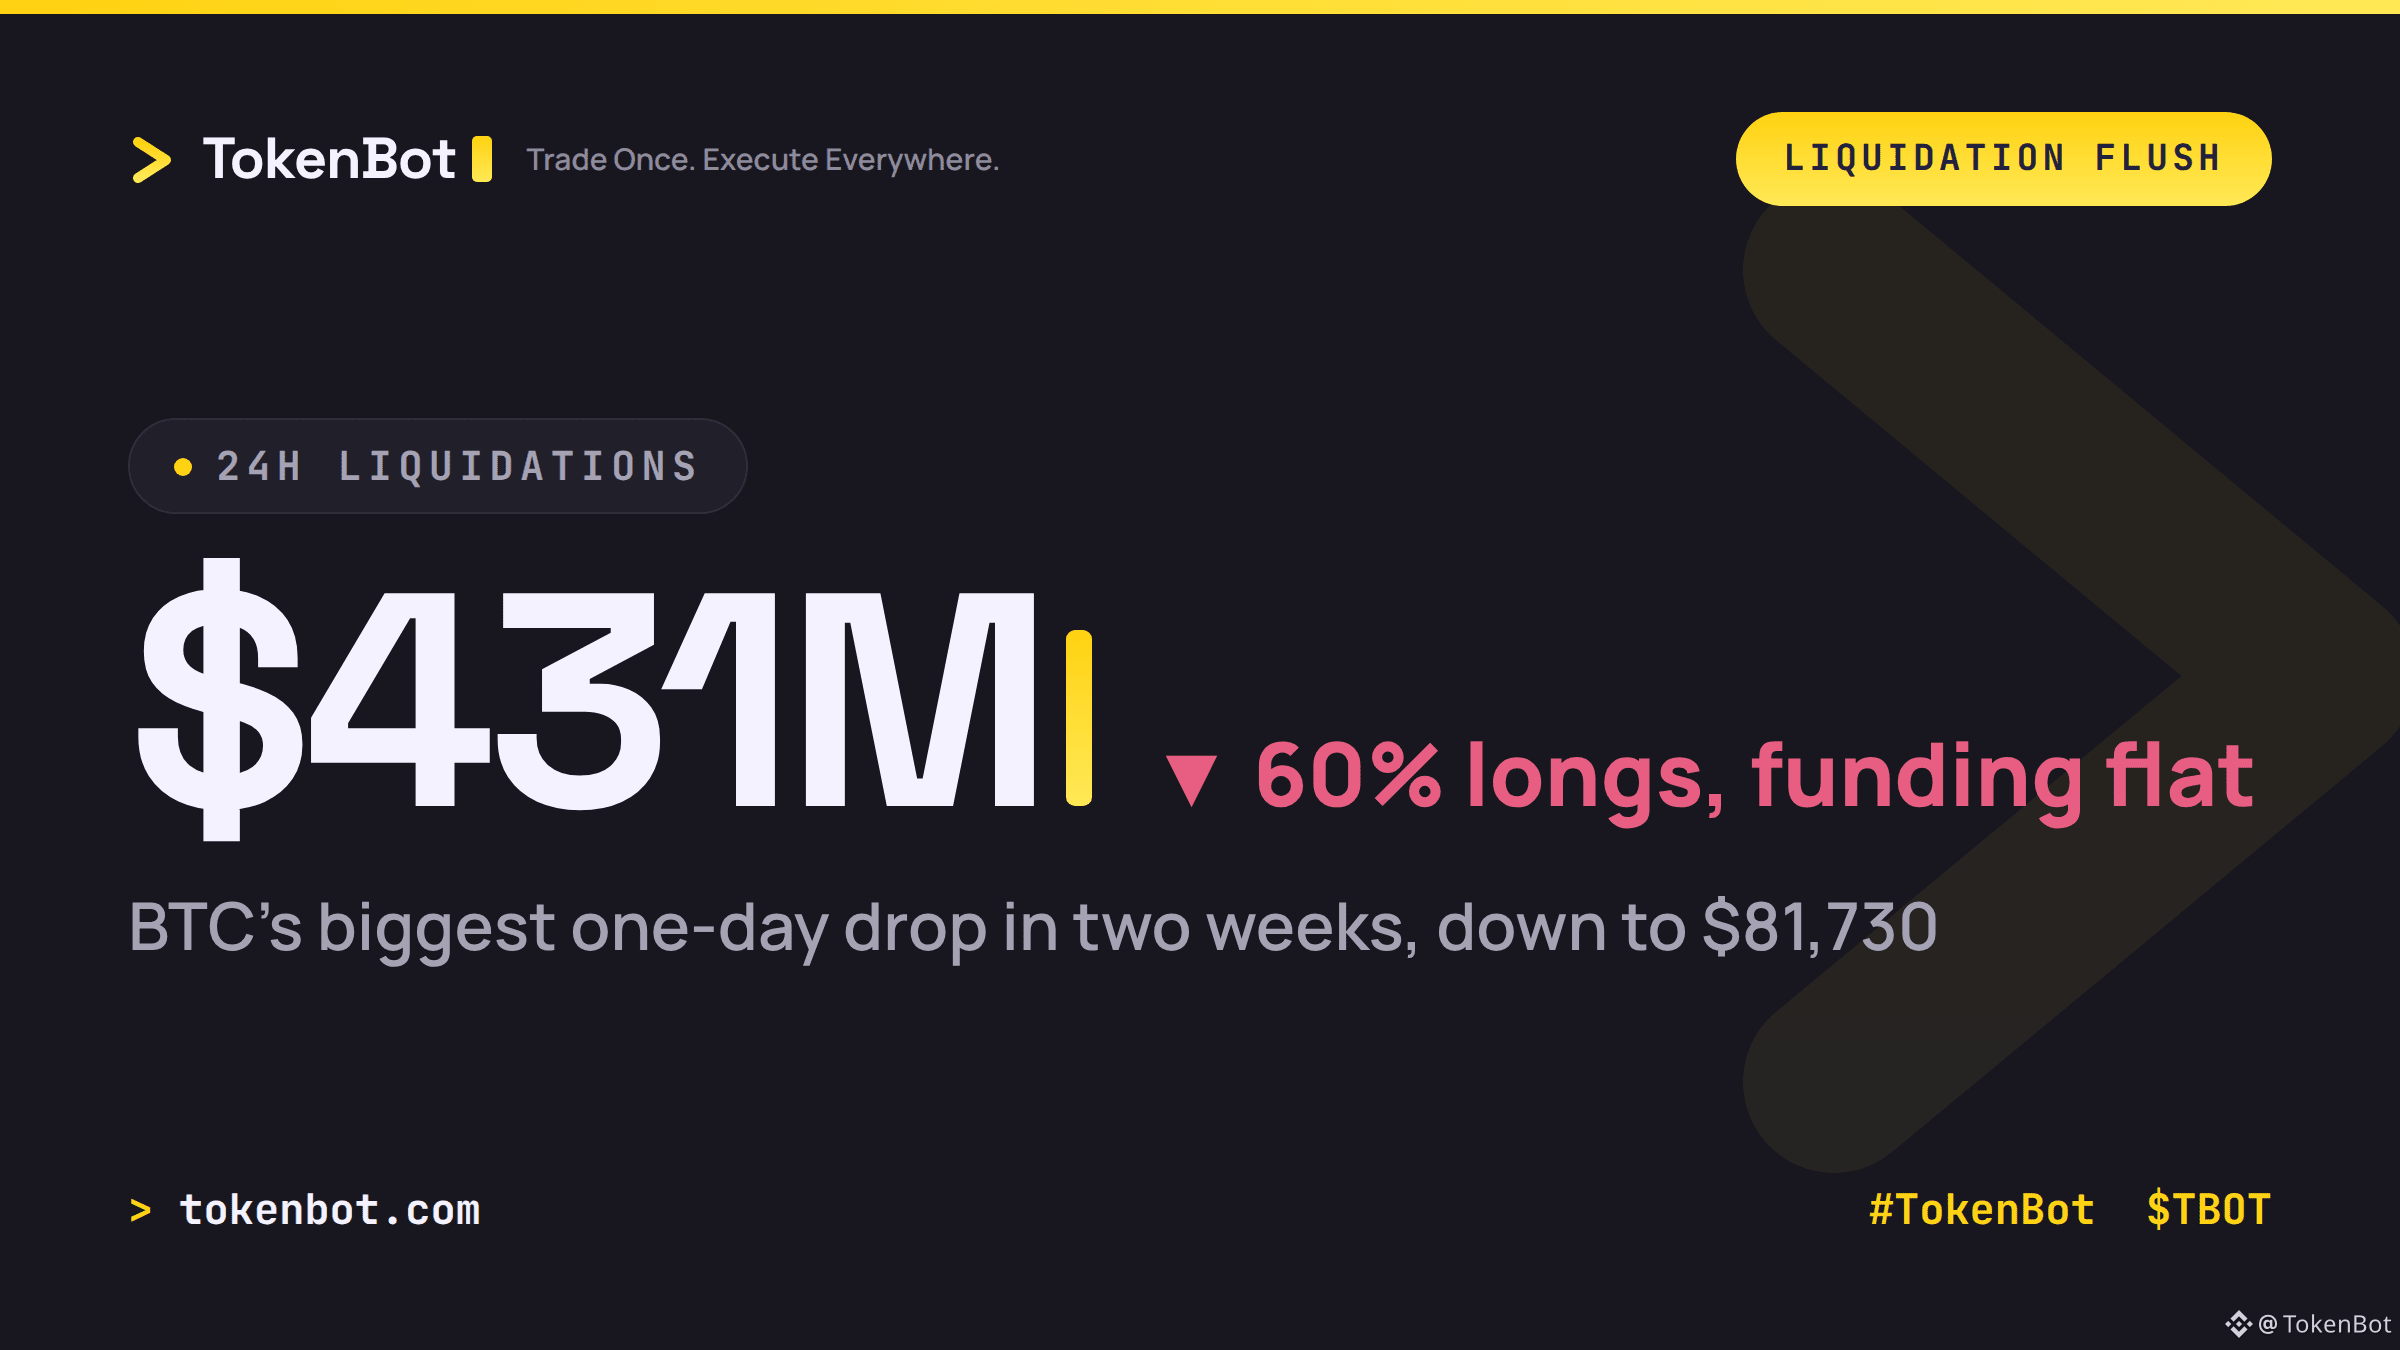
BTC just had its biggest one-day drop in two weeks, sliding to $81,730 as hot US inflation data and oil above $111/barrel spooked risk assets broadly — tech and crypto sold off together.
The liquidation data is the interesting part: $431M got wiped out in 24h, about 60% longs. Normally a liquidation spike that size means a crowded trade unwinding. Not this time — funding going in was barely positive and open interest barely moved. That combination (flat funding, flat OI, big liquidations) points to a macro-driven flush of weak hands on thin liquidity, not leverage excess finally breaking.
Worth watching whether funding stays flat as price tries to stabilize — if it does, this was noise. If funding flips negative on the bounce, that's a different story.
How are you reading it — macro flush or something building underneath?
#Bitcoin #Crypto #TradingSignals #TokenBot $BTC $TBOT
tokenbot.com
99
·
--
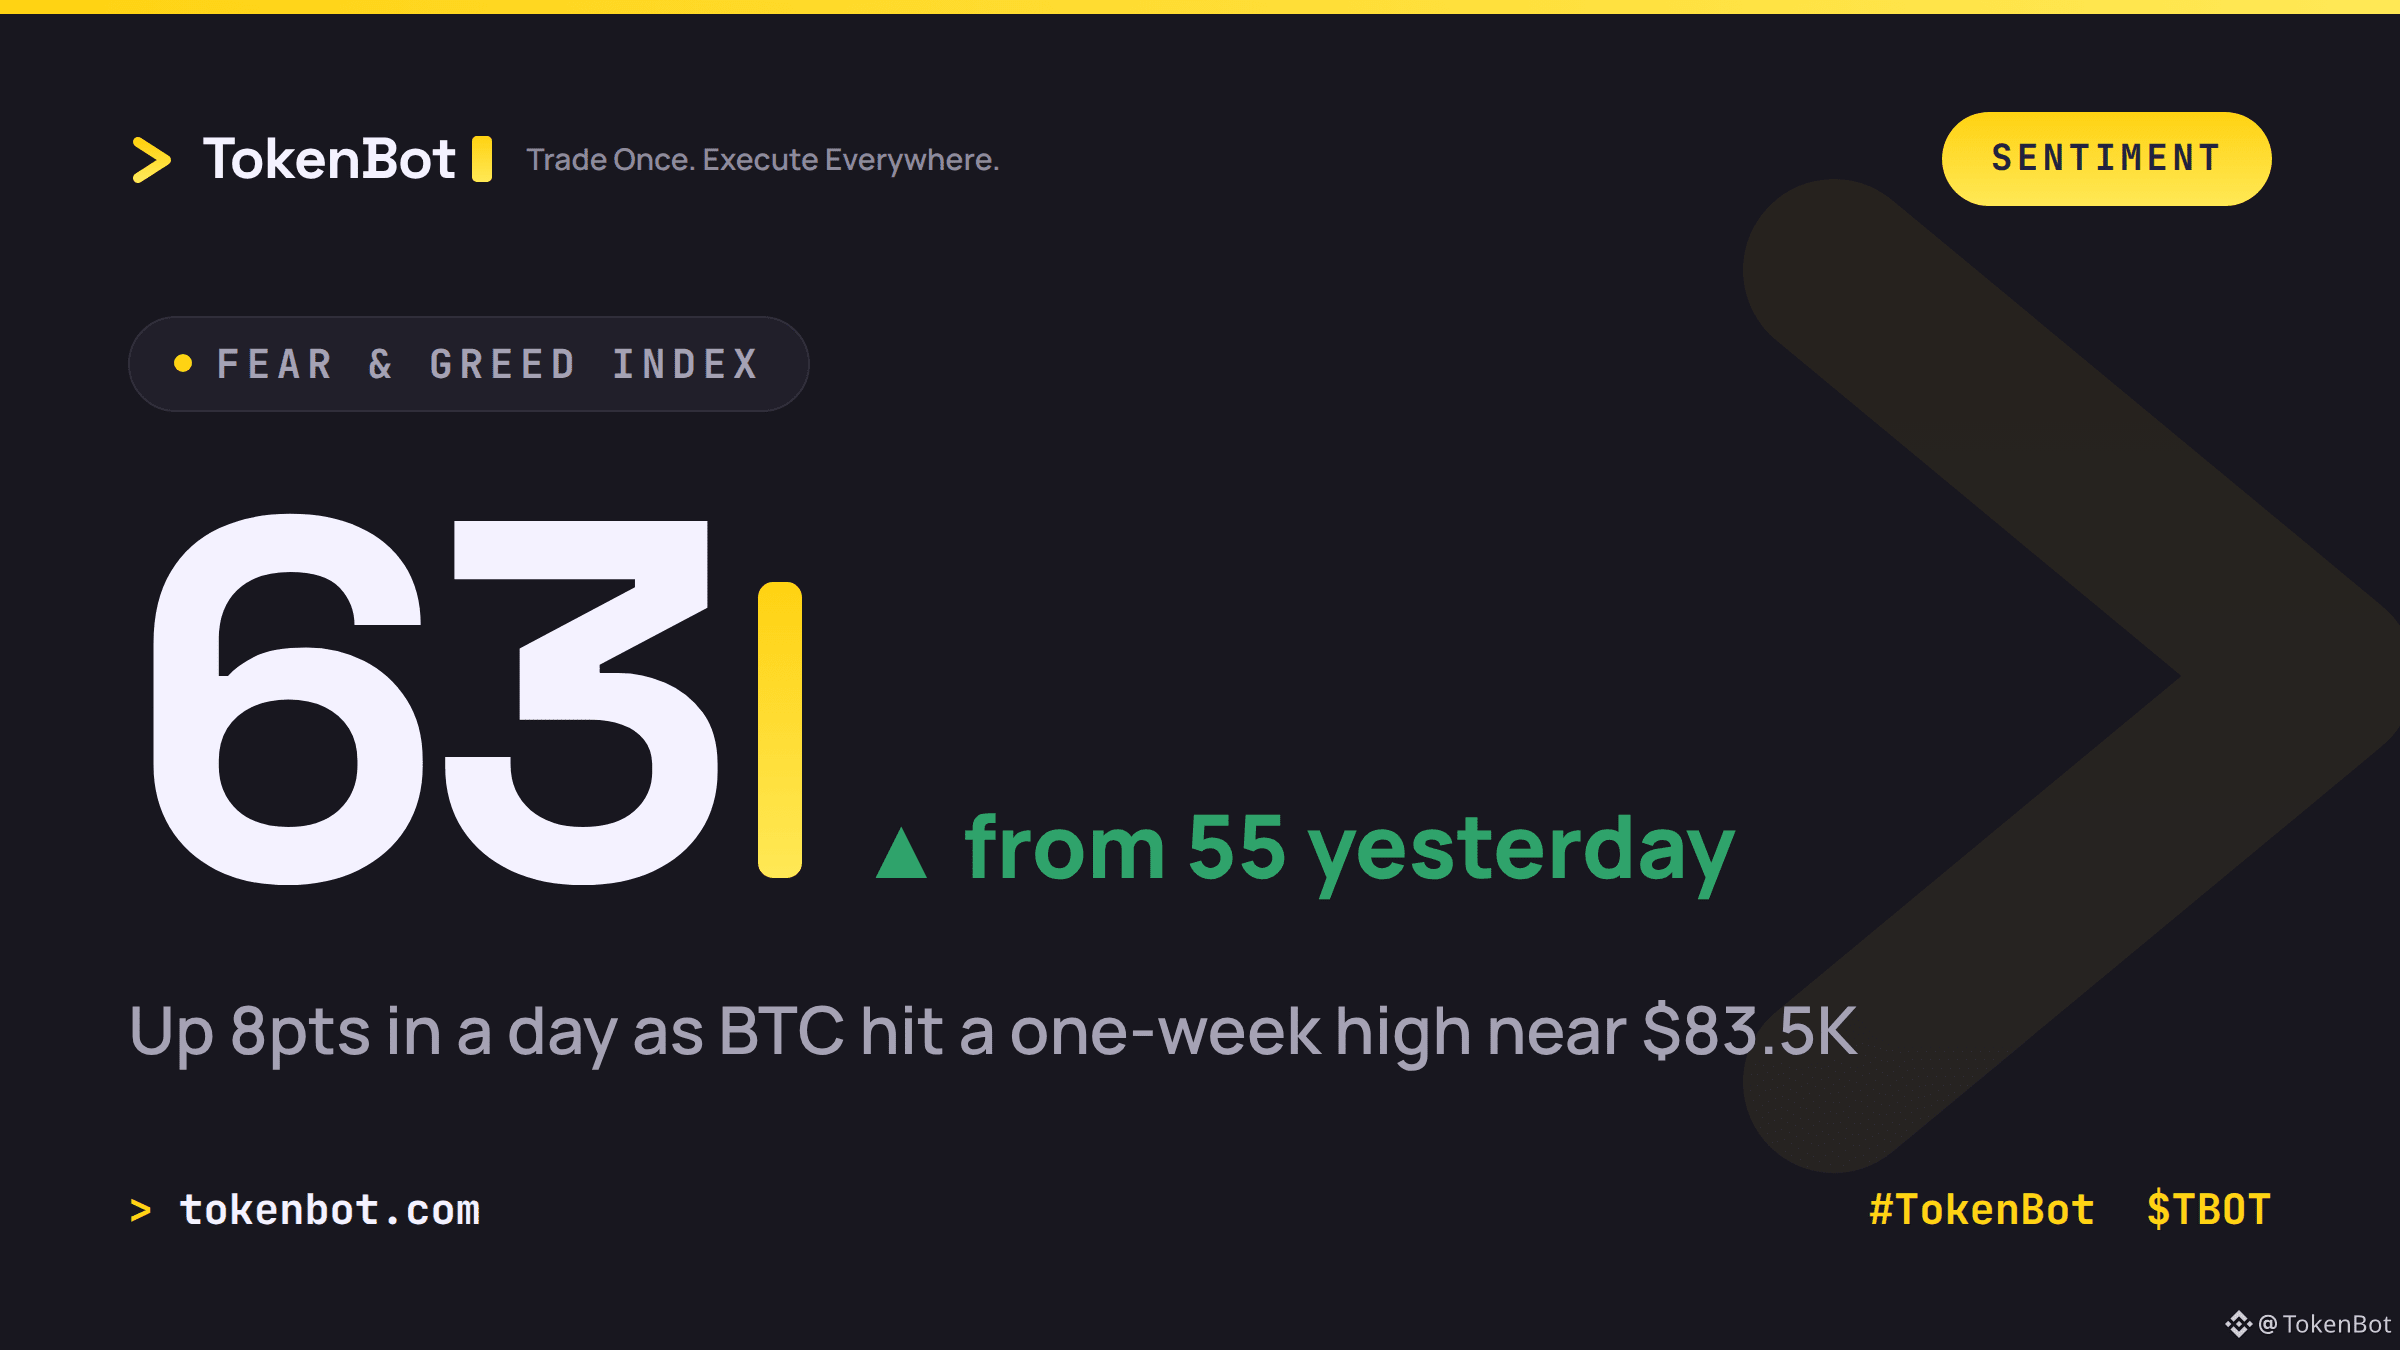
Crypto Fear & Greed jumped 8 points in a single day, 55 to 63, still in "greed" territory but accelerating fast. BTC rode the same wave, up about 2.5% to a one-week high near $83.5K.
Here's the part worth noting: the move wasn't driven by anything crypto-native. It tracked a risk-on session in equities, led by strong SpaceX and Supermicro earnings. No ETF catalyst, no on-chain trigger, no exchange news — just BTC trading as a high-beta tech proxy again.
That correlation cuts both ways. When sentiment is imported from equity earnings instead of generated inside crypto, it can unwind just as fast on the next weak print. For anyone running systematic books: are you treating days like this as a signal to lean in, or as noise to filter out?
#TokenBot #Bitcoin #TradingSignals $BTC $TBOT
tokenbot.com
95
·
--
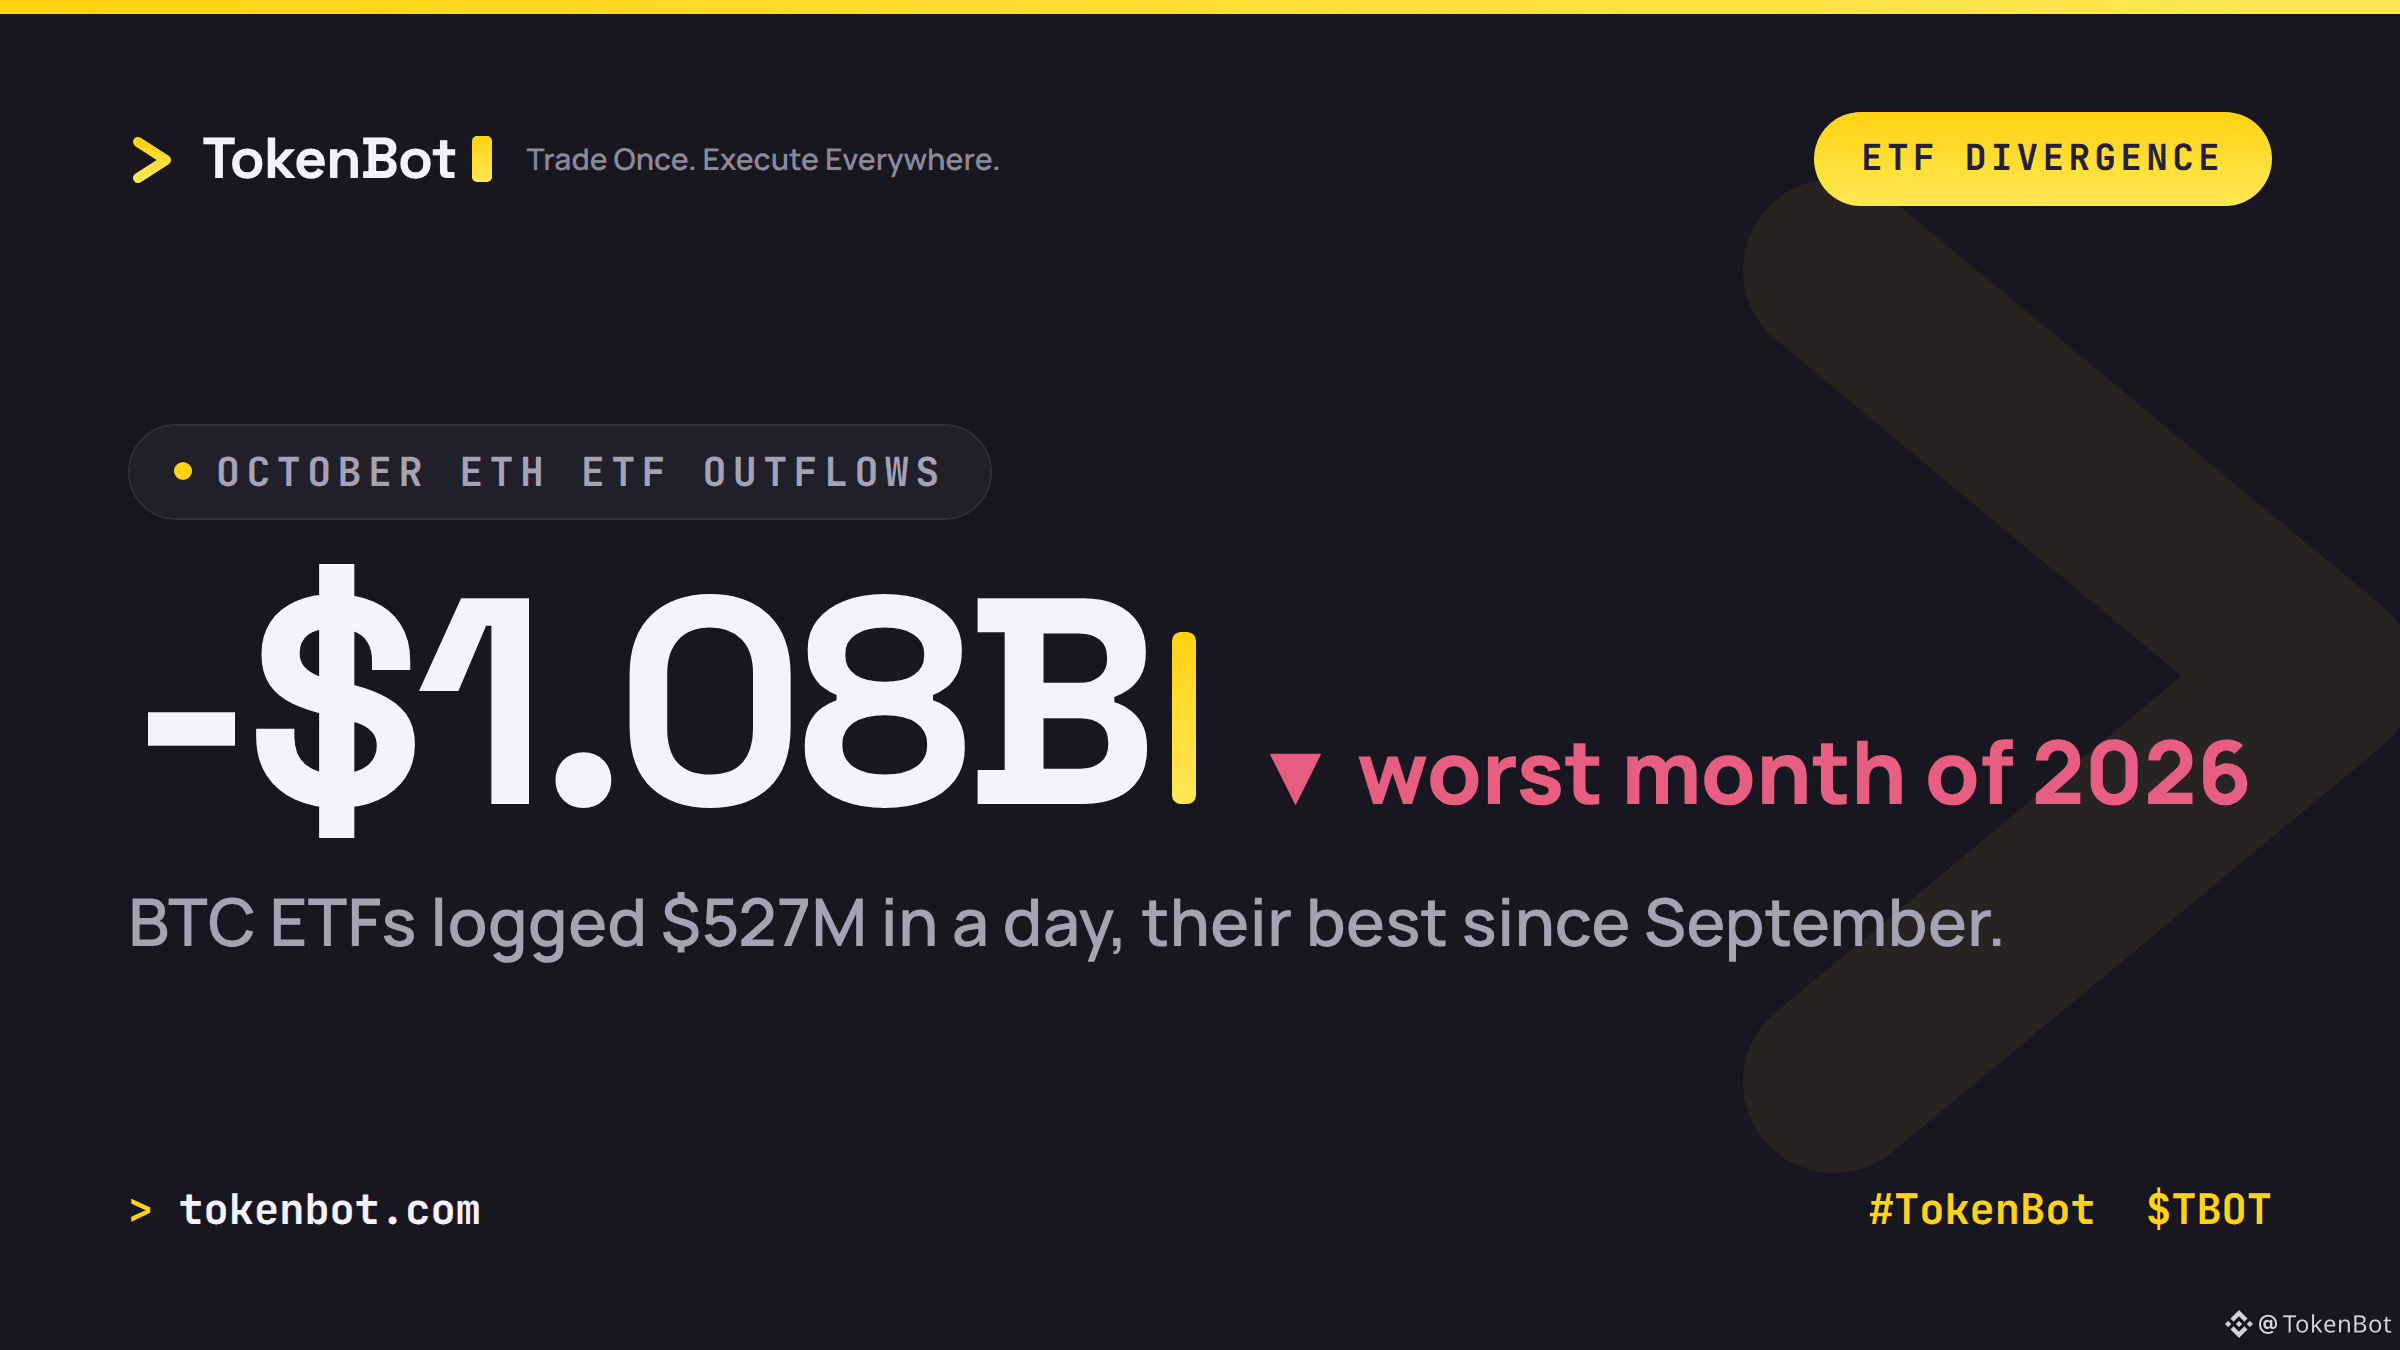
US spot ETH ETFs have shed $1.08B in October, the worst monthly outflow since the funds launched, per SoSoValue data. Meanwhile BTC ETFs just logged $527M in a single day on Monday, the strongest inflow day since September.
Same Fed meeting ahead (Oct 27-28), same macro backdrop, completely opposite flows. Reads like a rotation: capital exiting ETH staking yield and parking in spot BTC as the cleaner institutional hedge going into the decision. ETH is down roughly 9.7% on the month, so the price action is tracking the redemptions pretty closely.
If that rotation holds through the FOMC, does ETH/BTC keep grinding lower, or is this outflow print already the capitulation point?
#Bitcoin #Ethereum #TradingSignals #TokenBot $BTC $ETH $TBOT
tokenbot.com
324
·
--
BTC is wedged between its 50-day moving average at $81,481 below and its 20-day at $83,242 above — the tightest range in weeks. Normally that kind of compression gets blamed on leverage, but funding's still sitting negative, so this isn't a long squeeze unwinding.
The actual driver is oil. Brent crude just broke $111 a barrel, a five-month high, after Houthi strikes on Saudi infrastructure and reports of vessel attacks near the Strait of Hormuz. Bitcoin has been trading in loose step with risk assets this month — when oil spikes on conflict headlines, crypto sells off alongside equities as traders cut exposure, not because anyone's chasing a crypto-specific catalyst.
That makes this a macro story wearing a crypto chart. Which side resolves the range first — a clean break of one of those moving averages, or a de-escalation (or escalation) headline out of the Gulf?
#Bitcoin #Crypto #TradingSignals #TokenBot $BTC $TBOT
tokenbot.com

382
·
--
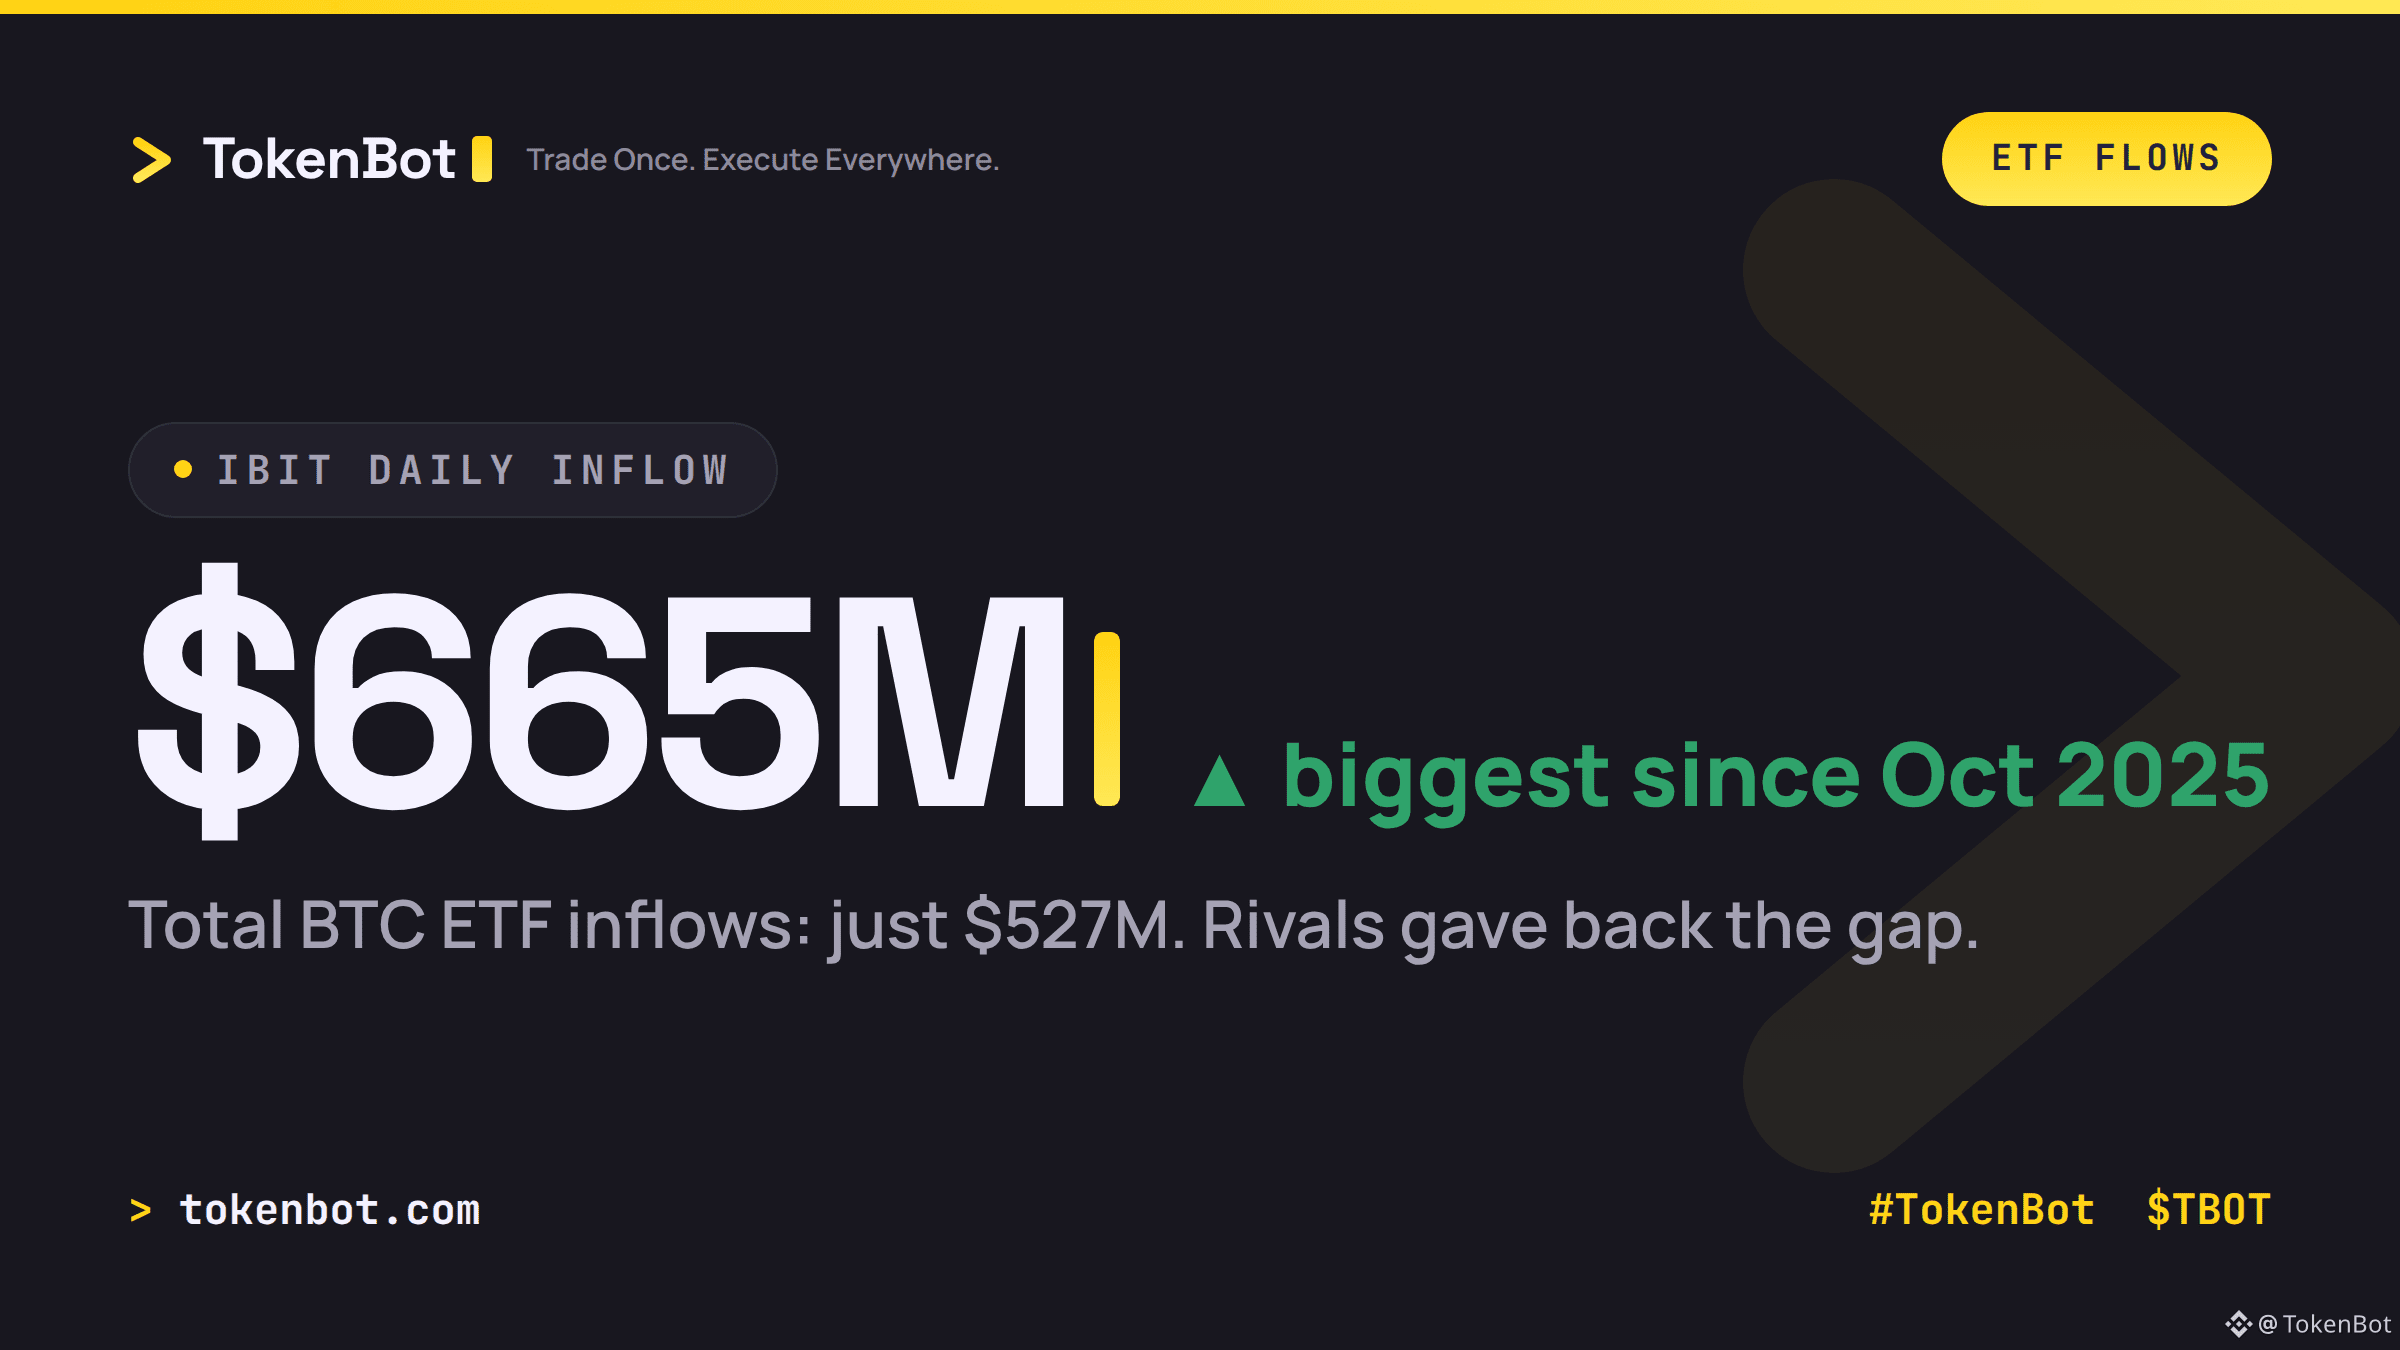
BlackRock's IBIT pulled in $665M in a single day — its biggest inflow since October 2025.
Here's the catch: total bitcoin ETF inflows across every issuer were only $527M (via @FarsideUK). That means the rest of the field — Fidelity, Grayscale, and the smaller wrappers — handed back roughly $138M combined the same day. The headline makes it look like fresh capital is flooding in. The fund-level breakdown says something different: money rotating out of smaller ETFs and into IBIT, not new buyers showing up for the first time.
That distinction matters if you're reading ETF flows as a demand signal. Aggregate inflow and net new buying aren't the same thing, and the gap between IBIT's number and the total is exactly where that gets lost. Worth checking the fund-level split before trusting a "biggest inflow in a year" headline on its own.
How are you weighting single-fund flow data against the aggregate when they diverge like this?
#Bitcoin #TradingSignals #Crypto #TokenBot $BTC $TBOT
87
·
--
Crypto futures just threw up one of the more interesting divergences of the week. Over the last 24 hours, total futures trading volume jumped 51% to $146B — but open interest barely moved, up just 1.25% to $141B (via CoinDesk).
That gap matters more than it looks. When volume spikes but OI stays flat, it means positions are getting closed and reopened on both sides, not stacked. It's churn, not new money. Real trend continuation usually needs OI to climb alongside volume — when it doesn't, the move tends to be about flushing weak hands rather than starting a fresh one.
Worth watching whether OI starts catching up over the next day or two, or stays pinned while volume fades back down. That's what tells you whether this resolves into an actual trend or just resets positioning for the next leg.
How are you reading a volume/OI gap like this — fading it, or waiting for OI to confirm before taking a side?
#CryptoFutures #TradingSignals #TokenBot $BTC $TBOT
tokenbot.com

92
·
--
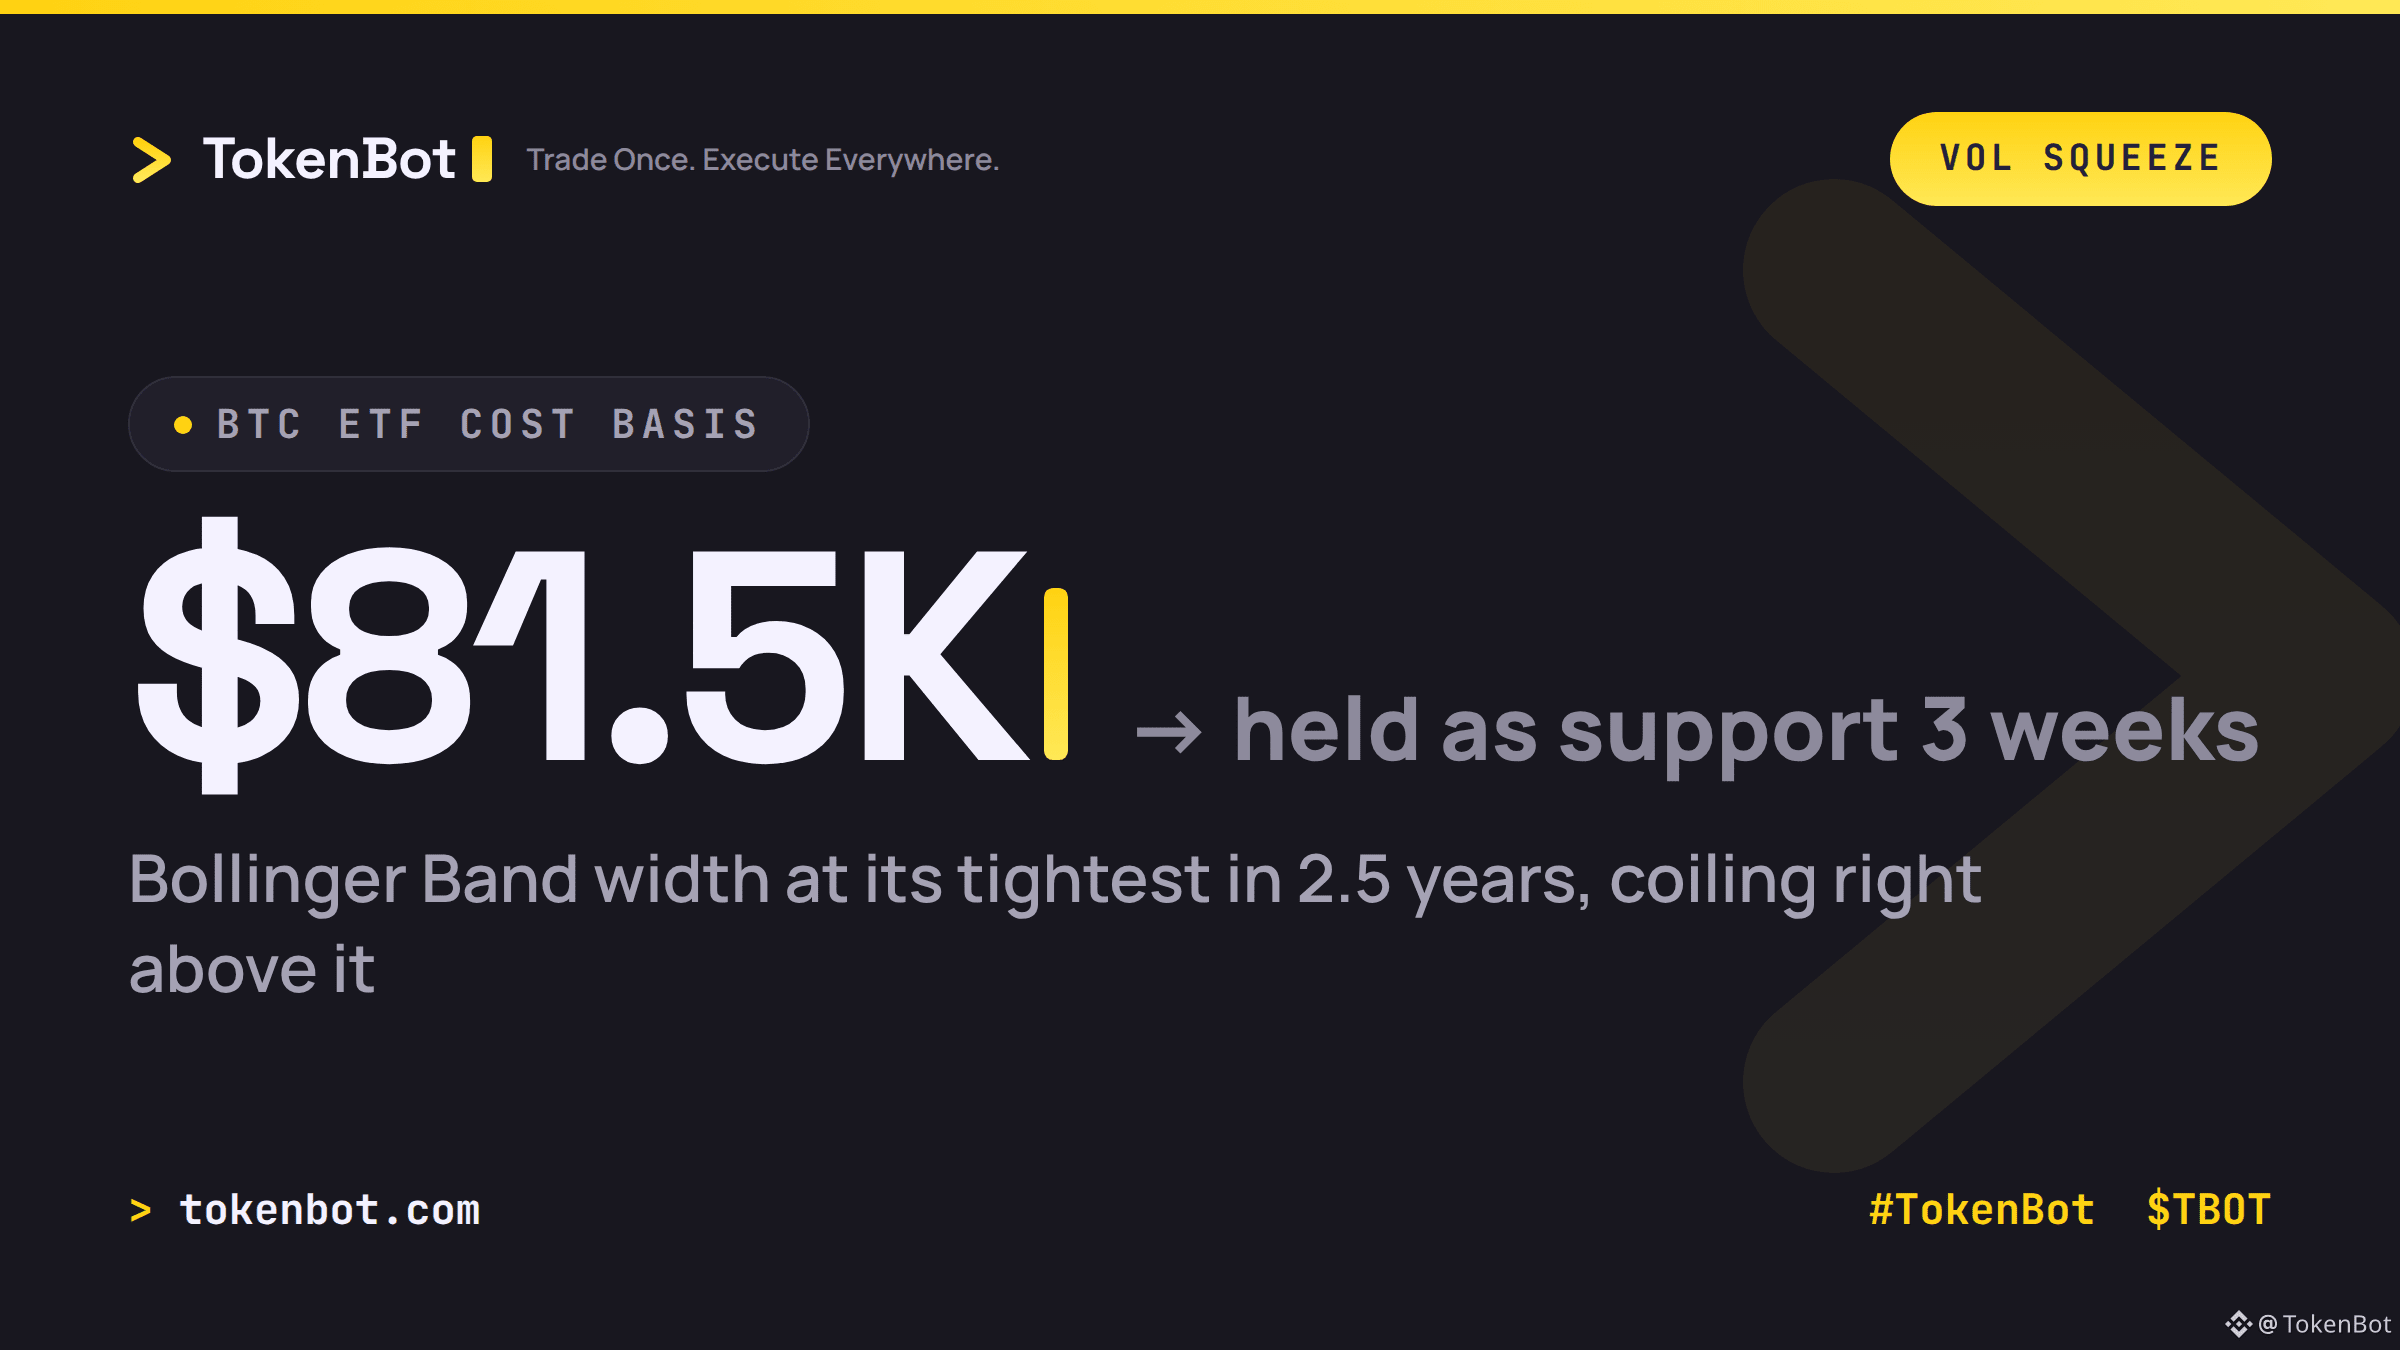
Bitcoin's daily Bollinger Band width just hit its tightest level in roughly 2.5 years. Price is coiled near $82,500, with buyers stepping in near the low $80Ks and sellers capping it in the mid-$80Ks — the kind of compressed range that usually doesn't last.
Here's the part that matters: this squeeze is sitting right on top of the ~$81,500 average cost basis for US spot Bitcoin ETFs, the line that's acted as the market's main support for three straight weeks. A daily close below it puts the average ETF holder back underwater and pulls the nearest big bid stack out from under the price. Hold above it, and the compression just adds fuel to whatever move comes next.
Tight ranges like this don't resolve sideways — they just set the stakes for whichever way the break goes. Where's your stop set on this one, above or below $81.5K?
$BTC $TBOT #Bitcoin #TokenBot #algotrading
tokenbot.com
87
Log in to explore more content
Join global crypto users on Binance Square
⚡️ Get latest and useful information about crypto.
💬 Trusted by the world’s largest crypto exchange.
👍 Discover real insights from verified creators.
Email / Phone number