

TOM nox
735 Posts

TOM nox
Report
Block User
🎯 Goal: $1,000,000 by 2026
Open Trade
High-Frequency Trader
3.8 Years
0 Following
230 Followers
926 Liked
Posts
Portfolio
All
Quotes
Videos
·
--
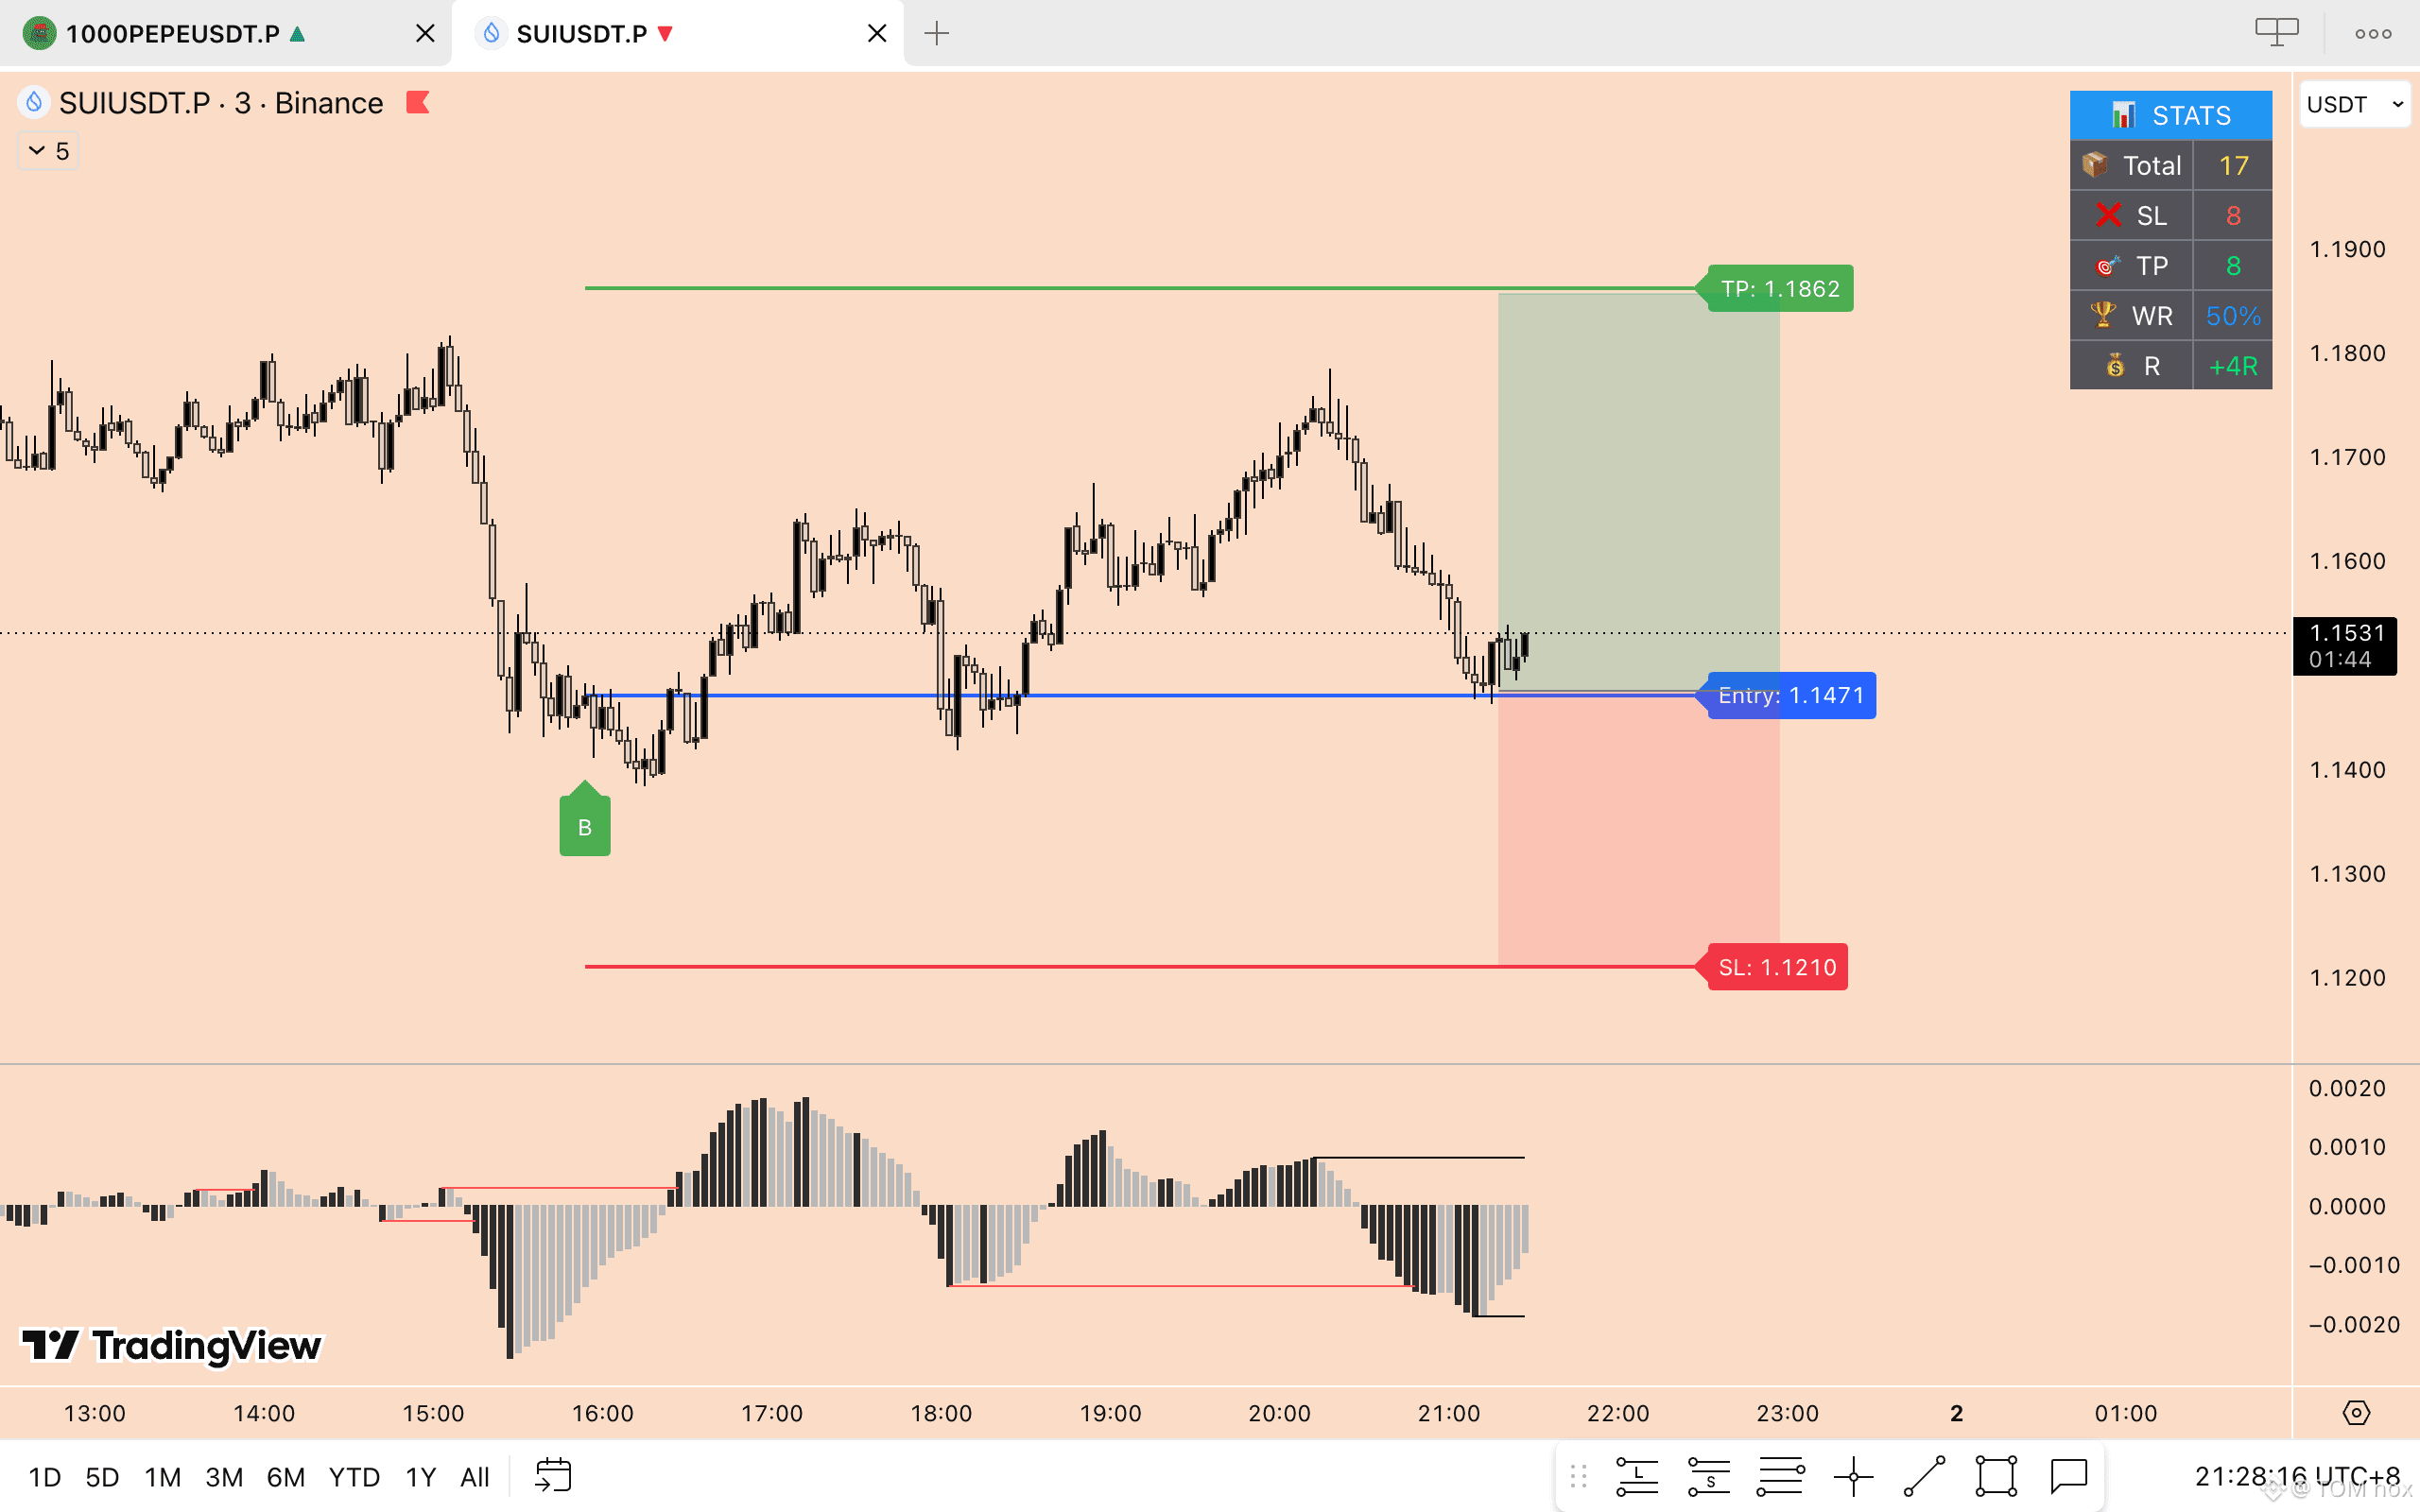
$SUI --- LONG
This setup is only being traded with a small account for testing purposes. I’m not asking you to follow or participate in this setup — just follow along and watch how it plays out. 👀📊
$SUI --- LONG
This setup is only being traded with a small account for testing purposes. I’m not asking you to follow or participate in this setup — just follow along and watch how it plays out. 👀📊
This setup is only being traded with a small account for testing purposes. I’m not asking you to follow or participate in this setup — just follow along and watch how it plays out. 👀📊
1
1
53
·
--
Bullish
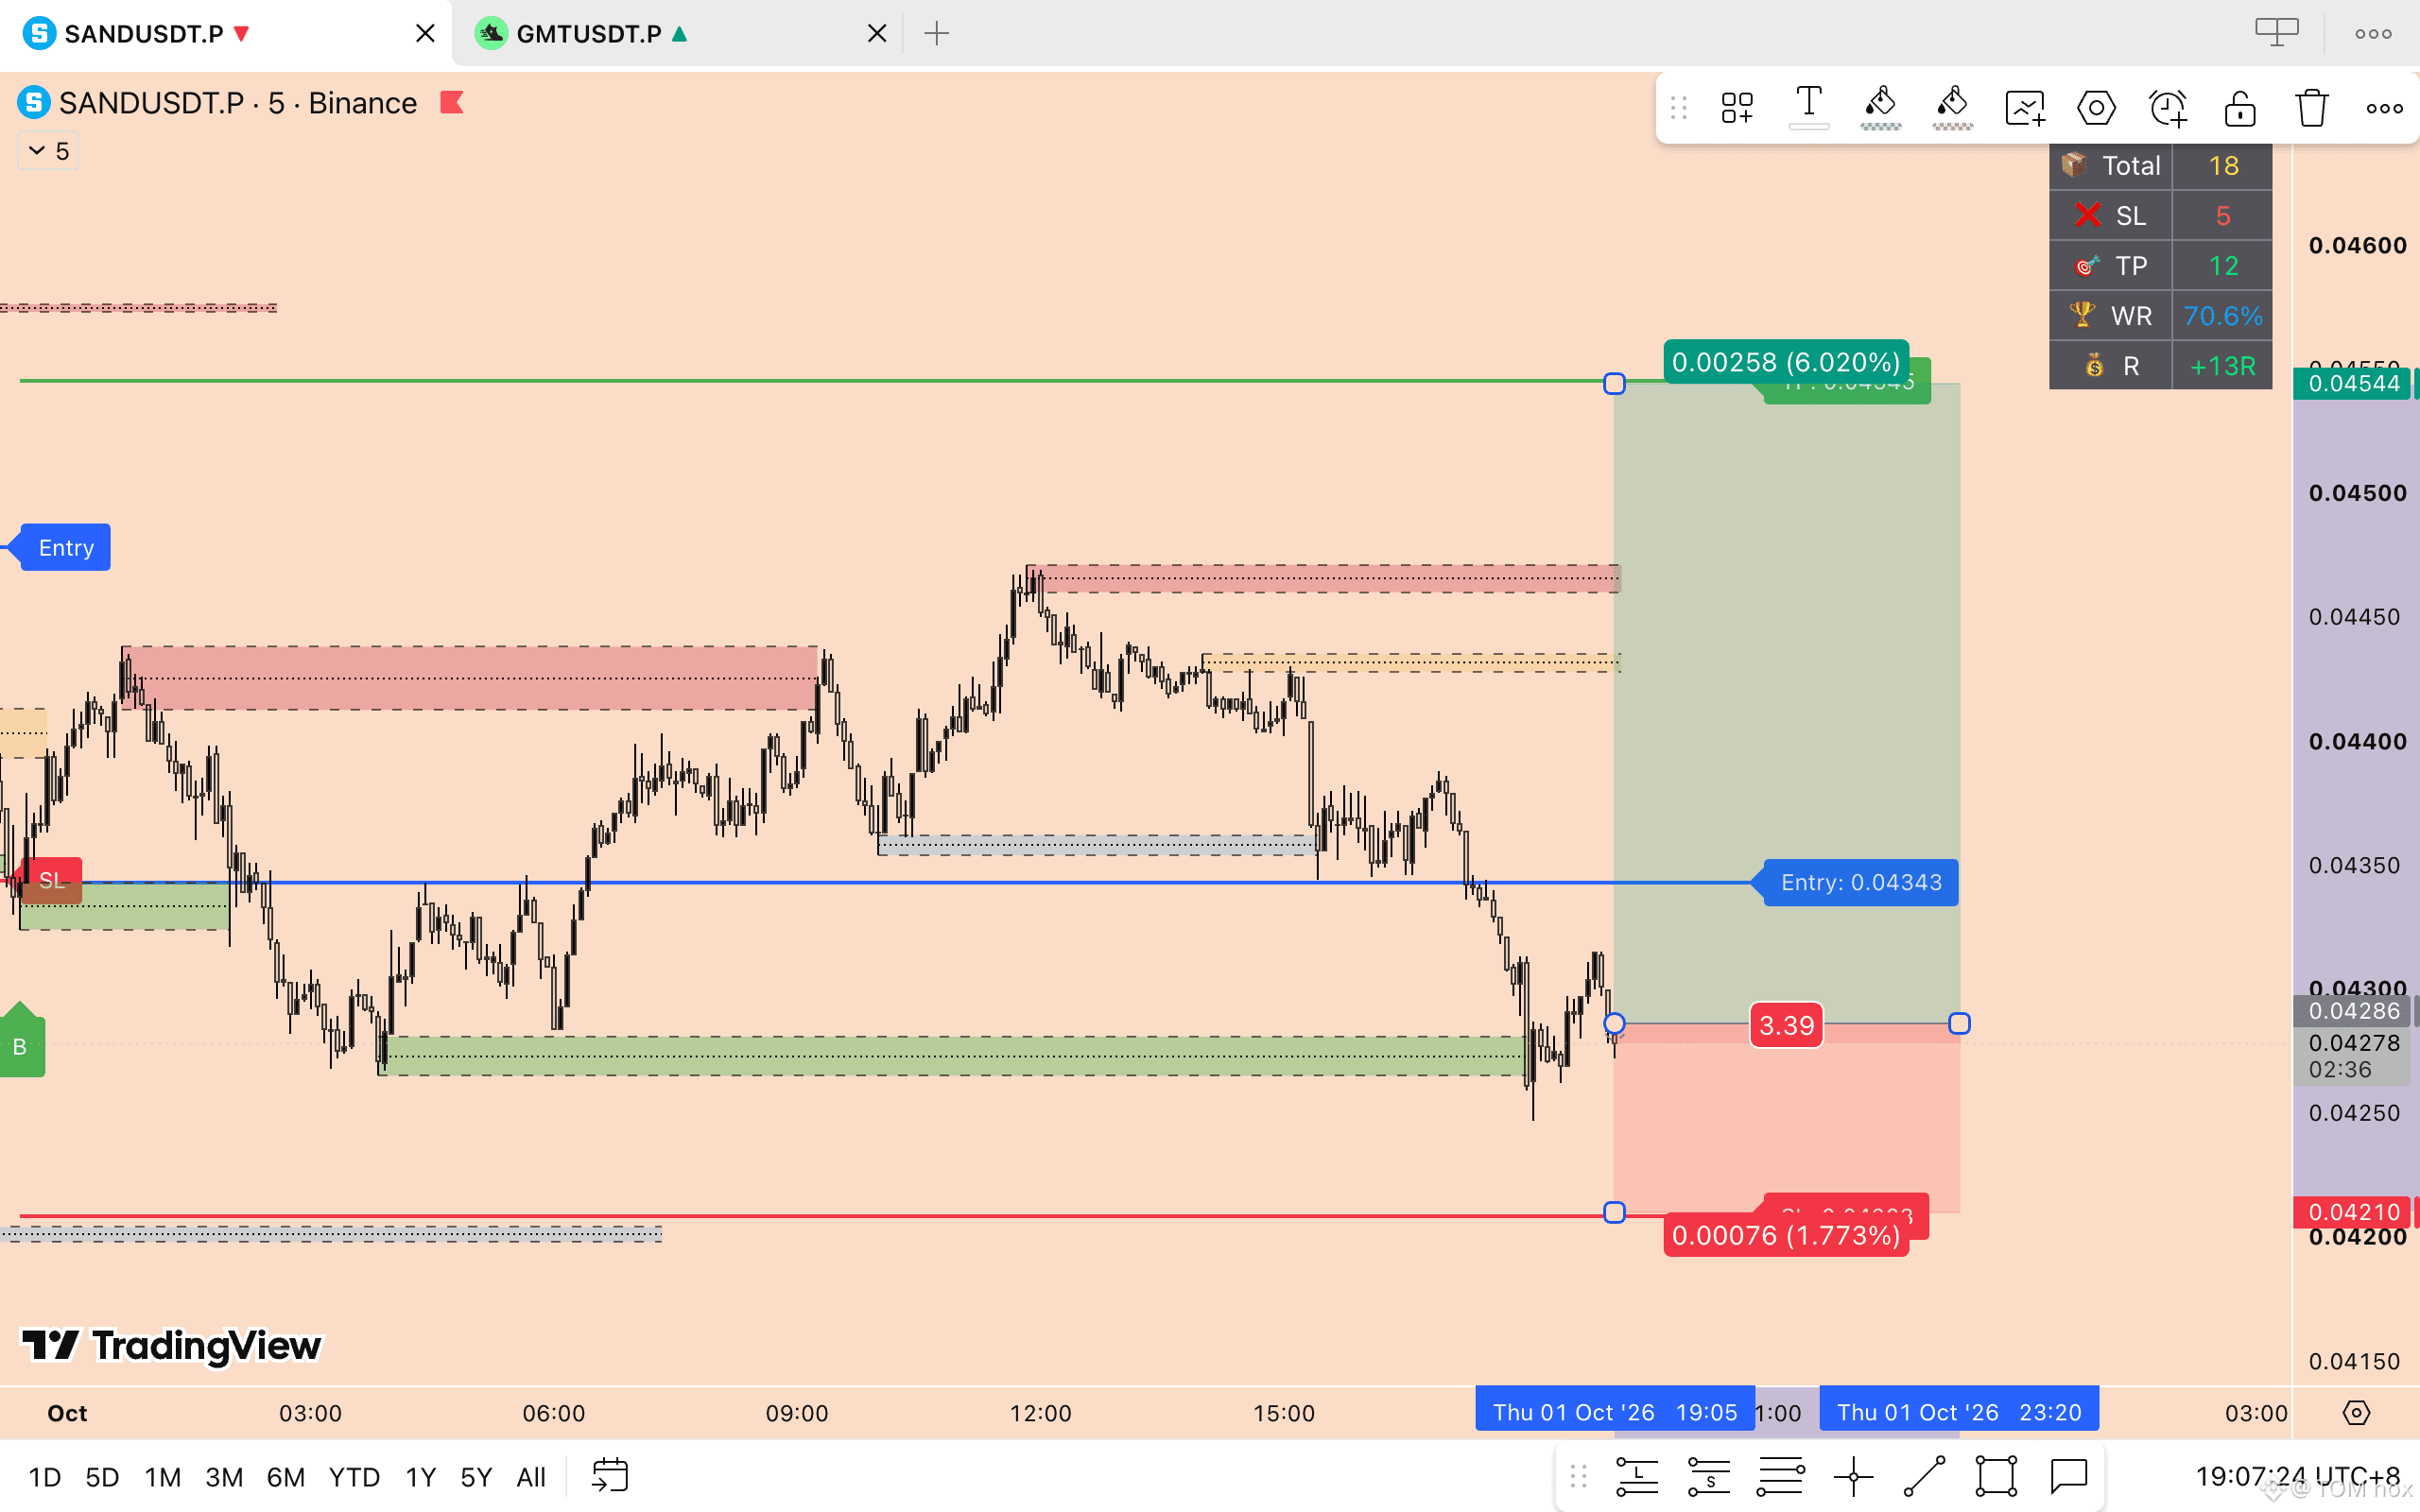
🟢 LONG — $SAND
The LONG signal appeared quite some time ago, but the setup is still valid and the stop-loss hasn’t been hit.
Price is currently trading below my original entry, which gives me an opportunity to enter at a better price.
That means I can potentially get a better R:R while keeping the same invalidation level. 📊
I’m watching the setup closely and looking for the right entry.
🔥 Let’s catch this move together.
#SAND #bullish
{spot}(SANDUSDT)
{future}(SANDUSDT)
🟢 LONG — $SAND
The LONG signal appeared quite some time ago, but the setup is still valid and the stop-loss hasn’t been hit.
Price is currently trading below my original entry, which gives me an opportunity to enter at a better price.
That means I can potentially get a better R:R while keeping the same invalidation level. 📊
I’m watching the setup closely and looking for the right entry.
🔥 Let’s catch this move together.
#SAND #bullish
The LONG signal appeared quite some time ago, but the setup is still valid and the stop-loss hasn’t been hit.
Price is currently trading below my original entry, which gives me an opportunity to enter at a better price.
That means I can potentially get a better R:R while keeping the same invalidation level. 📊
I’m watching the setup closely and looking for the right entry.
🔥 Let’s catch this move together.
#SAND #bullish
1
93
·
--
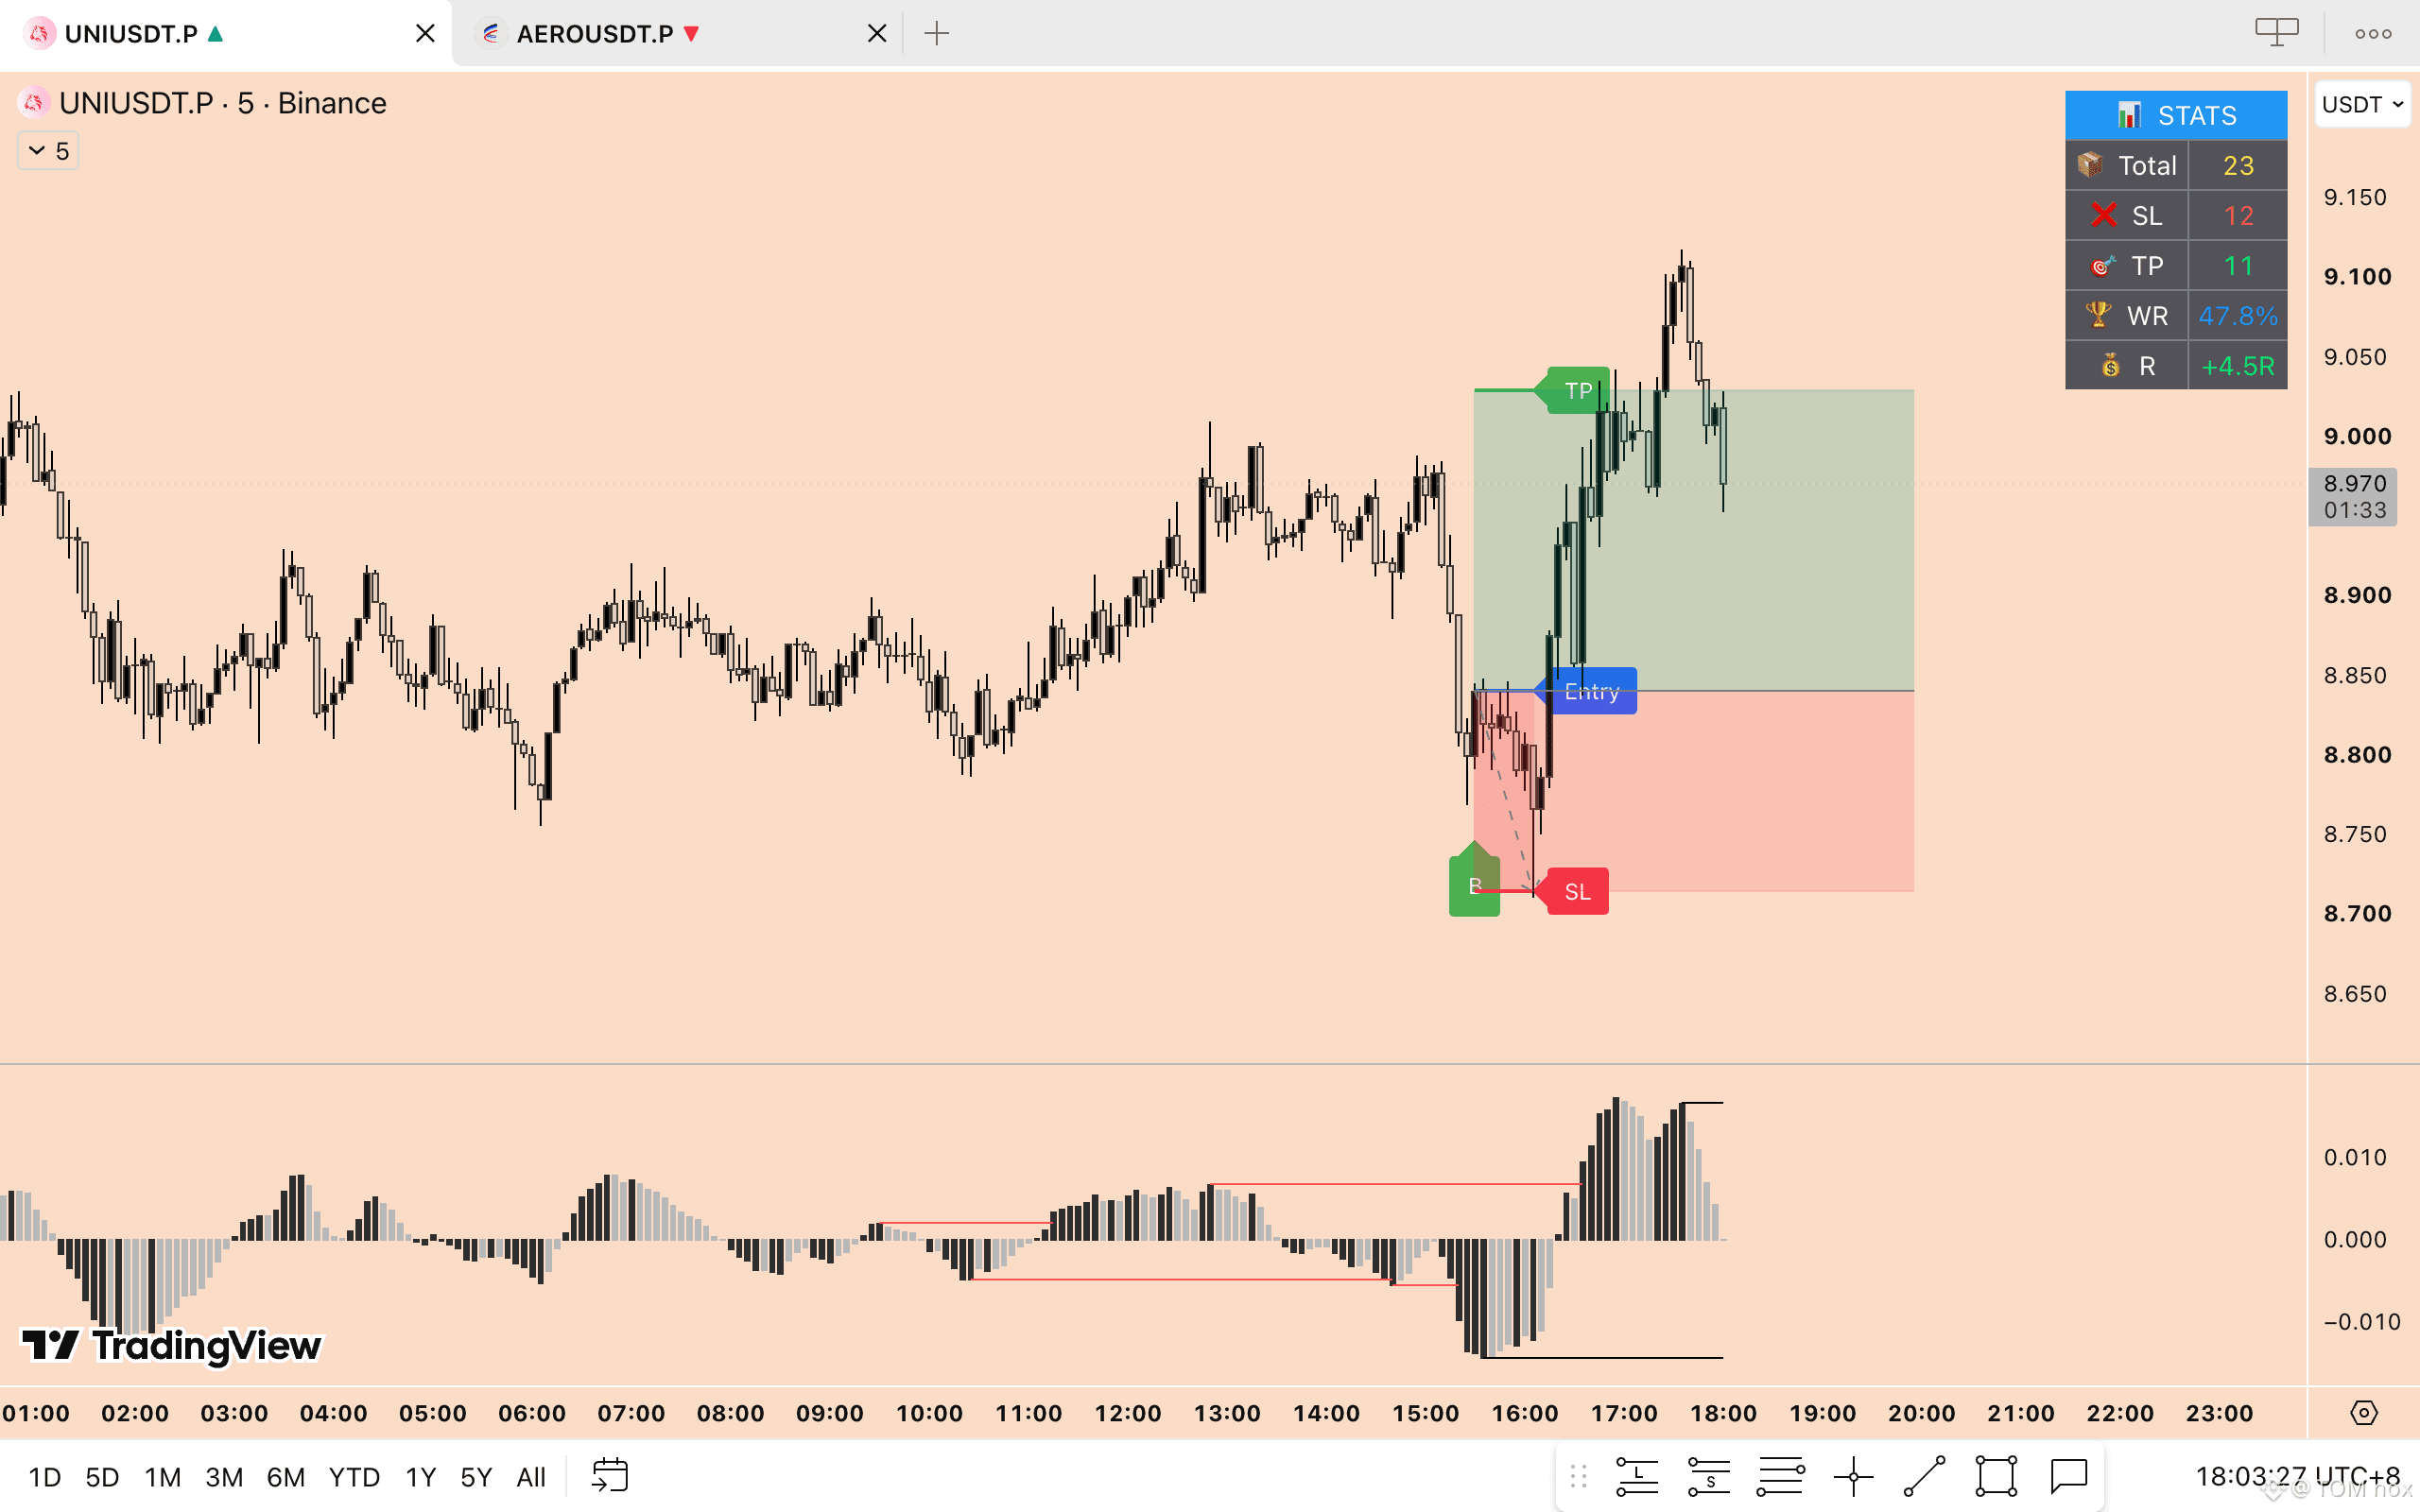
The UNI long moved in the expected direction, but unfortunately, it got stopped out in a rather unexpected way. 🛑
But this is a technical issue with my setup, not the market.
Instead of blaming the market, I’ll take this as feedback and work on improving the method. There are still things I need to refine before I can make this setup more consistent. 📊
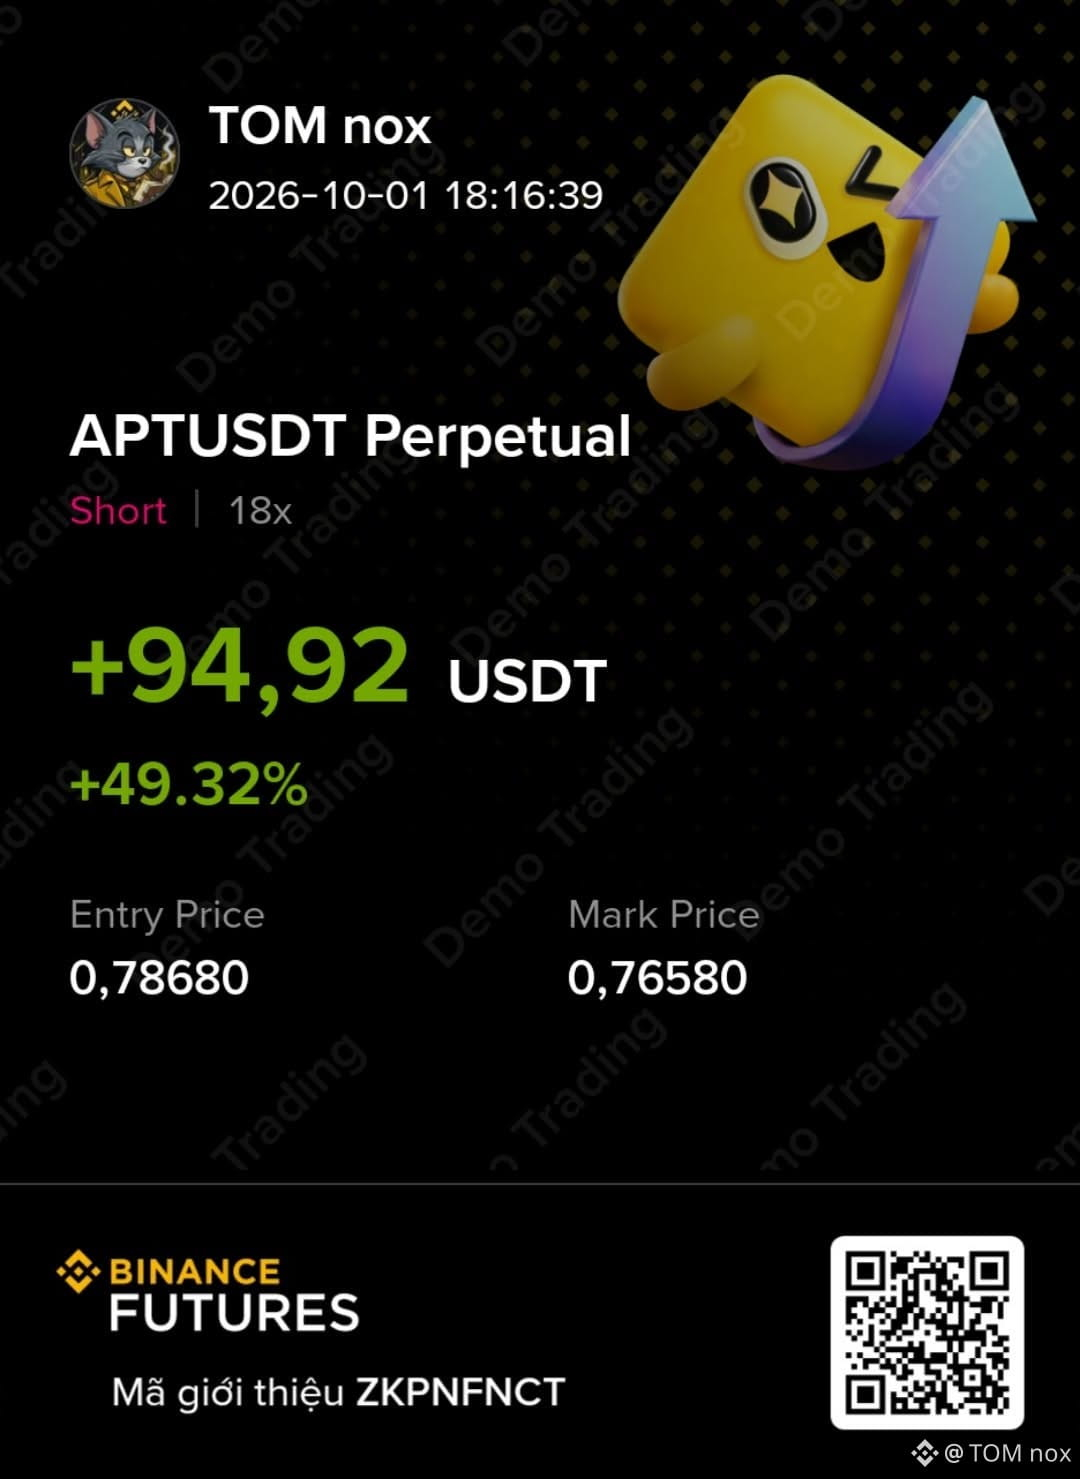
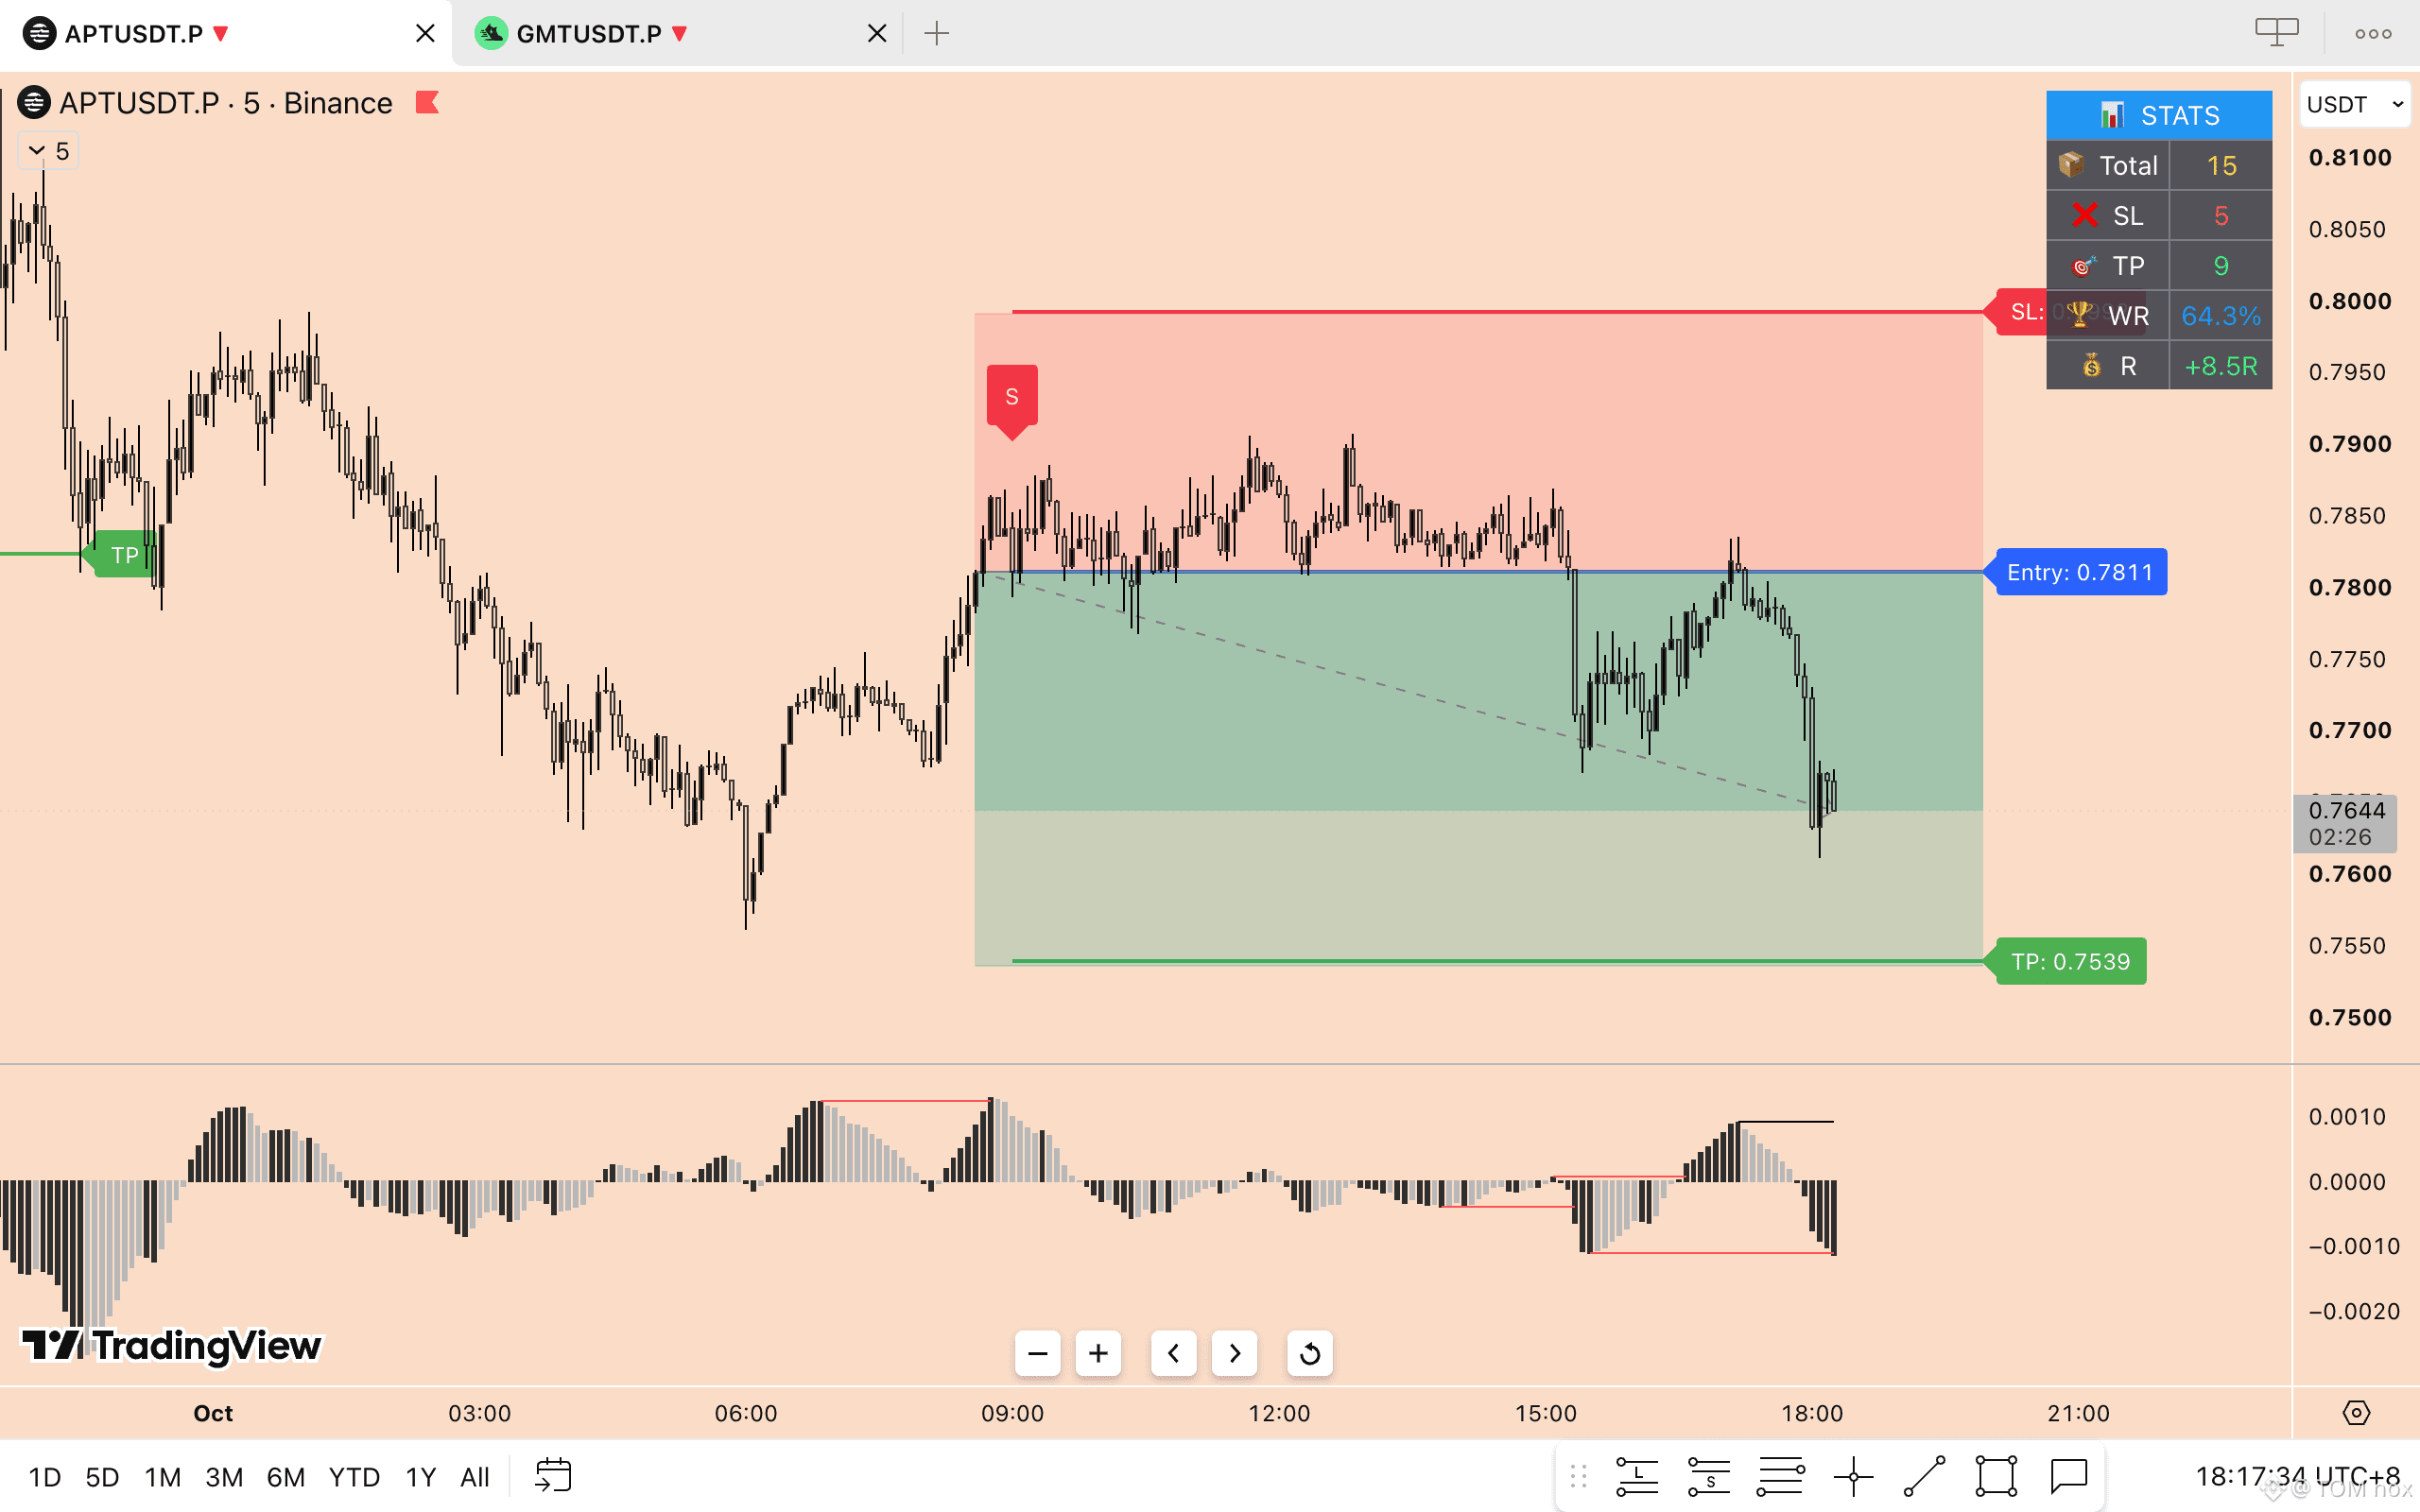
Meanwhile, the APT short is running very well. 📉🔥
In fact, the APT trade has already made back the loss from the UNI long.
This is exactly why I don’t judge a trading method based on a single trade.
I’ll take some time to review what happened, improve the setup, and come back with a better version. 🧠📈
Thank you to everyone who has been following my trades and supporting the journey.
Still learning. Still testing. Still improving. 🚀
The UNI long moved in the expected direction, but unfortunately, it got stopped out in a rather unexpected way. 🛑
But this is a technical issue with my setup, not the market.
Instead of blaming the market, I’ll take this as feedback and work on improving the method. There are still things I need to refine before I can make this setup more consistent. 📊
Meanwhile, the APT short is running very well. 📉🔥
In fact, the APT trade has already made back the loss from the UNI long.
This is exactly why I don’t judge a trading method based on a single trade.
I’ll take some time to review what happened, improve the setup, and come back with a better version. 🧠📈
Thank you to everyone who has been following my trades and supporting the journey.
Still learning. Still testing. Still improving. 🚀
But this is a technical issue with my setup, not the market.
Instead of blaming the market, I’ll take this as feedback and work on improving the method. There are still things I need to refine before I can make this setup more consistent. 📊
Meanwhile, the APT short is running very well. 📉🔥
In fact, the APT trade has already made back the loss from the UNI long.
This is exactly why I don’t judge a trading method based on a single trade.
I’ll take some time to review what happened, improve the setup, and come back with a better version. 🧠📈
Thank you to everyone who has been following my trades and supporting the journey.
Still learning. Still testing. Still improving. 🚀
1
301
·
--
The $APT short is currently in profit. 📉💰
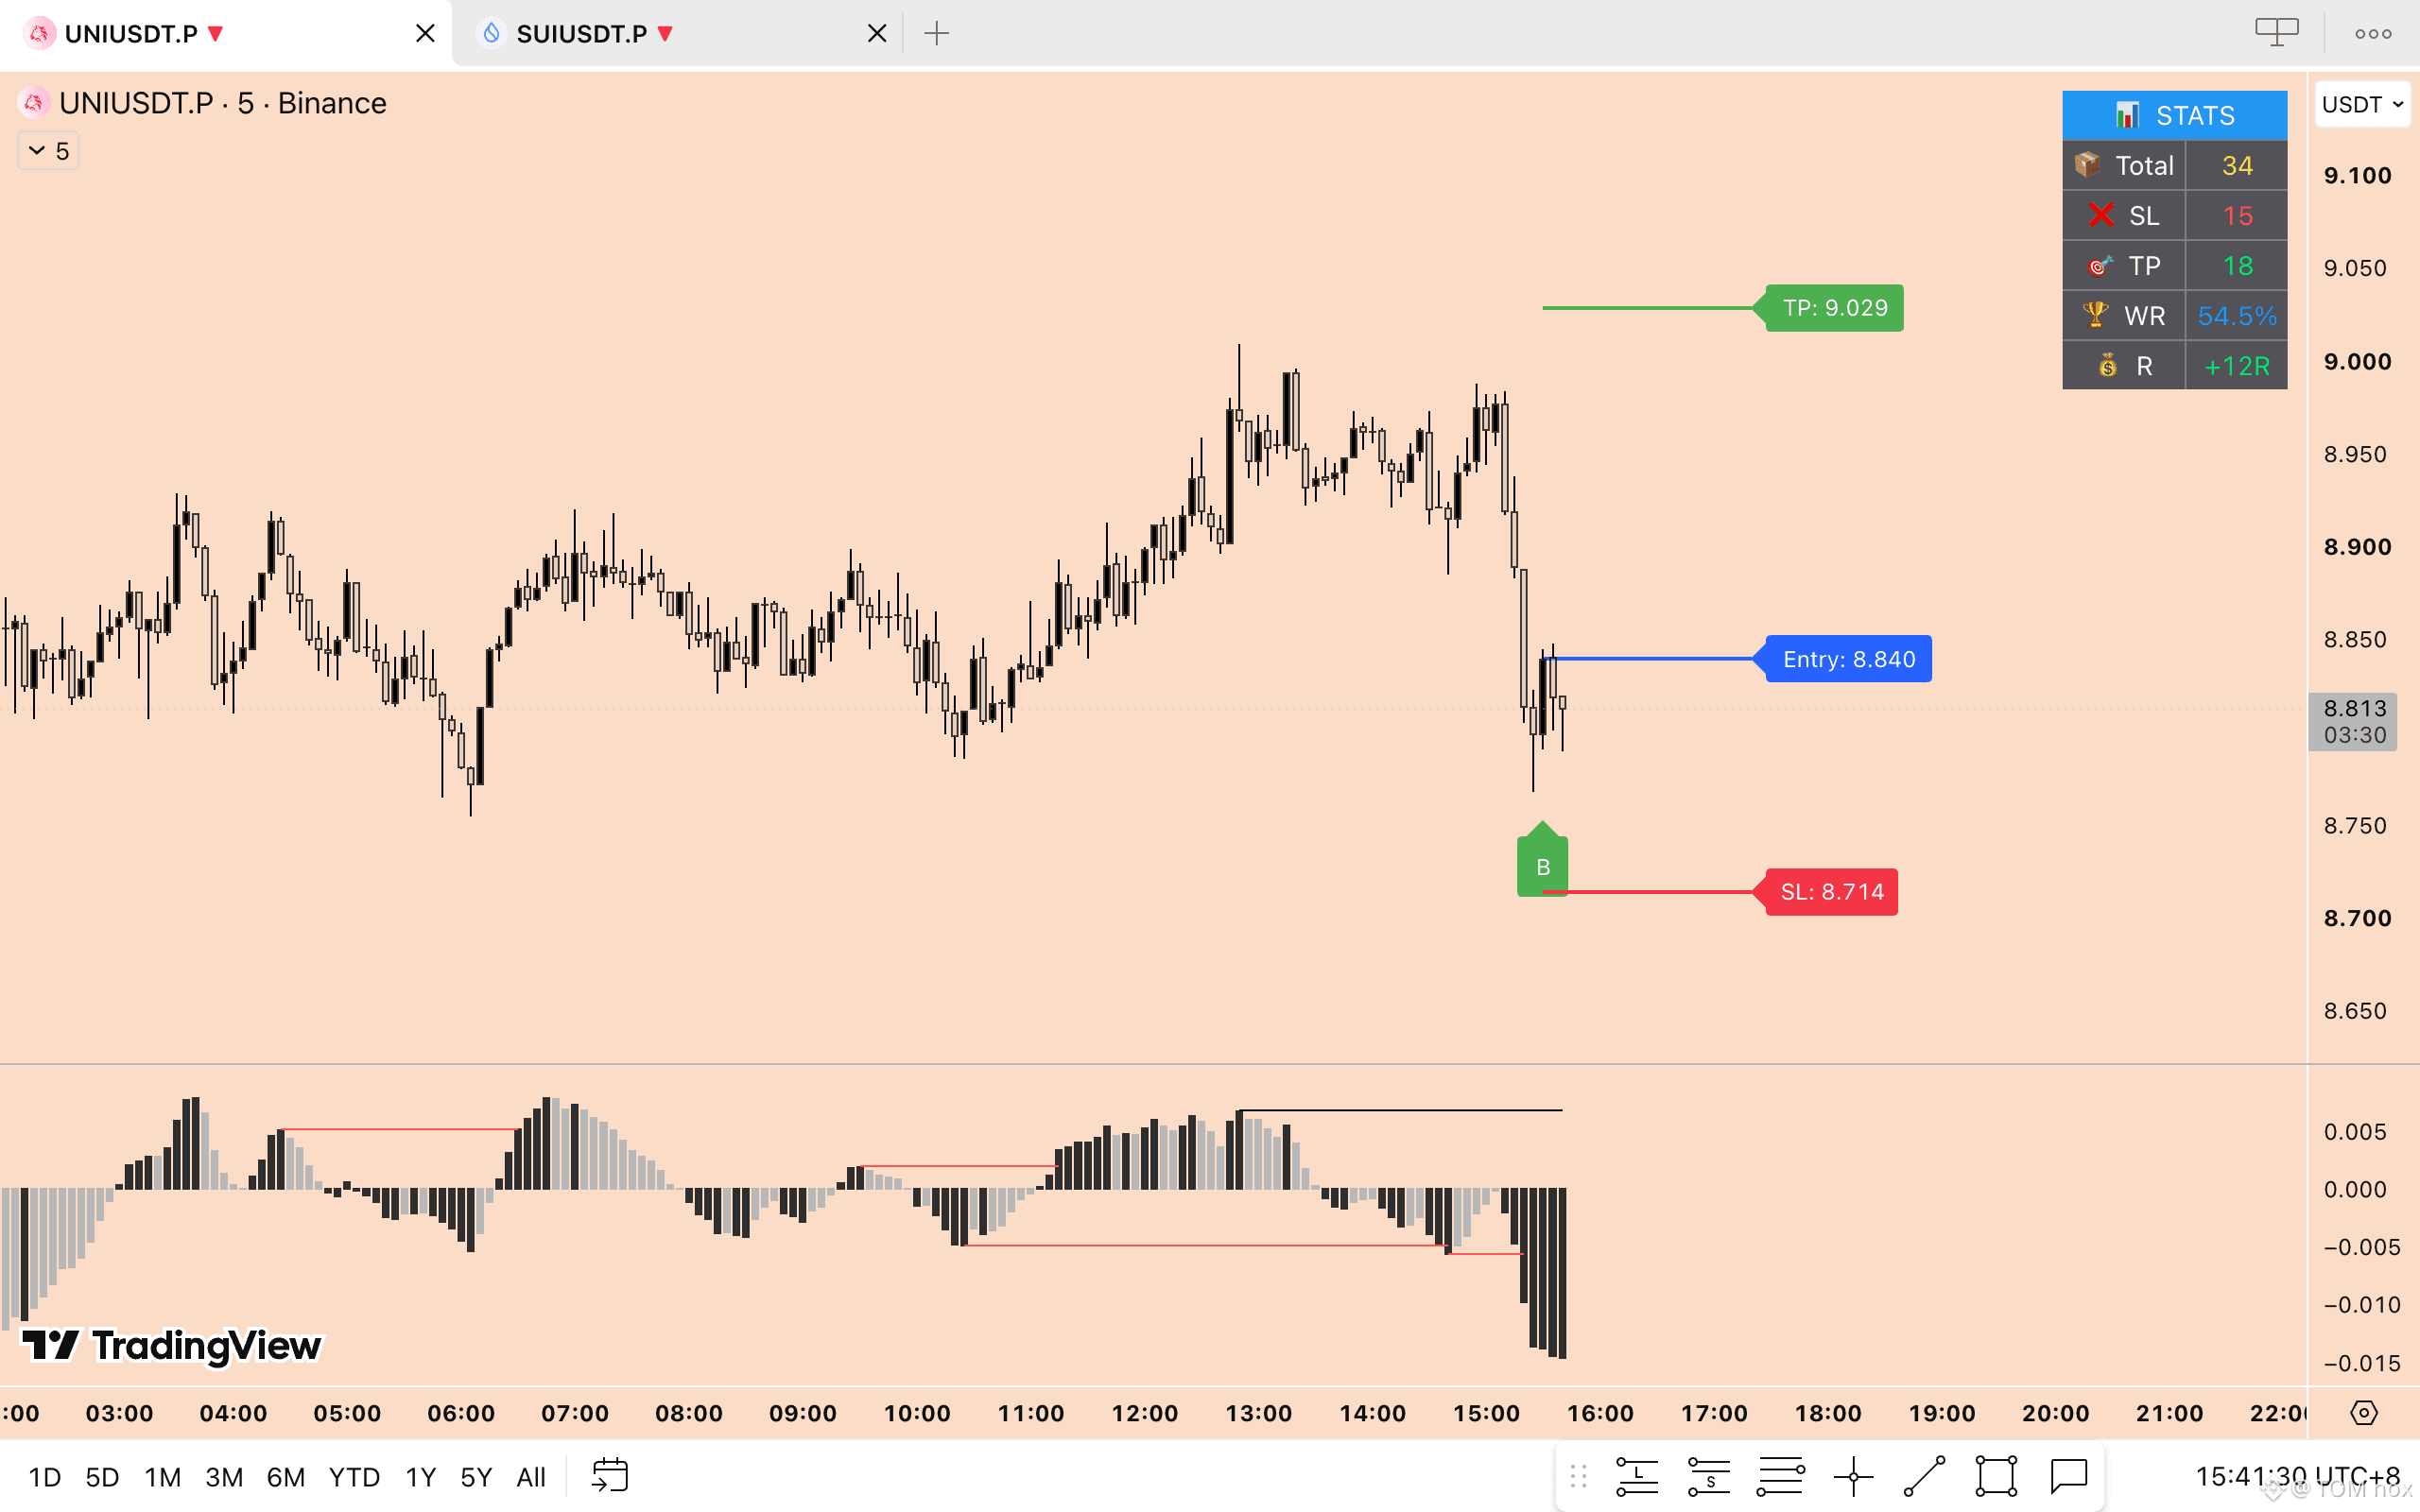
At the same time, I’m watching UNI on the 5-minute chart.
I like this coin. I’ve made profits trading $UNI in the short term before, so I have a pretty good understanding of how it tends to move.
That said, I’m not confident this trade will win. No setup is guaranteed. ⚠️
If you’re considering copying this setup, please manage your position size carefully and adjust your entry volume according to your own risk tolerance. 📊
Trade the setup, not the emotion. 🧠📈
{future}(UNIUSDT)
The $APT short is currently in profit. 📉💰
At the same time, I’m watching UNI on the 5-minute chart.
I like this coin. I’ve made profits trading $UNI in the short term before, so I have a pretty good understanding of how it tends to move.
That said, I’m not confident this trade will win. No setup is guaranteed. ⚠️
If you’re considering copying this setup, please manage your position size carefully and adjust your entry volume according to your own risk tolerance. 📊
Trade the setup, not the emotion. 🧠📈
At the same time, I’m watching UNI on the 5-minute chart.
I like this coin. I’ve made profits trading $UNI in the short term before, so I have a pretty good understanding of how it tends to move.
That said, I’m not confident this trade will win. No setup is guaranteed. ⚠️
If you’re considering copying this setup, please manage your position size carefully and adjust your entry volume according to your own risk tolerance. 📊
Trade the setup, not the emotion. 🧠📈
1
329
·
--
🚨 More indicators didn’t make me a better trader.
They just made my charts more complicated.
I spent a long time searching for the “perfect” strategy.
🔹 Different methods
🔹 Famous indicators
🔹 Complicated setups
I kept thinking the next strategy would finally be the one that changed everything.
Then I decided to go back to the basics. 👇
📌 Simple candlestick reading
📌 Fibonacci
📌 My own setup
I’m still learning.
I’m not at the level where I can make huge money yet.
But this approach has helped me recover my previous losses and, more importantly, build a trading process that I actually understand. 📈
If you’re losing money in the market right now, I’ve been there too.
There’s no magic indicator. ❌
What matters is:
→ A setup you understand
→ Proper risk management
→ Discipline to follow your plan
→ Enough data to know whether your edge is real
📊 I’m still refining my method.
📈 I’m still collecting data.
🧠 I’m still making mistakes.
I’m not here to pretend I’ve figured everything out.
I’m here to document the journey, test my ideas, and become a better trader one trade at a time.
━━━━━━━━━━━━━━
If you’re on the same journey,
let’s see how far we can go. 🚀
💬 What did trading teach you the hard way?
🚨 More indicators didn’t make me a better trader.
They just made my charts more complicated.
I spent a long time searching for the “perfect” strategy.
🔹 Different methods
🔹 Famous indicators
🔹 Complicated setups
I kept thinking the next strategy would finally be the one that changed everything.
Then I decided to go back to the basics. 👇
📌 Simple candlestick reading
📌 Fibonacci
📌 My own setup
I’m still learning.
I’m not at the level where I can make huge money yet.
But this approach has helped me recover my previous losses and, more importantly, build a trading process that I actually understand. 📈
If you’re losing money in the market right now, I’ve been there too.
There’s no magic indicator. ❌
What matters is:
→ A setup you understand
→ Proper risk management
→ Discipline to follow your plan
→ Enough data to know whether your edge is real
📊 I’m still refining my method.
📈 I’m still collecting data.
🧠 I’m still making mistakes.
I’m not here to pretend I’ve figured everything out.
I’m here to document the journey, test my ideas, and become a better trader one trade at a time.
━━━━━━━━━━━━━━
If you’re on the same journey,
let’s see how far we can go. 🚀
💬 What did trading teach you the hard way?
They just made my charts more complicated.
I spent a long time searching for the “perfect” strategy.
🔹 Different methods
🔹 Famous indicators
🔹 Complicated setups
I kept thinking the next strategy would finally be the one that changed everything.
Then I decided to go back to the basics. 👇
📌 Simple candlestick reading
📌 Fibonacci
📌 My own setup
I’m still learning.
I’m not at the level where I can make huge money yet.
But this approach has helped me recover my previous losses and, more importantly, build a trading process that I actually understand. 📈
If you’re losing money in the market right now, I’ve been there too.
There’s no magic indicator. ❌
What matters is:
→ A setup you understand
→ Proper risk management
→ Discipline to follow your plan
→ Enough data to know whether your edge is real
📊 I’m still refining my method.
📈 I’m still collecting data.
🧠 I’m still making mistakes.
I’m not here to pretend I’ve figured everything out.
I’m here to document the journey, test my ideas, and become a better trader one trade at a time.
━━━━━━━━━━━━━━
If you’re on the same journey,
let’s see how far we can go. 🚀
💬 What did trading teach you the hard way?
1
84
·
--
Bearish
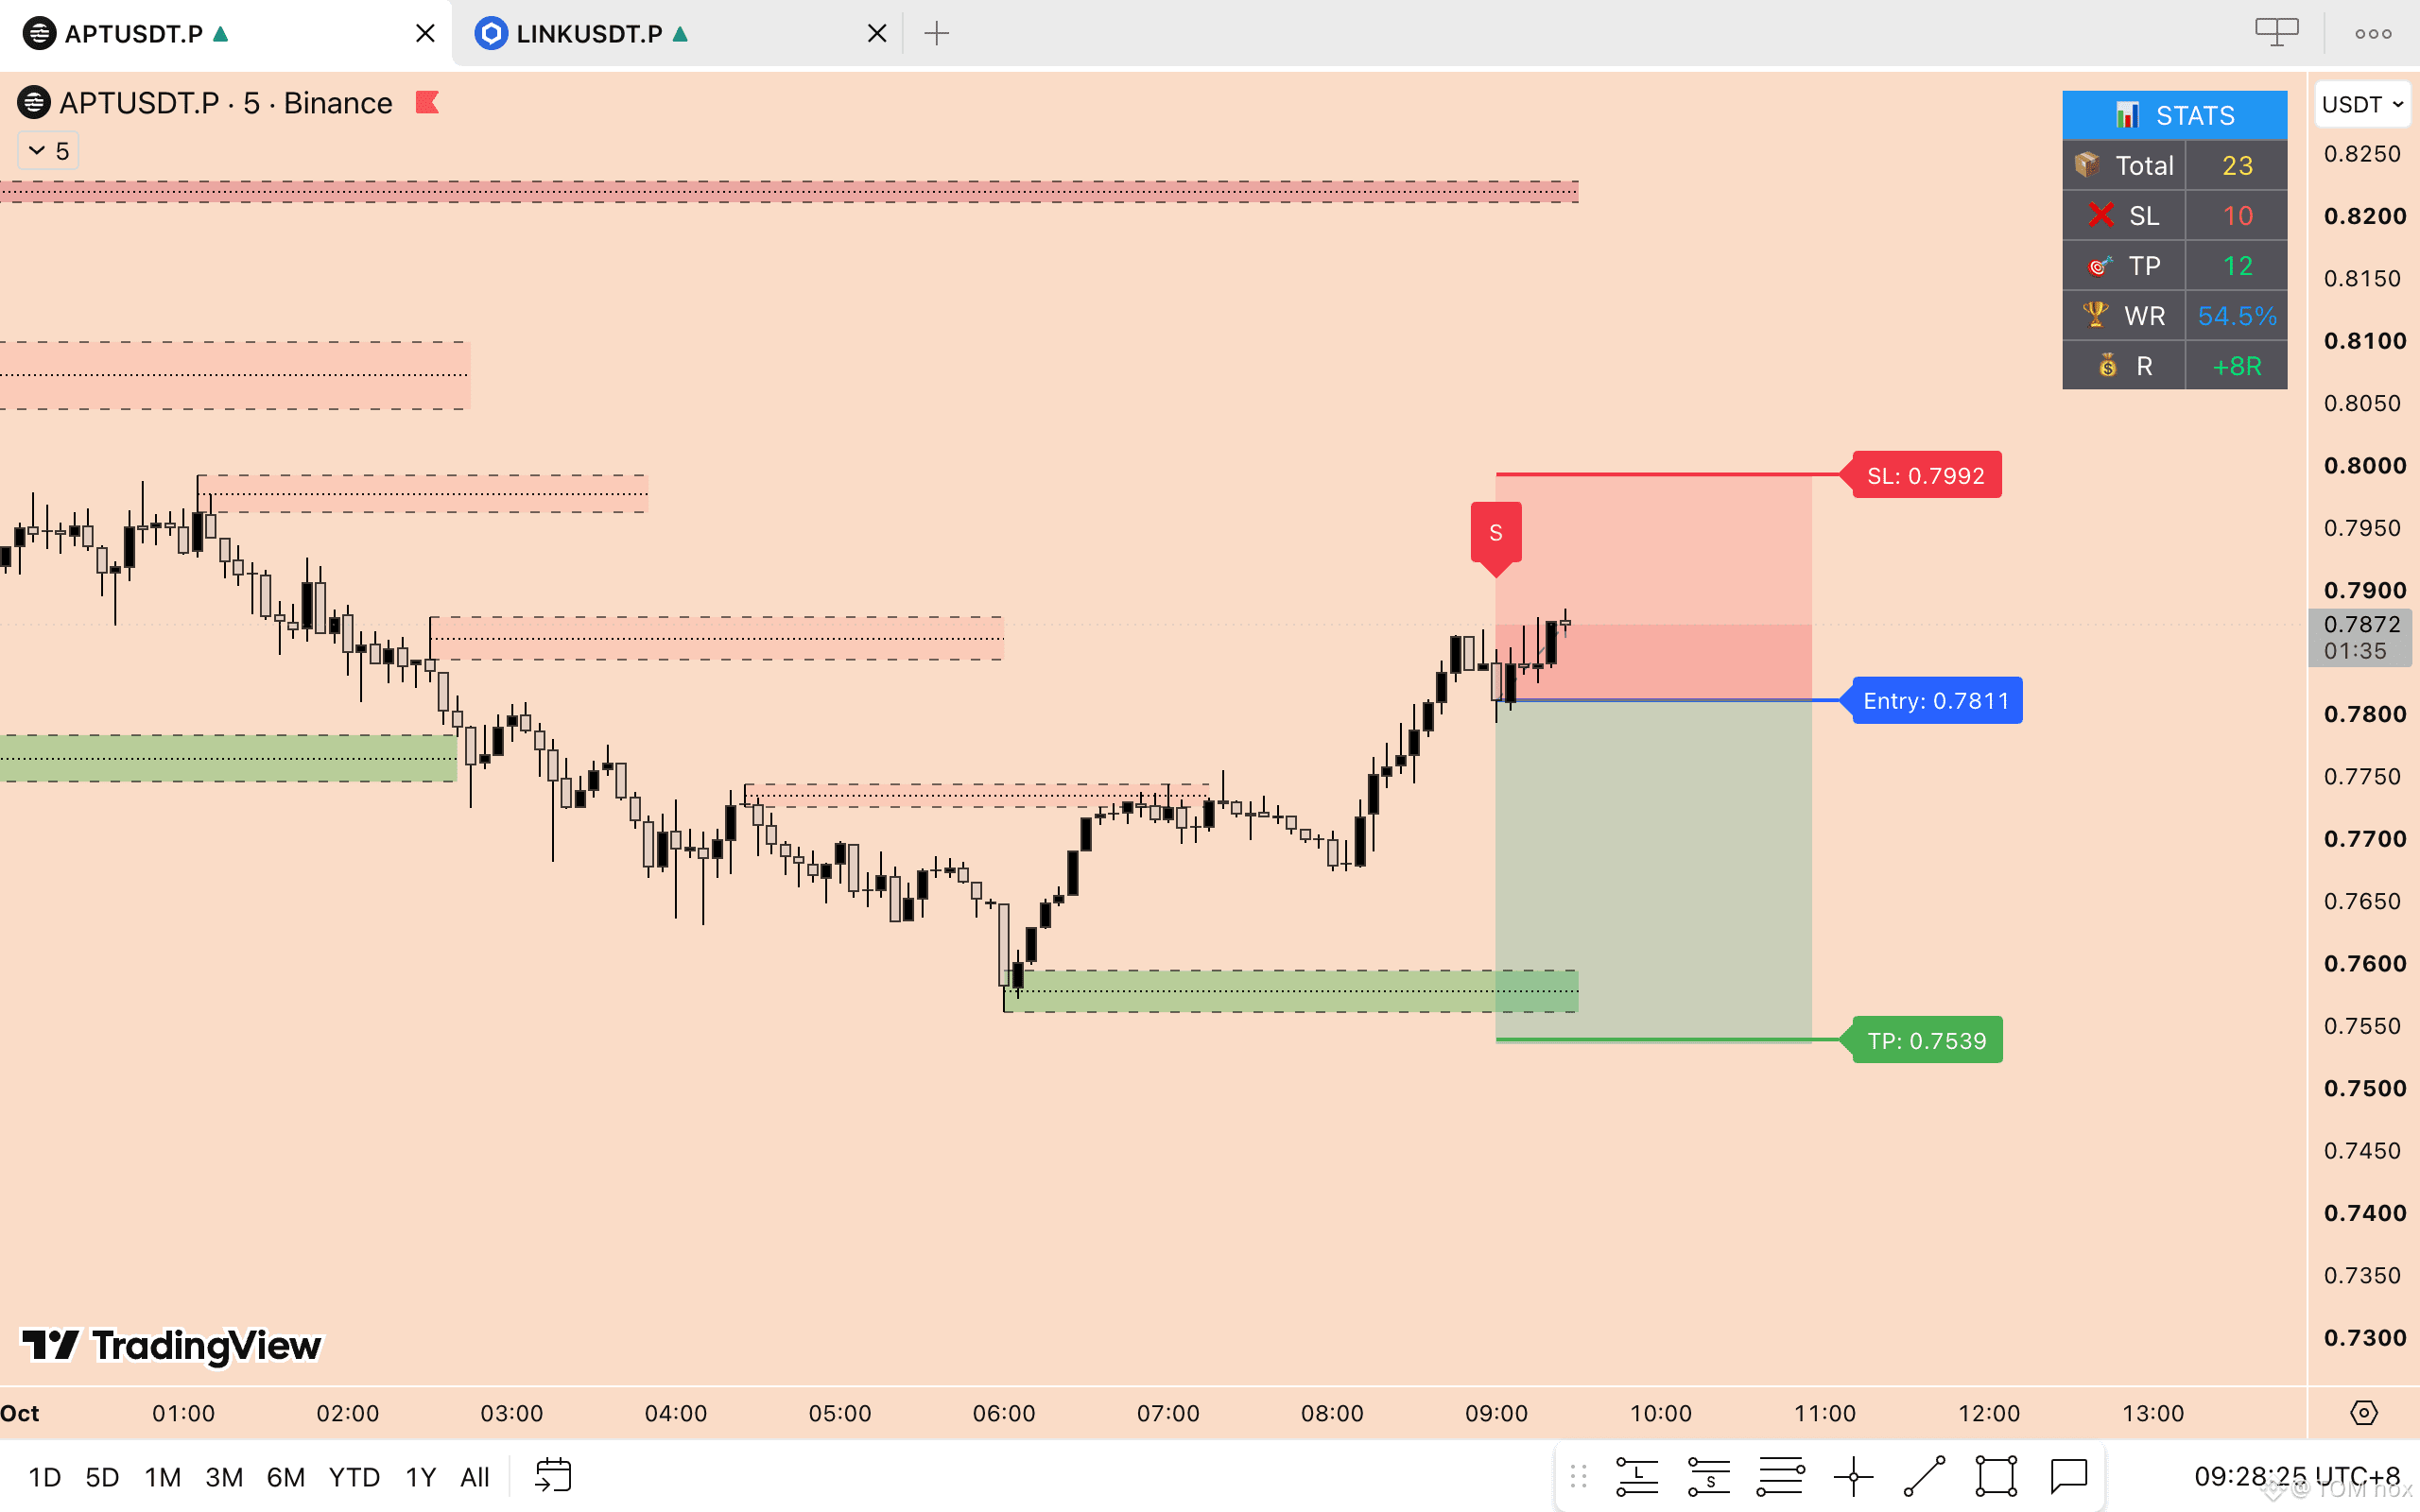
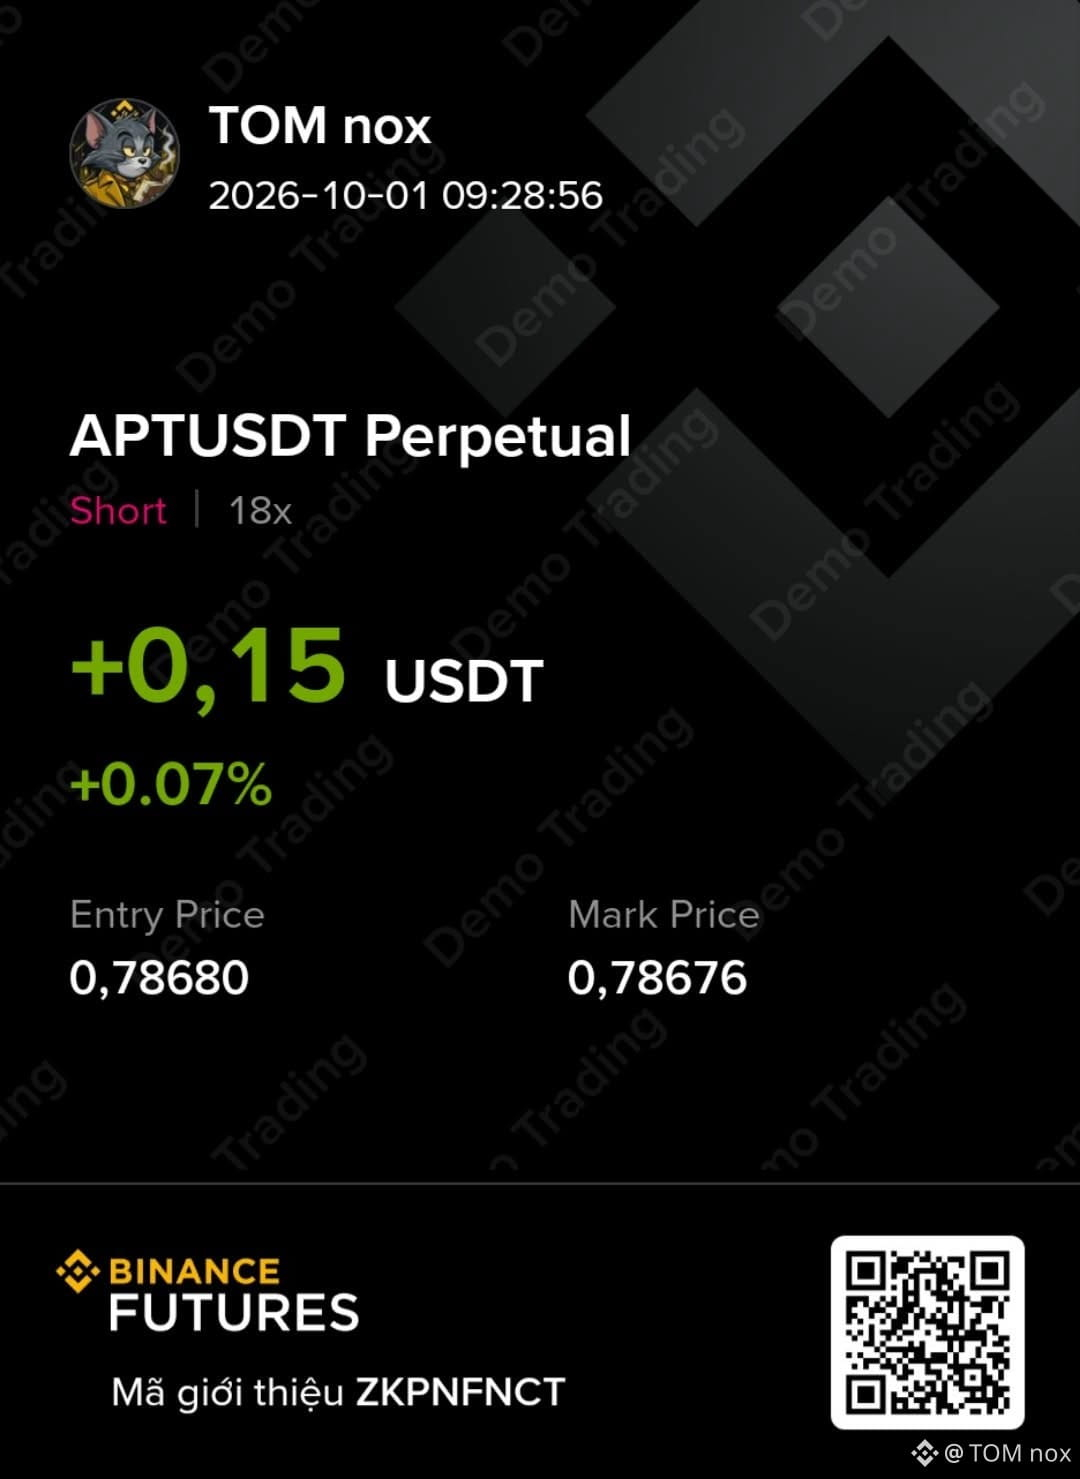
$APT — SHORT 📉
{future}(APTUSDT)
Let me make it up to you after those two losing trades.
Follow this setup with me and let’s see how it plays out. 👀🔥
#APT
$APT — SHORT 📉
Let me make it up to you after those two losing trades.
Follow this setup with me and let’s see how it plays out. 👀🔥
#APT
Let me make it up to you after those two losing trades.
Follow this setup with me and let’s see how it plays out. 👀🔥
#APT
2
1
395
·
--
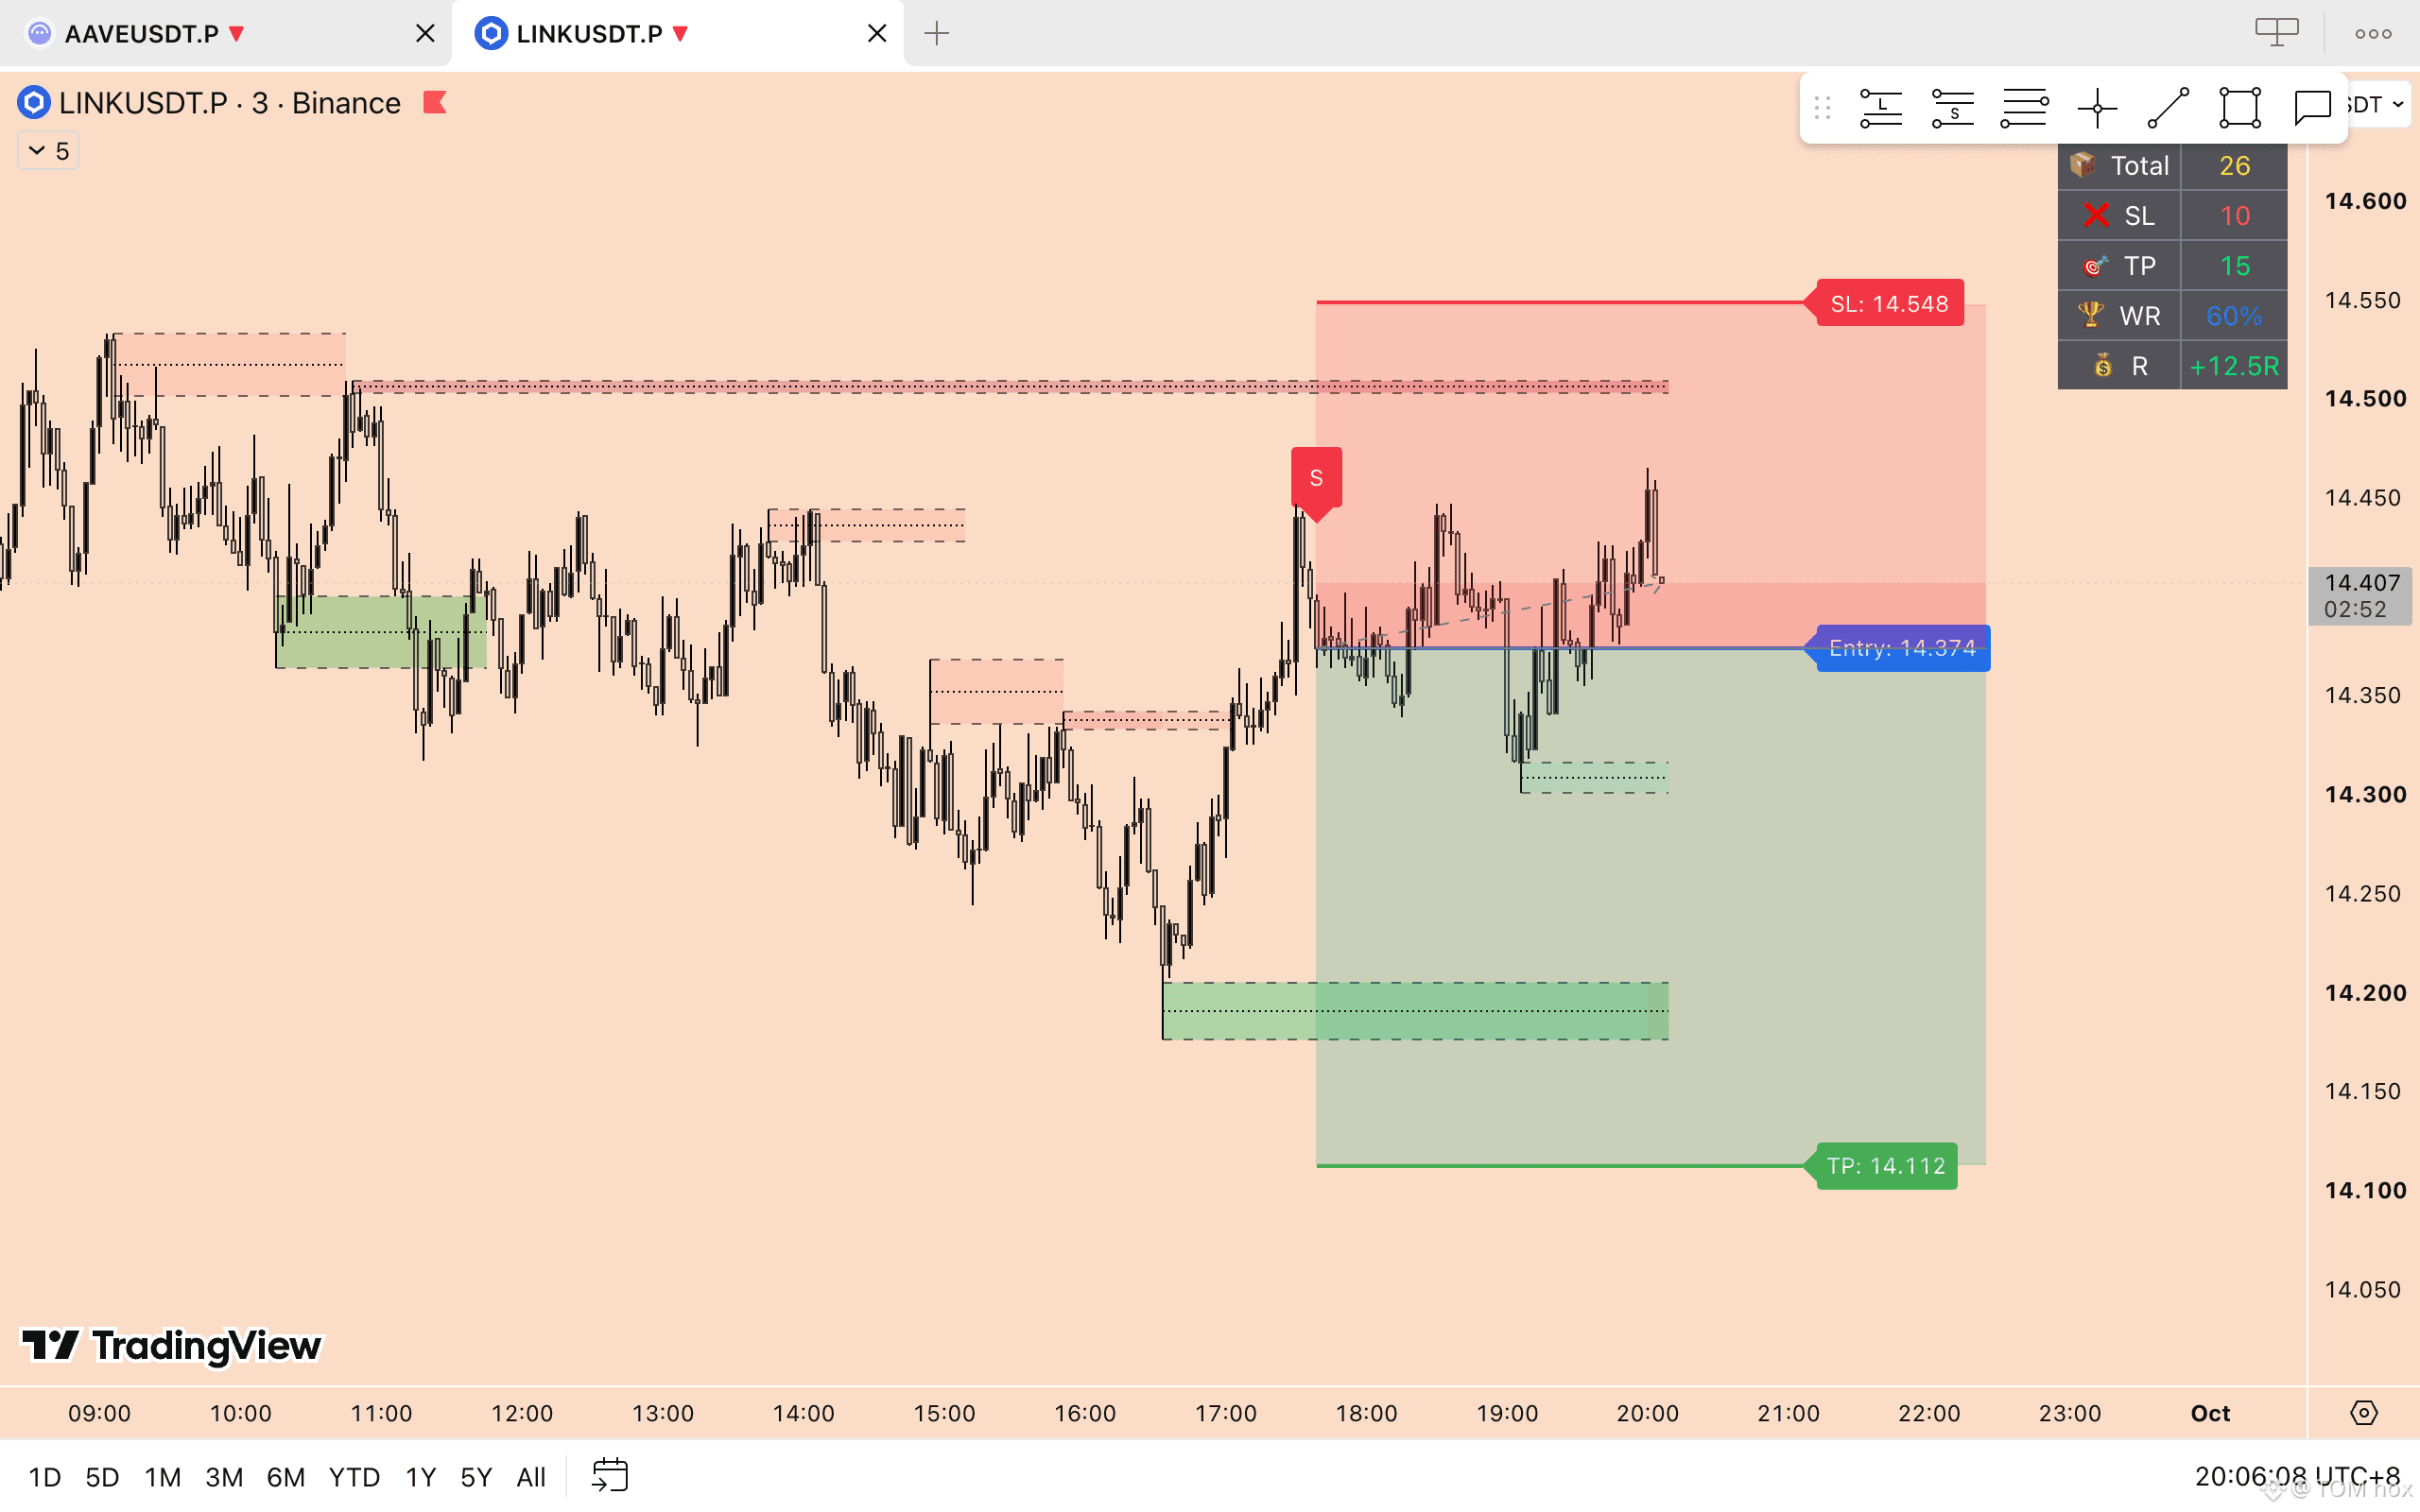
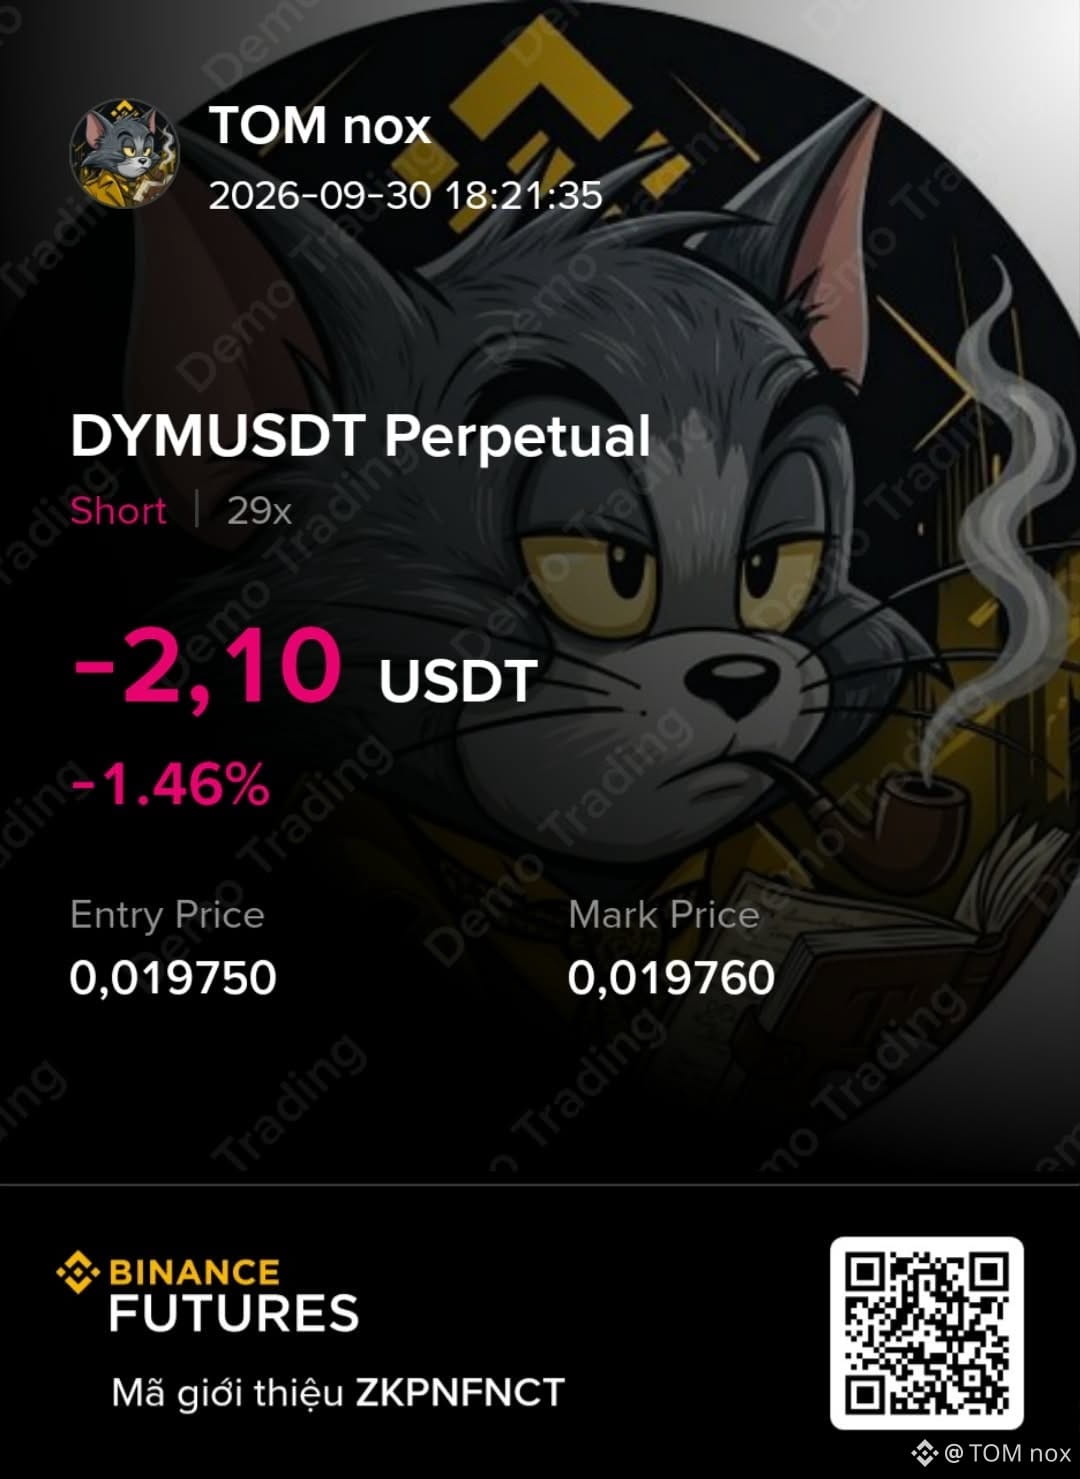
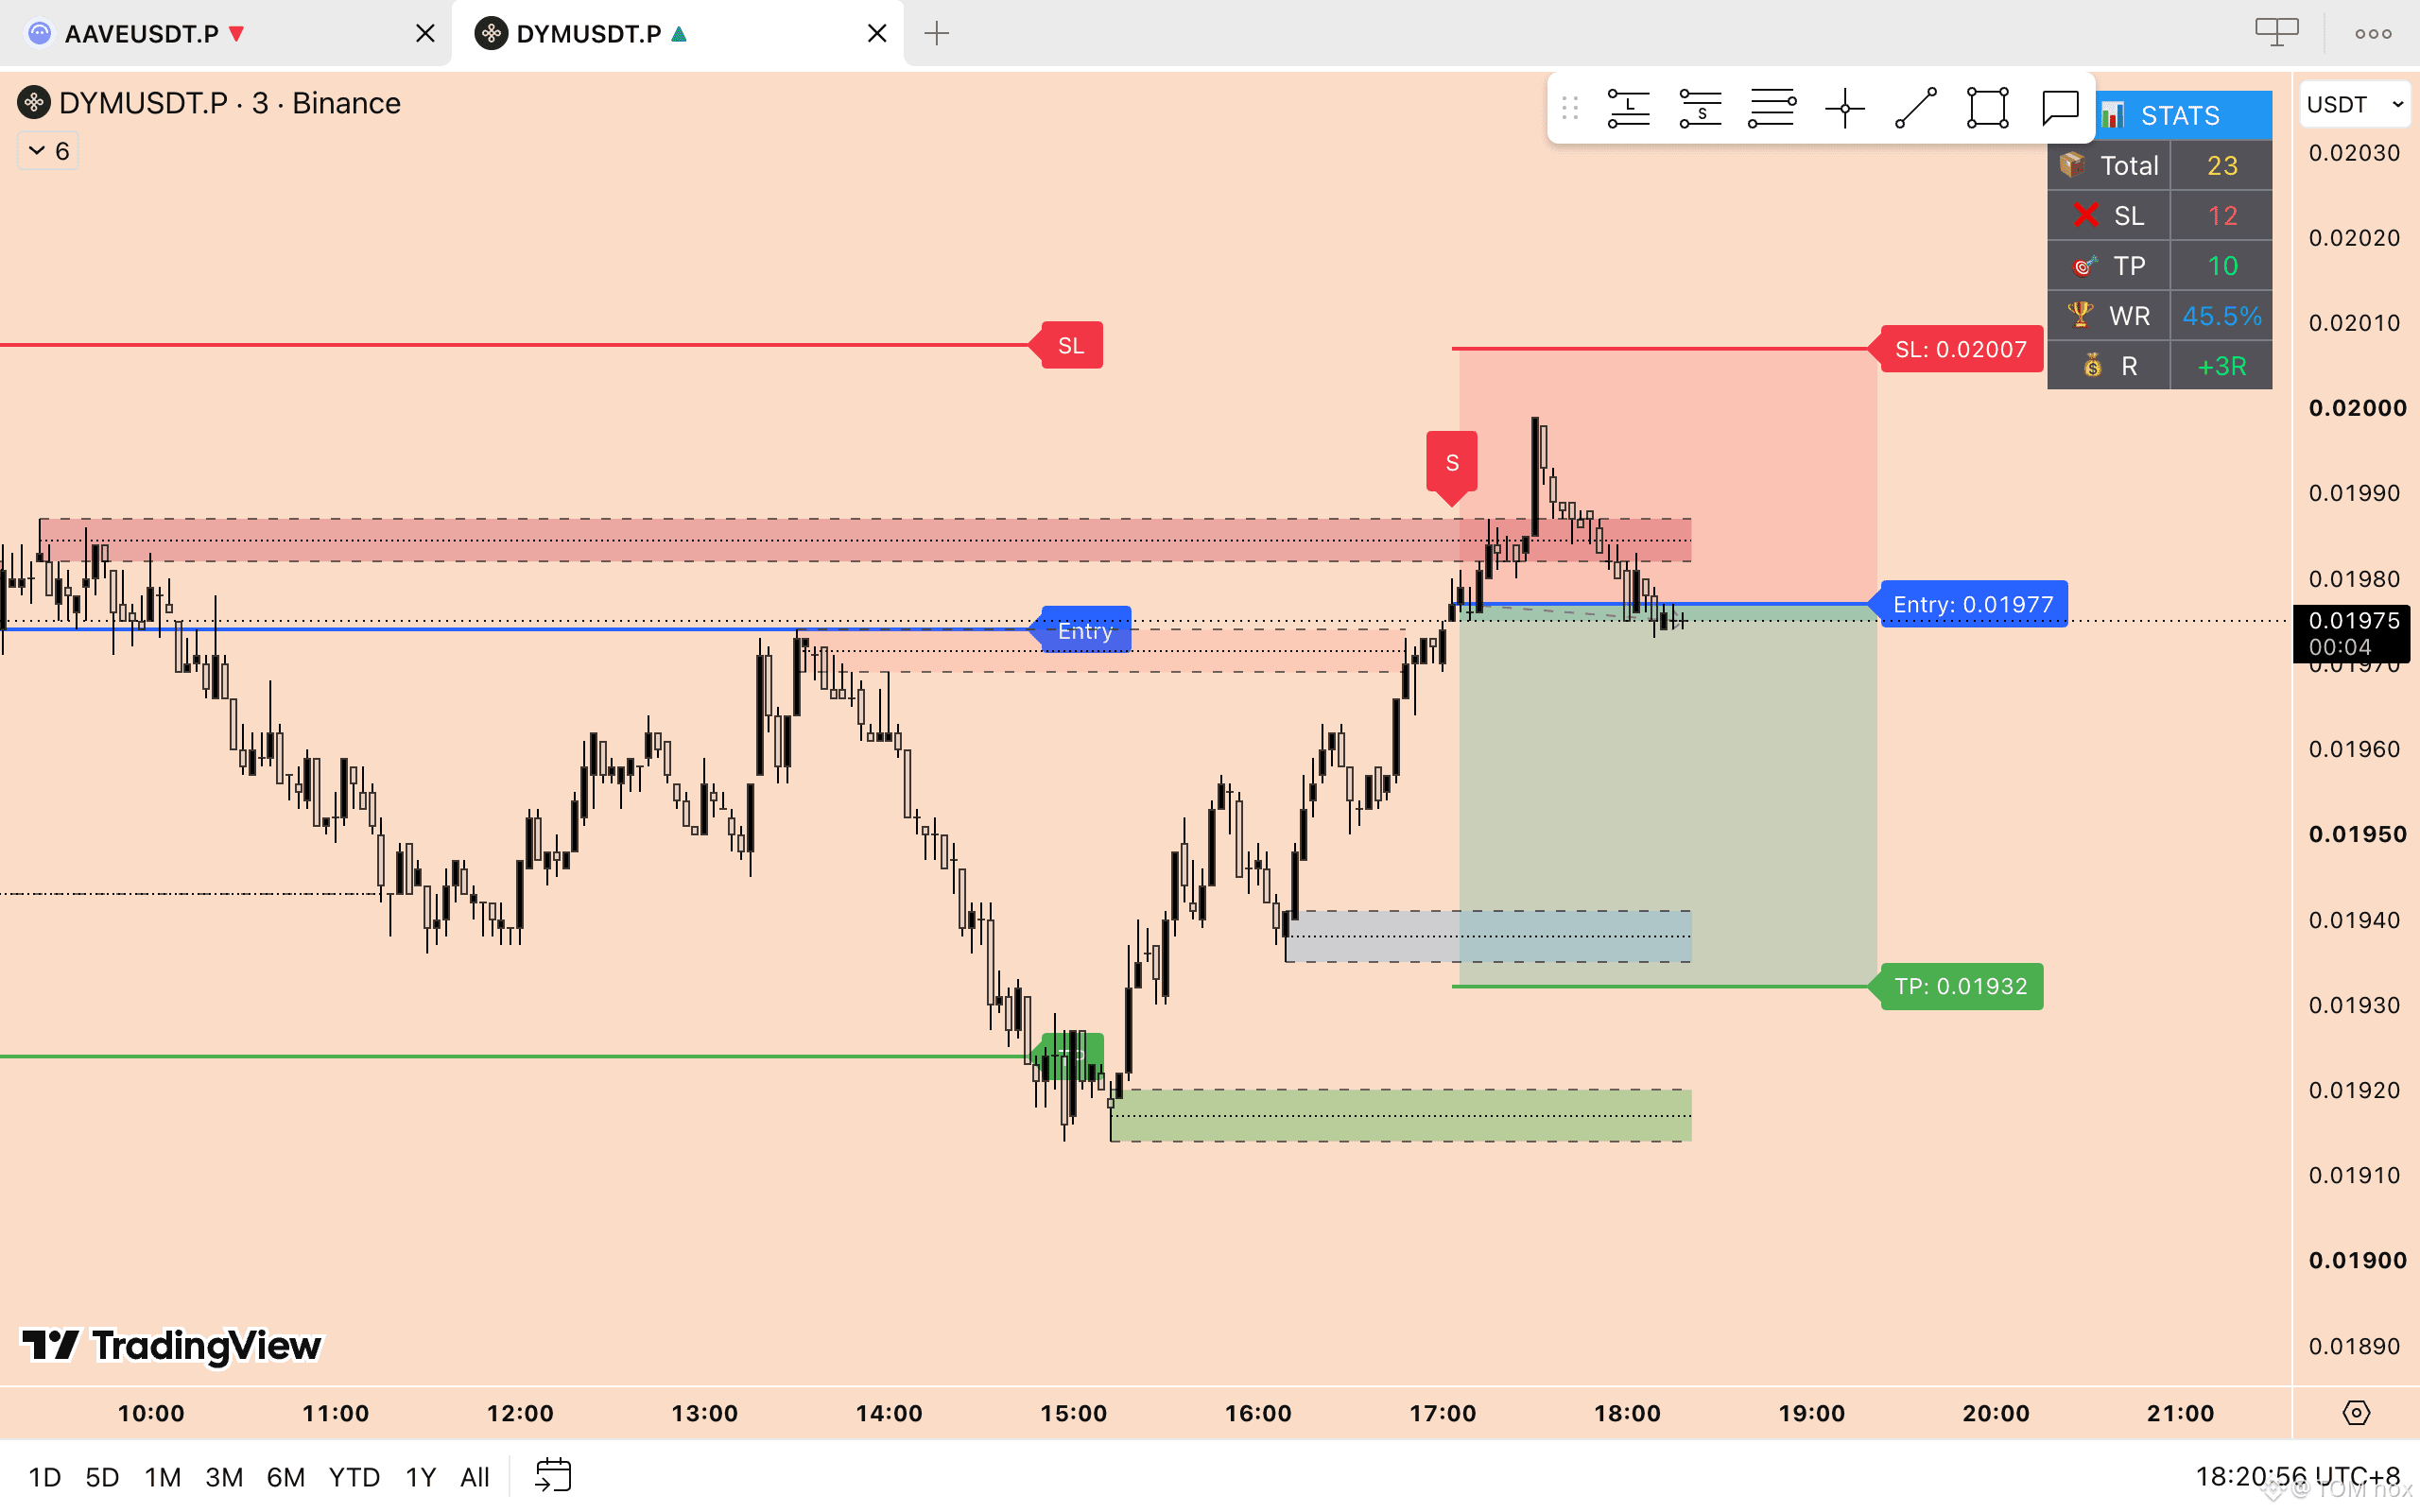
$DYM - SHORT
Open a short-term SHORT position here. 📉
The setup looks interesting for a quick move down. Manage your risk carefully, stay patient, and let the trade play out.
If this trade works out, you can thank me later. 😉🔥
{future}(DYMUSDT)
$DYM - SHORT
Open a short-term SHORT position here. 📉
The setup looks interesting for a quick move down. Manage your risk carefully, stay patient, and let the trade play out.
If this trade works out, you can thank me later. 😉🔥
Open a short-term SHORT position here. 📉
The setup looks interesting for a quick move down. Manage your risk carefully, stay patient, and let the trade play out.
If this trade works out, you can thank me later. 😉🔥
1
163
·
--
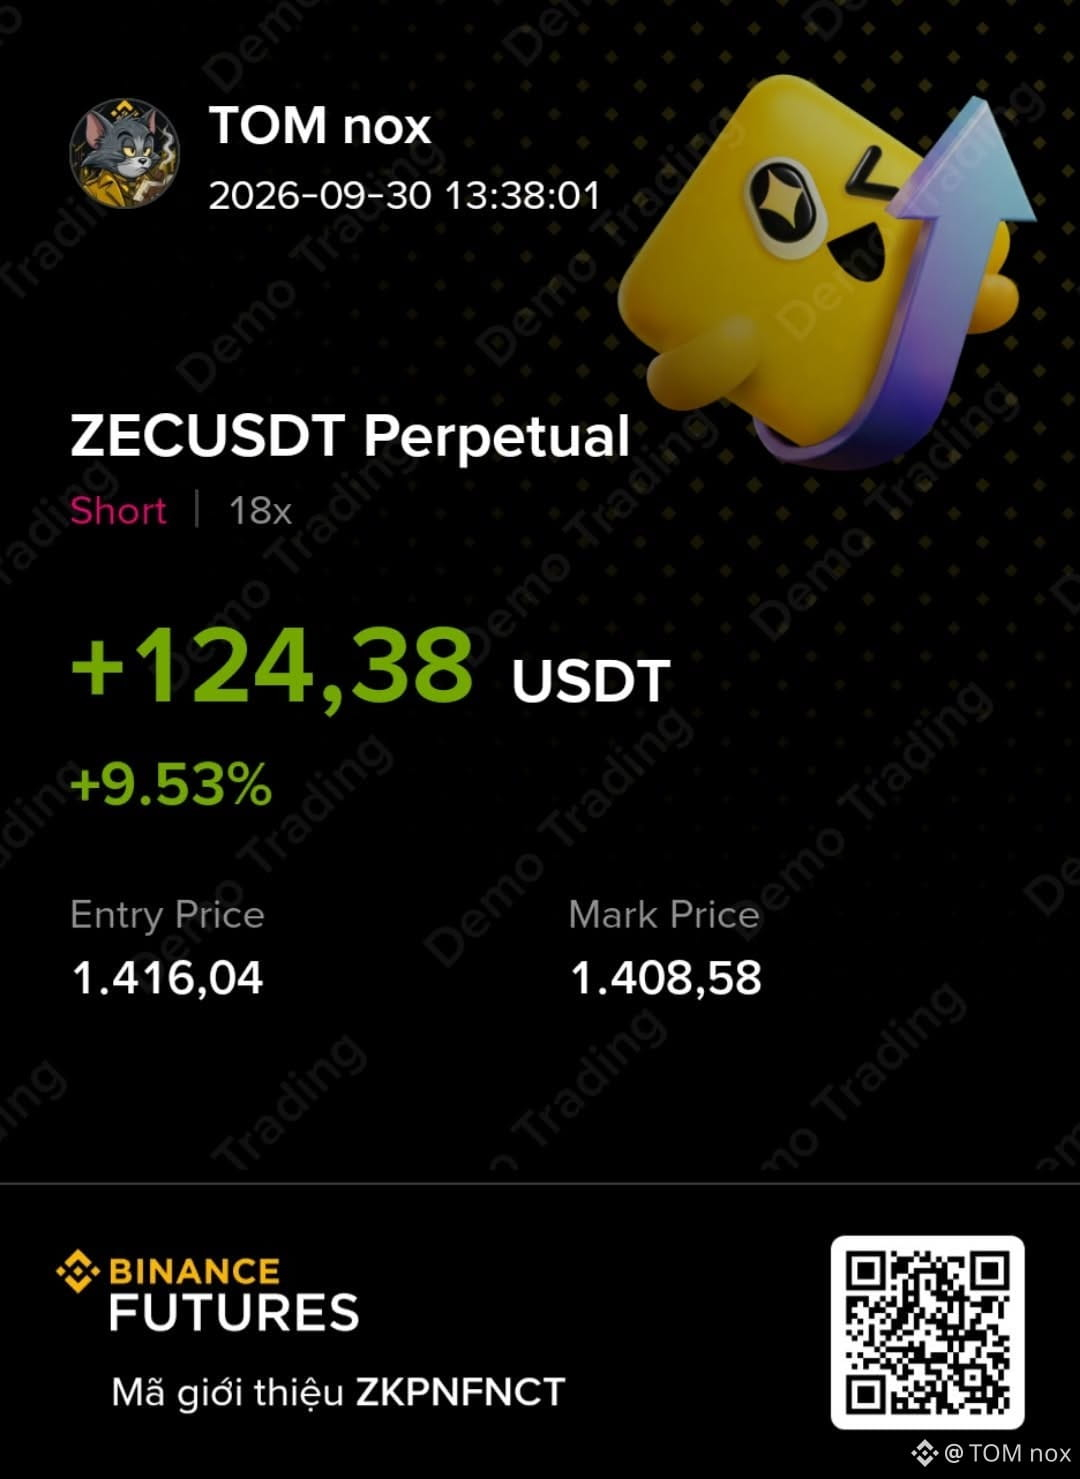
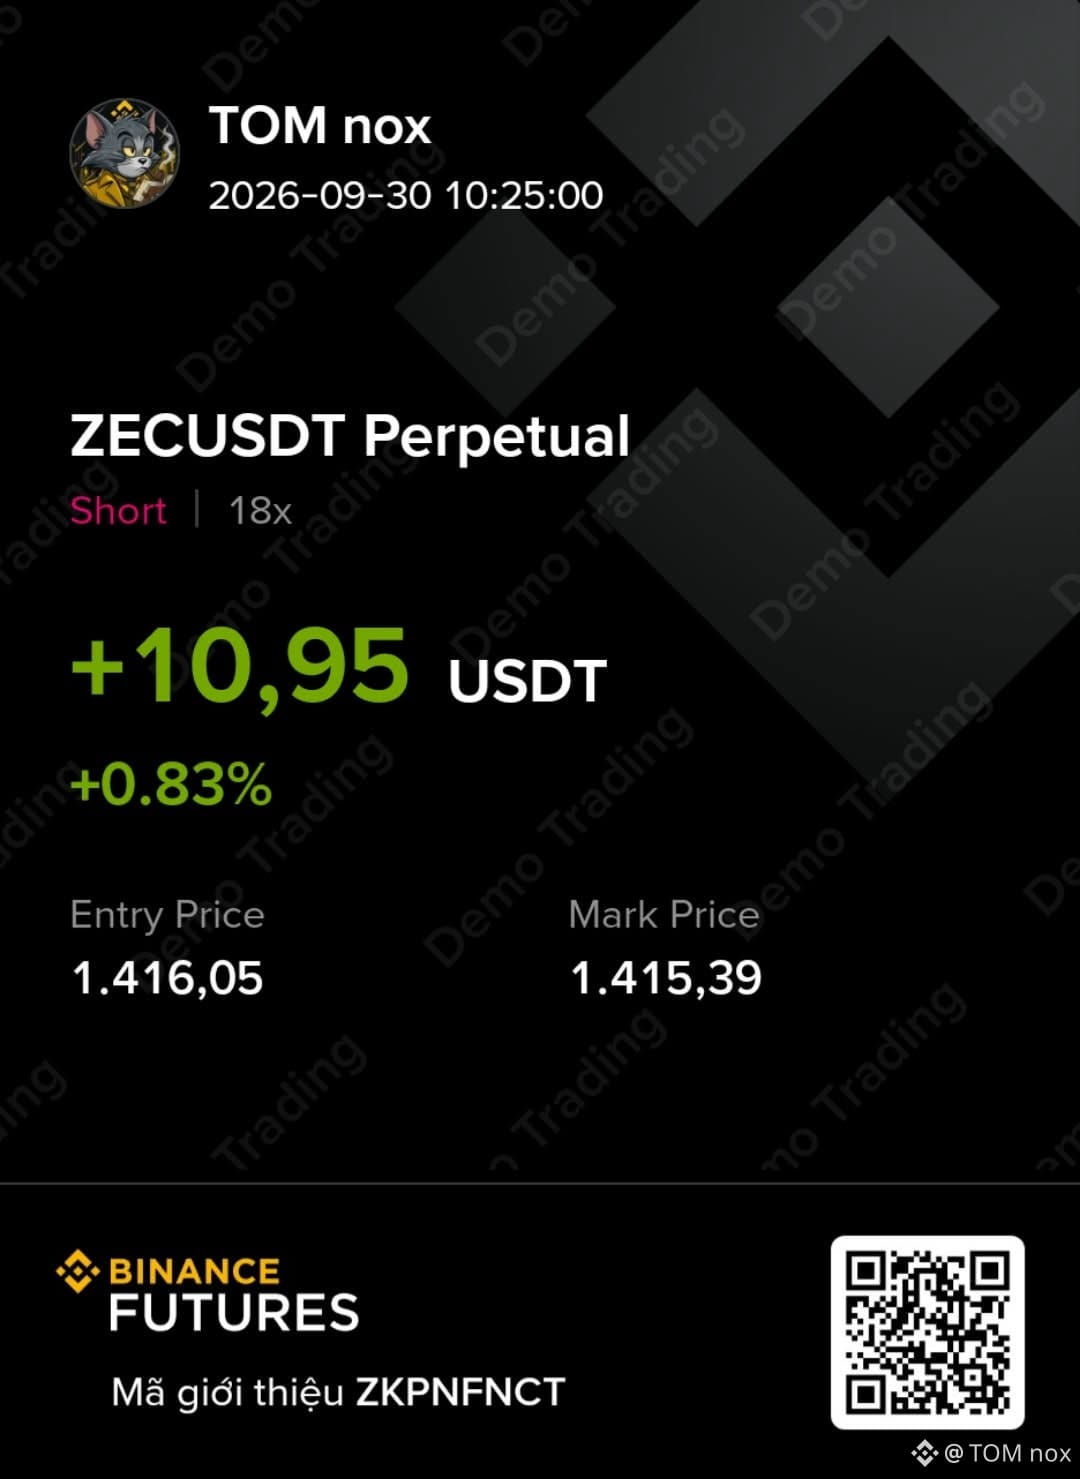
Just as I analyzed earlier, $ZEC is continuing to move lower.
Do you think it can eventually fall back to the $1 zone? 👀
I’m planning to hold my SHORT position until then.
And if ZEC actually reaches $1, how about I share a portion of the profits with everyone following me? 🎁
What do you think happens next?
{future}(UNIUSDT)
{future}(QNTUSDT)
{future}(ZECUSDT)
Just as I analyzed earlier, $ZEC is continuing to move lower.
Do you think it can eventually fall back to the $1 zone? 👀
I’m planning to hold my SHORT position until then.
And if ZEC actually reaches $1, how about I share a portion of the profits with everyone following me? 🎁
What do you think happens next?
Do you think it can eventually fall back to the $1 zone? 👀
I’m planning to hold my SHORT position until then.
And if ZEC actually reaches $1, how about I share a portion of the profits with everyone following me? 🎁
What do you think happens next?
🔴 ZEC will go down
🟢 ZEC will go up
1 day(s) left
6
1
1.8k
·
--
⚠️ HIGH LEVERAGE DOESN’T KILL YOUR ACCOUNT. USING IT WRONG DOES.
There’s one piece of advice I see everywhere in trading:
“Don’t use high leverage. It’s too dangerous.”
Sounds right.
But here’s the problem…
📌 LEVERAGE ≠ RISK
Leverage itself doesn’t determine how much money you’re actually risking.
What matters more is your RISK per trade.
For example:
📊 Win Rate: 45%
🎯 R:R: 3.3:1
If you risk less than 5% per trade, your account can actually lose money after trading fees are taken into account.
But if you understand how to calculate:
Stop Loss → Position Size → Risk → Leverage
you can adjust your leverage while still controlling exactly how much capital you’re putting at risk.
🧮 HERE’S WHERE IT GETS INTERESTING
Same system.
Same Win Rate.
Same R:R.
But change the risk per trade:
5% → 10% → 15%
Your equity curve can look completely different.
And this is something you don't need to argue about.
📈 JUST OPEN YOUR EXCEL FILE.
Run 100–200 trades using the exact same system.
Then test different risk levels:
🔹 5% risk
🔹 10% risk
🔹 15% risk
Look at the final balance.
Look at the drawdown.
Look at the losing streaks.
The numbers will tell you the story.
⚠️ BUT THERE’S A CATCH
Higher risk also means:
→ Bigger drawdowns
→ Bigger losses during losing streaks
→ Higher probability of severe account damage
There is no such thing as “free risk.”
The goal isn't to use the highest leverage possible.
The goal is to understand how leverage, position size, stop loss and risk are connected.
❓ SO WHAT SHOULD YOU ASK?
Not:
“What leverage is safe?”
But:
“Given this setup, how much should I risk, and how much leverage do I need to achieve that position size?”
🎯 Risk first. Leverage second.
Are you calculating your risk first and choosing leverage afterward…
or are you choosing leverage first and then…
praying the market doesn’t move against you? 👀
{future}(PUMPUSDT)
{future}(MOVRUSDT)
{future}(ZECUSDT)
⚠️ HIGH LEVERAGE DOESN’T KILL YOUR ACCOUNT. USING IT WRONG DOES.
There’s one piece of advice I see everywhere in trading:
“Don’t use high leverage. It’s too dangerous.”
Sounds right.
But here’s the problem…
📌 LEVERAGE ≠ RISK
Leverage itself doesn’t determine how much money you’re actually risking.
What matters more is your RISK per trade.
For example:
📊 Win Rate: 45%
🎯 R:R: 3.3:1
If you risk less than 5% per trade, your account can actually lose money after trading fees are taken into account.
But if you understand how to calculate:
Stop Loss → Position Size → Risk → Leverage
you can adjust your leverage while still controlling exactly how much capital you’re putting at risk.
🧮 HERE’S WHERE IT GETS INTERESTING
Same system.
Same Win Rate.
Same R:R.
But change the risk per trade:
5% → 10% → 15%
Your equity curve can look completely different.
And this is something you don't need to argue about.
📈 JUST OPEN YOUR EXCEL FILE.
Run 100–200 trades using the exact same system.
Then test different risk levels:
🔹 5% risk
🔹 10% risk
🔹 15% risk
Look at the final balance.
Look at the drawdown.
Look at the losing streaks.
The numbers will tell you the story.
⚠️ BUT THERE’S A CATCH
Higher risk also means:
→ Bigger drawdowns
→ Bigger losses during losing streaks
→ Higher probability of severe account damage
There is no such thing as “free risk.”
The goal isn't to use the highest leverage possible.
The goal is to understand how leverage, position size, stop loss and risk are connected.
❓ SO WHAT SHOULD YOU ASK?
Not:
“What leverage is safe?”
But:
“Given this setup, how much should I risk, and how much leverage do I need to achieve that position size?”
🎯 Risk first. Leverage second.
Are you calculating your risk first and choosing leverage afterward…
or are you choosing leverage first and then…
praying the market doesn’t move against you? 👀
There’s one piece of advice I see everywhere in trading:
“Don’t use high leverage. It’s too dangerous.”
Sounds right.
But here’s the problem…
📌 LEVERAGE ≠ RISK
Leverage itself doesn’t determine how much money you’re actually risking.
What matters more is your RISK per trade.
For example:
📊 Win Rate: 45%
🎯 R:R: 3.3:1
If you risk less than 5% per trade, your account can actually lose money after trading fees are taken into account.
But if you understand how to calculate:
Stop Loss → Position Size → Risk → Leverage
you can adjust your leverage while still controlling exactly how much capital you’re putting at risk.
🧮 HERE’S WHERE IT GETS INTERESTING
Same system.
Same Win Rate.
Same R:R.
But change the risk per trade:
5% → 10% → 15%
Your equity curve can look completely different.
And this is something you don't need to argue about.
📈 JUST OPEN YOUR EXCEL FILE.
Run 100–200 trades using the exact same system.
Then test different risk levels:
🔹 5% risk
🔹 10% risk
🔹 15% risk
Look at the final balance.
Look at the drawdown.
Look at the losing streaks.
The numbers will tell you the story.
⚠️ BUT THERE’S A CATCH
Higher risk also means:
→ Bigger drawdowns
→ Bigger losses during losing streaks
→ Higher probability of severe account damage
There is no such thing as “free risk.”
The goal isn't to use the highest leverage possible.
The goal is to understand how leverage, position size, stop loss and risk are connected.
❓ SO WHAT SHOULD YOU ASK?
Not:
“What leverage is safe?”
But:
“Given this setup, how much should I risk, and how much leverage do I need to achieve that position size?”
🎯 Risk first. Leverage second.
Are you calculating your risk first and choosing leverage afterward…
or are you choosing leverage first and then…
praying the market doesn’t move against you? 👀
1
458
·
--
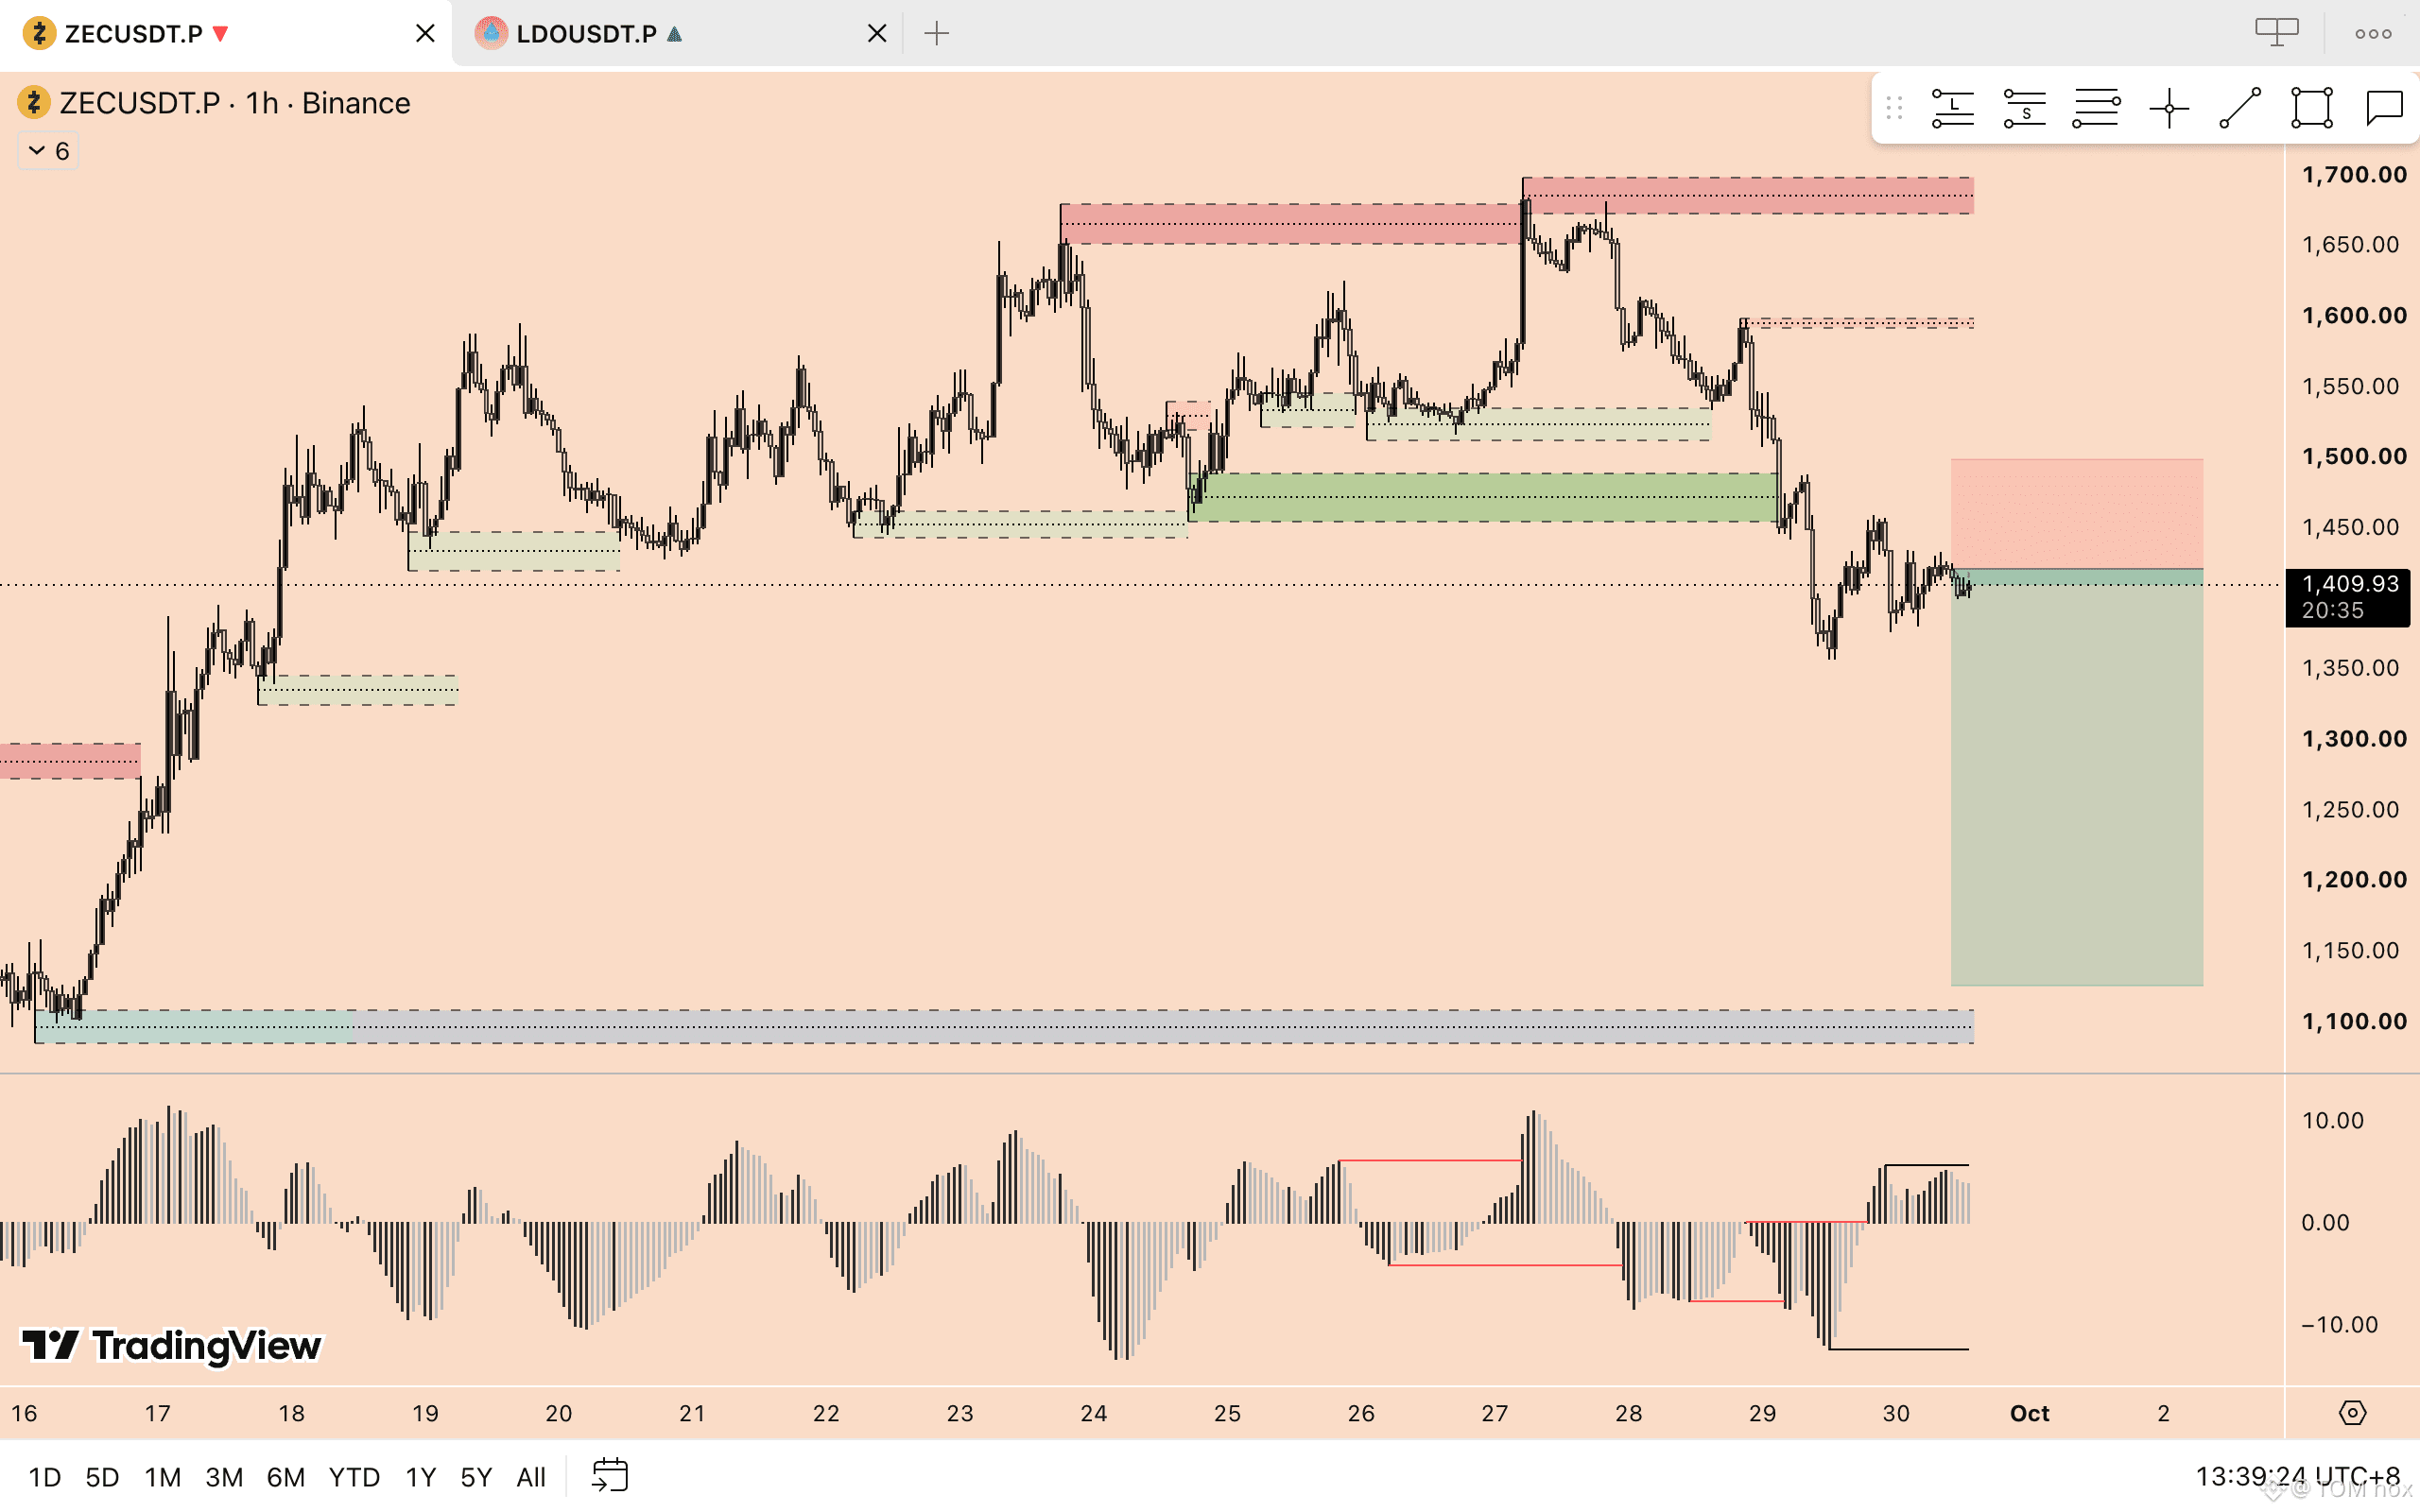
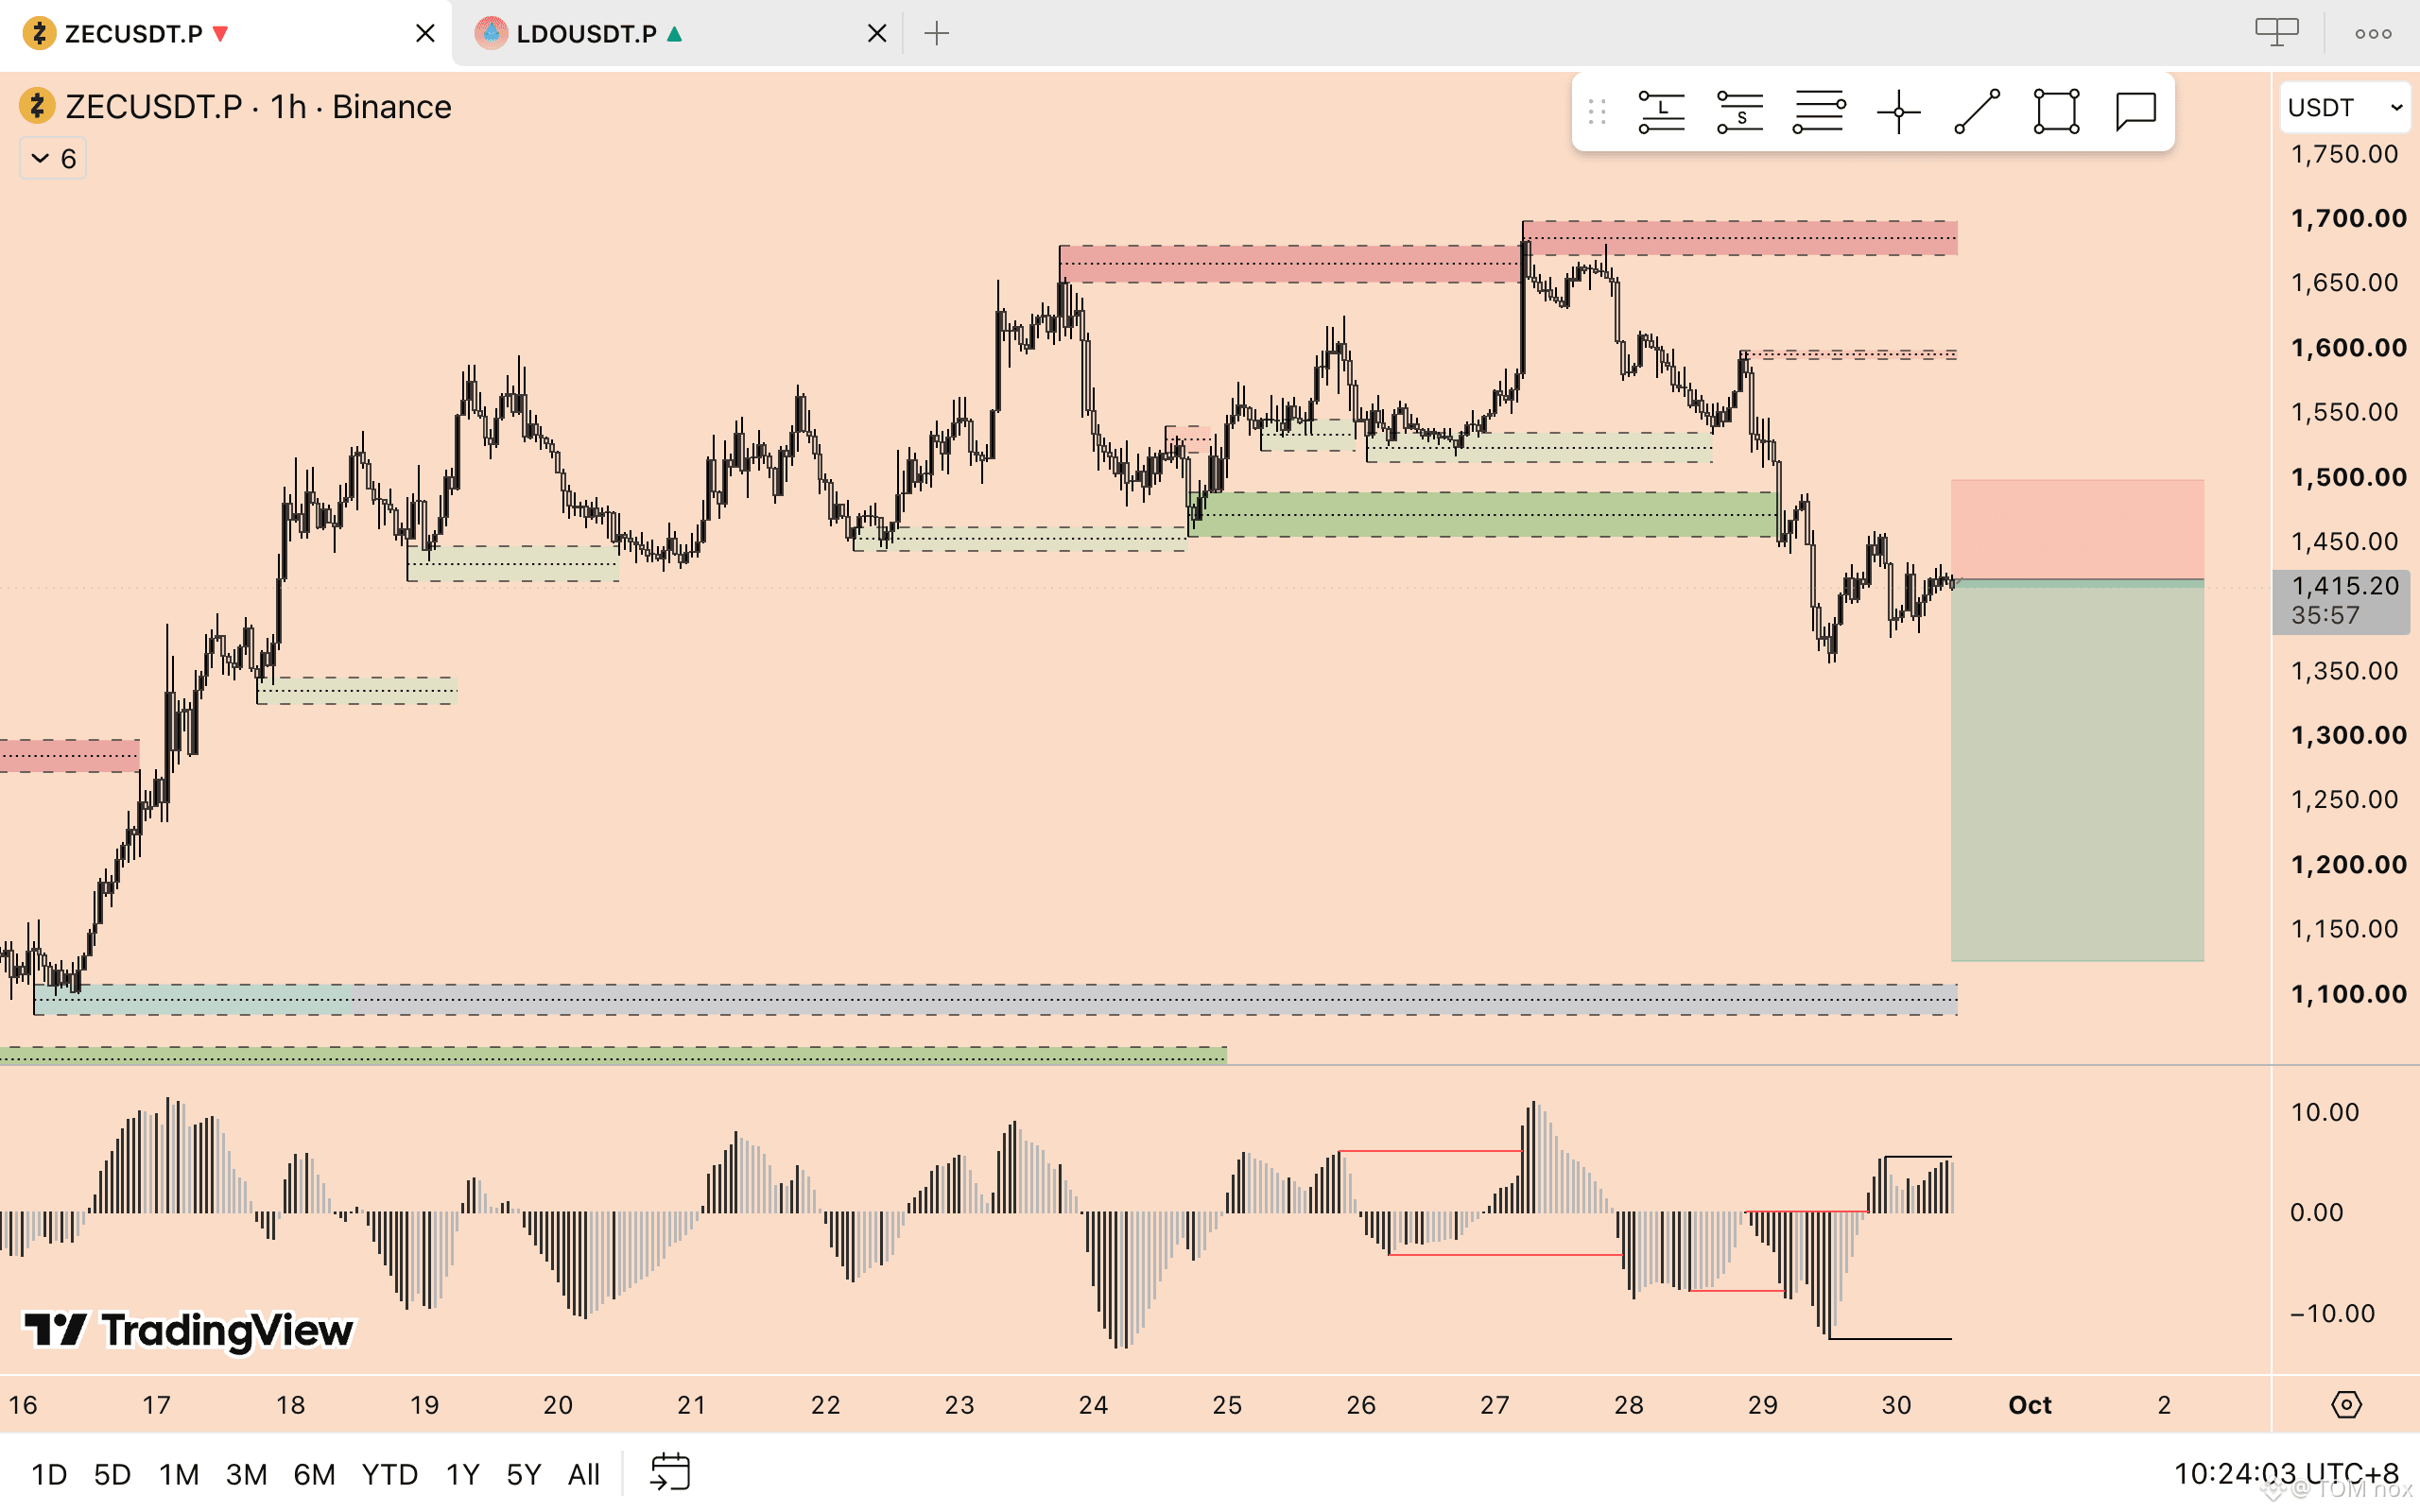
$ZEC WHEN WILL YOU SHORT ?
ZEC got rejected hard from the 1,650–1,700 area before breaking below the 1,450–1,500 support zone. Now price is bouncing back toward the exact area that previously acted as support.
Could this be a support-turned-resistance setup?
If ZEC gets rejected around 1,450–1,500, sellers could step back in and push price toward 1,350 first, with a deeper target around 1,100–1,150.
However, the histogram is recovering, so I wouldn't rush into a Short just because price is below the zone. The better scenario is to wait for a clear rejection and confirmation that buyers still can't reclaim the broken support.
Will ZEC turn this retest into another leg down, or can buyers reclaim 1,500 and invalidate the Short idea? 👀
{spot}(ZECUSDT)
{future}(ZECUSDT)
$ZEC WHEN WILL YOU SHORT ?
ZEC got rejected hard from the 1,650–1,700 area before breaking below the 1,450–1,500 support zone. Now price is bouncing back toward the exact area that previously acted as support.
Could this be a support-turned-resistance setup?
If ZEC gets rejected around 1,450–1,500, sellers could step back in and push price toward 1,350 first, with a deeper target around 1,100–1,150.
However, the histogram is recovering, so I wouldn't rush into a Short just because price is below the zone. The better scenario is to wait for a clear rejection and confirmation that buyers still can't reclaim the broken support.
Will ZEC turn this retest into another leg down, or can buyers reclaim 1,500 and invalidate the Short idea? 👀
ZEC got rejected hard from the 1,650–1,700 area before breaking below the 1,450–1,500 support zone. Now price is bouncing back toward the exact area that previously acted as support.
Could this be a support-turned-resistance setup?
If ZEC gets rejected around 1,450–1,500, sellers could step back in and push price toward 1,350 first, with a deeper target around 1,100–1,150.
However, the histogram is recovering, so I wouldn't rush into a Short just because price is below the zone. The better scenario is to wait for a clear rejection and confirmation that buyers still can't reclaim the broken support.
Will ZEC turn this retest into another leg down, or can buyers reclaim 1,500 and invalidate the Short idea? 👀
2
360
·
--
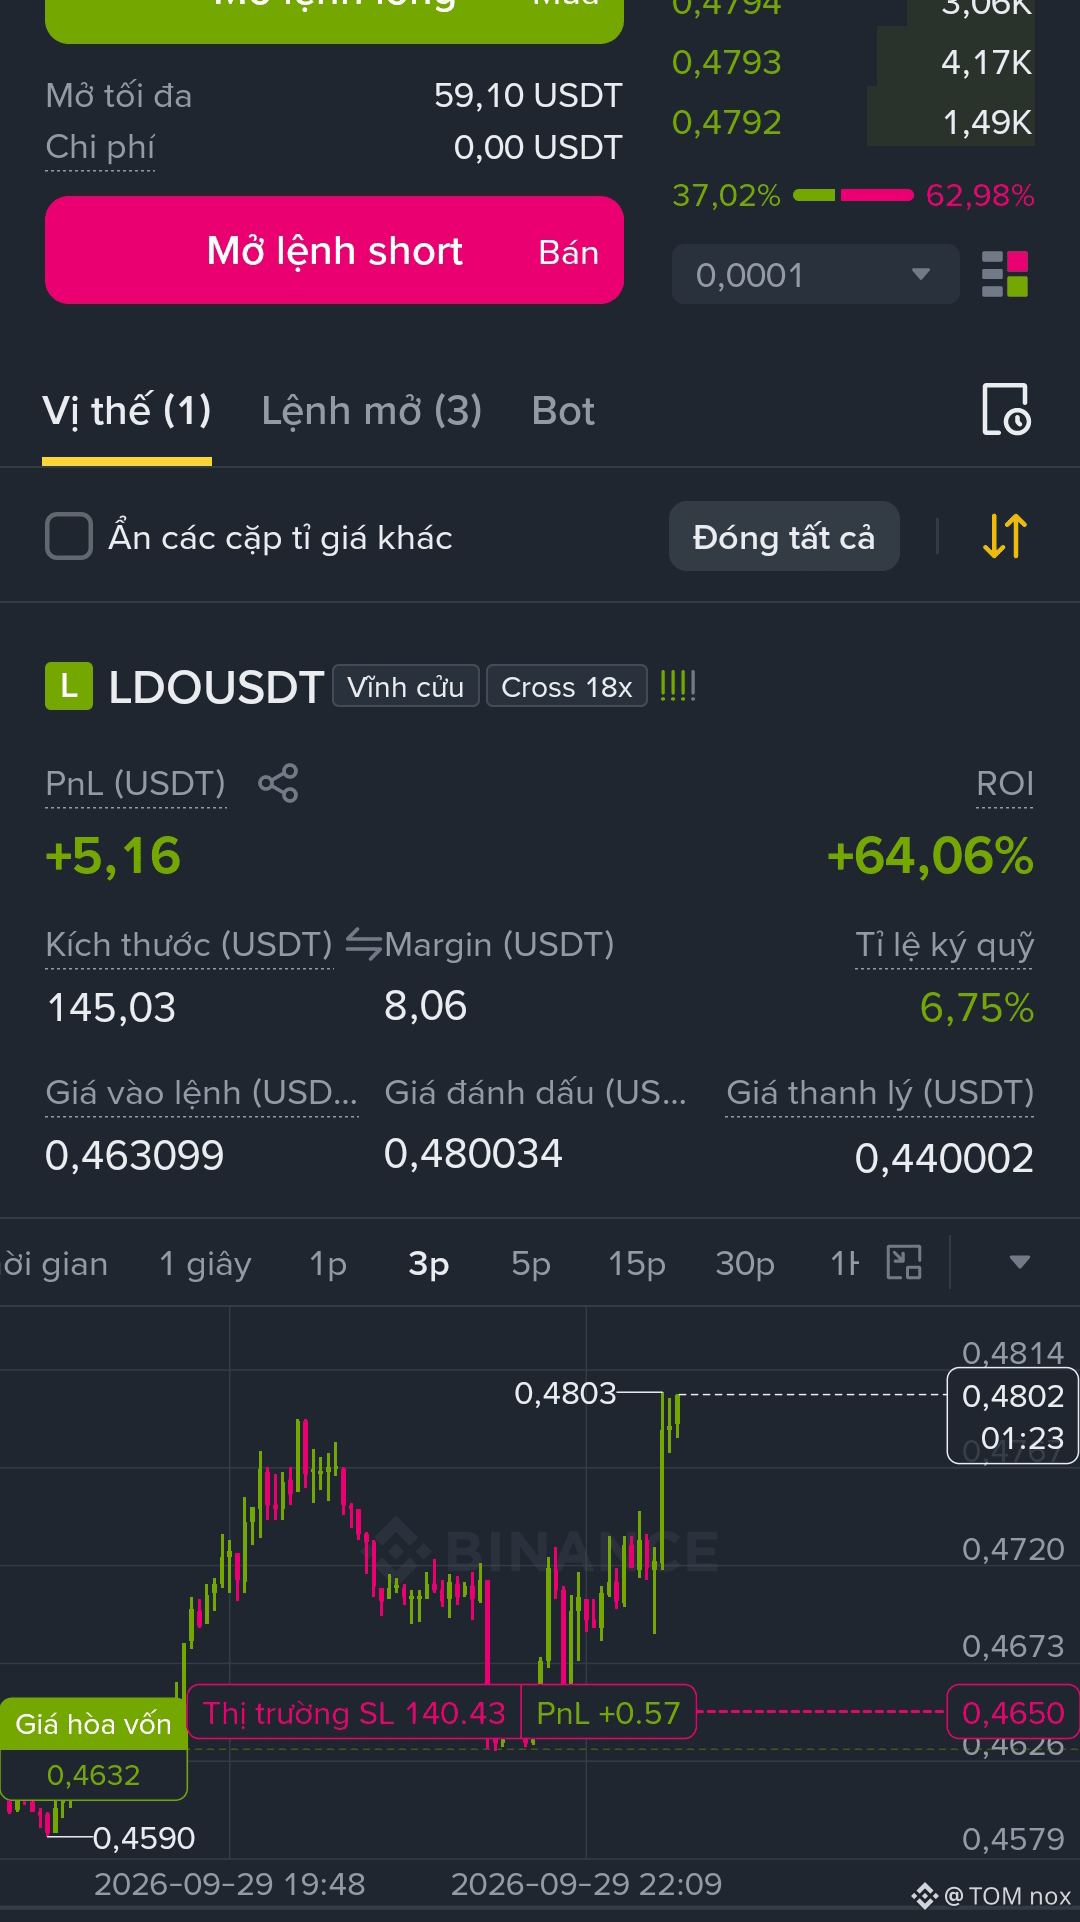
$LDO Starting soon for 1USDT?
Is anyone holding a LONG position?
$LDO Starting soon for 1USDT?
Is anyone holding a LONG position?
Is anyone holding a LONG position?
1
361
·
--
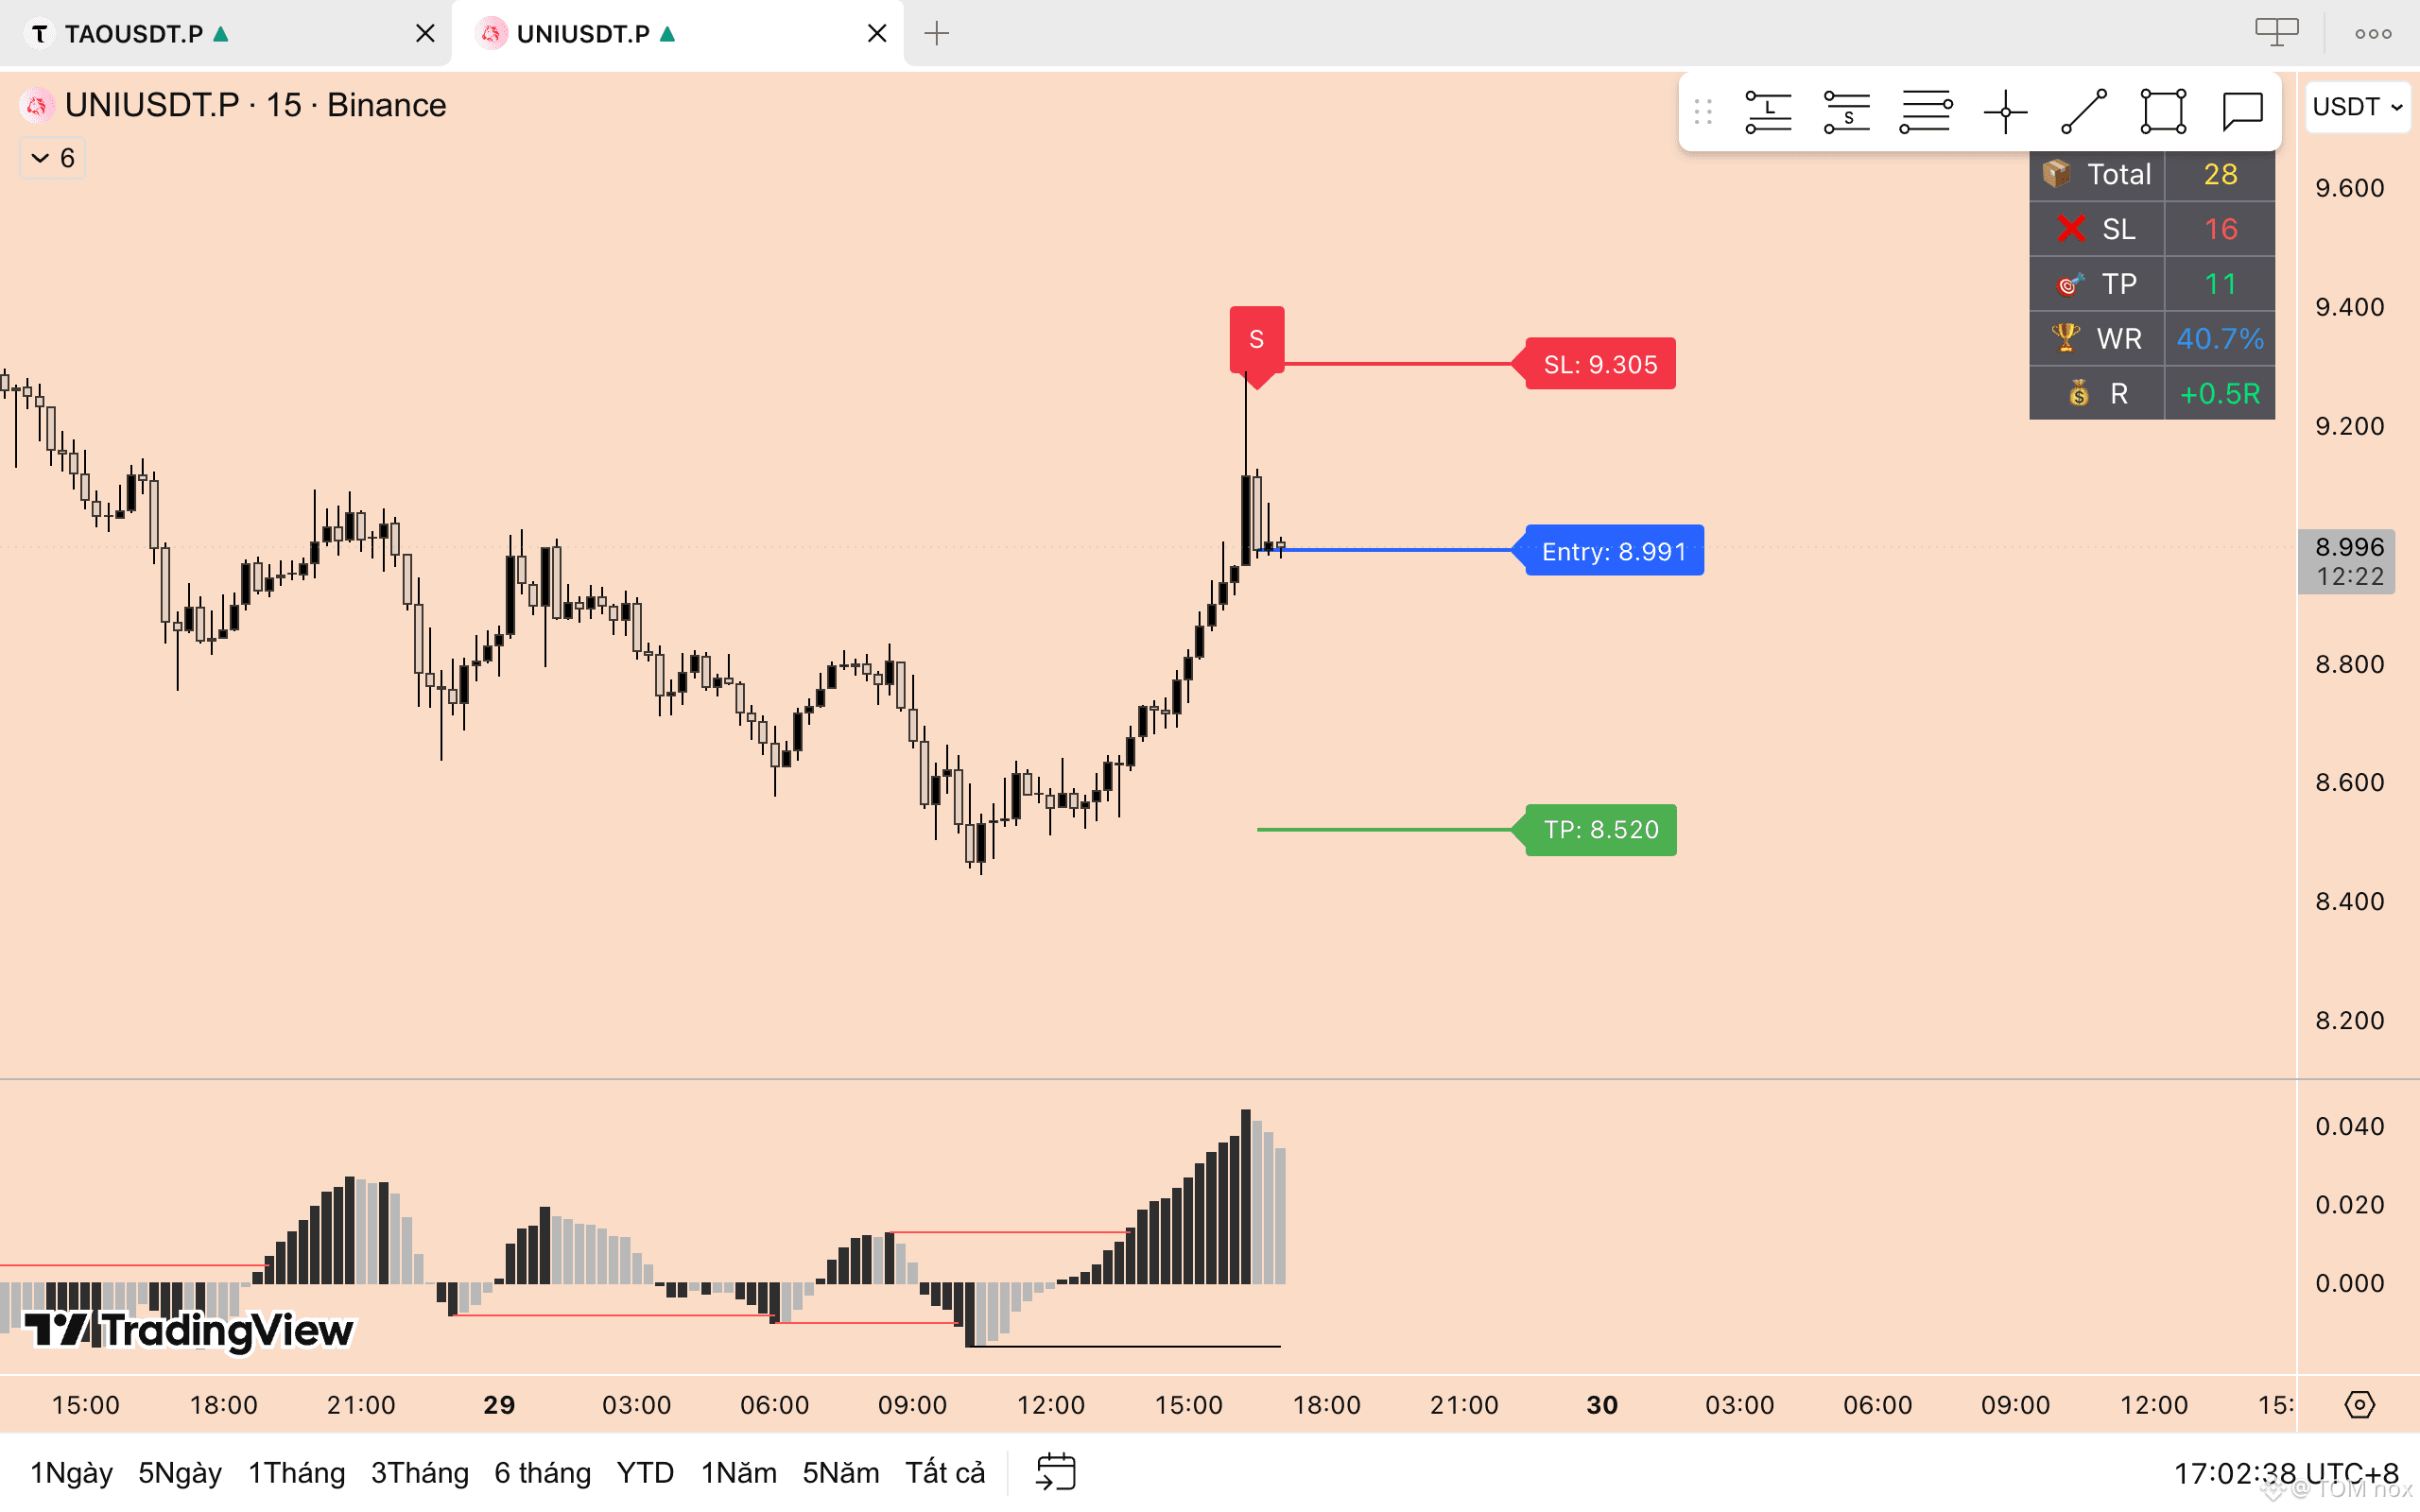
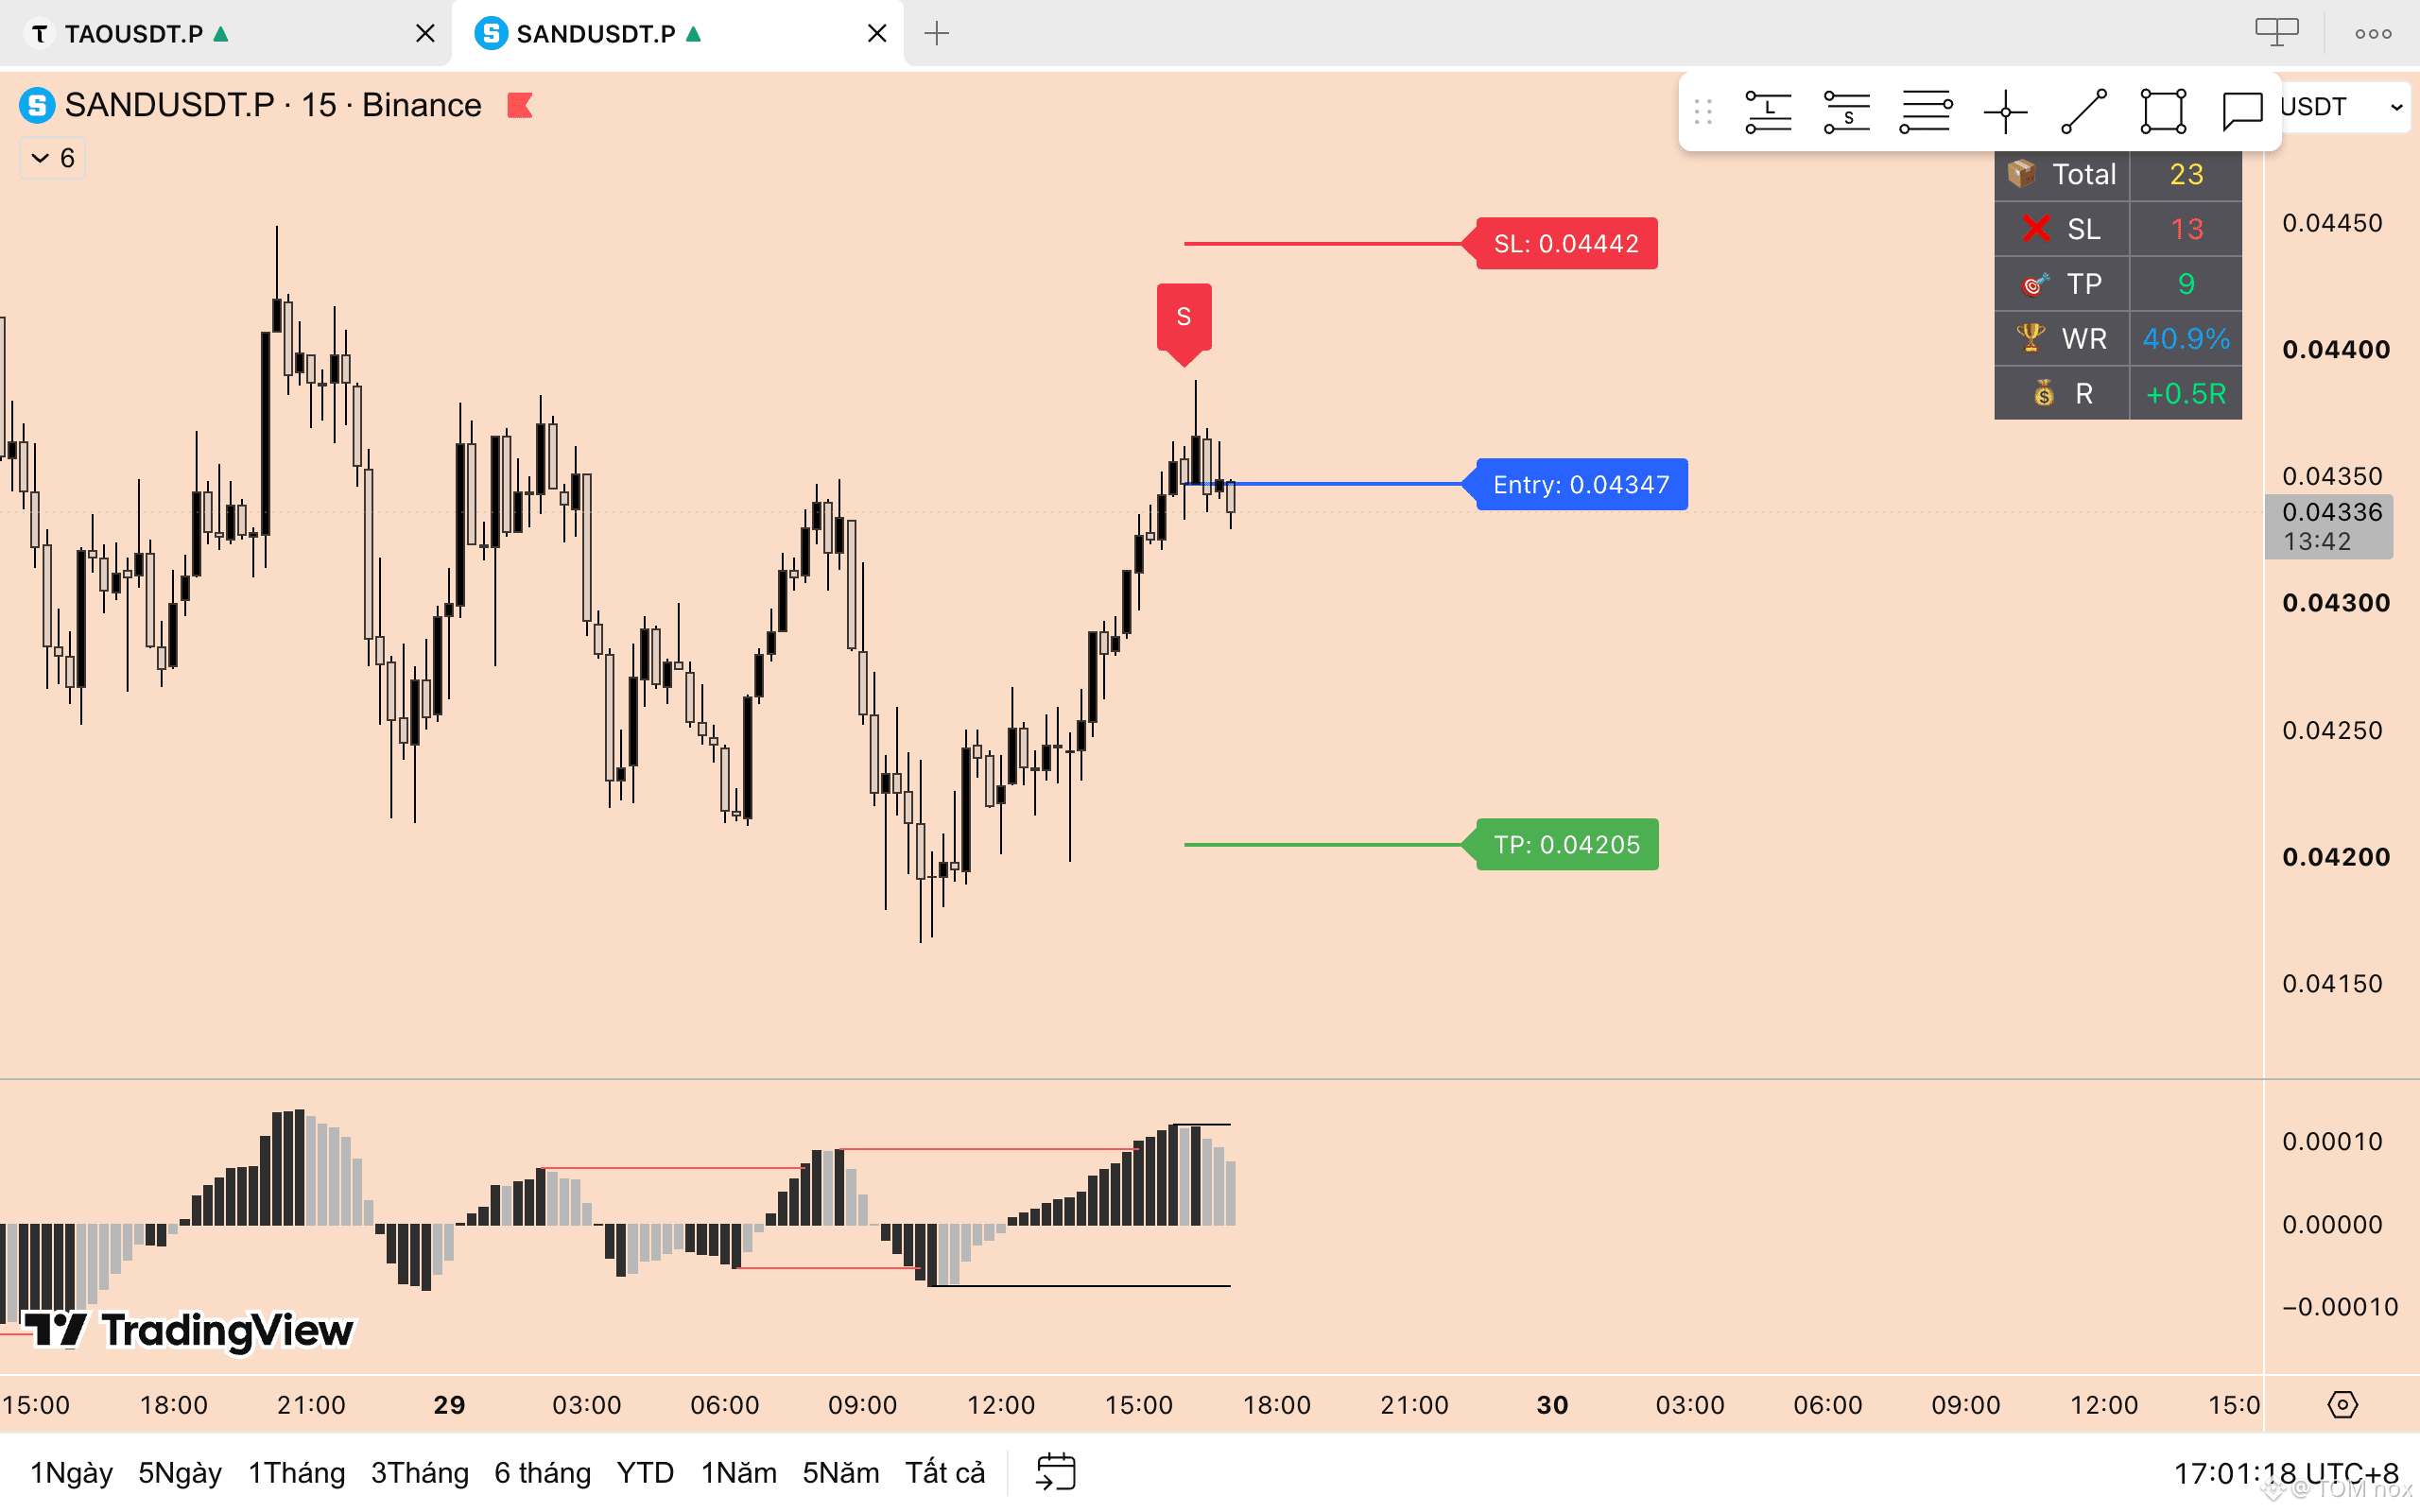
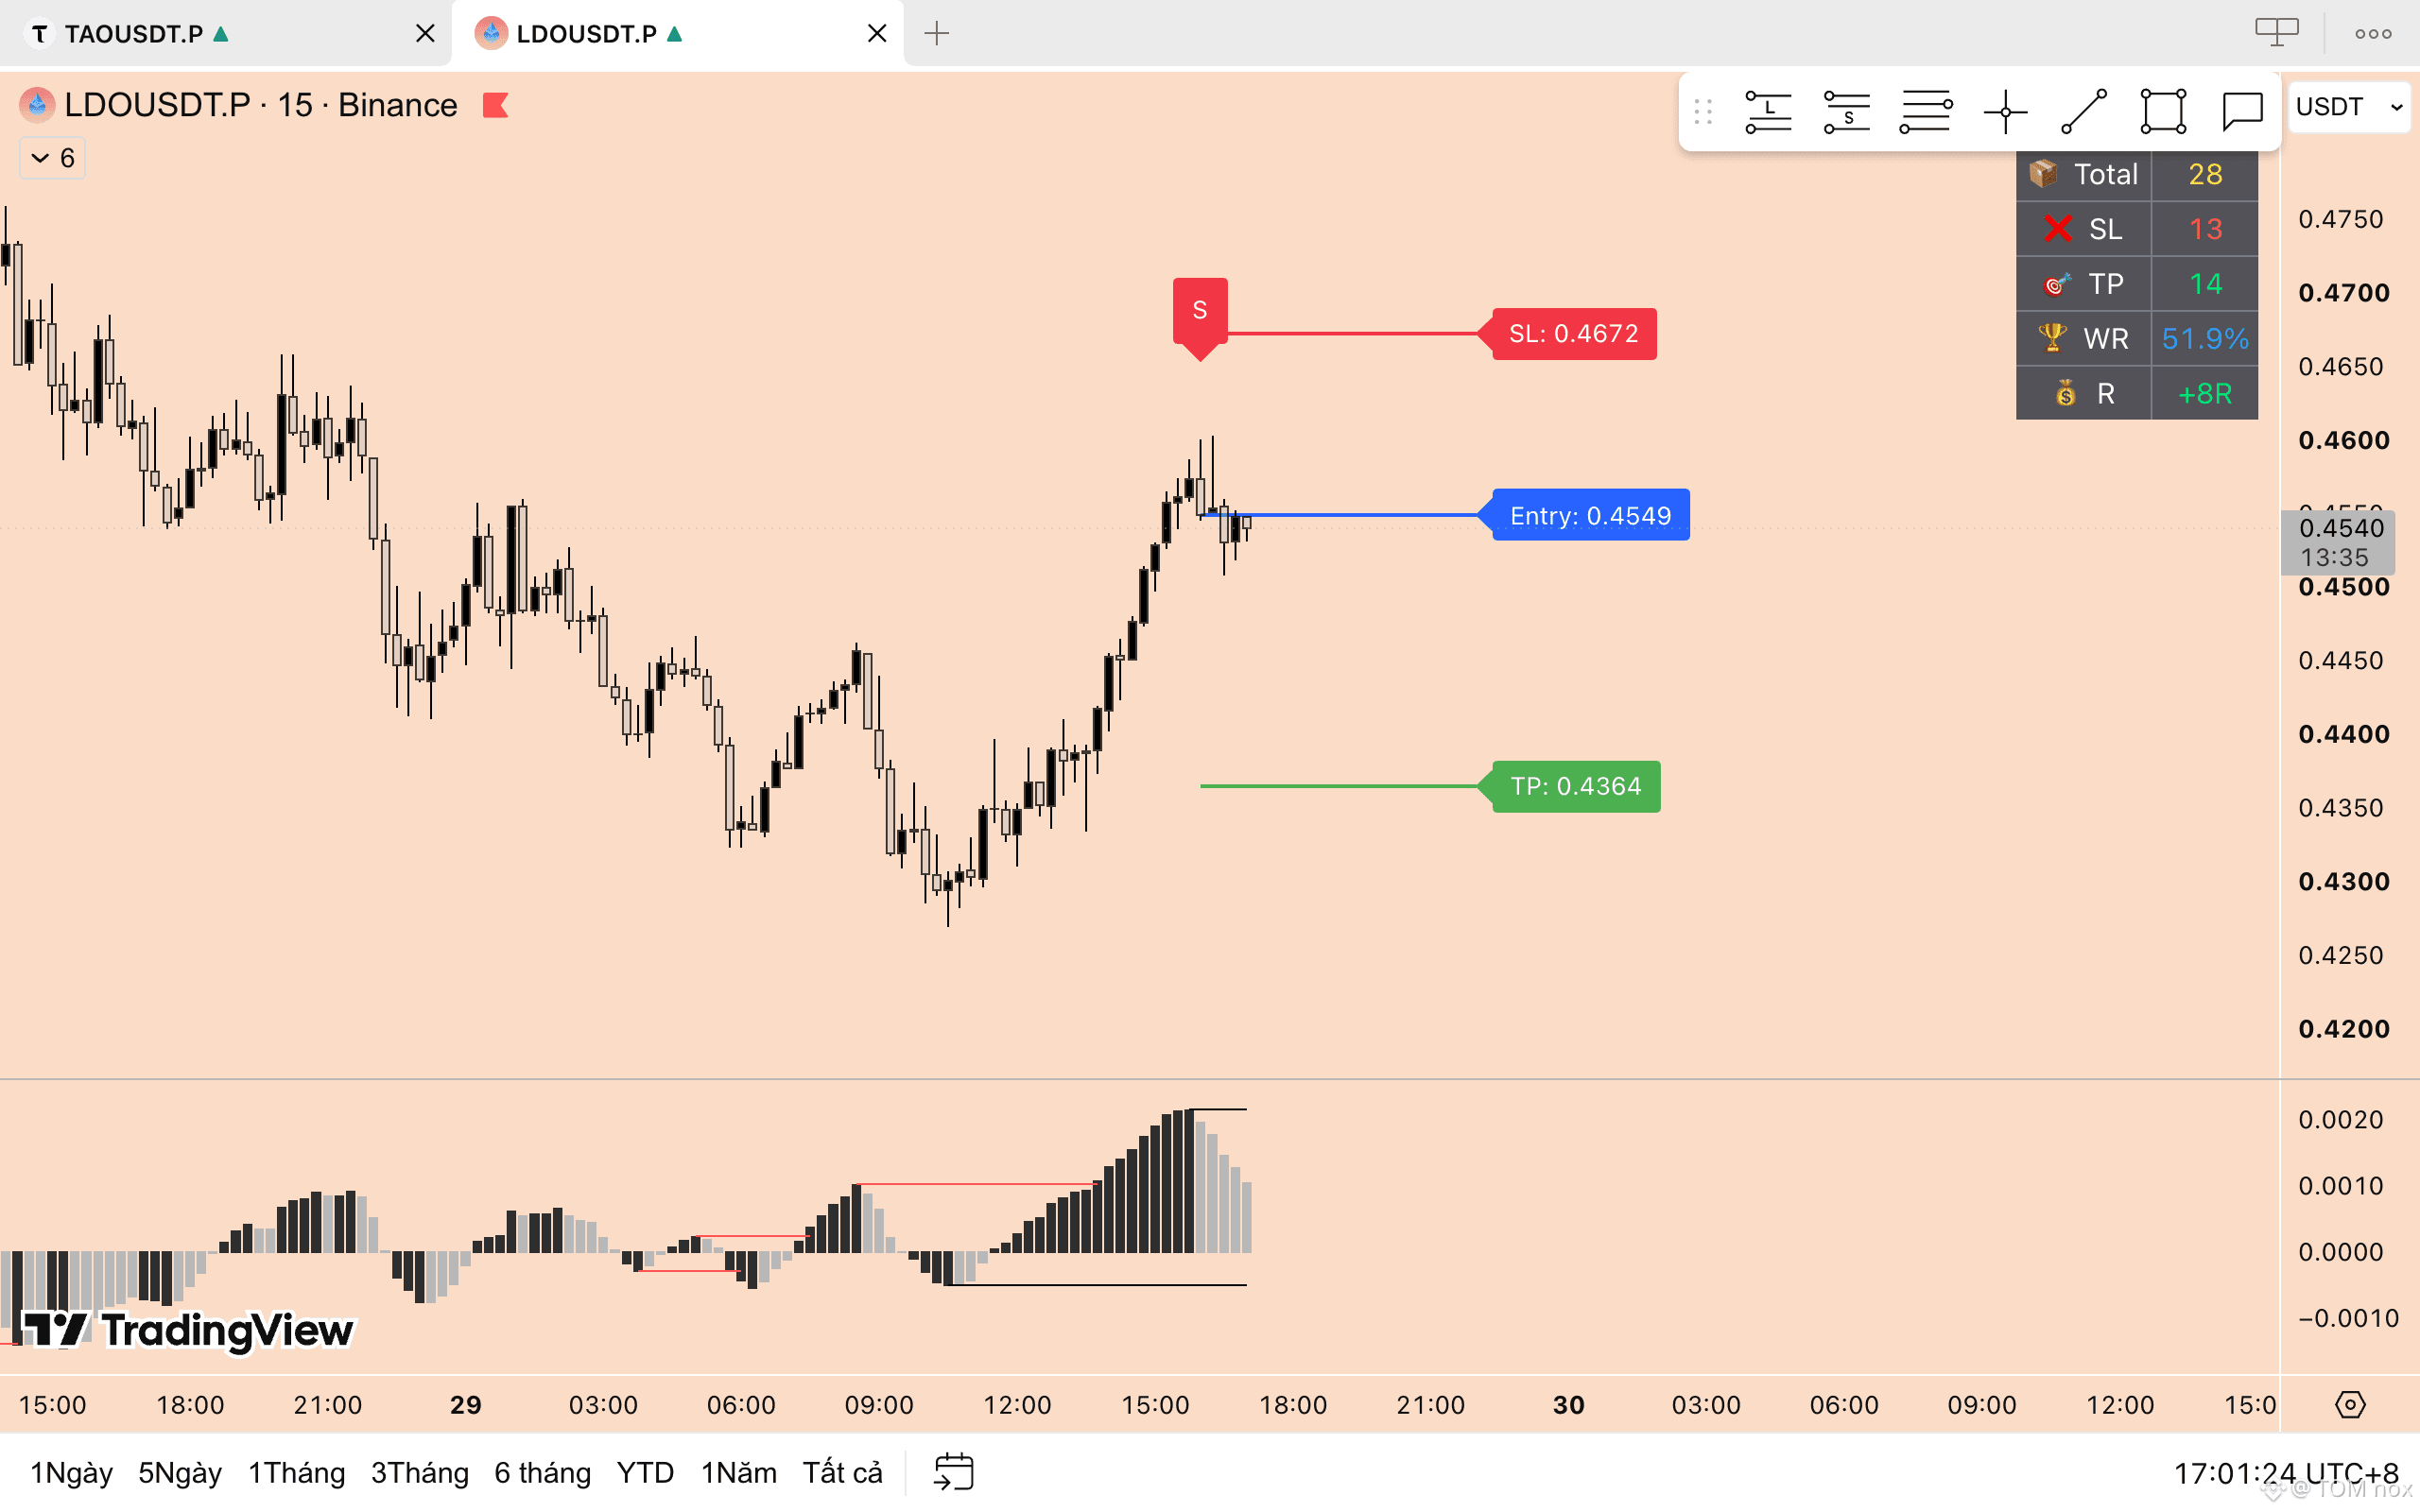
3 SHORT: $SAND $LDO $UNI
Signals appear on the 15-minute chart
RR: 1.5 / 1
👇Are you stuck in which trading order?
{future}(UNIUSDT)
{future}(LDOUSDT)
{future}(SANDUSDT)
3 SHORT: $SAND $LDO $UNI
Signals appear on the 15-minute chart
RR: 1.5 / 1
👇Are you stuck in which trading order?
Signals appear on the 15-minute chart
RR: 1.5 / 1
👇Are you stuck in which trading order?
2
514
·
--
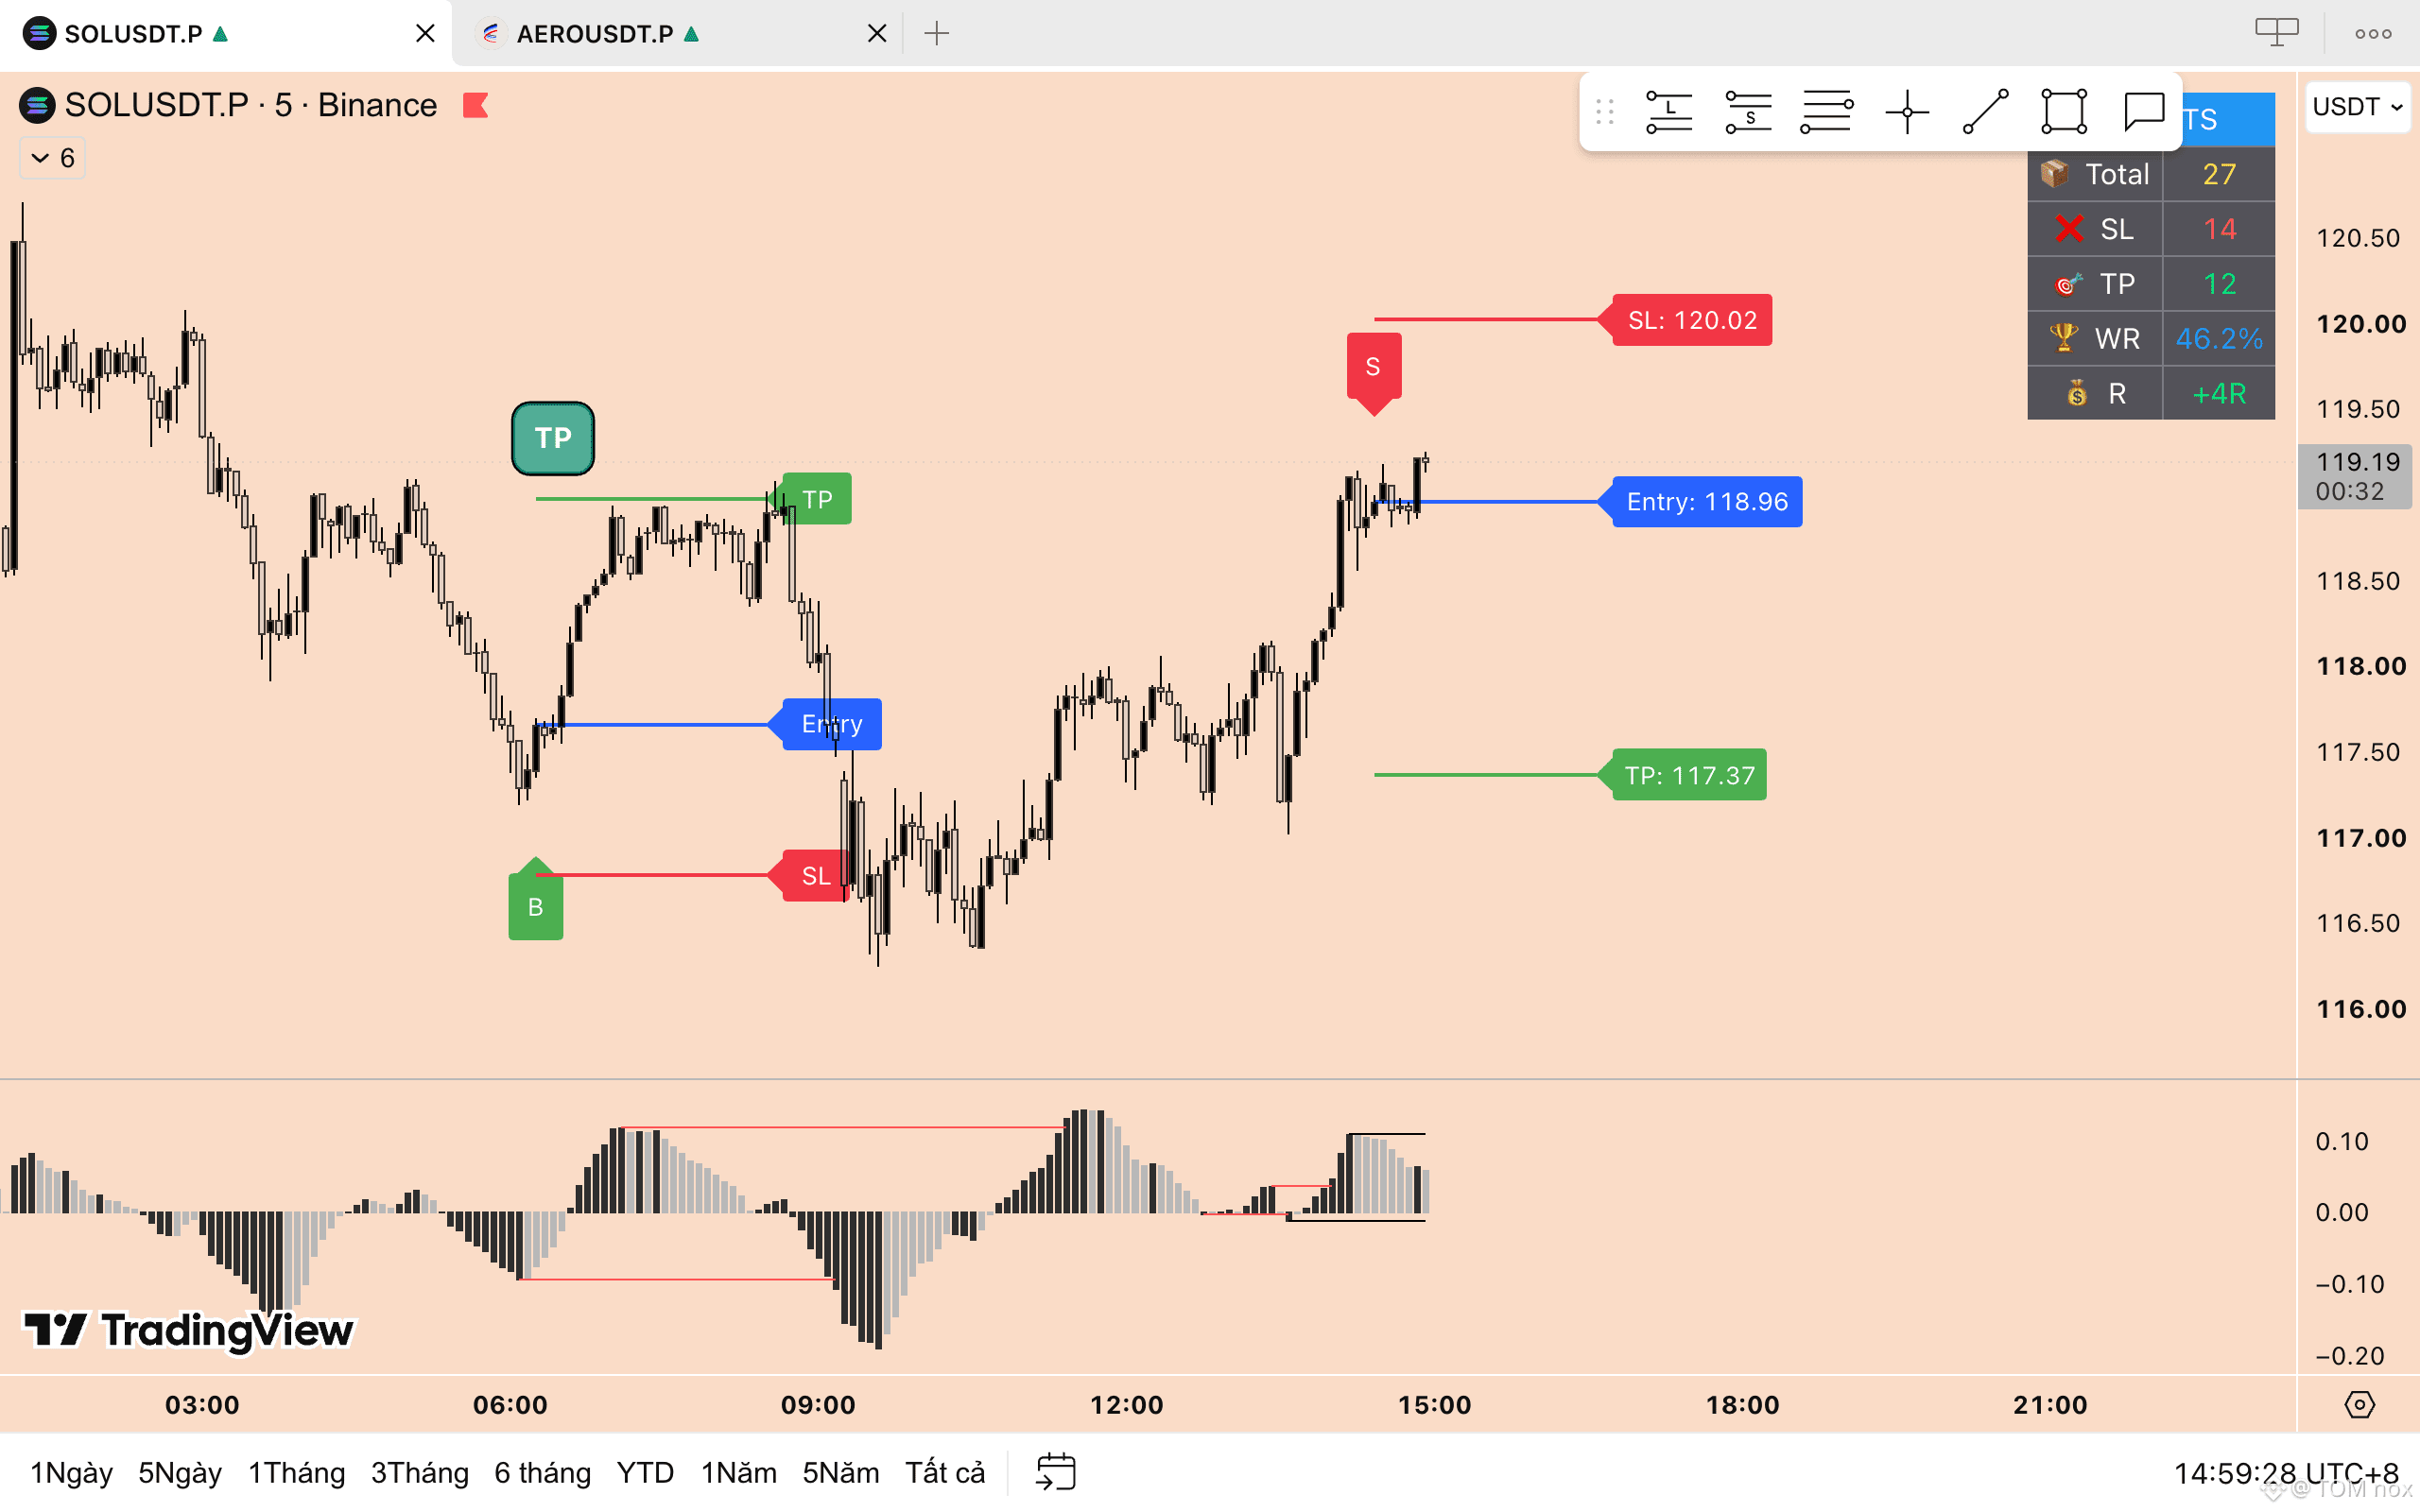
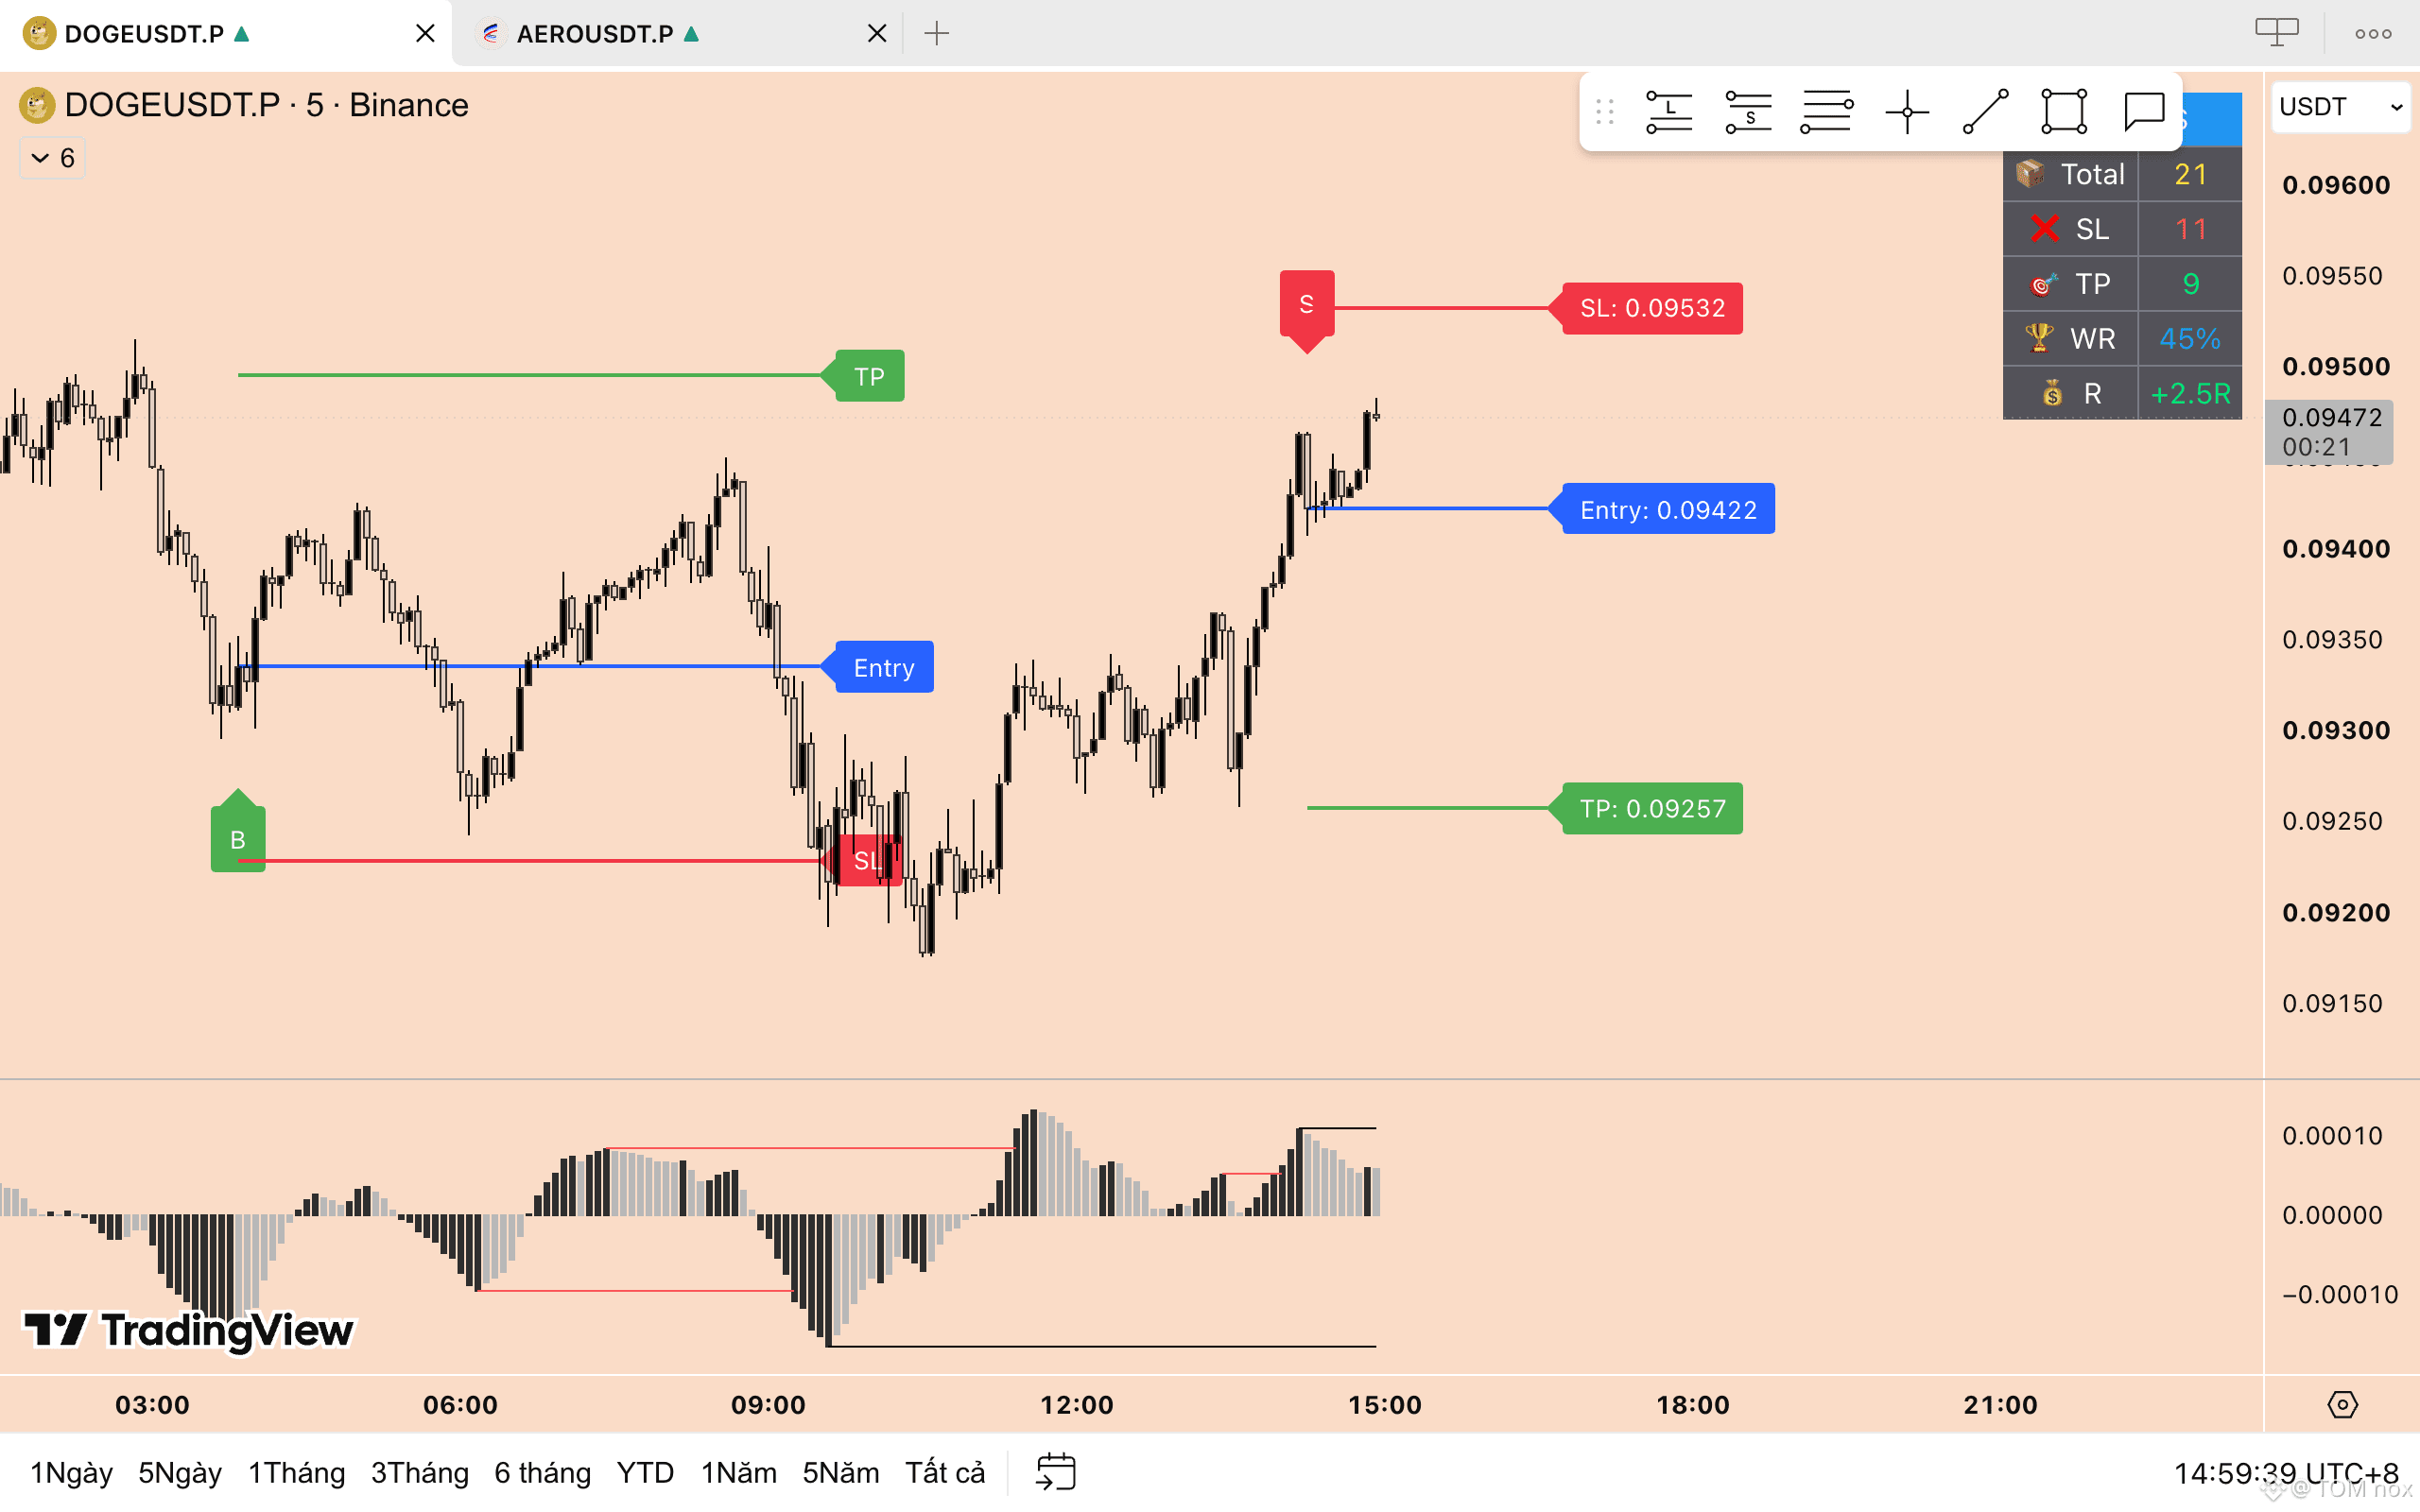
SHORT: $SOL $DOGE
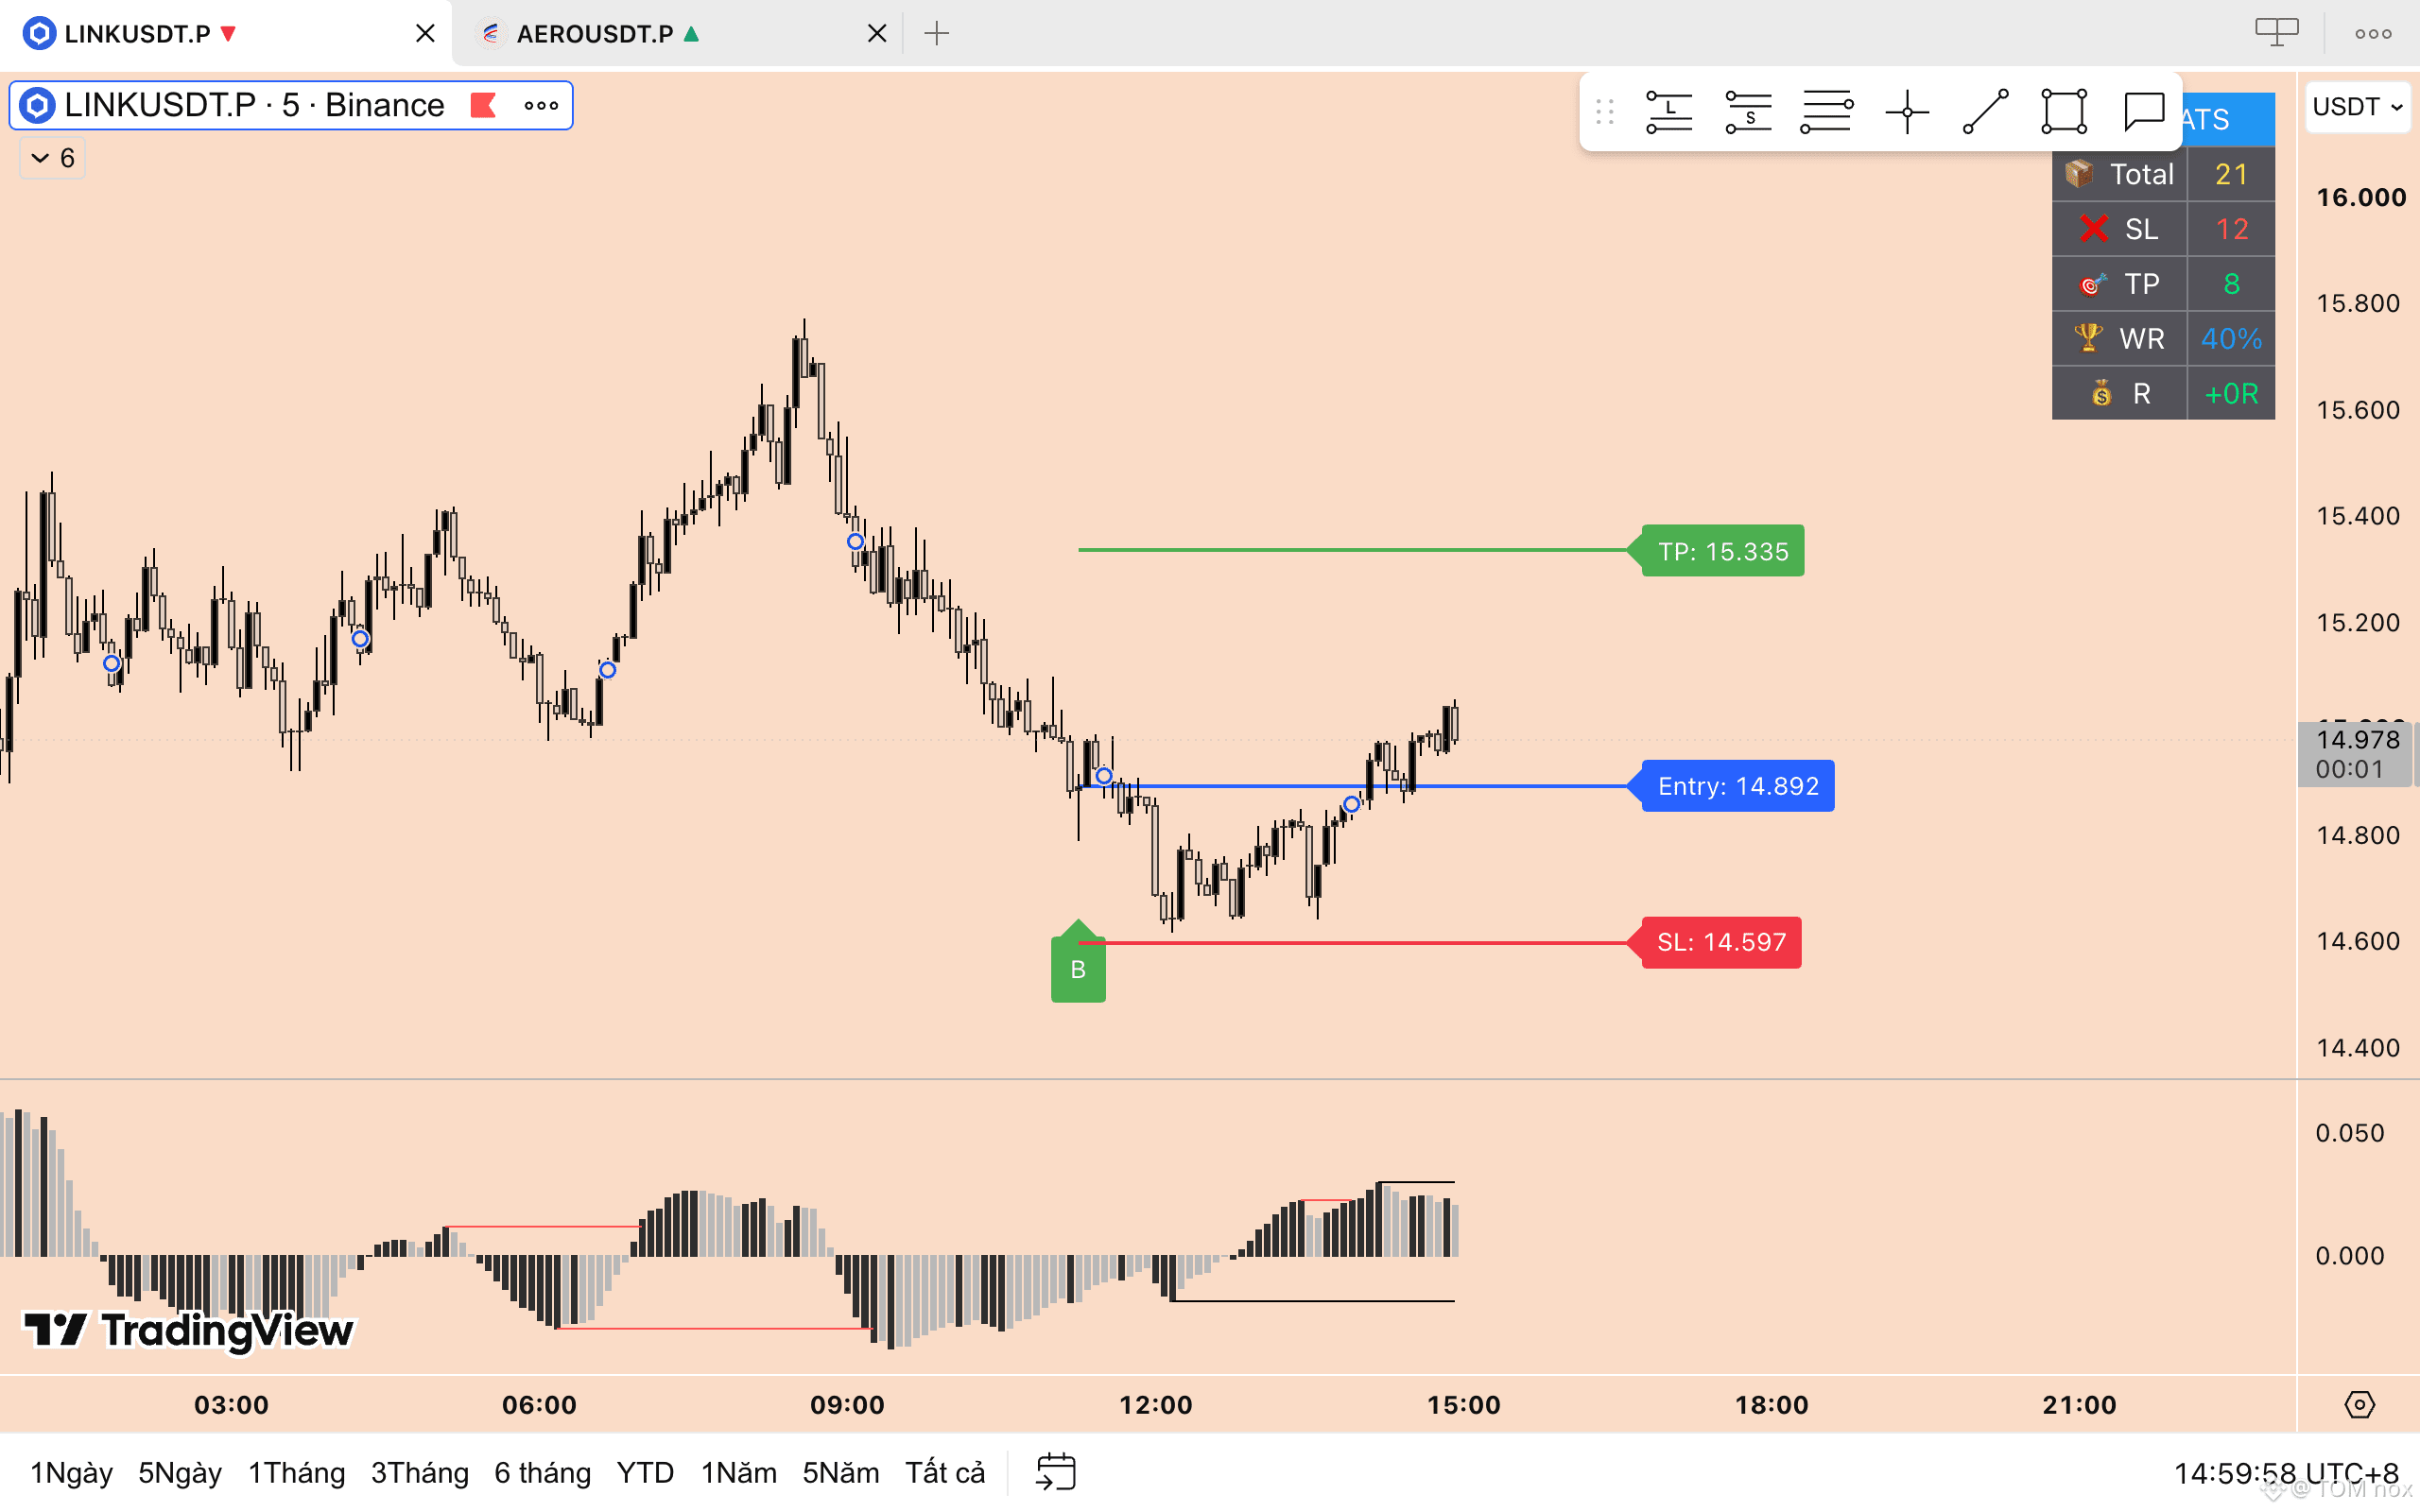
LONG: $LINK
Short-term trading signals, pay attention to the stop loss and take profit!
{future}(LINKUSDT)
{future}(DOGEUSDT)
{future}(SOLUSDT)
SHORT: $SOL $DOGE
LONG: $LINK
Short-term trading signals, pay attention to the stop loss and take profit!
LONG: $LINK
Short-term trading signals, pay attention to the stop loss and take profit!
1
436
·
--
Bullish
$INJ $UNI $1000BONK — LONG 📈
Many altcoins have just adjusted slightly, and the LONG side is starting to return to the market.
If the uptrend continues to be maintained, this could be a preparation step for the next rally.
The market is quite positive—don’t let yourself miss out when opportunities appear. 🚀
{future}(1000BONKUSDT)
{future}(UNIUSDT)
{future}(INJUSDT)
$INJ $UNI $1000BONK — LONG 📈
Many altcoins have just adjusted slightly, and the LONG side is starting to return to the market.
If the uptrend continues to be maintained, this could be a preparation step for the next rally.
The market is quite positive—don’t let yourself miss out when opportunities appear. 🚀
Many altcoins have just adjusted slightly, and the LONG side is starting to return to the market.
If the uptrend continues to be maintained, this could be a preparation step for the next rally.
The market is quite positive—don’t let yourself miss out when opportunities appear. 🚀
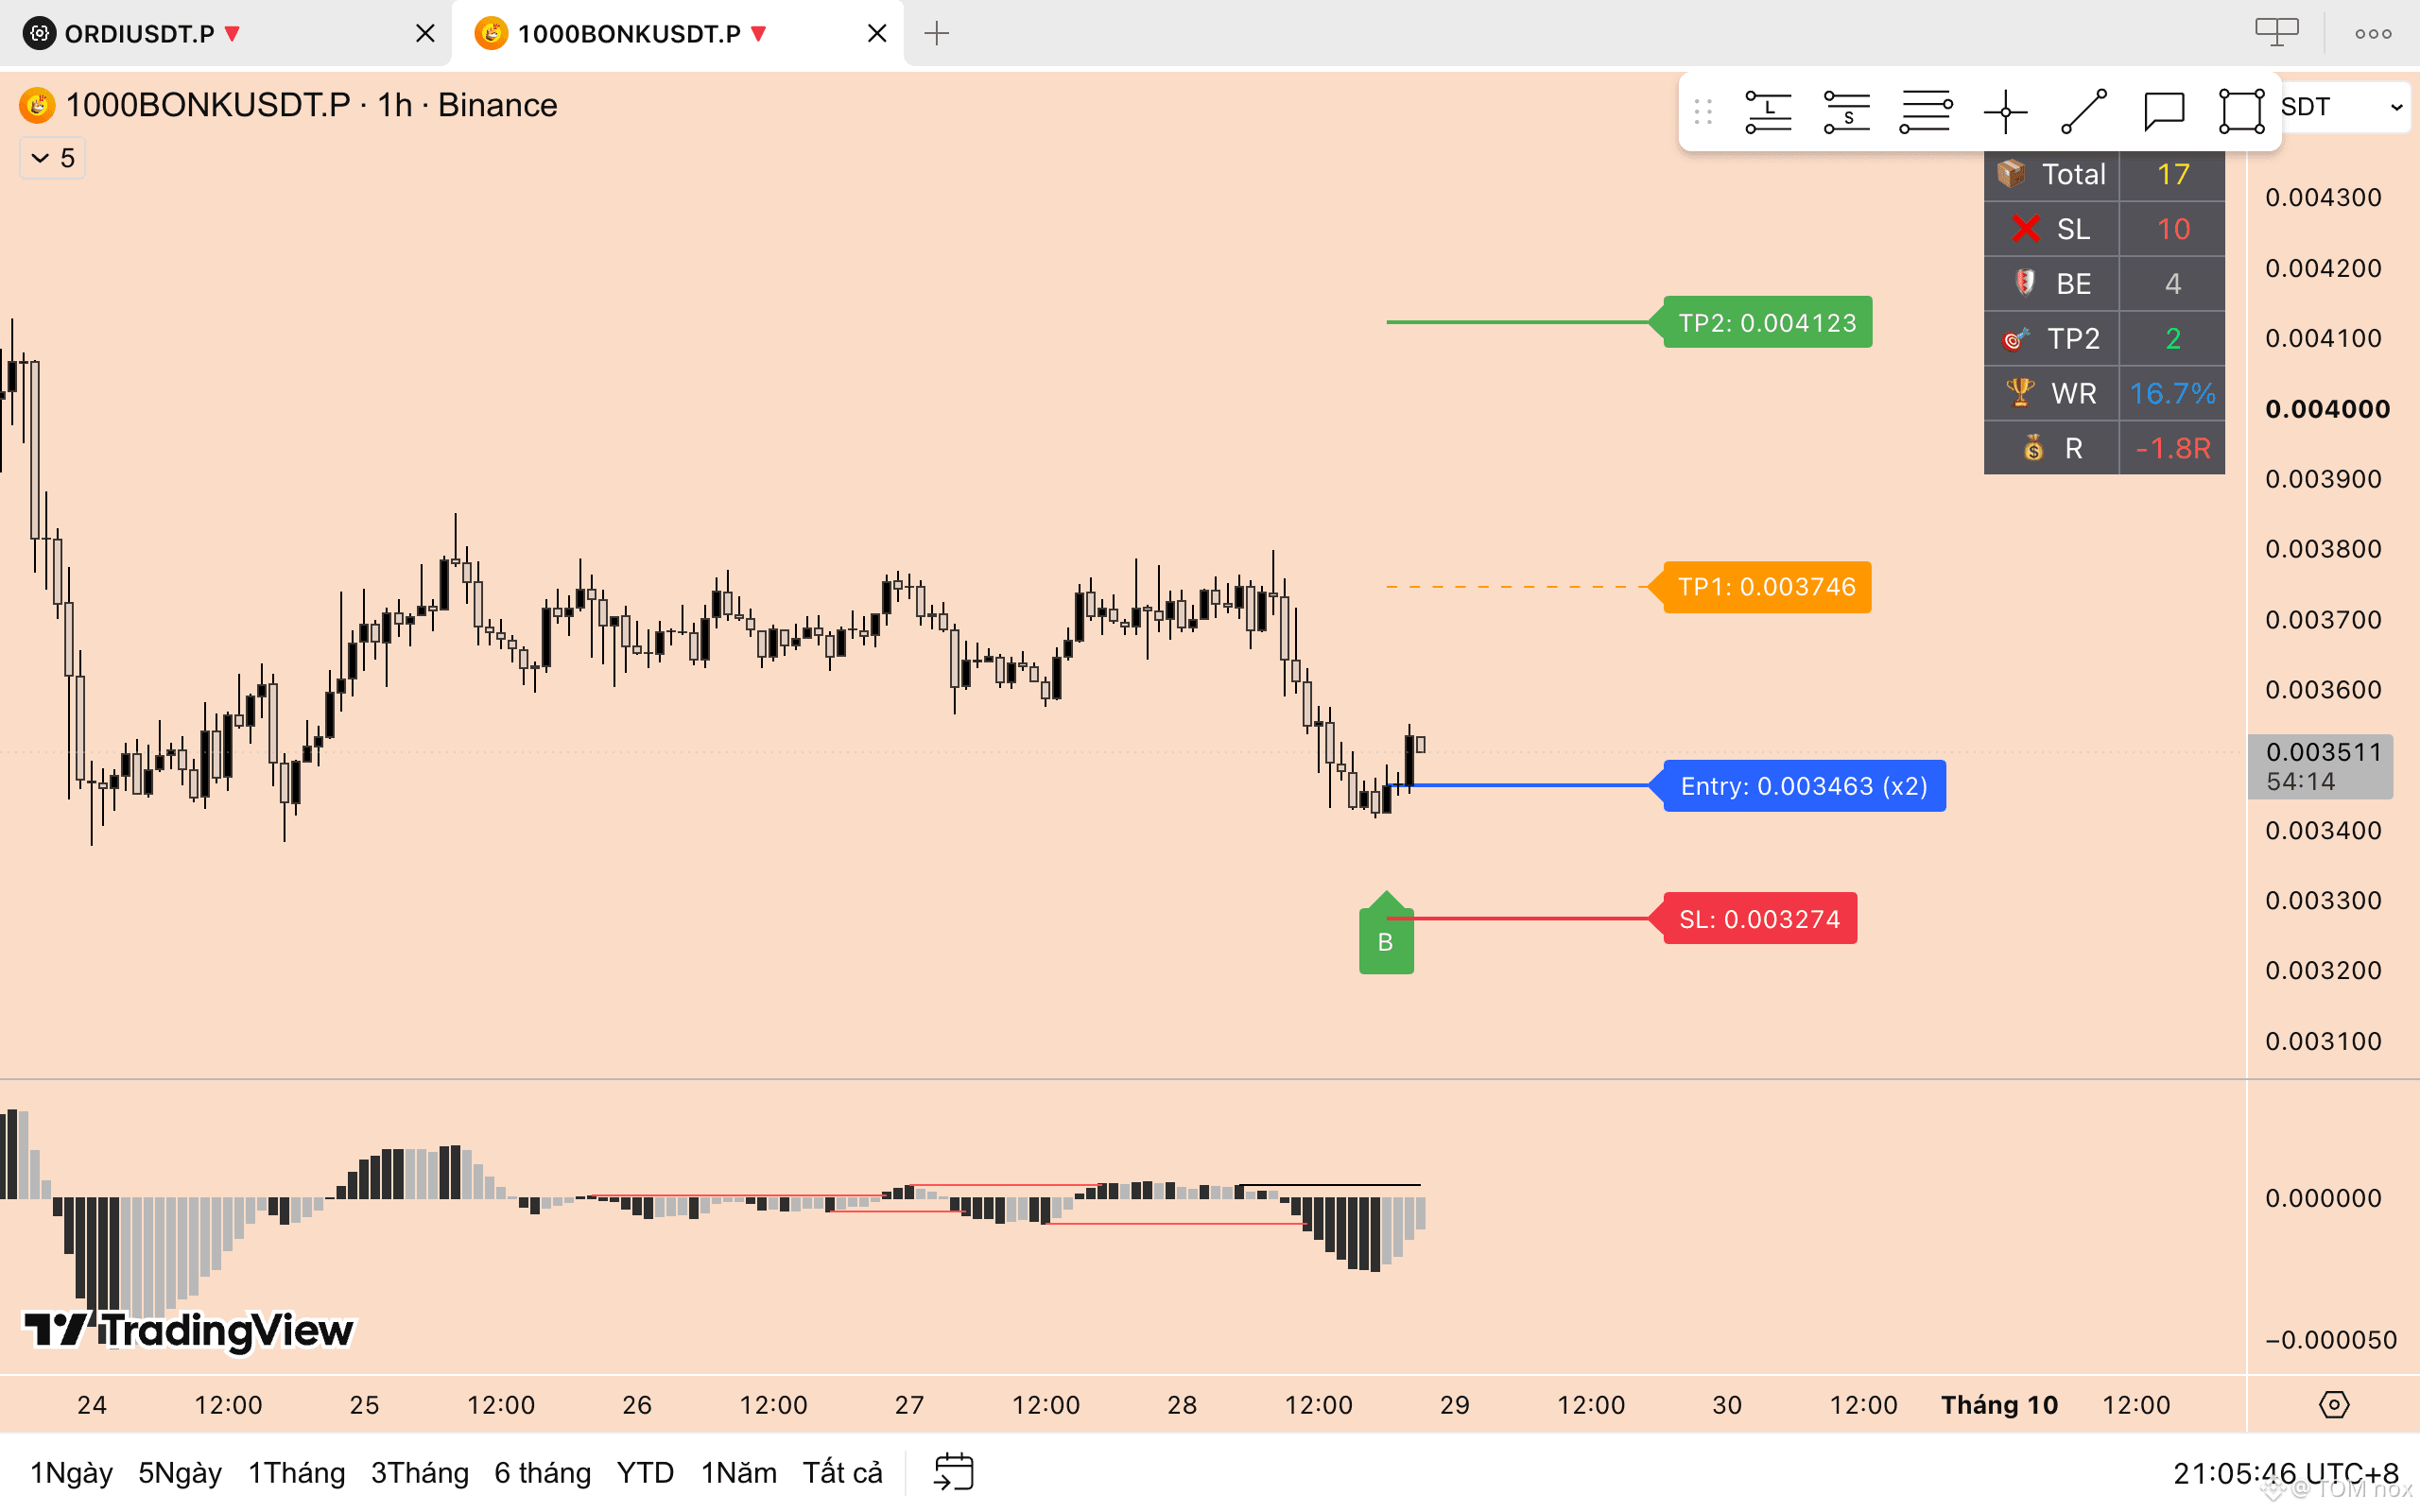
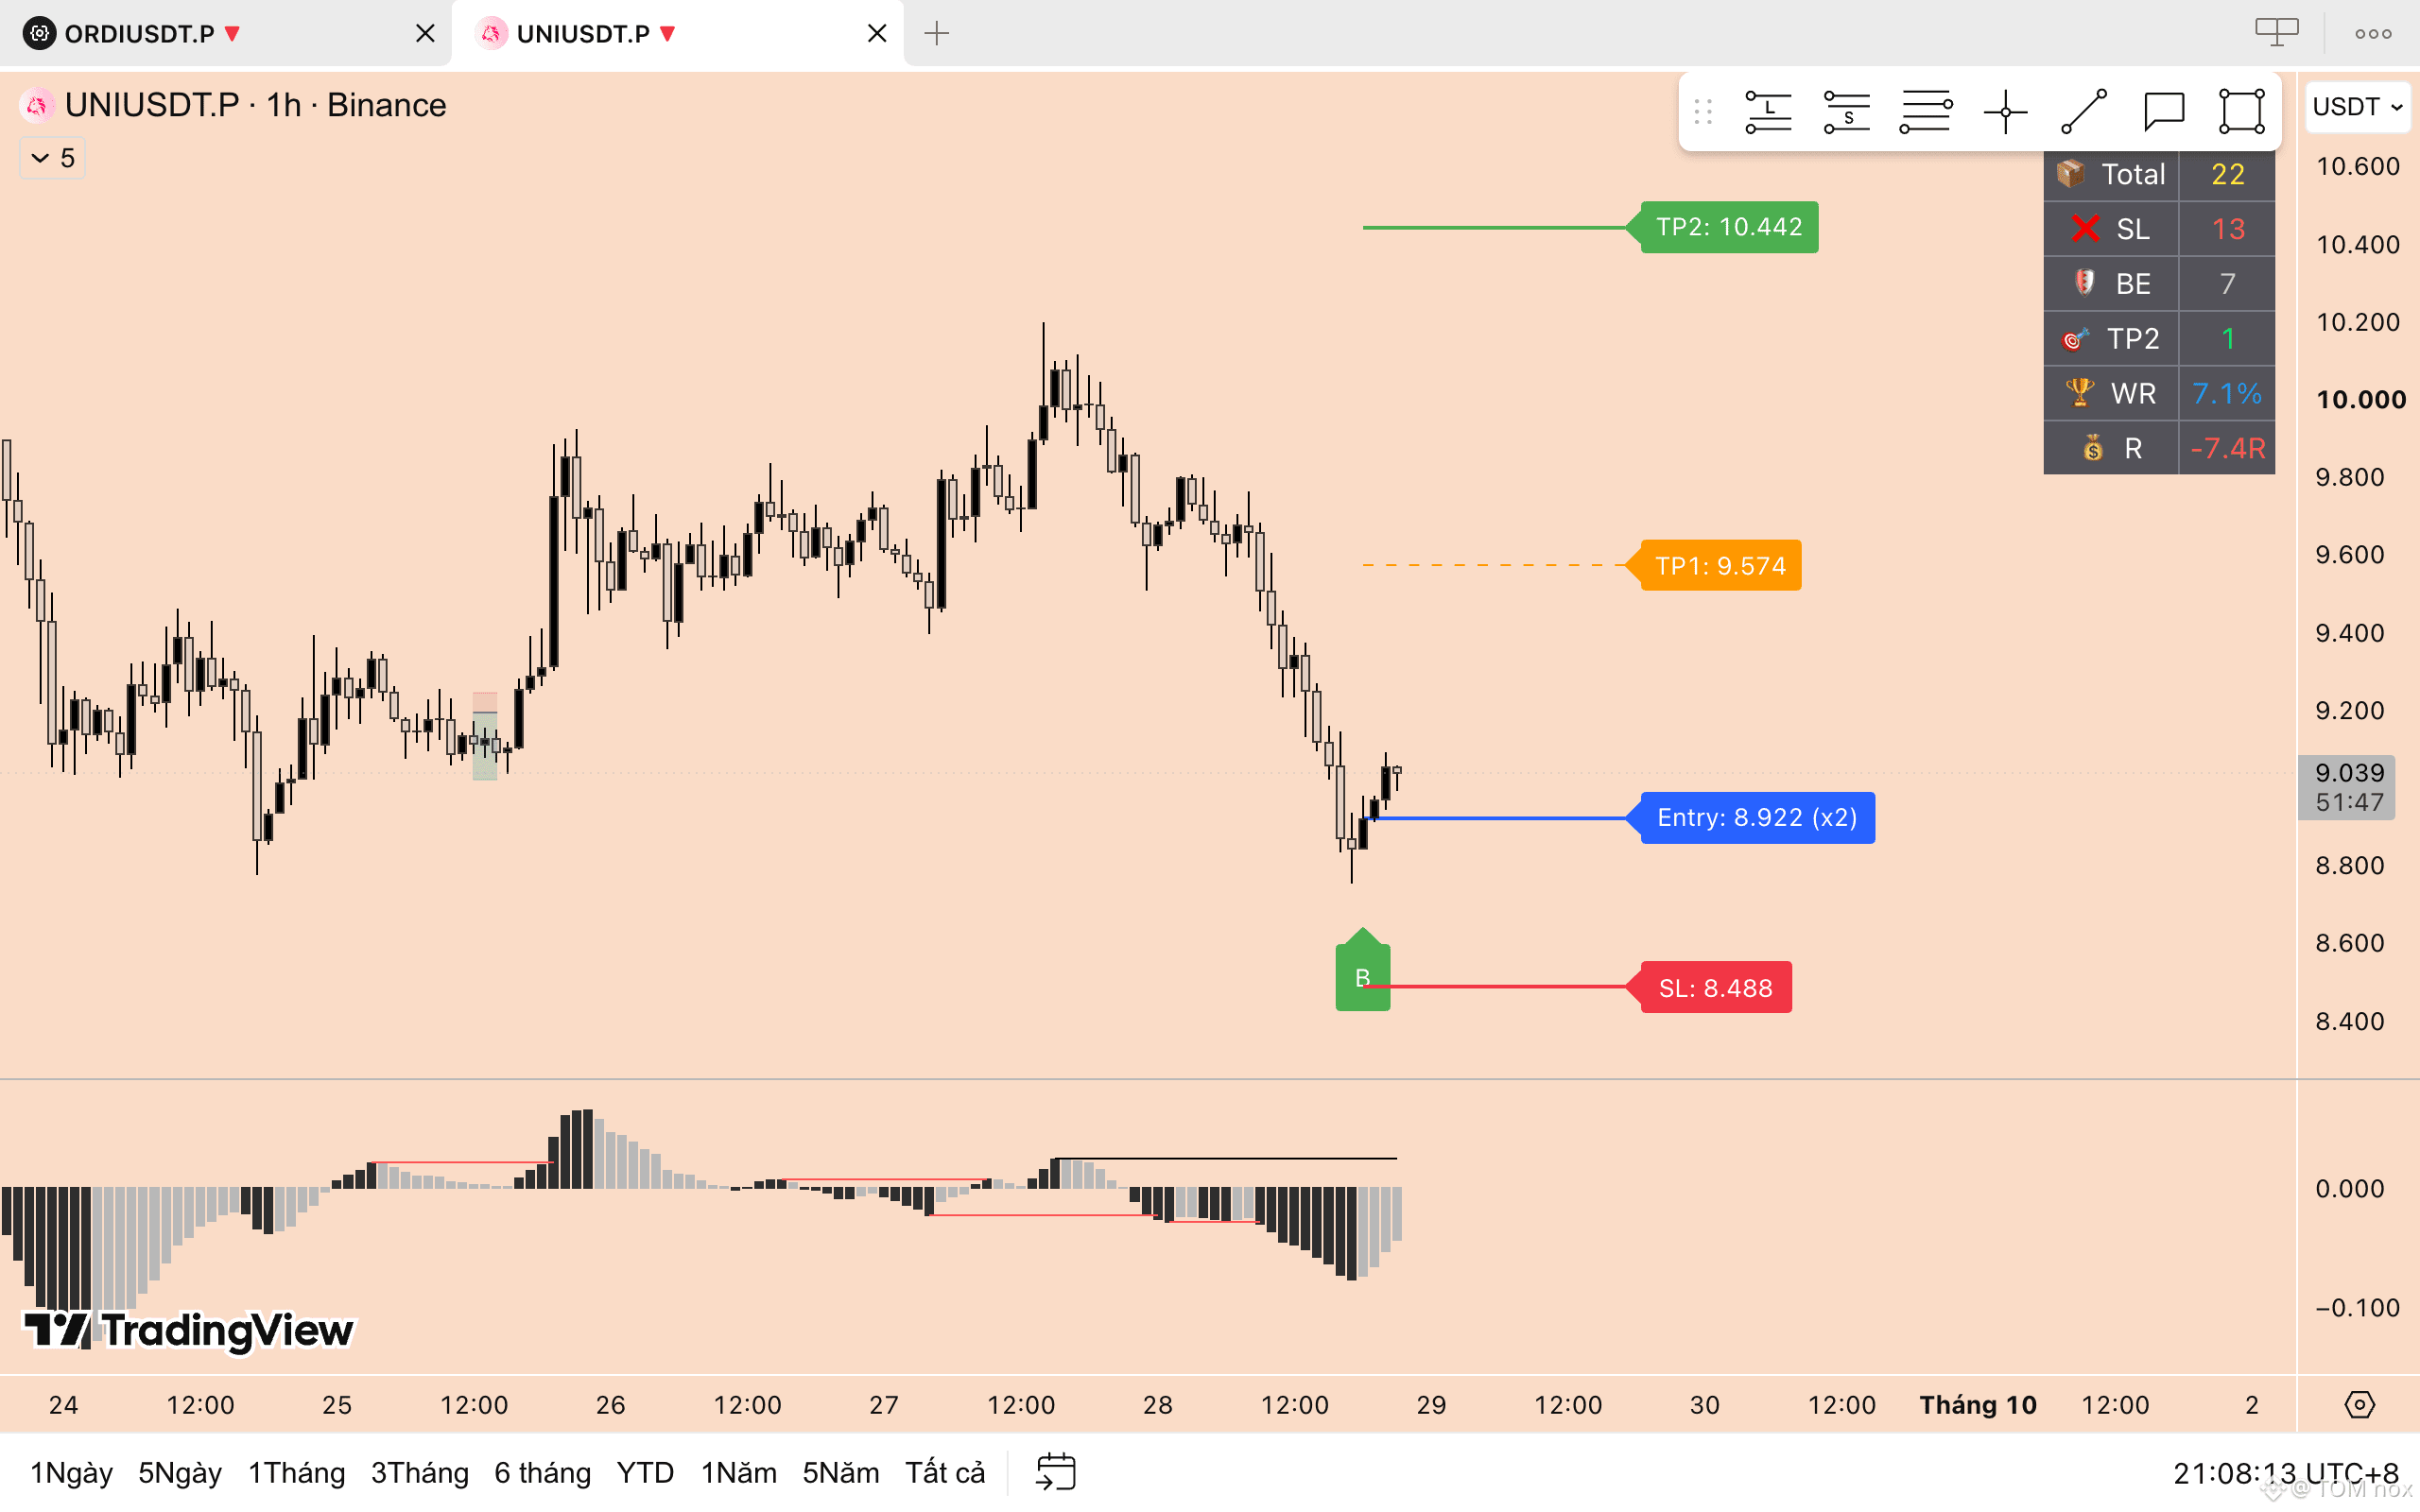
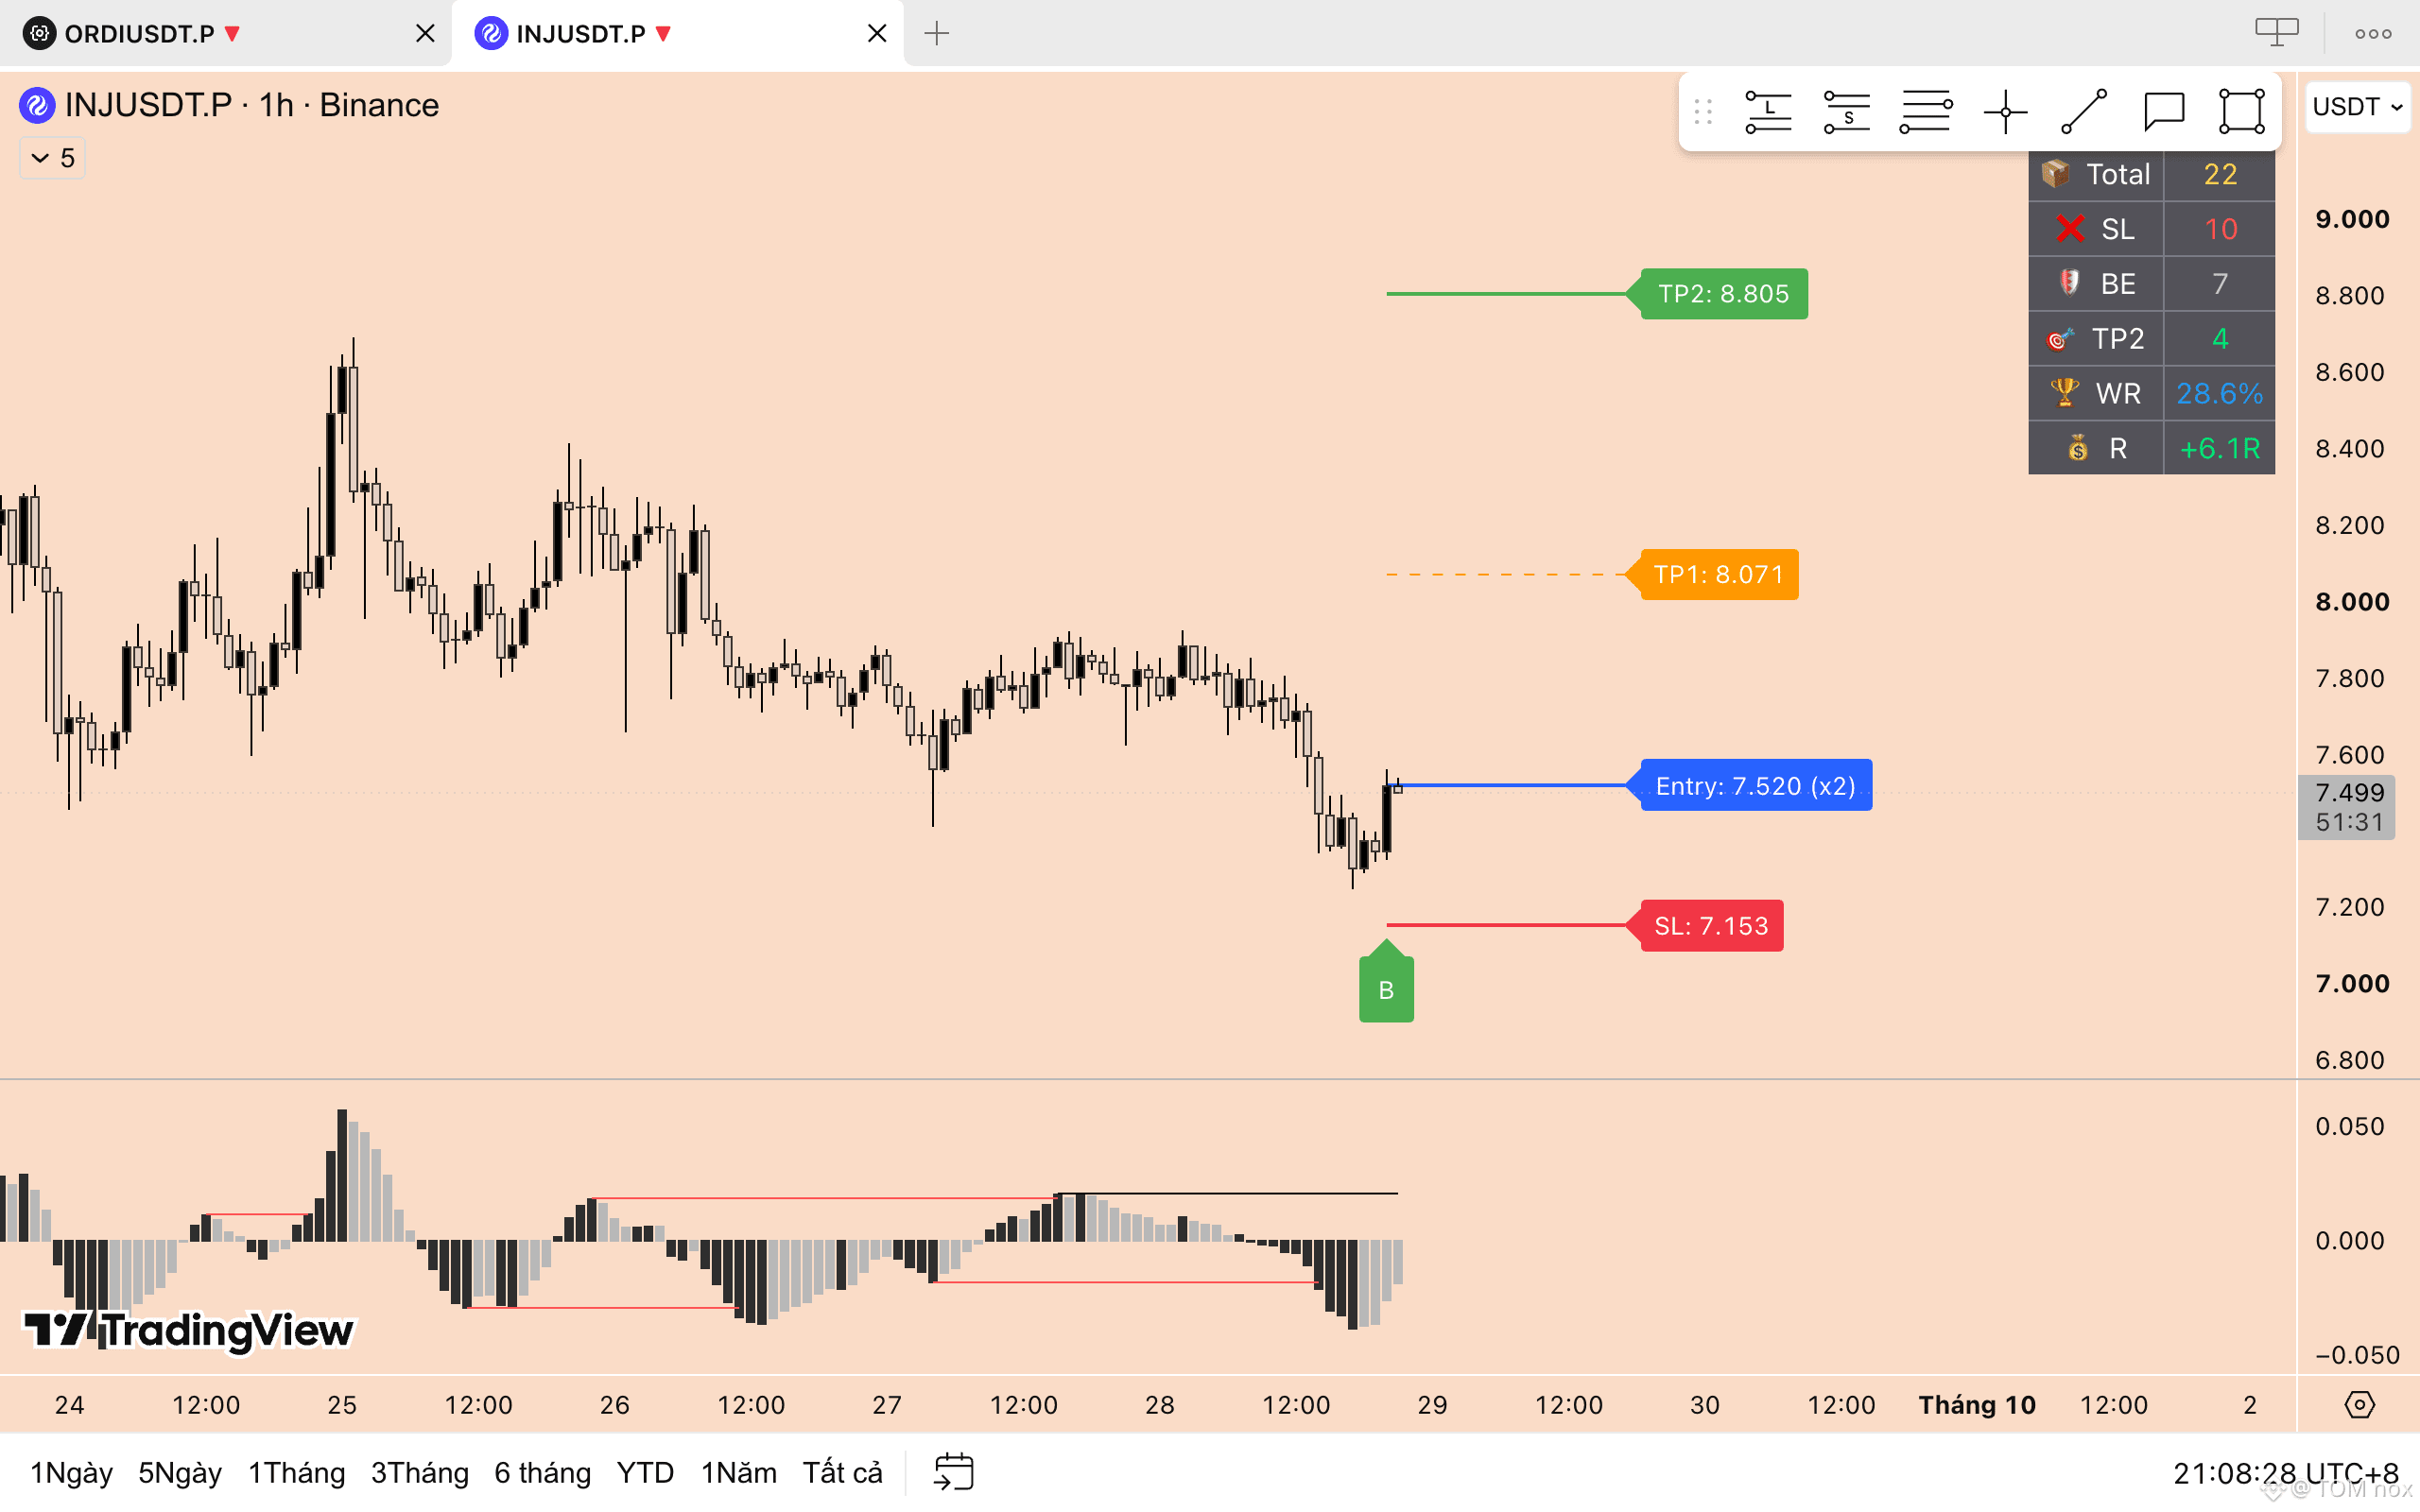
7
2
1.2k
·
--
Bullish
$SUI — LONG 📈
Full capital, leverage x3.
Risk per trade: 10% of the account.
If you still haven’t been able to earn stable profits or you’re currently losing in the market, you can refer to the way I trade and backtest it yourself to find a method that suits you.
{spot}(SUIUSDT)
{future}(SUIUSDT)
$SUI — LONG 📈
Full capital, leverage x3.
Risk per trade: 10% of the account.
If you still haven’t been able to earn stable profits or you’re currently losing in the market, you can refer to the way I trade and backtest it yourself to find a method that suits you.
Full capital, leverage x3.
Risk per trade: 10% of the account.
If you still haven’t been able to earn stable profits or you’re currently losing in the market, you can refer to the way I trade and backtest it yourself to find a method that suits you.
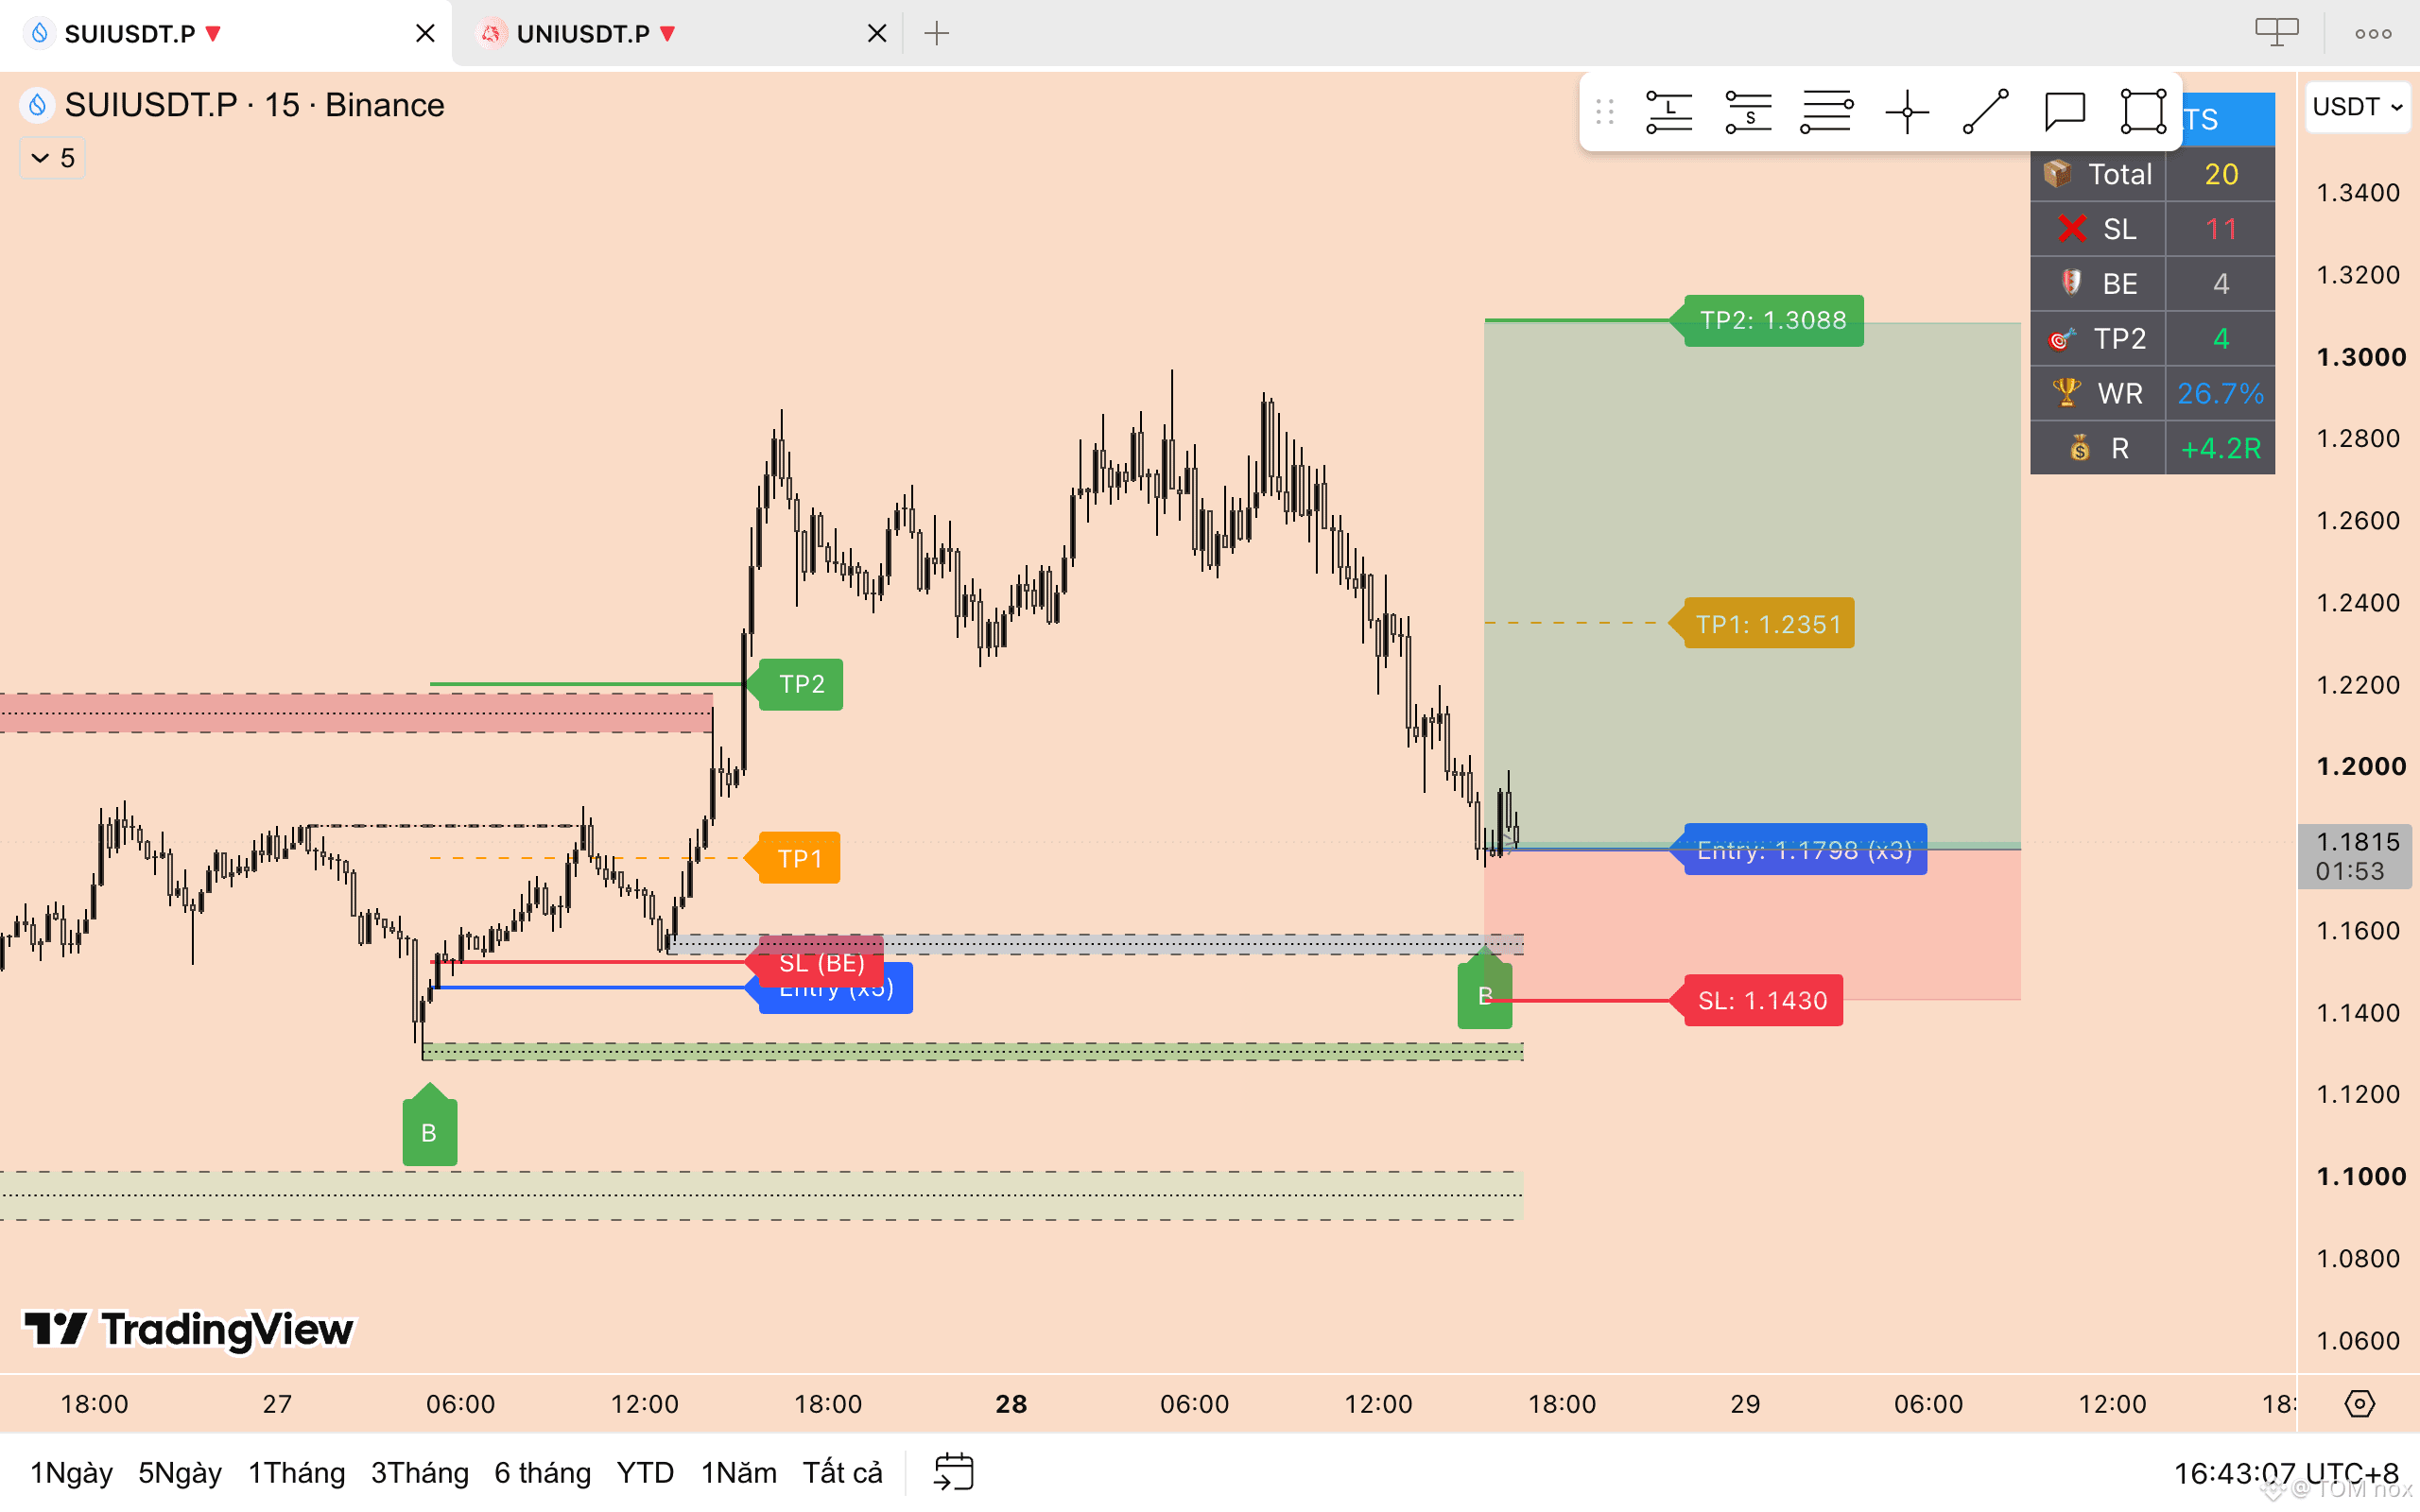
1
347
·
--
Bullish
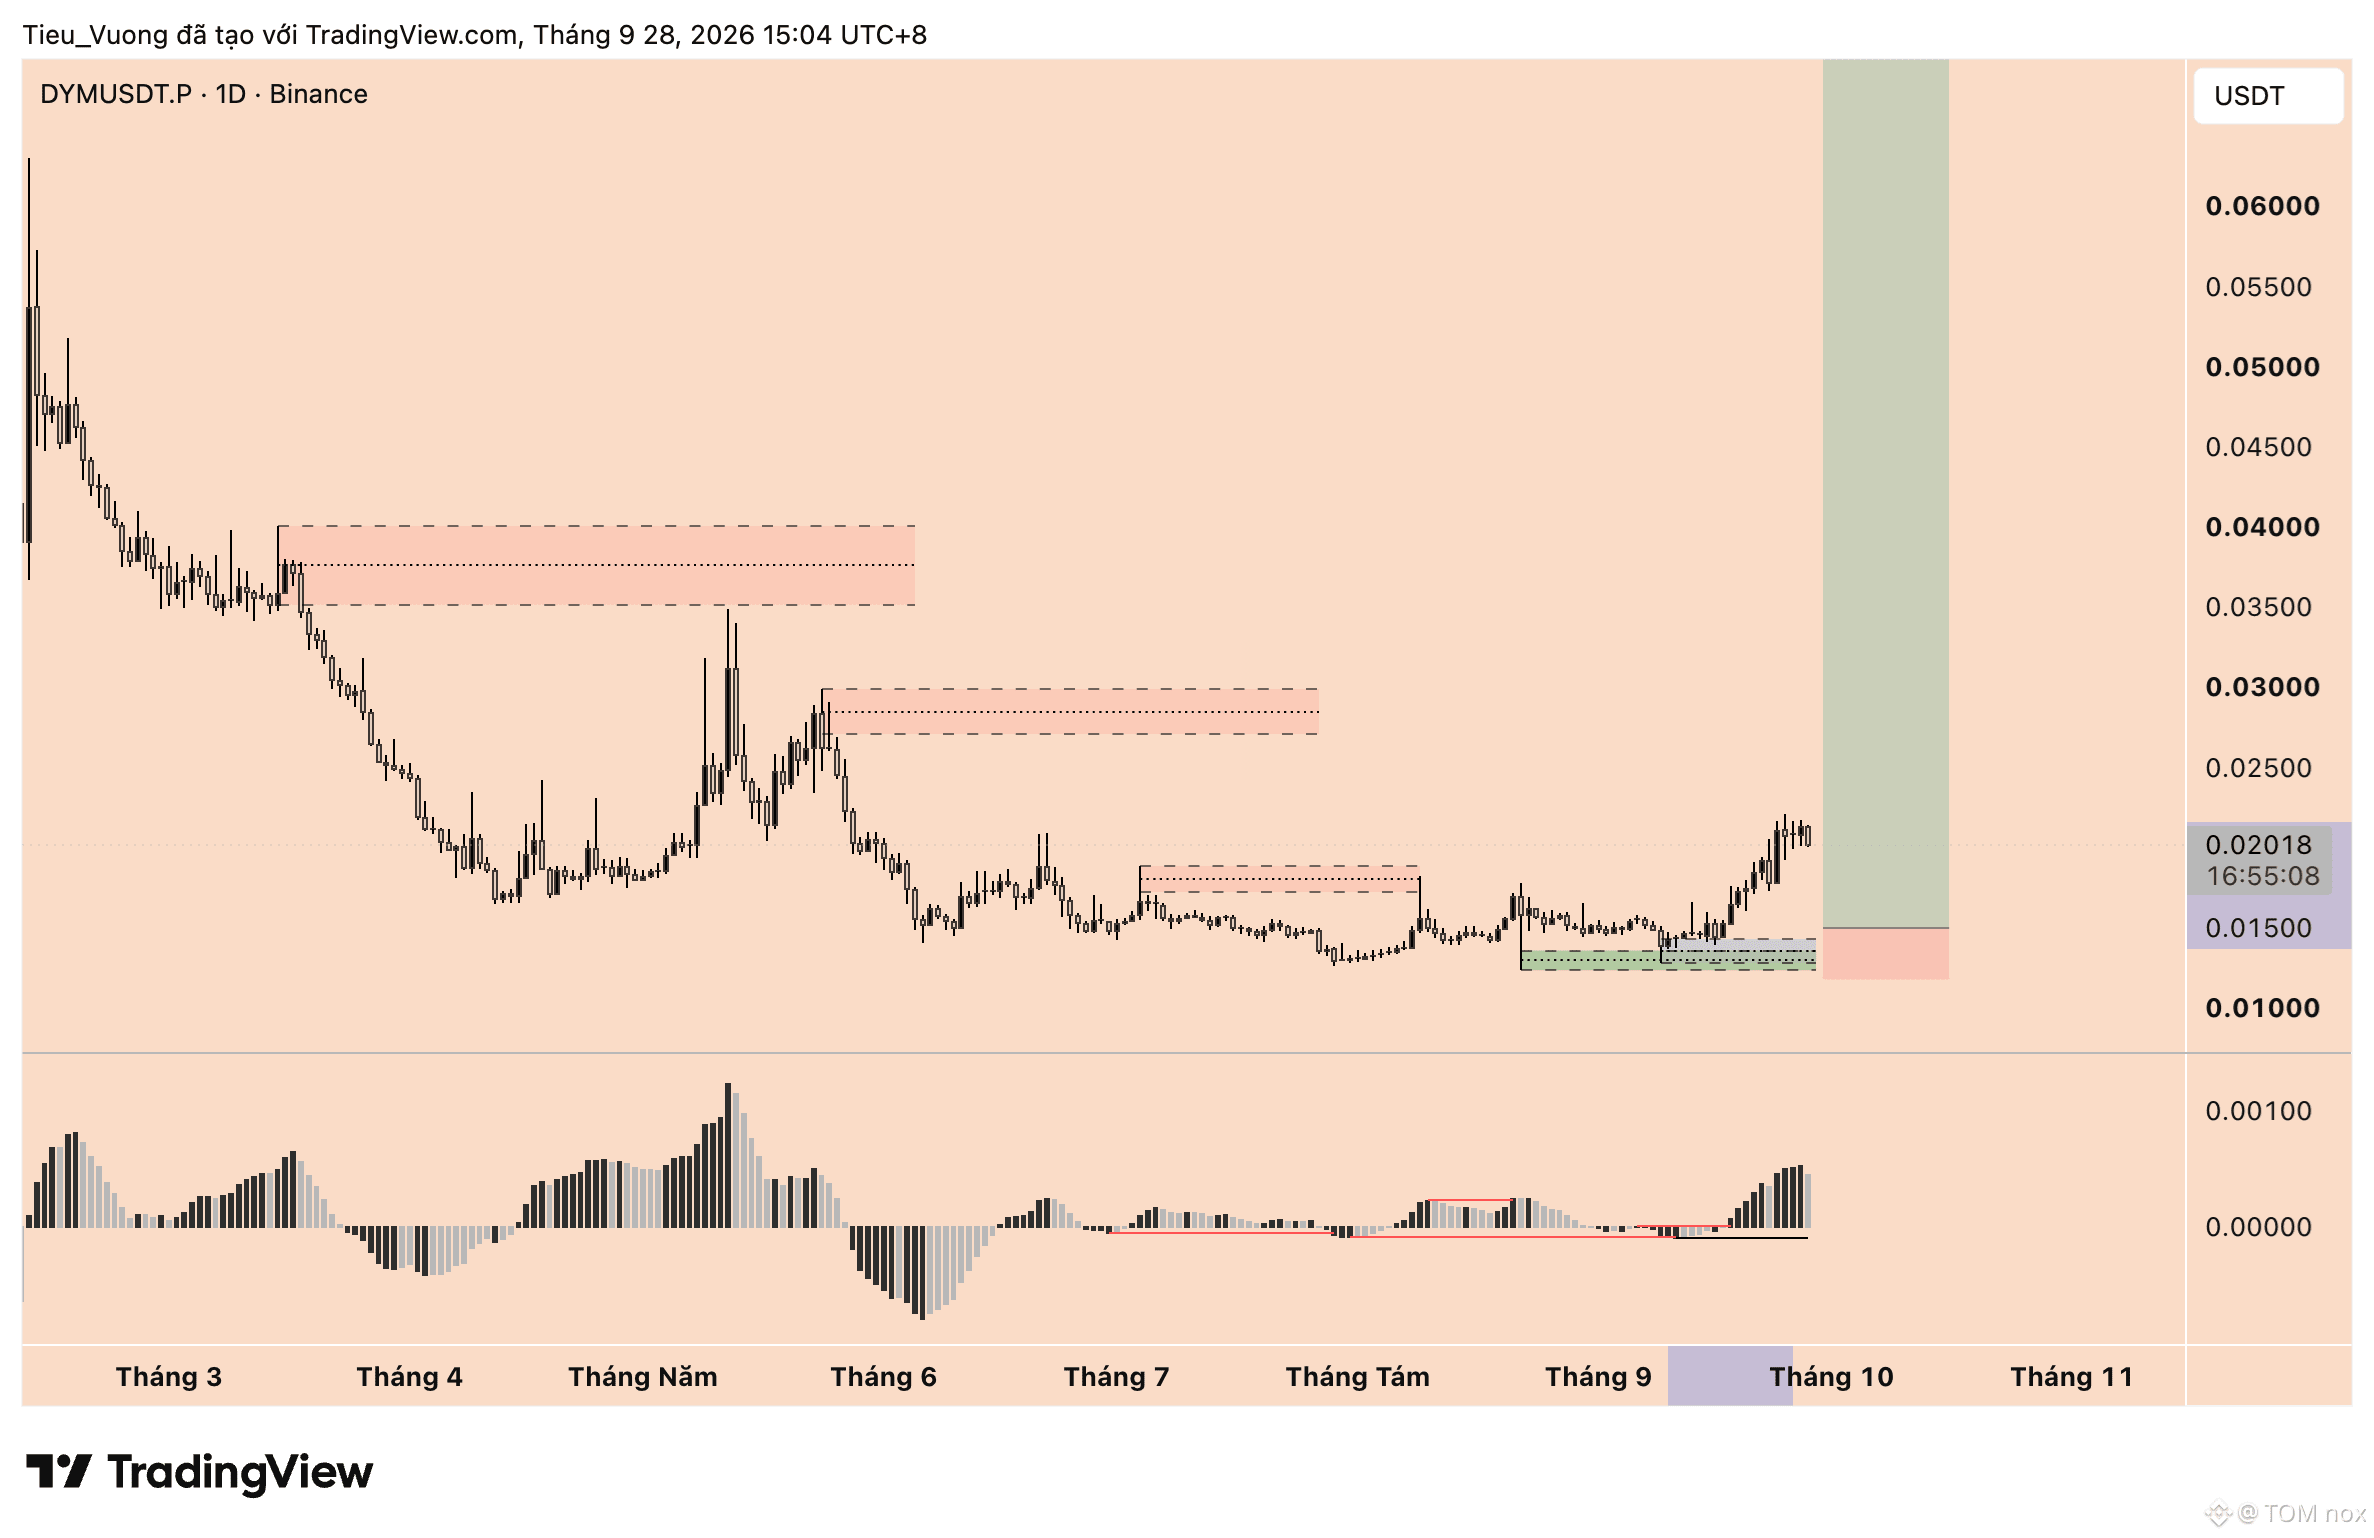
$DYM — Are you guys getting ready to run this one, right?
DYM has been pushed quite deep for a long time and has been lying around the 0.013–0.015 area for quite a while. Recently, the price has started to bounce strongly and is now around 0.020, with momentum picking up again.
If the price can hold the current area and there’s a pullback but without breaking the old low, I think this could be a pretty good zone to watch for a long-term position.
No need to FOMO-buy right away. You can wait for the price to correct toward support and buy in portions—better price and less risk.
Above that, there are also zones 0.028–0.030 and 0.035–0.040 that are waiting for a retest.
What do you think? Is DYM preparing to change trend, or is it just bouncing before getting pushed down again?
{spot}(DYMUSDT)
{future}(DYMUSDT)
$DYM — Are you guys getting ready to run this one, right?
DYM has been pushed quite deep for a long time and has been lying around the 0.013–0.015 area for quite a while. Recently, the price has started to bounce strongly and is now around 0.020, with momentum picking up again.
If the price can hold the current area and there’s a pullback but without breaking the old low, I think this could be a pretty good zone to watch for a long-term position.
No need to FOMO-buy right away. You can wait for the price to correct toward support and buy in portions—better price and less risk.
Above that, there are also zones 0.028–0.030 and 0.035–0.040 that are waiting for a retest.
What do you think? Is DYM preparing to change trend, or is it just bouncing before getting pushed down again?
DYM has been pushed quite deep for a long time and has been lying around the 0.013–0.015 area for quite a while. Recently, the price has started to bounce strongly and is now around 0.020, with momentum picking up again.
If the price can hold the current area and there’s a pullback but without breaking the old low, I think this could be a pretty good zone to watch for a long-term position.
No need to FOMO-buy right away. You can wait for the price to correct toward support and buy in portions—better price and less risk.
Above that, there are also zones 0.028–0.030 and 0.035–0.040 that are waiting for a retest.
What do you think? Is DYM preparing to change trend, or is it just bouncing before getting pushed down again?
1
263
·
--
You are trying to draw lines and then force the chart to match a predefined model in the book. That’s not about finding an edge—it’s about making the chart look like what you want to see.
These common templates, if they haven’t been verified through real backtesting, can easily have their win rate inflated. Don’t confuse a model that “looks reasonable” with one that truly has an edge in the market.
You are trying to draw lines and then force the chart to match a predefined model in the book. That’s not about finding an edge—it’s about making the chart look like what you want to see.
These common templates, if they haven’t been verified through real backtesting, can easily have their win rate inflated. Don’t confuse a model that “looks reasonable” with one that truly has an edge in the market.
These common templates, if they haven’t been verified through real backtesting, can easily have their win rate inflated. Don’t confuse a model that “looks reasonable” with one that truly has an edge in the market.


Trading Insight_DN
·
--
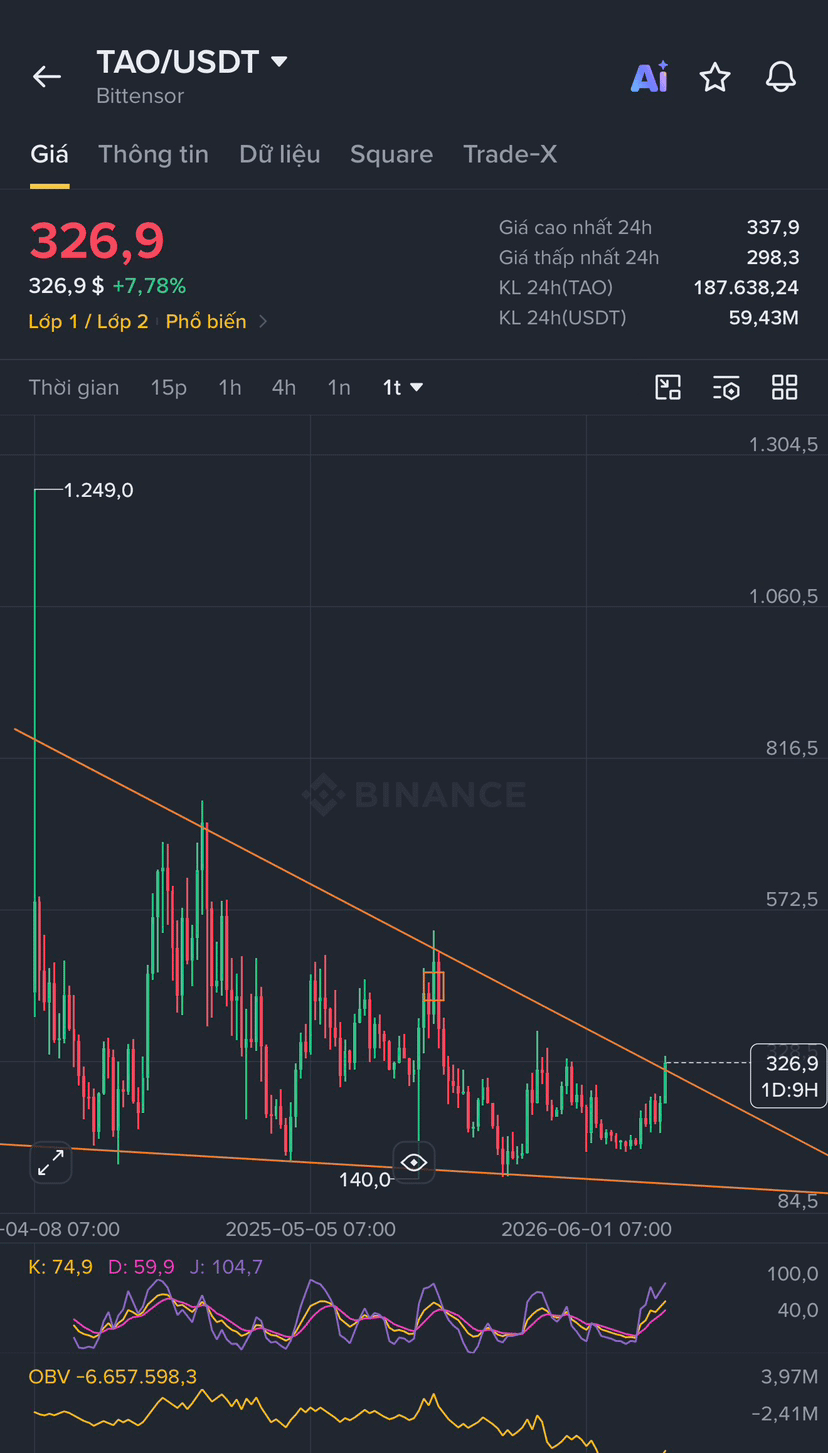
🔥 $TAO ….nice, break, okay, coin top, safe :))))
It meets all the criteria that everyone requires… if you scan again then you can get around 220-260… if you want to buy and chase right away then consider a short SL and go for it.
This code many people hold as well… if you’re holding and waiting for it to pump, raise your hand and see if it’s gonna happen :)))
It meets all the criteria that everyone requires… if you scan again then you can get around 220-260… if you want to buy and chase right away then consider a short SL and go for it.
This code many people hold as well… if you’re holding and waiting for it to pump, raise your hand and see if it’s gonna happen :)))
1
36
·
--
Bullish
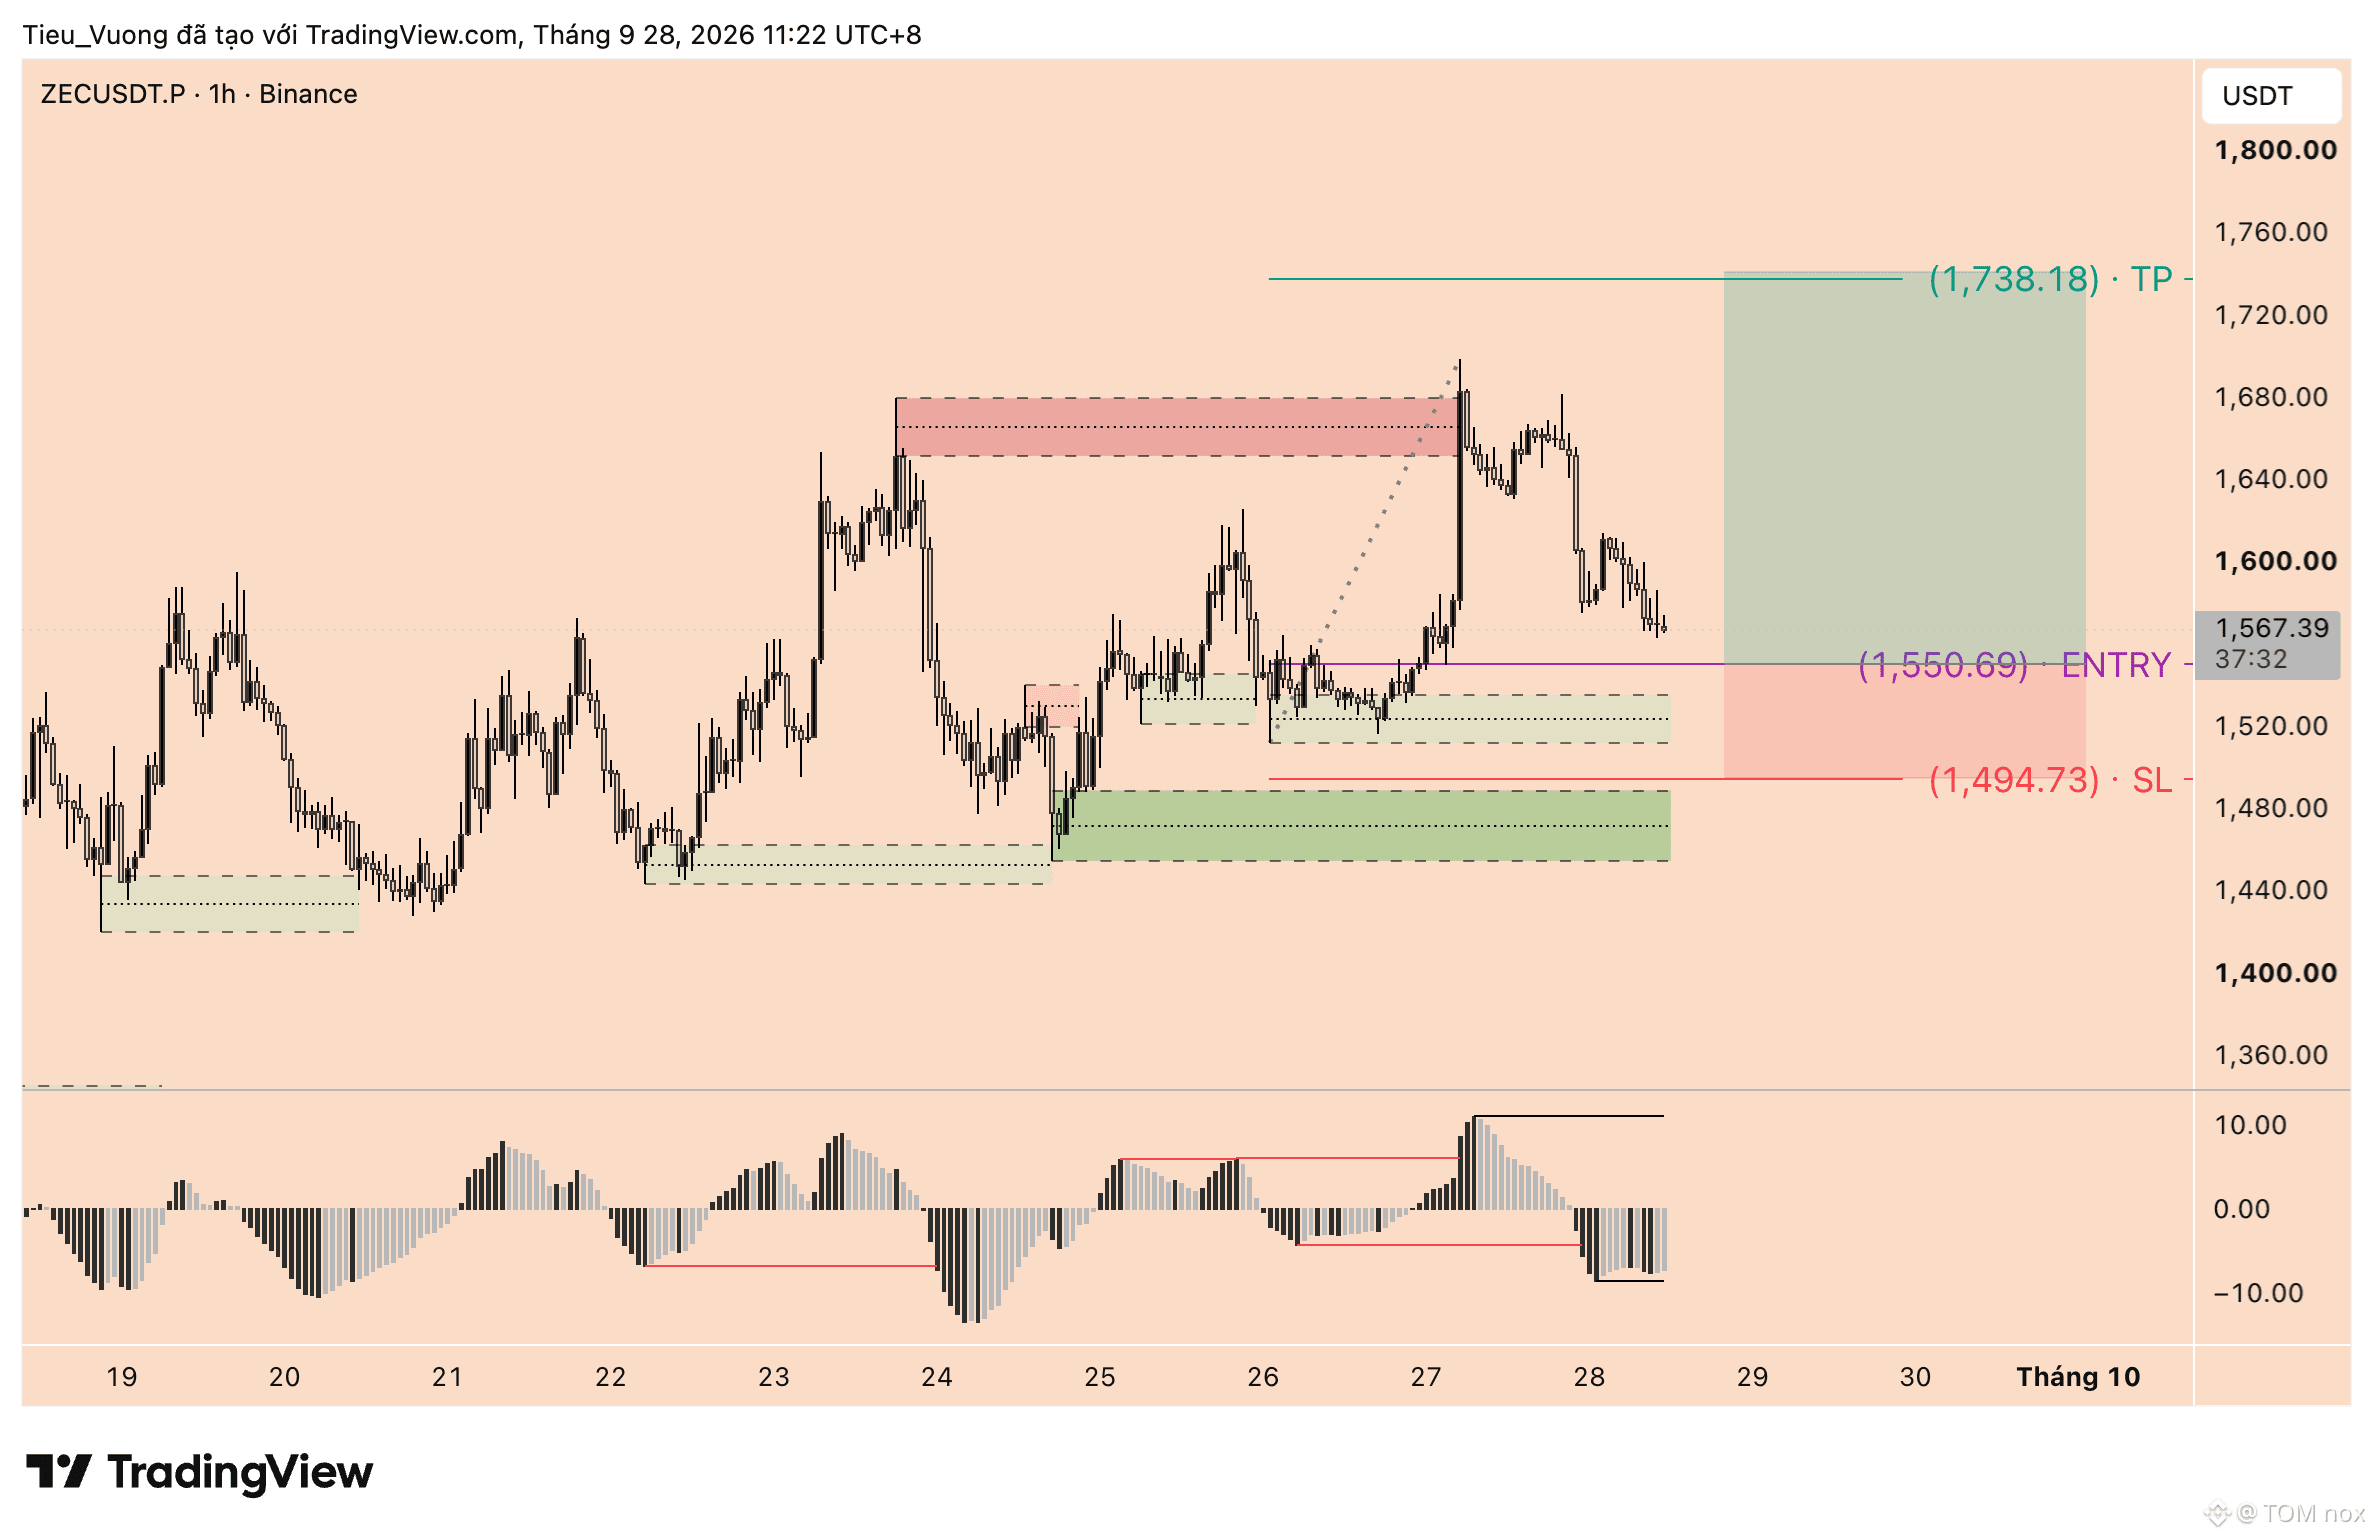
$ZEC is retesting a crucial support zone — if this zone holds, is a new uptrend leg forming?
📊 ZECUSDT.P — 1H | LONG SETUP
1. Market Structure
ZEC is maintaining a bullish structure on the 1H timeframe after a strong breakout from the 1,640–1,680 area. The current price is in a corrective phase toward support below.
2. Entry Zone
🎯 Entry: 1,550.69
The 1,520–1,550 area is considered a key support zone where price may seek renewed buying pressure.
3. Risk Management
🛑 Stop Loss: 1,494.73
The SL is placed below the support zone to limit risk if the bullish structure is broken.
4. Take Profit
🎯 TP: 1,738.18
The target is the previous high / resistance zone above.
5. Risk : Reward
With Entry 1,550.69 and SL 1,494.73, the risk is about 3.61%.
TP target 1,738.18 corresponds to an estimated profit of about 12.09%.
➡️ R:R ≈ 1 : 3.35
6. Trade Idea
The LONG scenario will be prioritized if price holds the 1,520–1,550 zone and bullish confirmation signals appear. If the 1H candle closes below the support / SL zone, the setup will be invalid.
Plan:
🟢 LONG: 1,550.69
🛑 SL: 1,494.73
🎯 TP: 1,738.18
⚖️ R:R ≈ 1:3.35
Manage capital reasonably—no FOMO and don’t enter a trade based only on a single signal.
{spot}(ZECUSDT)
{future}(ZECUSDT)
#ZEC #ZECUSDT
$ZEC is retesting a crucial support zone — if this zone holds, is a new uptrend leg forming?
📊 ZECUSDT.P — 1H | LONG SETUP
1. Market Structure
ZEC is maintaining a bullish structure on the 1H timeframe after a strong breakout from the 1,640–1,680 area. The current price is in a corrective phase toward support below.
2. Entry Zone
🎯 Entry: 1,550.69
The 1,520–1,550 area is considered a key support zone where price may seek renewed buying pressure.
3. Risk Management
🛑 Stop Loss: 1,494.73
The SL is placed below the support zone to limit risk if the bullish structure is broken.
4. Take Profit
🎯 TP: 1,738.18
The target is the previous high / resistance zone above.
5. Risk : Reward
With Entry 1,550.69 and SL 1,494.73, the risk is about 3.61%.
TP target 1,738.18 corresponds to an estimated profit of about 12.09%.
➡️ R:R ≈ 1 : 3.35
6. Trade Idea
The LONG scenario will be prioritized if price holds the 1,520–1,550 zone and bullish confirmation signals appear. If the 1H candle closes below the support / SL zone, the setup will be invalid.
Plan:
🟢 LONG: 1,550.69
🛑 SL: 1,494.73
🎯 TP: 1,738.18
⚖️ R:R ≈ 1:3.35
Manage capital reasonably—no FOMO and don’t enter a trade based only on a single signal.
#ZEC #ZECUSDT
📊 ZECUSDT.P — 1H | LONG SETUP
1. Market Structure
ZEC is maintaining a bullish structure on the 1H timeframe after a strong breakout from the 1,640–1,680 area. The current price is in a corrective phase toward support below.
2. Entry Zone
🎯 Entry: 1,550.69
The 1,520–1,550 area is considered a key support zone where price may seek renewed buying pressure.
3. Risk Management
🛑 Stop Loss: 1,494.73
The SL is placed below the support zone to limit risk if the bullish structure is broken.
4. Take Profit
🎯 TP: 1,738.18
The target is the previous high / resistance zone above.
5. Risk : Reward
With Entry 1,550.69 and SL 1,494.73, the risk is about 3.61%.
TP target 1,738.18 corresponds to an estimated profit of about 12.09%.
➡️ R:R ≈ 1 : 3.35
6. Trade Idea
The LONG scenario will be prioritized if price holds the 1,520–1,550 zone and bullish confirmation signals appear. If the 1H candle closes below the support / SL zone, the setup will be invalid.
Plan:
🟢 LONG: 1,550.69
🛑 SL: 1,494.73
🎯 TP: 1,738.18
⚖️ R:R ≈ 1:3.35
Manage capital reasonably—no FOMO and don’t enter a trade based only on a single signal.
#ZEC #ZECUSDT
1
507
·
--
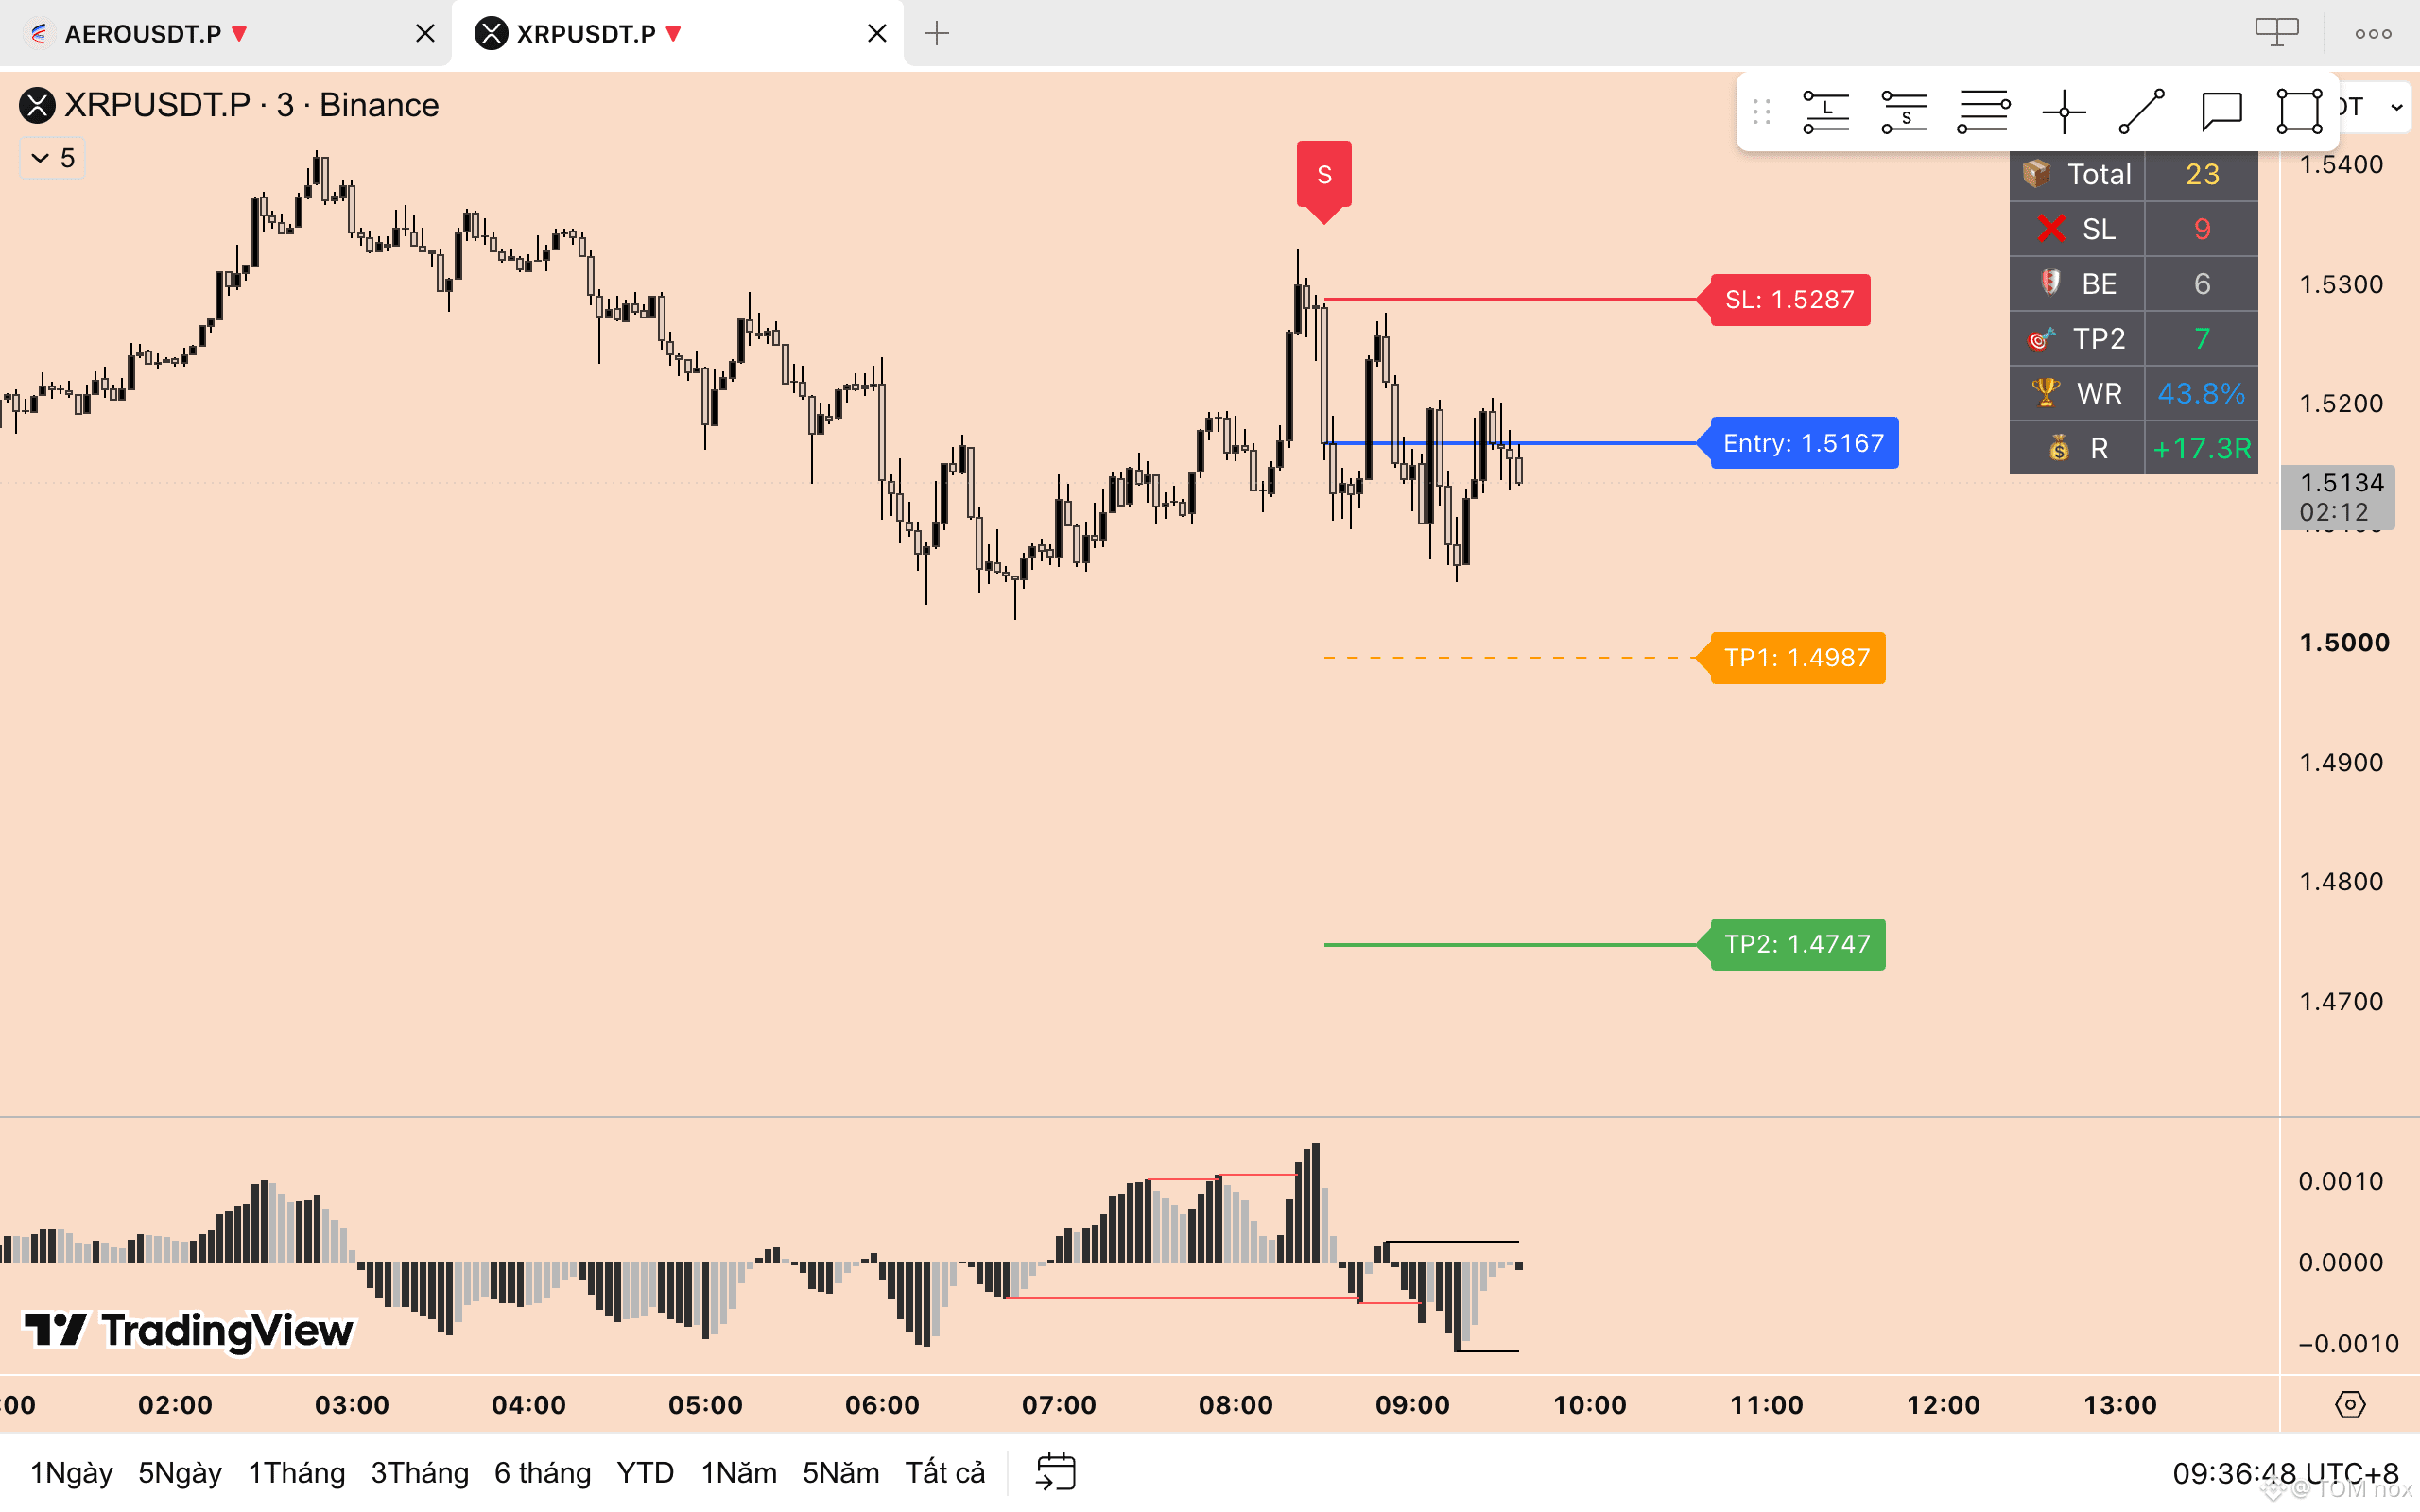
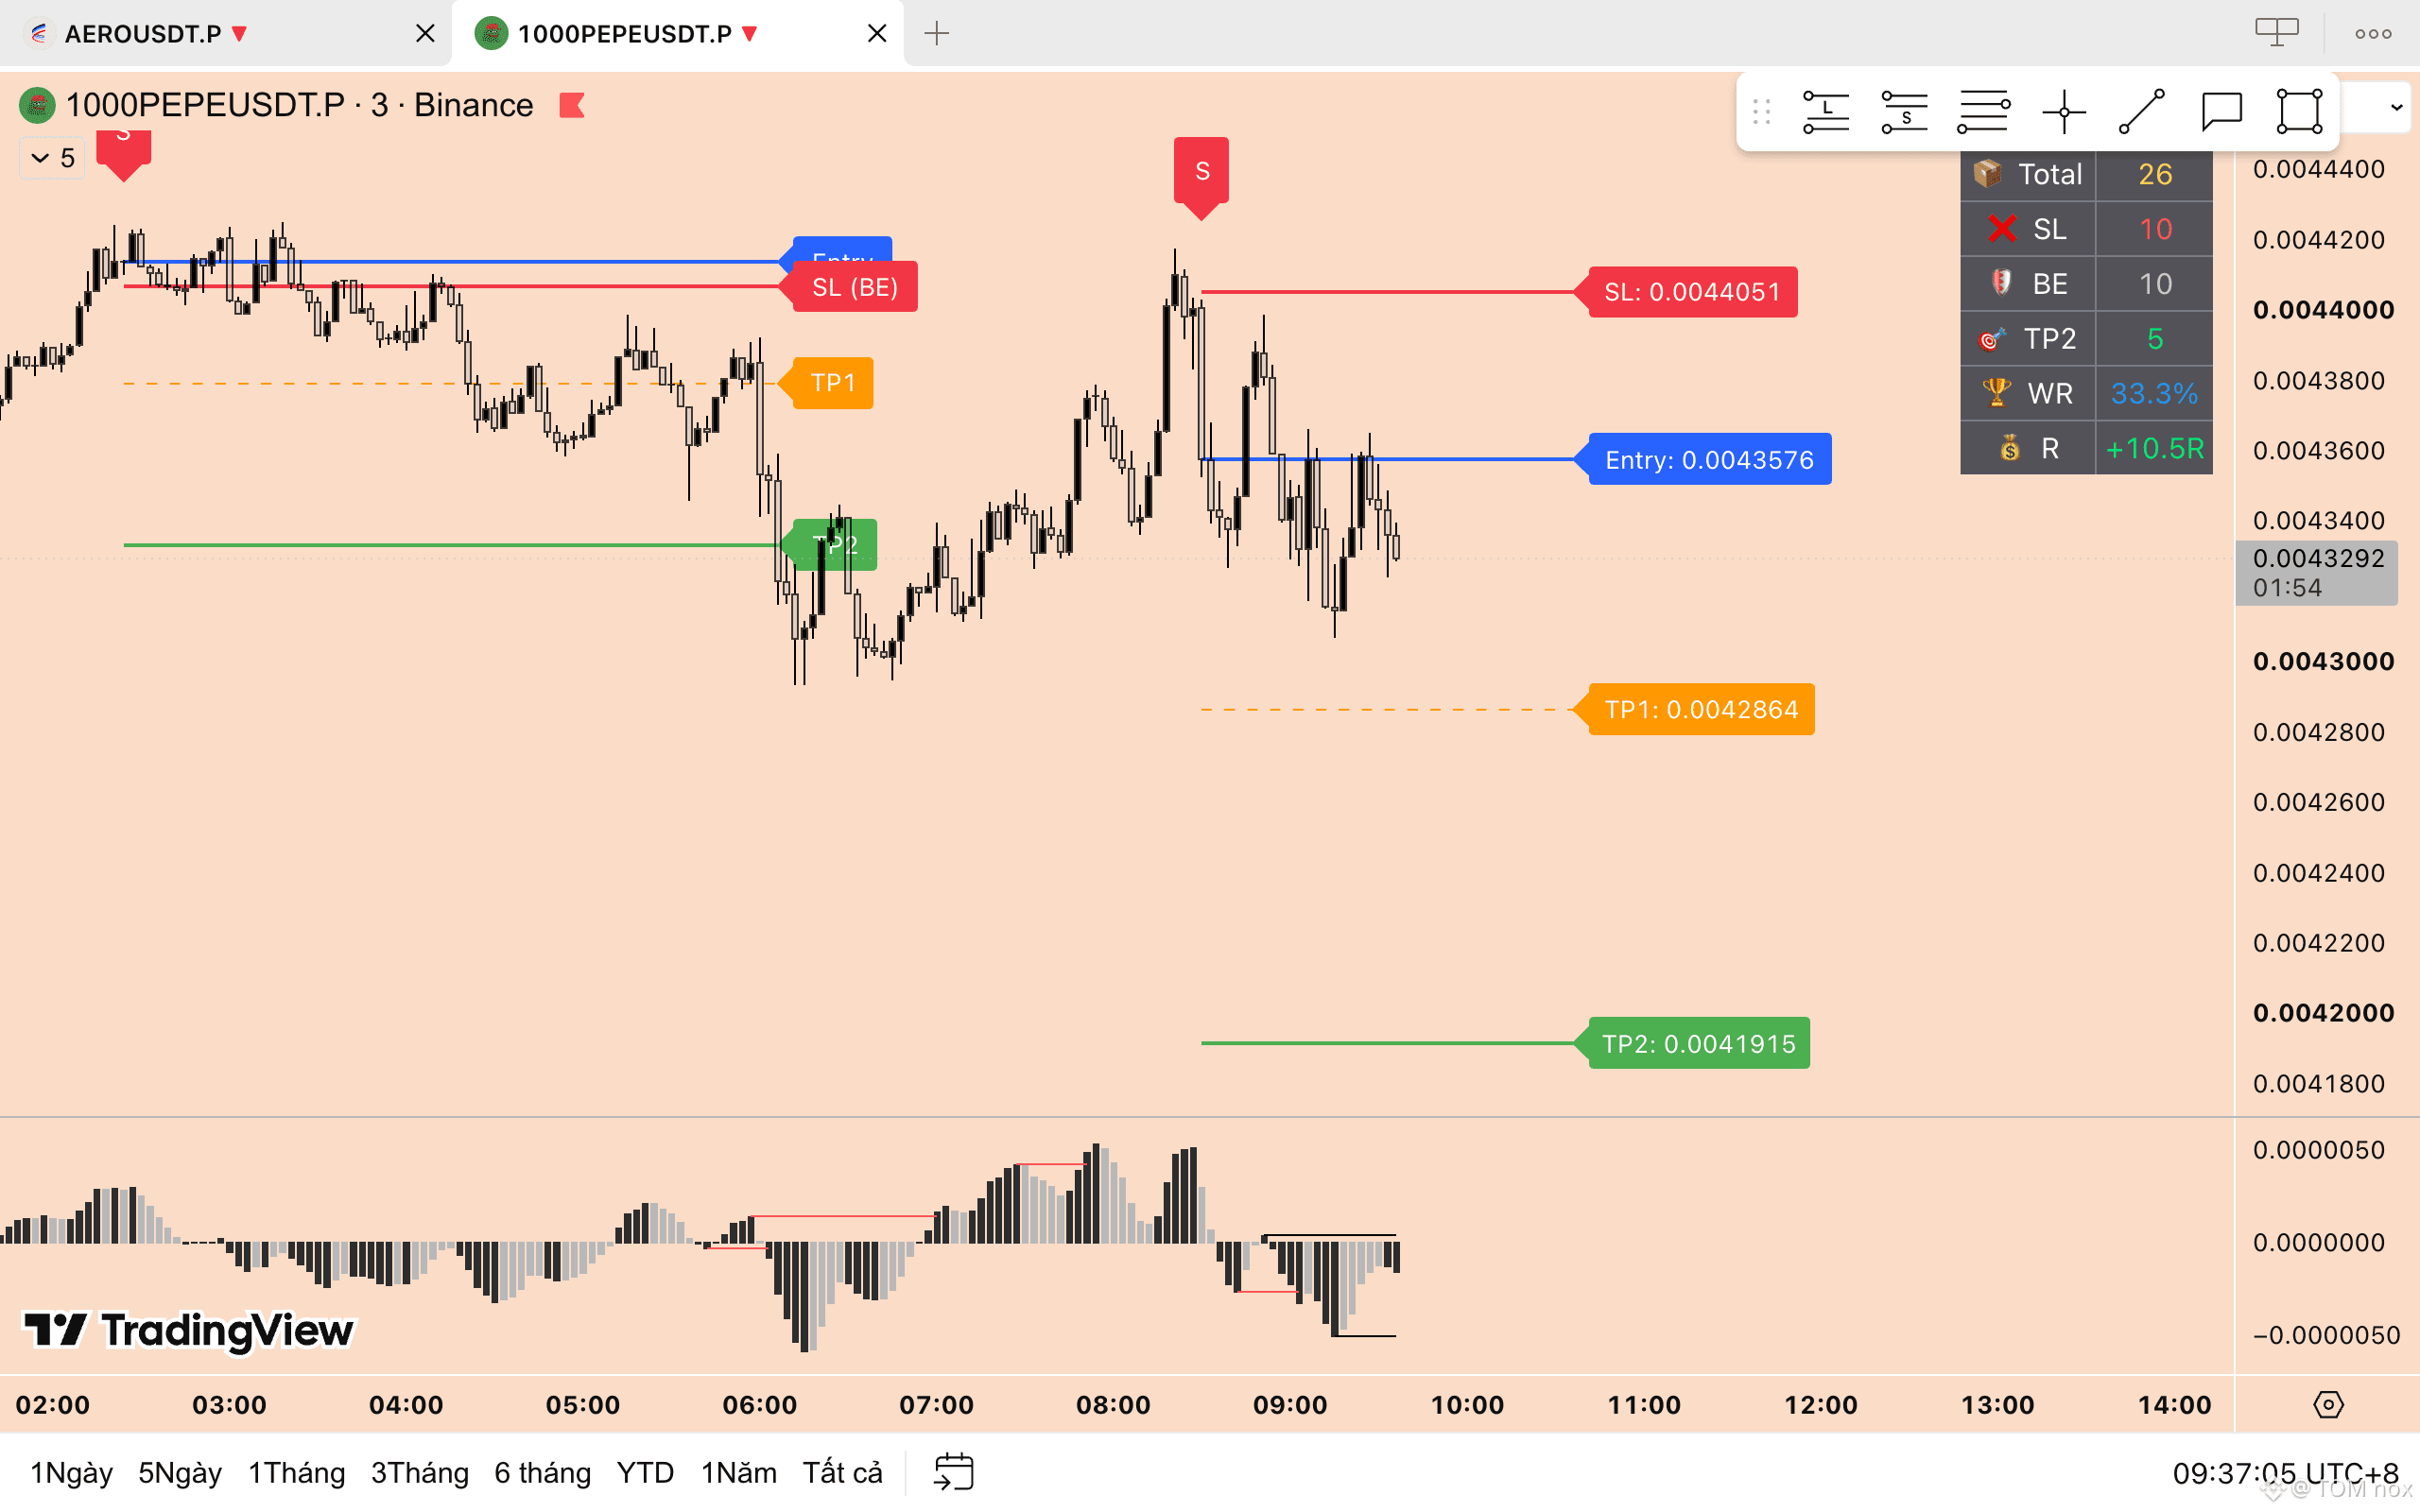
SHORT : $XRP $1000PEPE
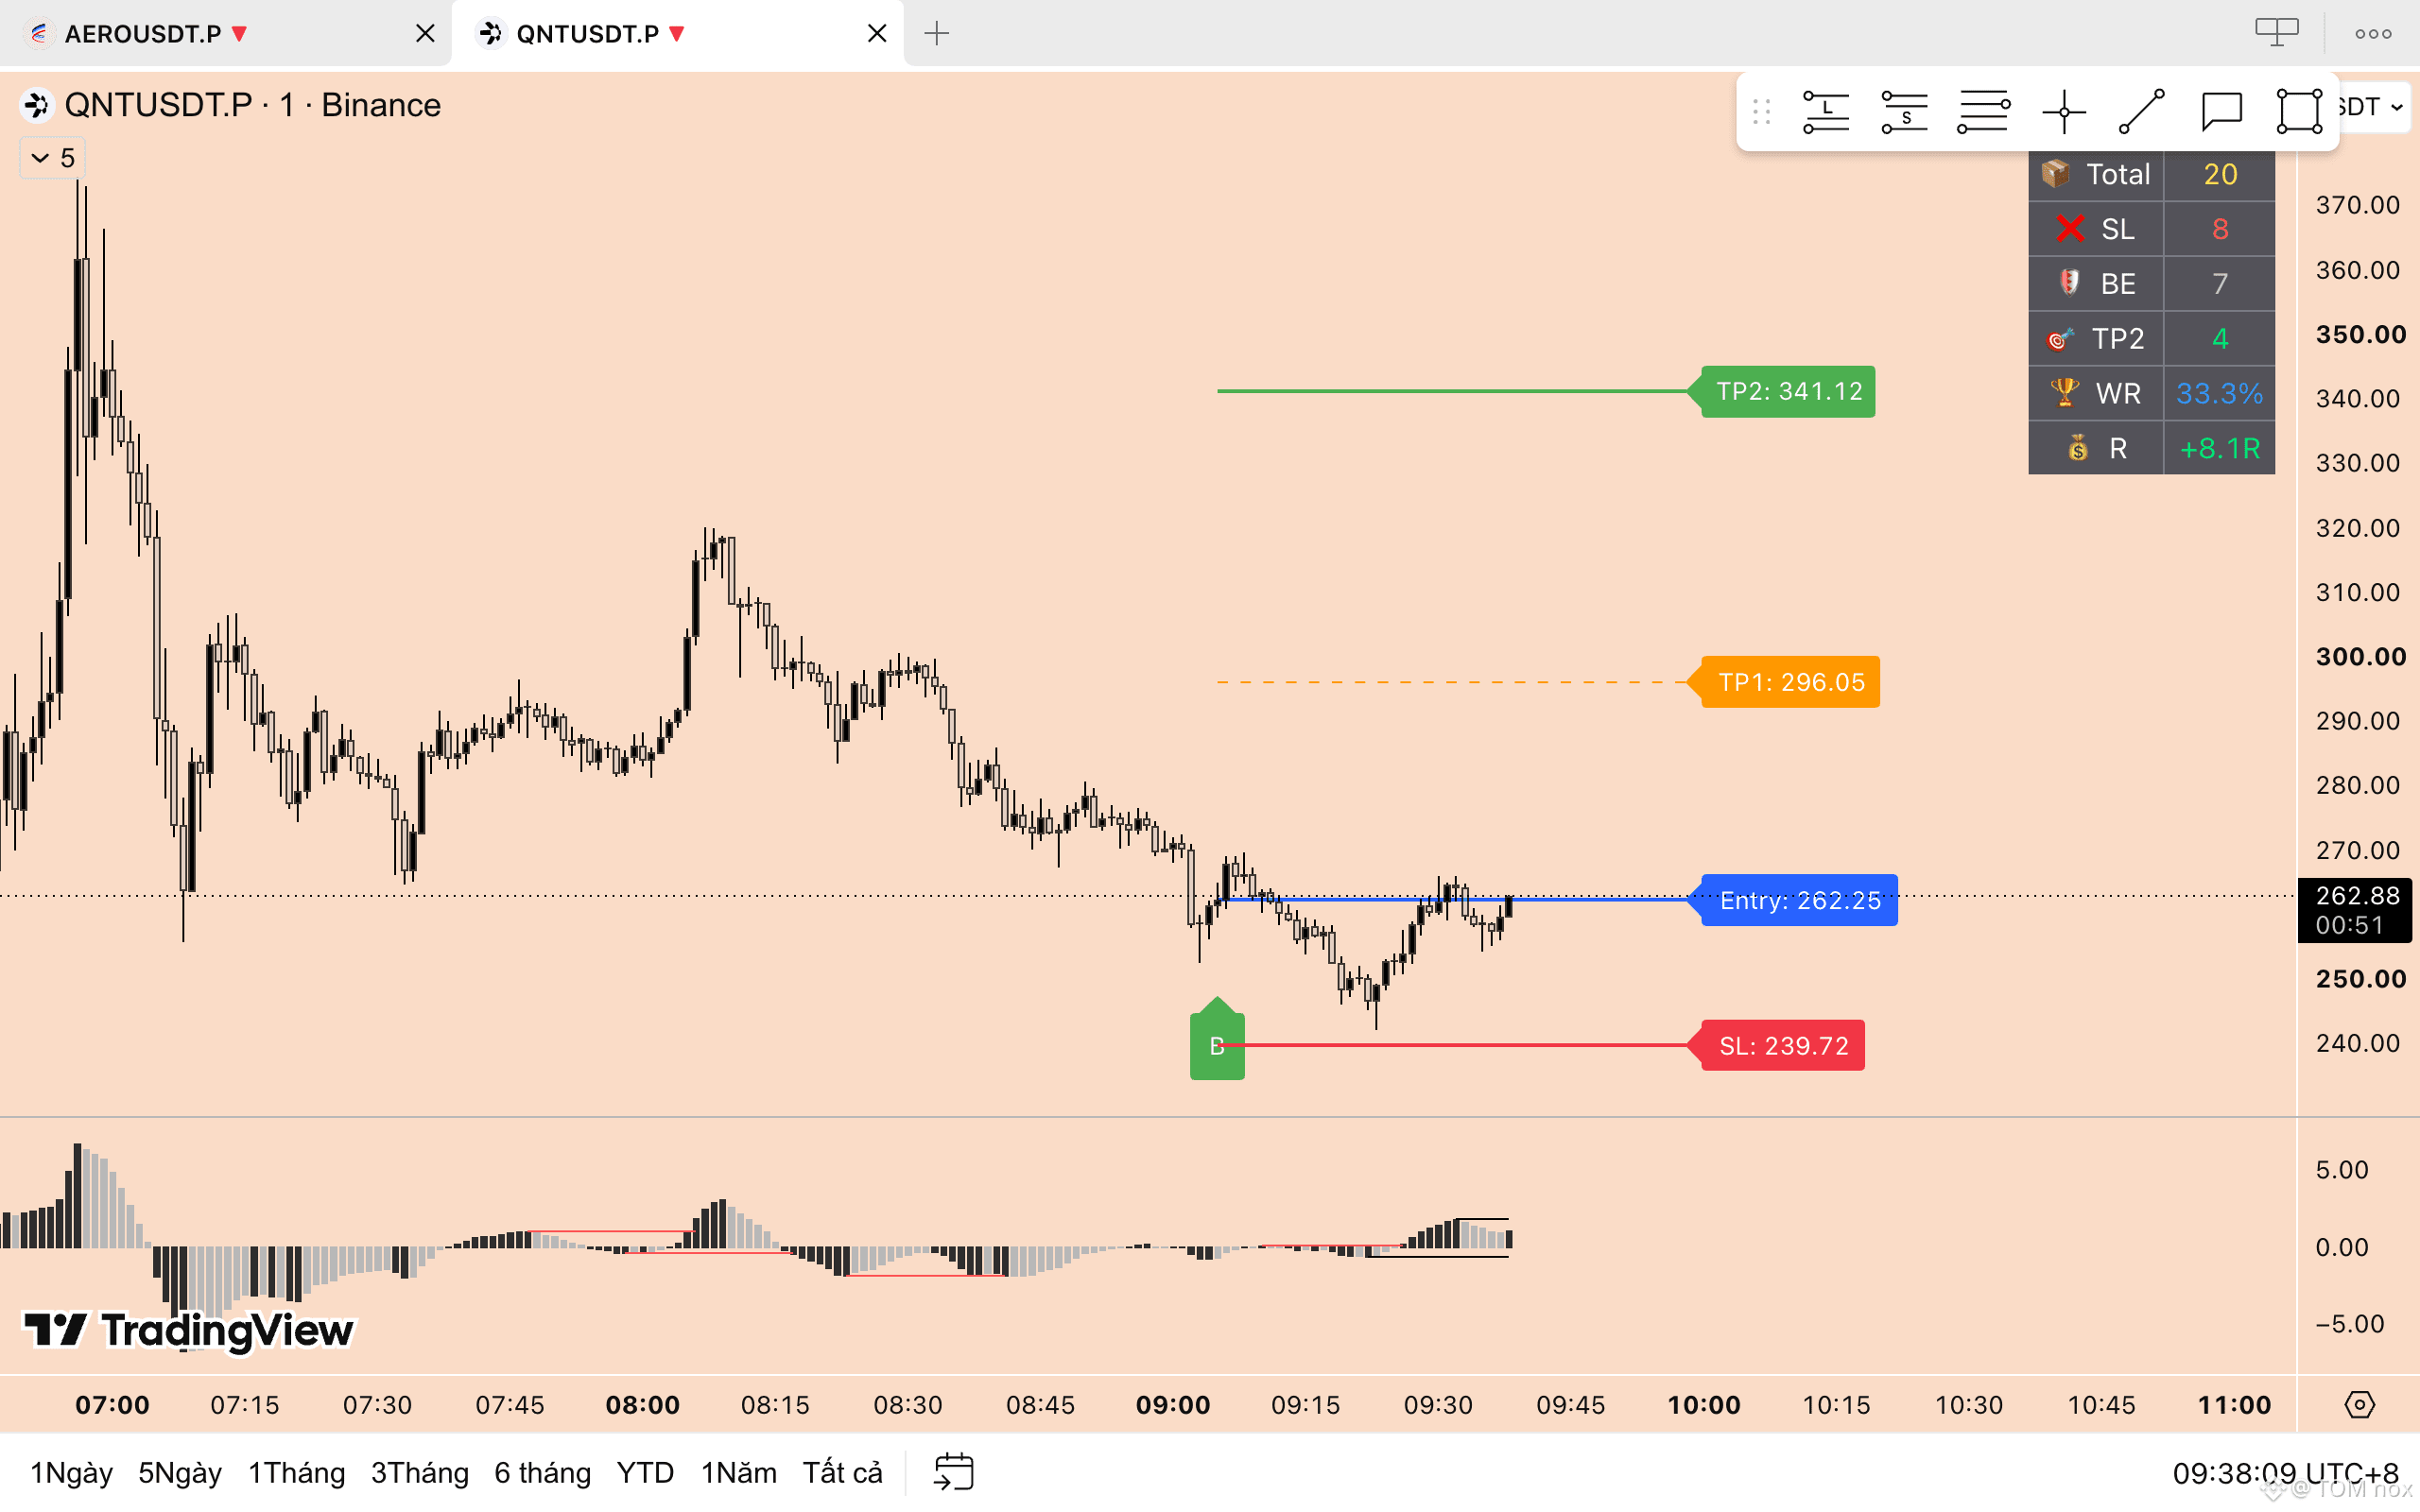
LONG : $QNT
This is a short-term trading signal. Please consider the Volume before placing an order.
Wishing everyone successful trading!
{future}(QNTUSDT)
{future}(1000PEPEUSDT)
{future}(XRPUSDT)
SHORT : $XRP $1000PEPE
LONG : $QNT
This is a short-term trading signal. Please consider the Volume before placing an order.
Wishing everyone successful trading!
LONG : $QNT
This is a short-term trading signal. Please consider the Volume before placing an order.
Wishing everyone successful trading!
1
1.2k
Log in to explore more content
Join global crypto users on Binance Square
⚡️ Get latest and useful information about crypto.
💬 Trusted by the world’s largest crypto exchange.
👍 Discover real insights from verified creators.
Email / Phone number
Trending Topics
EtherGains70.9%InQ3
11,971 views
269 Discussing
#ethergains70.9%inq3
🚀 ETH Shatters Expectations with a Massive 70.9% Q3 Rally—Is Altseason Finally Here?🔥
Ethereum (ETH) just wrapped up one of the most explosive third quarters in its history, locking in a massive +70.9% gain! After a brutal first half of the year (Q1: -29.2% | Q2: -25.2%), ETH completely flipped the script, defying macro headwinds, rising Treasury yields, and a surging US Dollar Index.
$ETH
Institutional Inflows & Spot ETFs Acceleration 🏦
Spot Ethereum ETFs and corporate treasury allocations saw sustained net inflows throughout the quarter. Wall Street's institutional appetite for ETH as a yield-bearing, utility-driven asset has reached new record highs.
ETH Outperforms Bitcoin in Q3 ⚔️
While Bitcoin ($BTC) had a solid quarter, Ethereum significantly outpaced it. This strength is reigniting market discussions around an incoming Altseason, as capital historical flows from BTC into high-cap altcoins following major ETH breakouts.
$ZEC
Staking Dynamics & Supply Shock 🔒
Defi activity and Layer-2 expansion continue to lock up vast amounts of ETH. With staking yields remaining attractive and total supply held on centralized exchanges steadily dropping, market liquidity for physical ETH remains tight.
📊 Technical Landscape & What’s Next for Q4
Key Resistance Watch: ETH recently pushed past local highs around $2,775, with traders eyeing the psychological $3,000 zone as the primary Q4 target.
Macro Risk Factor: Keep an eye on short-position spikes on derivative exchanges and broader Fed monetary policy updates, as leverage wipeouts can create short-term volatility following quarterly closes.
💬 What do you think? Will Ethereum hit $3,000+ in Q4, or are we due for a short-term consolidation before the next leg up? Drop your predictions below! 👇
#US10YearYieldNears5.3% #Ethereum #ETH
Lily星星
·16 Likes
·17.2k views
TreasuryLetsStatesFileStablecoinCertificationsEarly
0 views
0 Discussing
US10YearYieldNears5.3%
51,493 views
483 Discussing