

Dai BNB
55 Posts

Dai BNB
Report
Block User
Lucky is better than skill.
2 Following
217 Followers
626 Liked
Posts
·
--
Bearish
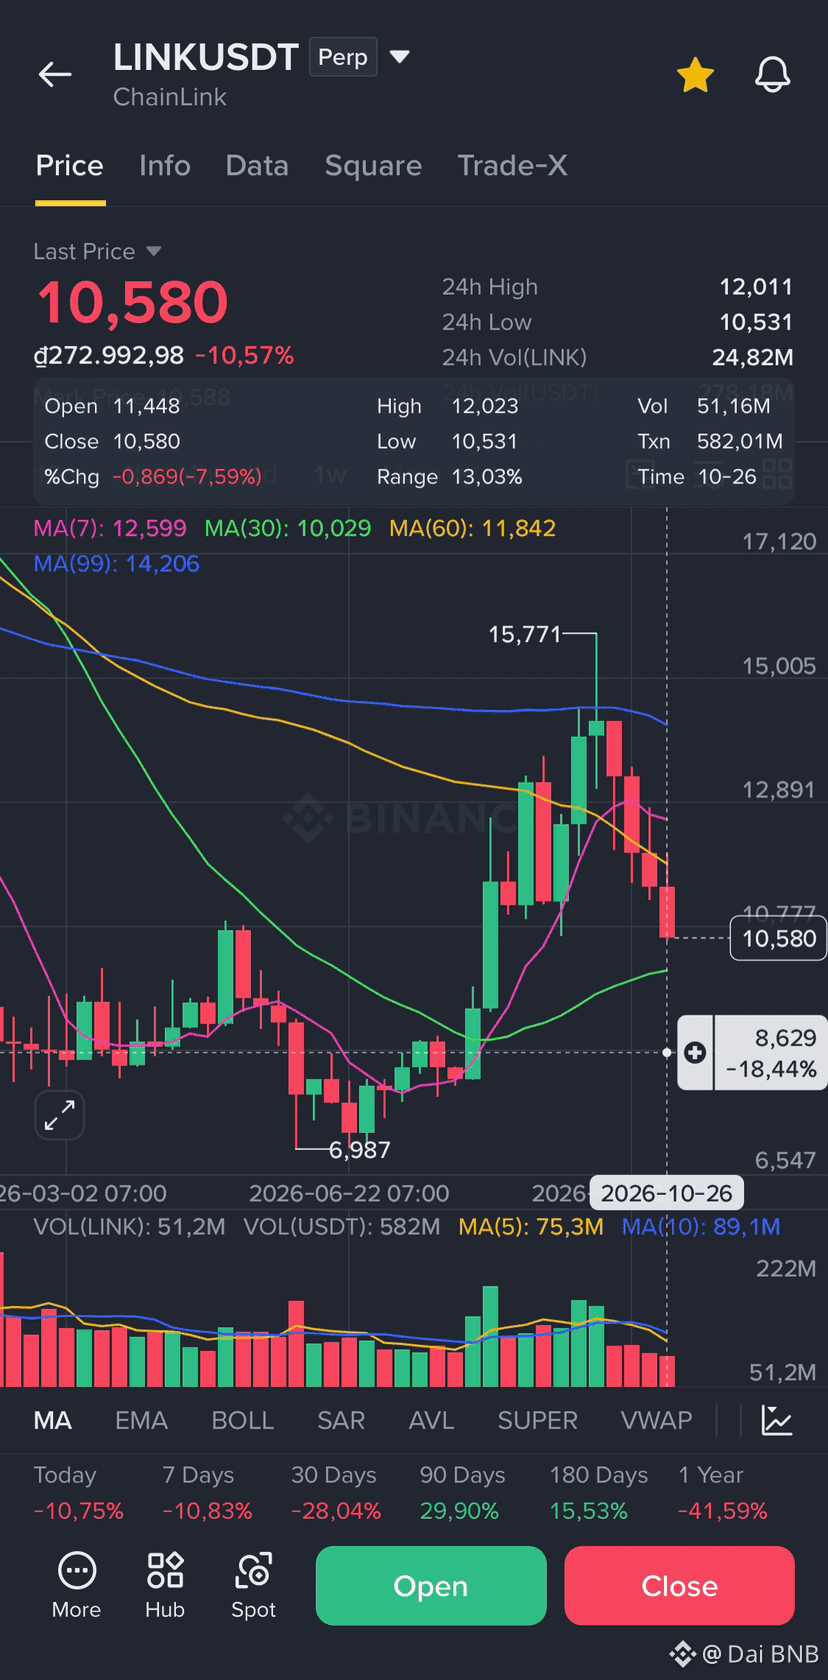
$LINK 🧨 is under strong downward pressure, losing over 11% in a single day, with short-term technical indicators like KDJ all in oversold territory. However, net cash flow has turned positive in the last three days, and the proportion of long positions on professional accounts remains high, indicating a divergence between price volatility and the accumulation sentiment of large investors. Essentially, despite the positive news about the RWA and SWIFT partnership, the market remains cautious, awaiting evidence of actual revenue from the token. Therefore, if the 10.50 level is not held, the downtrend could continue.
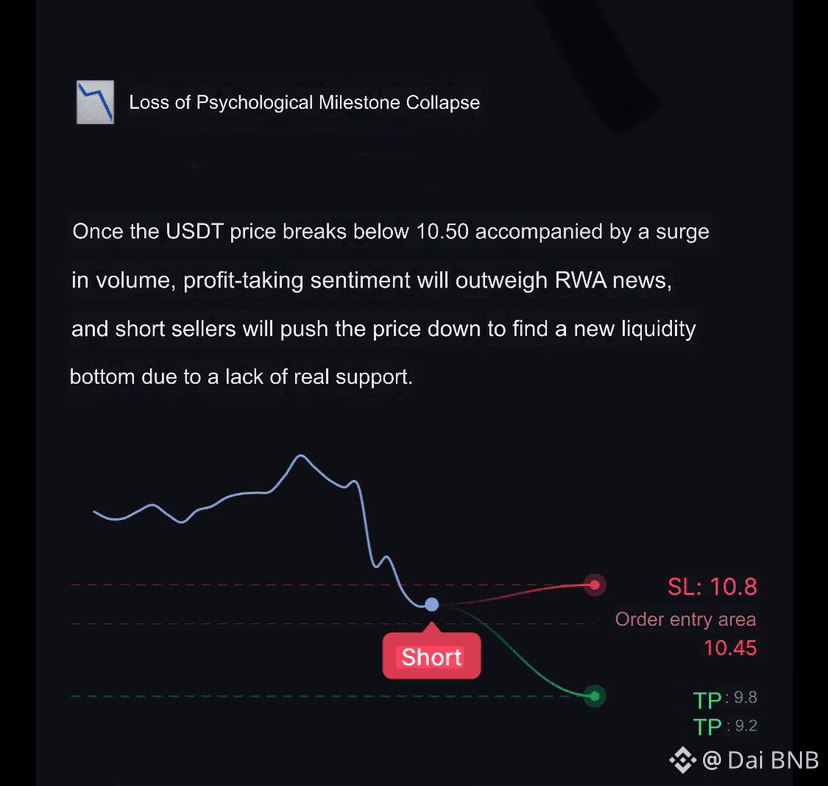
🔥 📉 Loss of the Psychological Breakdown:
Once the 10.50 USDT level is breached accompanied by a surge in volume, profit-taking sentiment will outweigh the RWA news, and short sellers will push the price down to find a new liquidity bottom due to a lack of actual support.
#LenhNguocDong
{future}(LINKUSDT)
$LINK 🧨 is under strong downward pressure, losing over 11% in a single day, with short-term technical indicators like KDJ all in oversold territory. However, net cash flow has turned positive in the last three days, and the proportion of long positions on professional accounts remains high, indicating a divergence between price volatility and the accumulation sentiment of large investors. Essentially, despite the positive news about the RWA and SWIFT partnership, the market remains cautious, awaiting evidence of actual revenue from the token. Therefore, if the 10.50 level is not held, the downtrend could continue.
🔥 📉 Loss of the Psychological Breakdown:
Once the 10.50 USDT level is breached accompanied by a surge in volume, profit-taking sentiment will outweigh the RWA news, and short sellers will push the price down to find a new liquidity bottom due to a lack of actual support.
#LenhNguocDong
🔥 📉 Loss of the Psychological Breakdown:
Once the 10.50 USDT level is breached accompanied by a surge in volume, profit-taking sentiment will outweigh the RWA news, and short sellers will push the price down to find a new liquidity bottom due to a lack of actual support.
#LenhNguocDong
311
·
--
Bearish
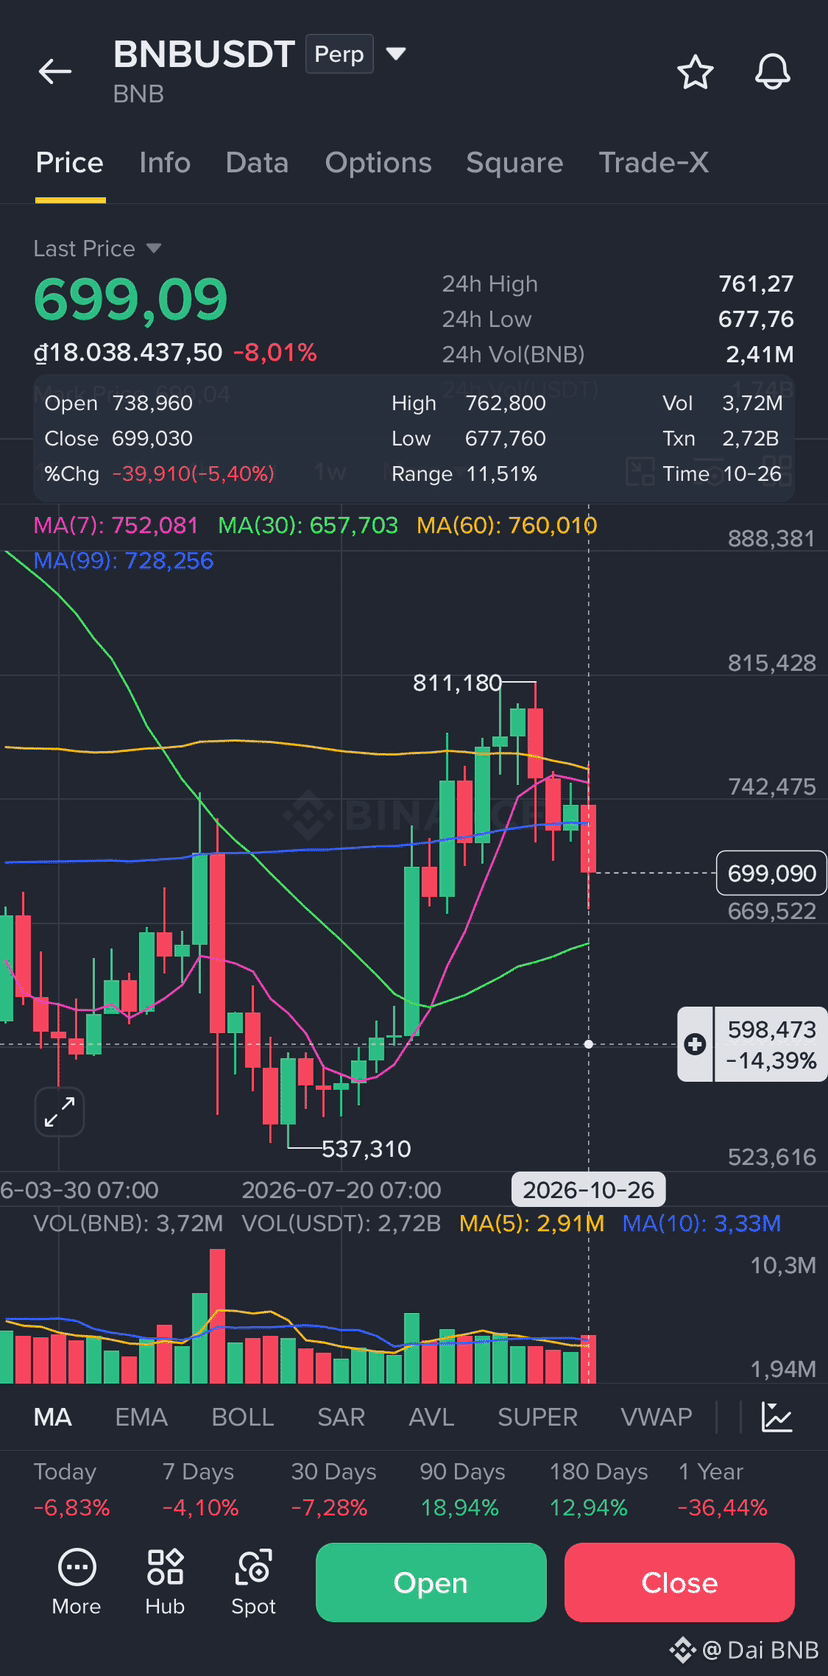
$BNB ⚡️FUD withdrawals and tightening macroeconomic conditions: Rumors of a Binance-related wallet withdrawing $2.77 billion caused a short-term -9% drop, combined with the Fed keeping interest rates unchanged, causing the Fear & Greed Index to fall to 38. Macroeconomic liquidity pressure may hinder the recovery despite strong fundamentals.
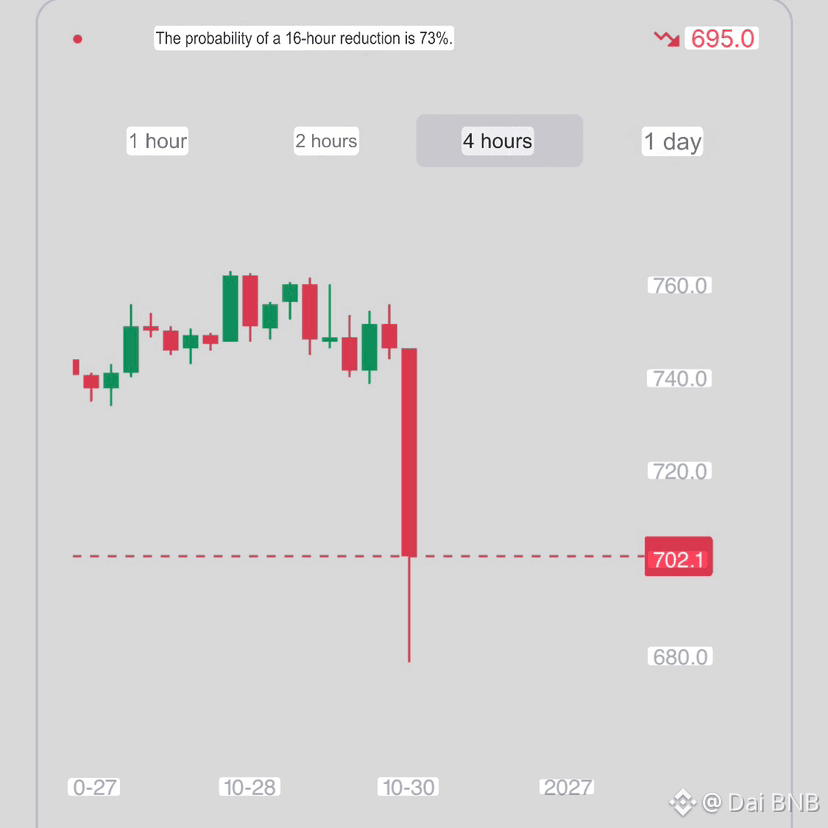
Short-term Sell 📉
Entry point: 699 USDT
Stop loss: 720 USDT
Take profit: 660 USDT - Take profit: 640 USDT
#BNB_Market_Update
{future}(BNBUSDT)
$BNB ⚡️FUD withdrawals and tightening macroeconomic conditions: Rumors of a Binance-related wallet withdrawing $2.77 billion caused a short-term -9% drop, combined with the Fed keeping interest rates unchanged, causing the Fear & Greed Index to fall to 38. Macroeconomic liquidity pressure may hinder the recovery despite strong fundamentals.
Short-term Sell 📉
Entry point: 699 USDT
Stop loss: 720 USDT
Take profit: 660 USDT - Take profit: 640 USDT
#BNB_Market_Update
Short-term Sell 📉
Entry point: 699 USDT
Stop loss: 720 USDT
Take profit: 660 USDT - Take profit: 640 USDT
#BNB_Market_Update
18
·
--
Bearish
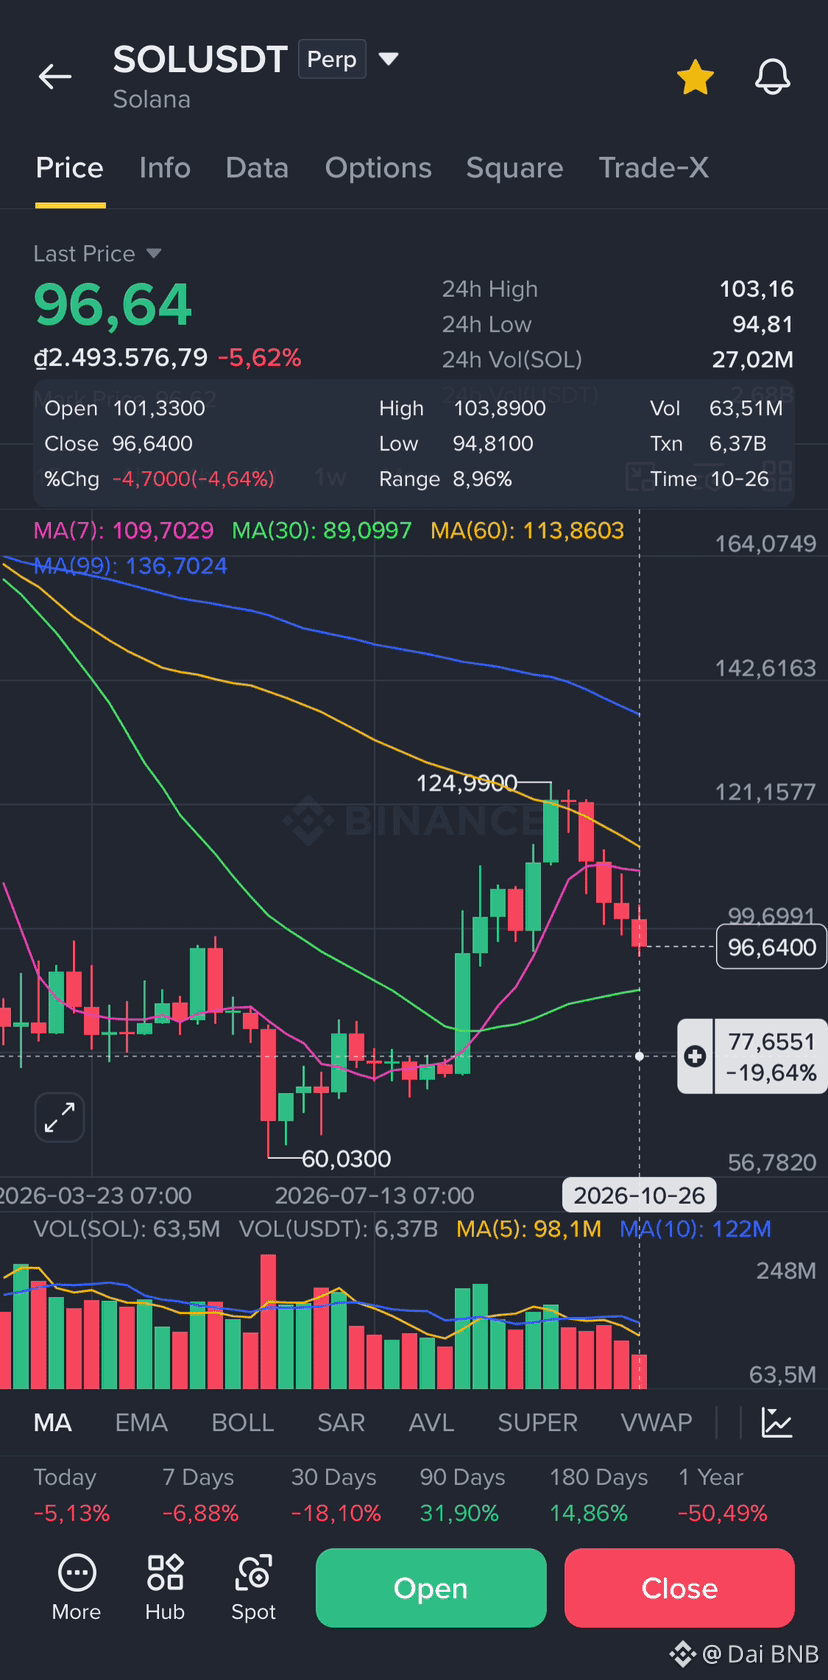
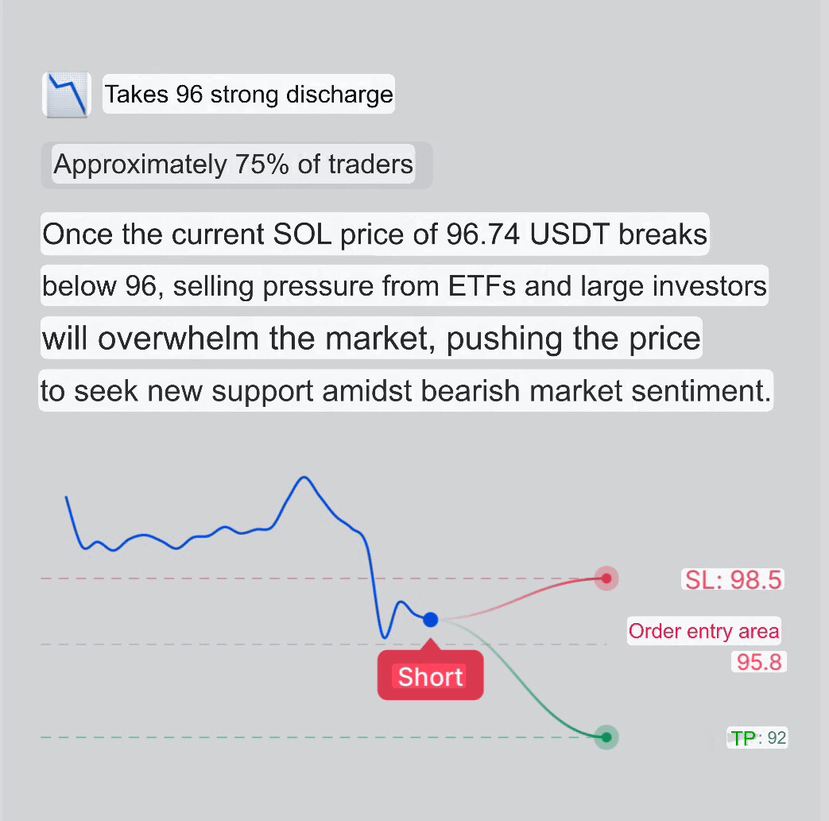
$SOL 🔥SOL Loses 96, Heavy Selling
Approximately 75% of Traders Short 📉
Once the current SOL price of 96.74 USDT breaks below 96, selling pressure from ETFs and whales will overwhelm the price, pushing it to find new support amidst bearish market sentiment.
#USMidtermElections
{future}(SOLUSDT)
$SOL 🔥SOL Loses 96, Heavy Selling
Approximately 75% of Traders Short 📉
Once the current SOL price of 96.74 USDT breaks below 96, selling pressure from ETFs and whales will overwhelm the price, pushing it to find new support amidst bearish market sentiment.
#USMidtermElections
Approximately 75% of Traders Short 📉
Once the current SOL price of 96.74 USDT breaks below 96, selling pressure from ETFs and whales will overwhelm the price, pushing it to find new support amidst bearish market sentiment.
#USMidtermElections
128
·
--
Bearish
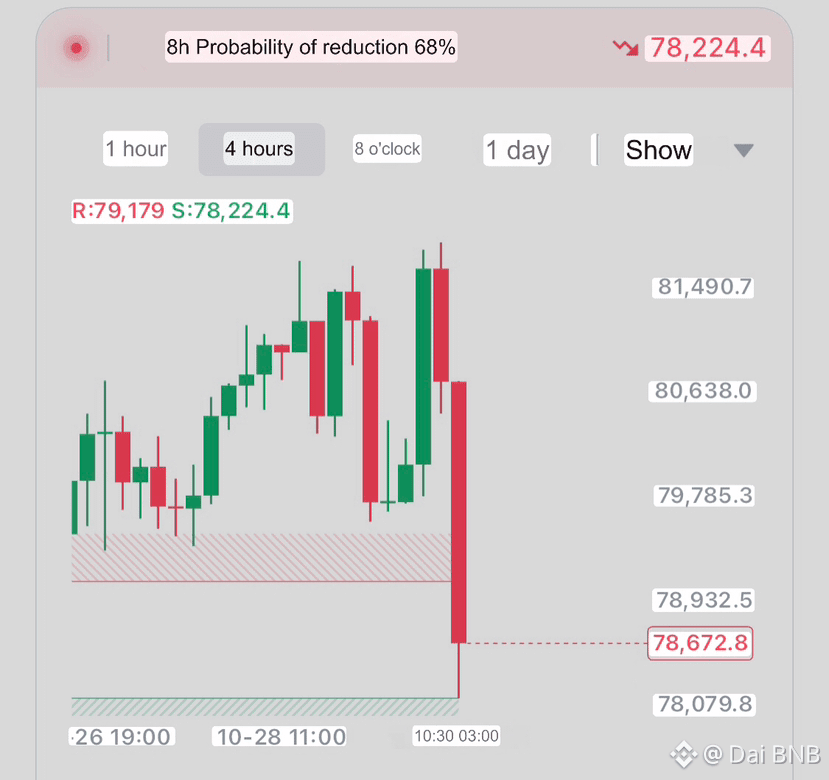
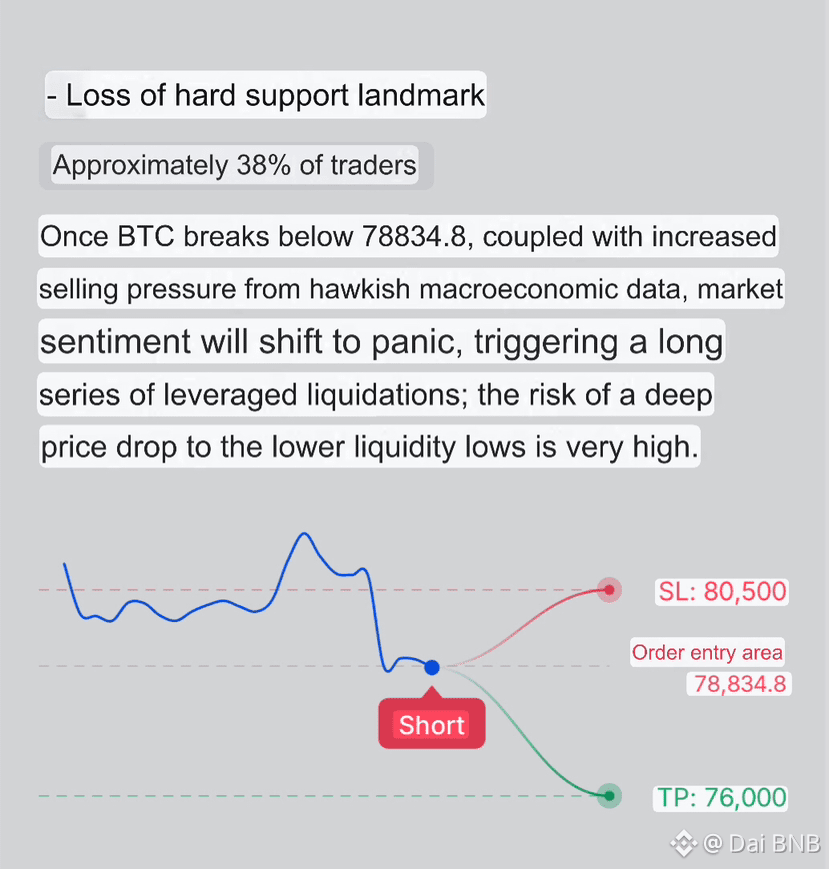
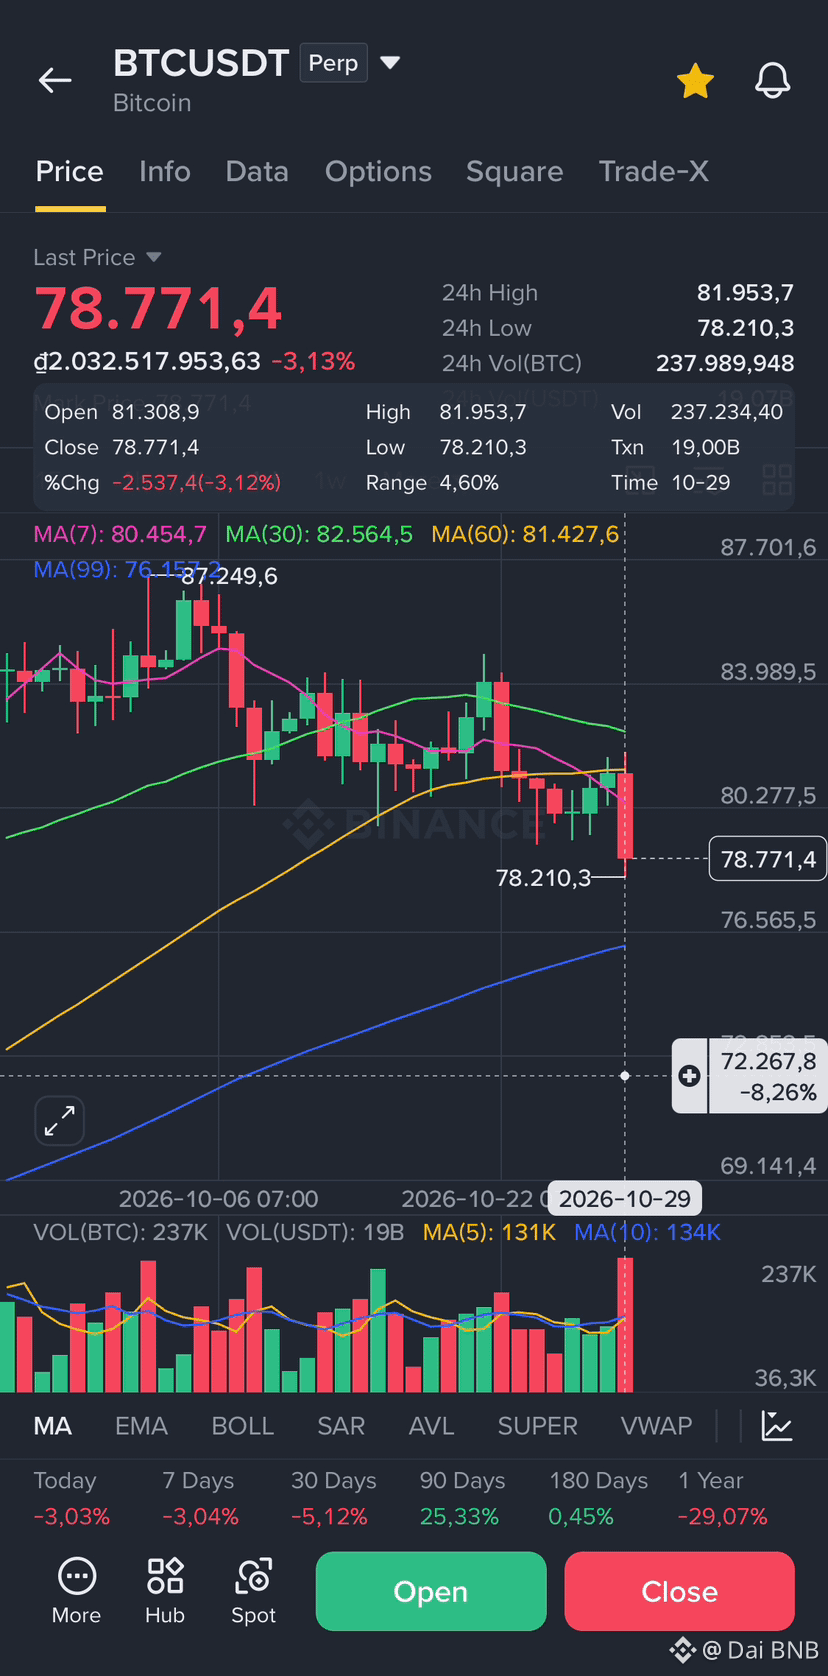
$BTC Multi-timeframe forecast for BTC:
shows a downward trend, primarily due to a sharp increase in trading volume as the price broke through key support levels, while moving averages are in a bearish alignment. Persistent macroeconomic inflation has curbed risk appetite, while active selling from the futures market is further increasing selling pressure. Short-term bearish momentum remains strong; caution is needed regarding the risk of further bottoming out, and close monitoring of support levels is necessary.
#BTC走势分析
{future}(BTCUSDT)
$BTC Multi-timeframe forecast for BTC:
shows a downward trend, primarily due to a sharp increase in trading volume as the price broke through key support levels, while moving averages are in a bearish alignment. Persistent macroeconomic inflation has curbed risk appetite, while active selling from the futures market is further increasing selling pressure. Short-term bearish momentum remains strong; caution is needed regarding the risk of further bottoming out, and close monitoring of support levels is necessary.
#BTC走势分析
106
·
--
Bullish
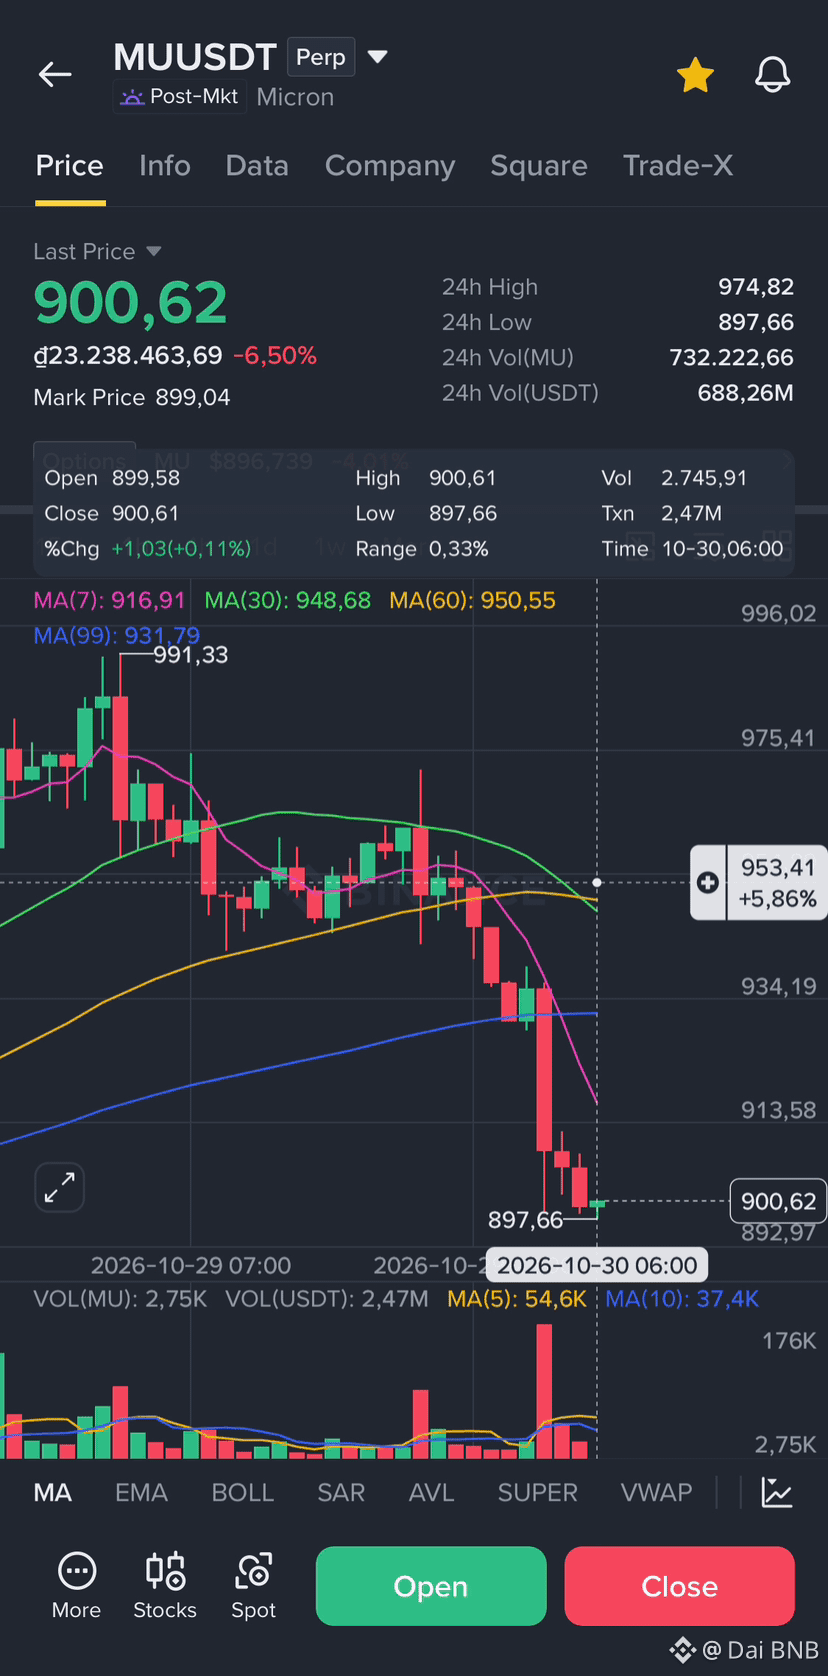
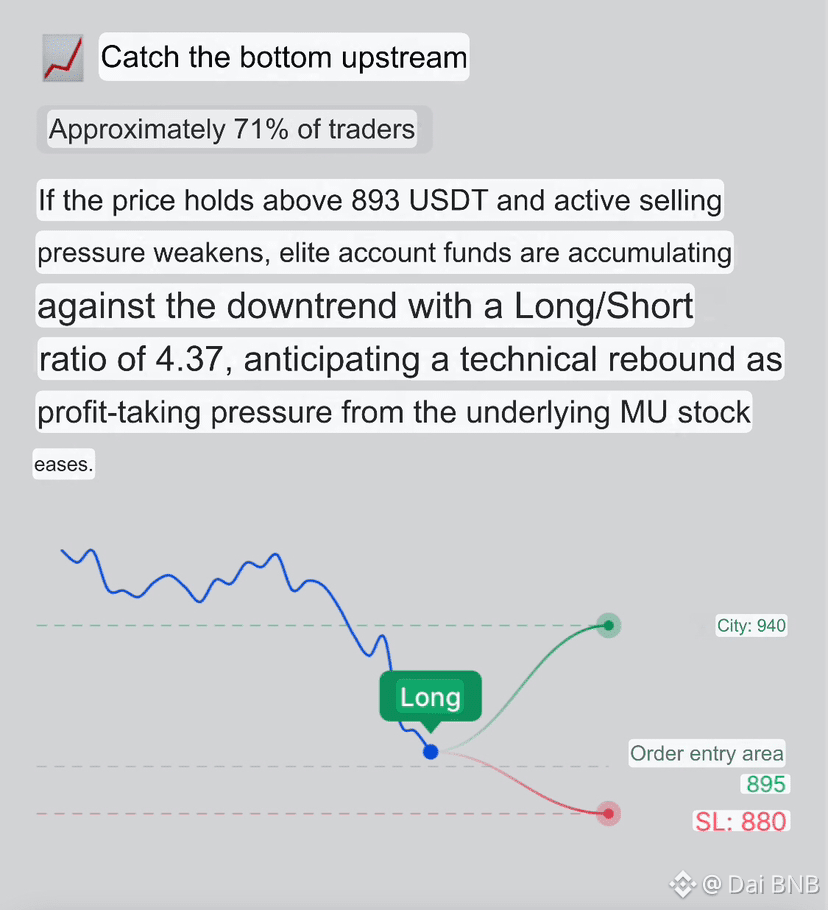
$MU ⚡️Core Trend: Price fell -5.29% to 900.25 USDT due to profit-taking pressure from Micron stock, but the Long/Short ratio for elite accounts increased to 4.37, indicating that large amounts of capital are quietly accumulating against the trend.
🧨Strategic Idea: Look to buy in the support zone of 893 – 900 USDT, set a stop loss if it breaks below 880 USDT, and target a short-term rebound to 940 – 950 USDT when selling pressure weakens.
#FedWatch
{future}(MUUSDT)
$MU ⚡️Core Trend: Price fell -5.29% to 900.25 USDT due to profit-taking pressure from Micron stock, but the Long/Short ratio for elite accounts increased to 4.37, indicating that large amounts of capital are quietly accumulating against the trend.
🧨Strategic Idea: Look to buy in the support zone of 893 – 900 USDT, set a stop loss if it breaks below 880 USDT, and target a short-term rebound to 940 – 950 USDT when selling pressure weakens.
#FedWatch
🧨Strategic Idea: Look to buy in the support zone of 893 – 900 USDT, set a stop loss if it breaks below 880 USDT, and target a short-term rebound to 940 – 950 USDT when selling pressure weakens.
#FedWatch
298
·
--
Bullish
Partly True
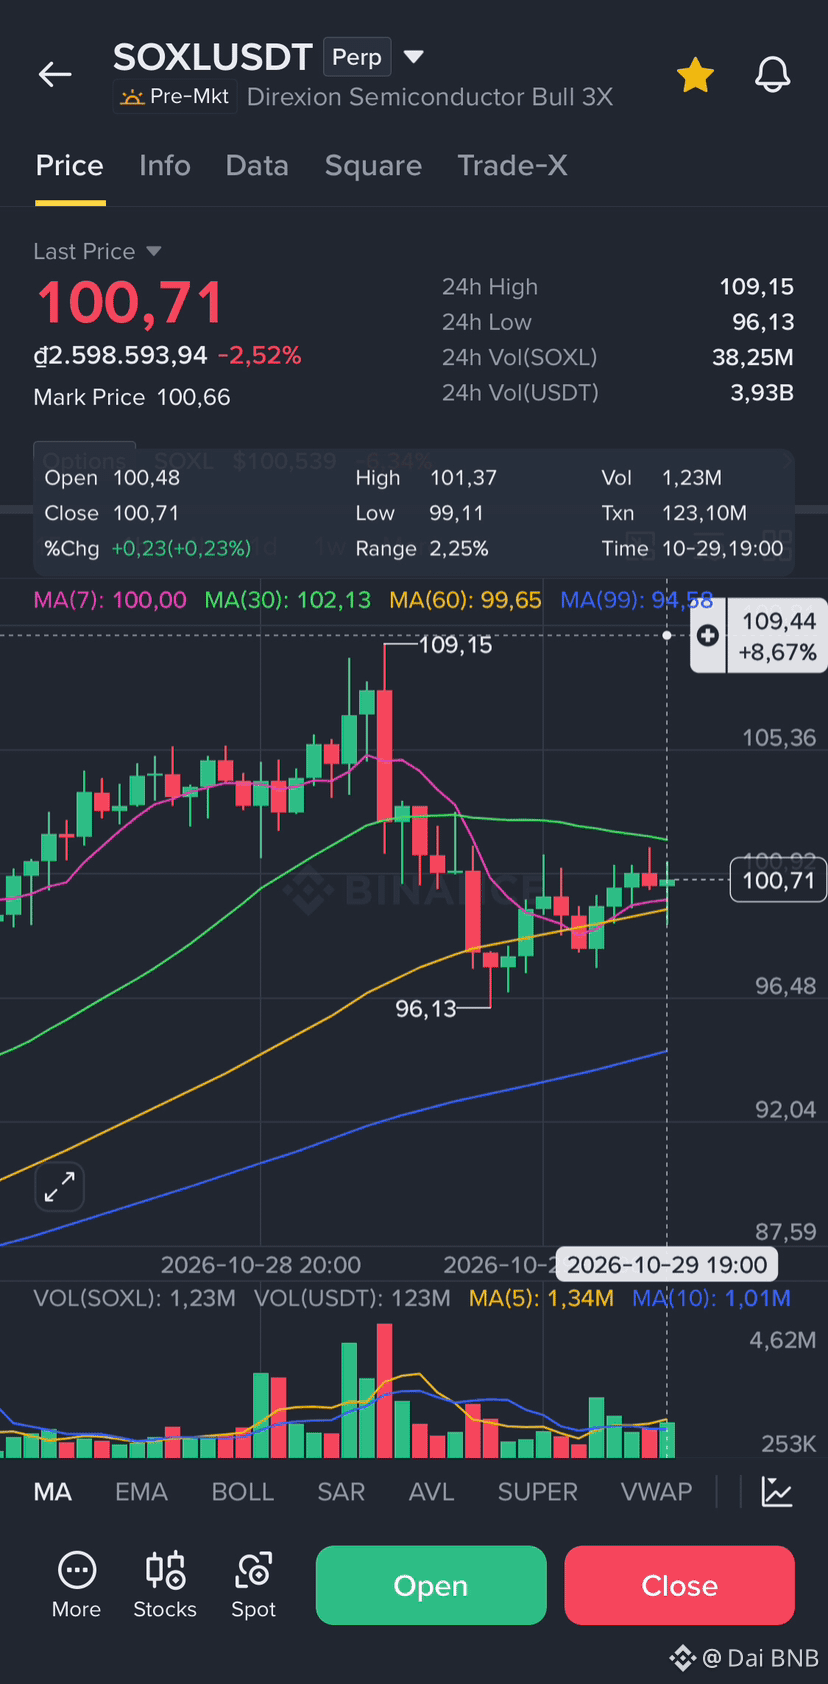
$SOXL 📈 Breaking Resistance for a Short-Term Ride
Approximately 72% of Traders
If the SOXL price at 101.02 USDT holds above 103.00 USDT, active buying will outweigh short-term profit-taking selling. FOMO sentiment from the 3x semiconductor ETF group returns, pushing the price to test the old peak as positive AI chip news is confirmed.
Trade Setup: Long - SOXL 📈
Entry: $100,08
SL: $98,72
TP1: $103,39
TP2: $106,58
TP3: $110,89
✅ Click here to trade: 👇
#Nasdaq100FuturesFall0.9%
{future}(SOXLUSDT)
$SOXL 📈 Breaking Resistance for a Short-Term Ride
Approximately 72% of Traders
If the SOXL price at 101.02 USDT holds above 103.00 USDT, active buying will outweigh short-term profit-taking selling. FOMO sentiment from the 3x semiconductor ETF group returns, pushing the price to test the old peak as positive AI chip news is confirmed.
Trade Setup: Long - SOXL 📈
Entry: $100,08
SL: $98,72
TP1: $103,39
TP2: $106,58
TP3: $110,89
✅ Click here to trade: 👇
#Nasdaq100FuturesFall0.9%
1
748
·
--
Bearish
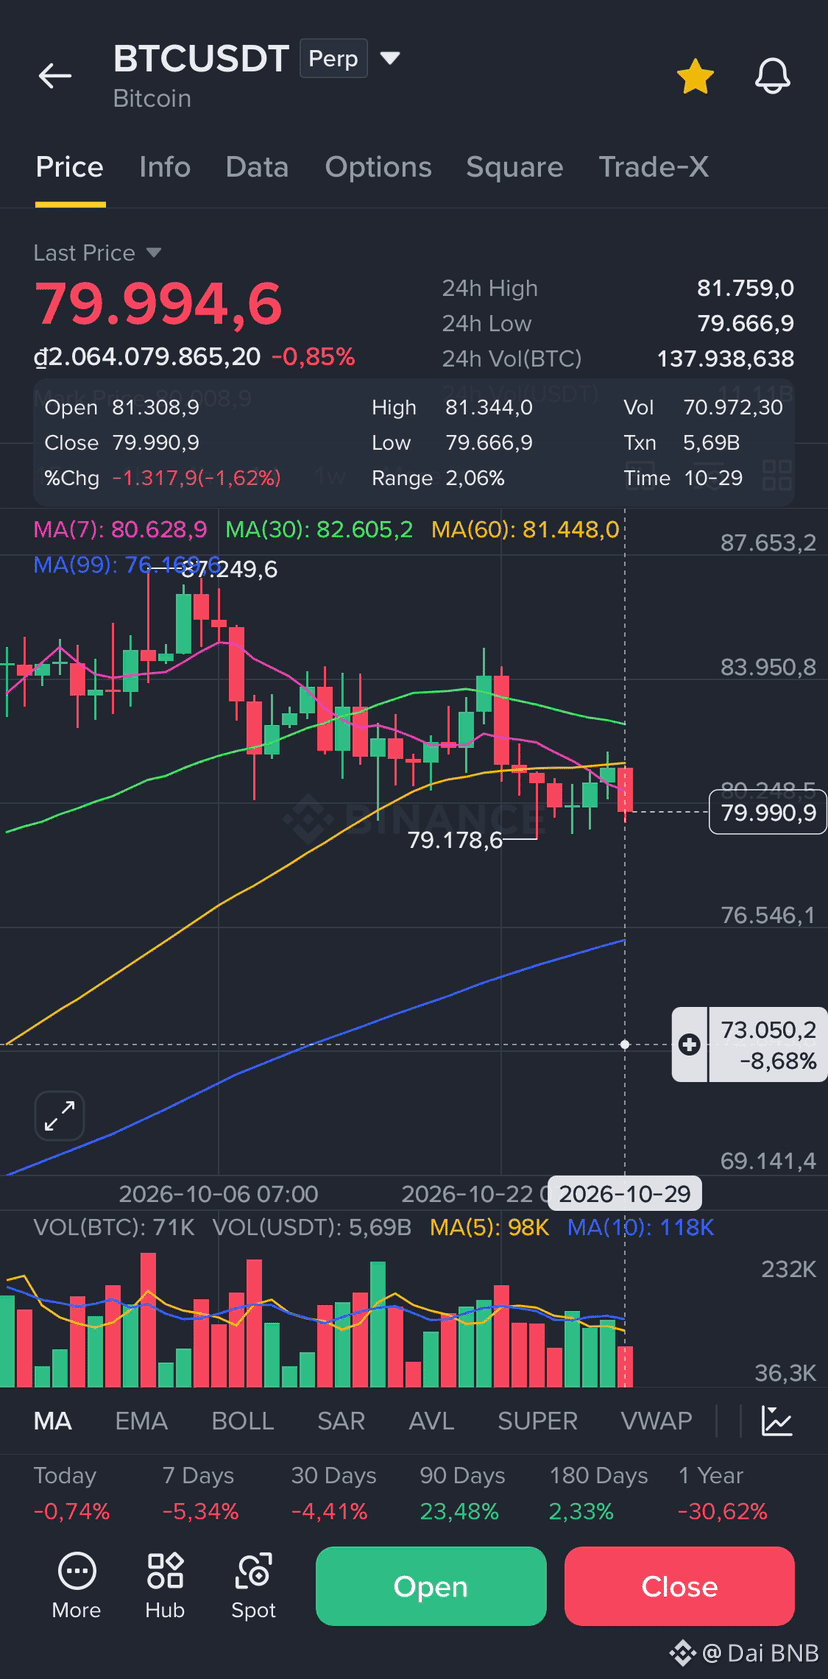
$BTC The upward momentum is suppressed by macroeconomic pressure; a new catalyst is needed to break out of the 80K region.
⚡️Busy positions: The long/short ratio at 1.44 indicates that the crowd is buying the dip early, with a high risk of stop-loss sweeps.
⚡️Low liquidity: The 79.5K region contains many stop-loss orders from long positions, making it easy for large investors to push the price down to accumulate shares.
⚡️Scenario: High probability of a long sweep.
Trade Setup: Long - BTC
Entry: $80.121
SL: $81.688
TP1: $78.002
TP2: $76.052
TP3: $73.102
✅ Click here to trade: 👇 #RussiaProposedNonCustodialWalletLimitsExcludeIntlSettlements
{future}(BTCUSDT)
$BTC The upward momentum is suppressed by macroeconomic pressure; a new catalyst is needed to break out of the 80K region.
⚡️Busy positions: The long/short ratio at 1.44 indicates that the crowd is buying the dip early, with a high risk of stop-loss sweeps.
⚡️Low liquidity: The 79.5K region contains many stop-loss orders from long positions, making it easy for large investors to push the price down to accumulate shares.
⚡️Scenario: High probability of a long sweep.
Trade Setup: Long - BTC
Entry: $80.121
SL: $81.688
TP1: $78.002
TP2: $76.052
TP3: $73.102
✅ Click here to trade: 👇 #RussiaProposedNonCustodialWalletLimitsExcludeIntlSettlements
1
34
·
--
Bullish
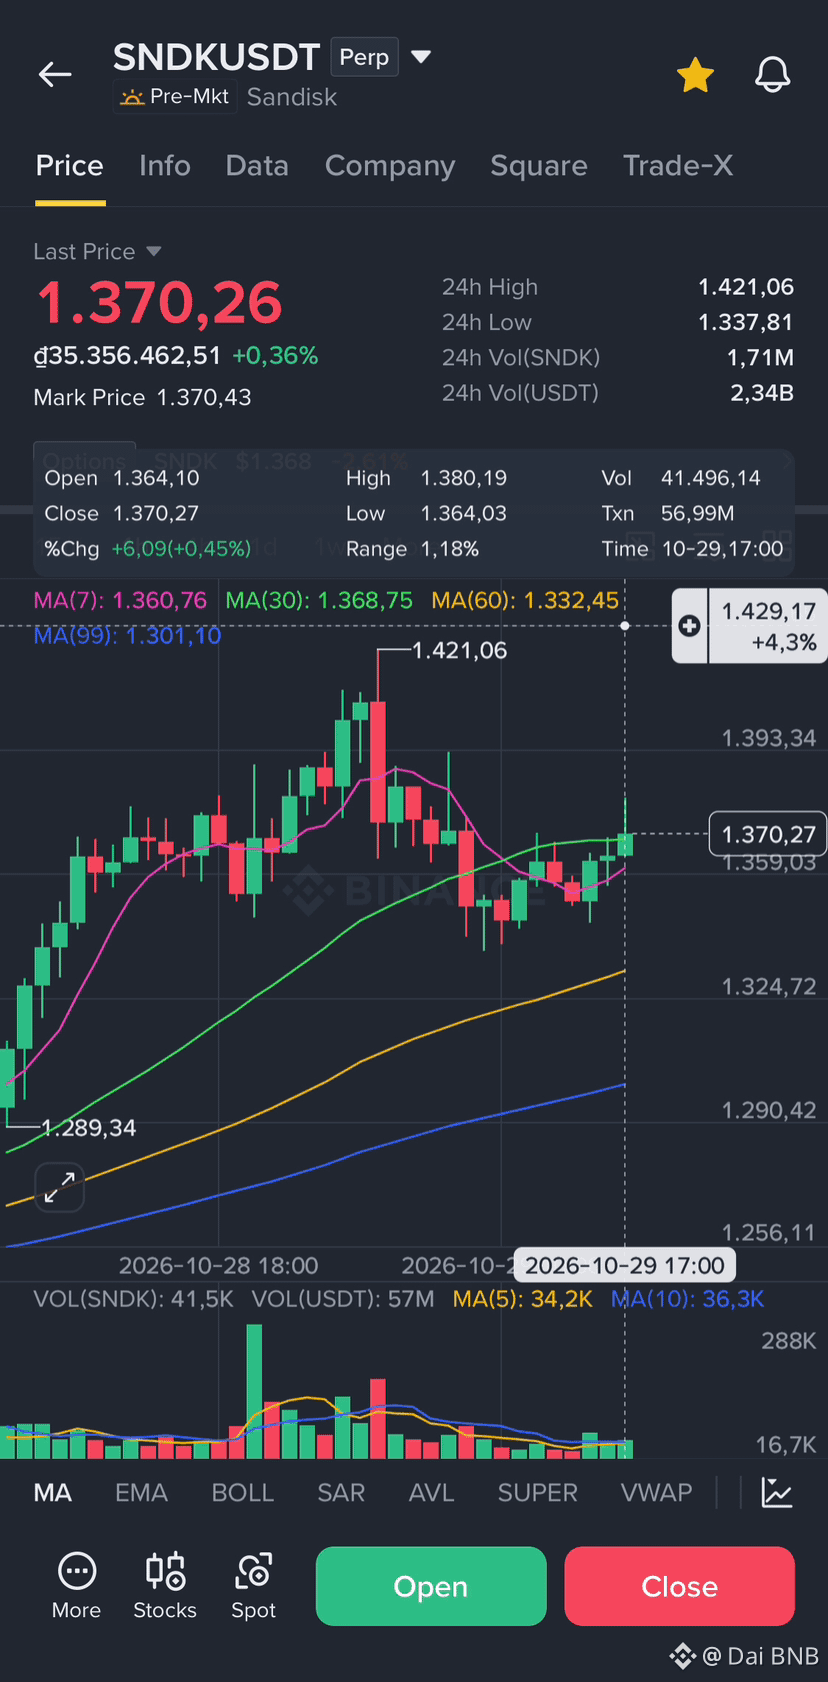
$SNDK Observing the current SNDK price at 1.365,59 with slight fluctuations, it suggests a consolidation phase rather than distribution. The percentage of accounts holding long positions is as high as 97%, reflecting smart money patiently holding instead of selling. However, the KDJ indicator on the hourly timeframe has entered the overbought zone, and the daily MACD, while positive, is still weak, suggesting that the upward momentum hasn't truly broken through. Combined with neutral macroeconomic news and the absence of significant net capital inflows recently, I believe smart money is quietly accumulating at this price level rather than beginning distribution.
🚀 Accumulating Base Waiting for Breakout
Approximately 71% of traders
If the price holds above 1360.00 and long positions remain above 95%, selling pressure will be completely absorbed, and smart money is compressing the spring, waiting for a breakout above 1403.00
Trade Setup: Long - SNDK 📈
Entry: $1.365,59
SL: $1.329,38
TP1: $1.403,09
TP2: $1.445,48
TP3: $1.509,95
✅ Click here to trade: 👇 #FedWatch
{future}(SNDKUSDT)
$SNDK Observing the current SNDK price at 1.365,59 with slight fluctuations, it suggests a consolidation phase rather than distribution. The percentage of accounts holding long positions is as high as 97%, reflecting smart money patiently holding instead of selling. However, the KDJ indicator on the hourly timeframe has entered the overbought zone, and the daily MACD, while positive, is still weak, suggesting that the upward momentum hasn't truly broken through. Combined with neutral macroeconomic news and the absence of significant net capital inflows recently, I believe smart money is quietly accumulating at this price level rather than beginning distribution.
🚀 Accumulating Base Waiting for Breakout
Approximately 71% of traders
If the price holds above 1360.00 and long positions remain above 95%, selling pressure will be completely absorbed, and smart money is compressing the spring, waiting for a breakout above 1403.00
Trade Setup: Long - SNDK 📈
Entry: $1.365,59
SL: $1.329,38
TP1: $1.403,09
TP2: $1.445,48
TP3: $1.509,95
✅ Click here to trade: 👇 #FedWatch
383
·
--
Bearish
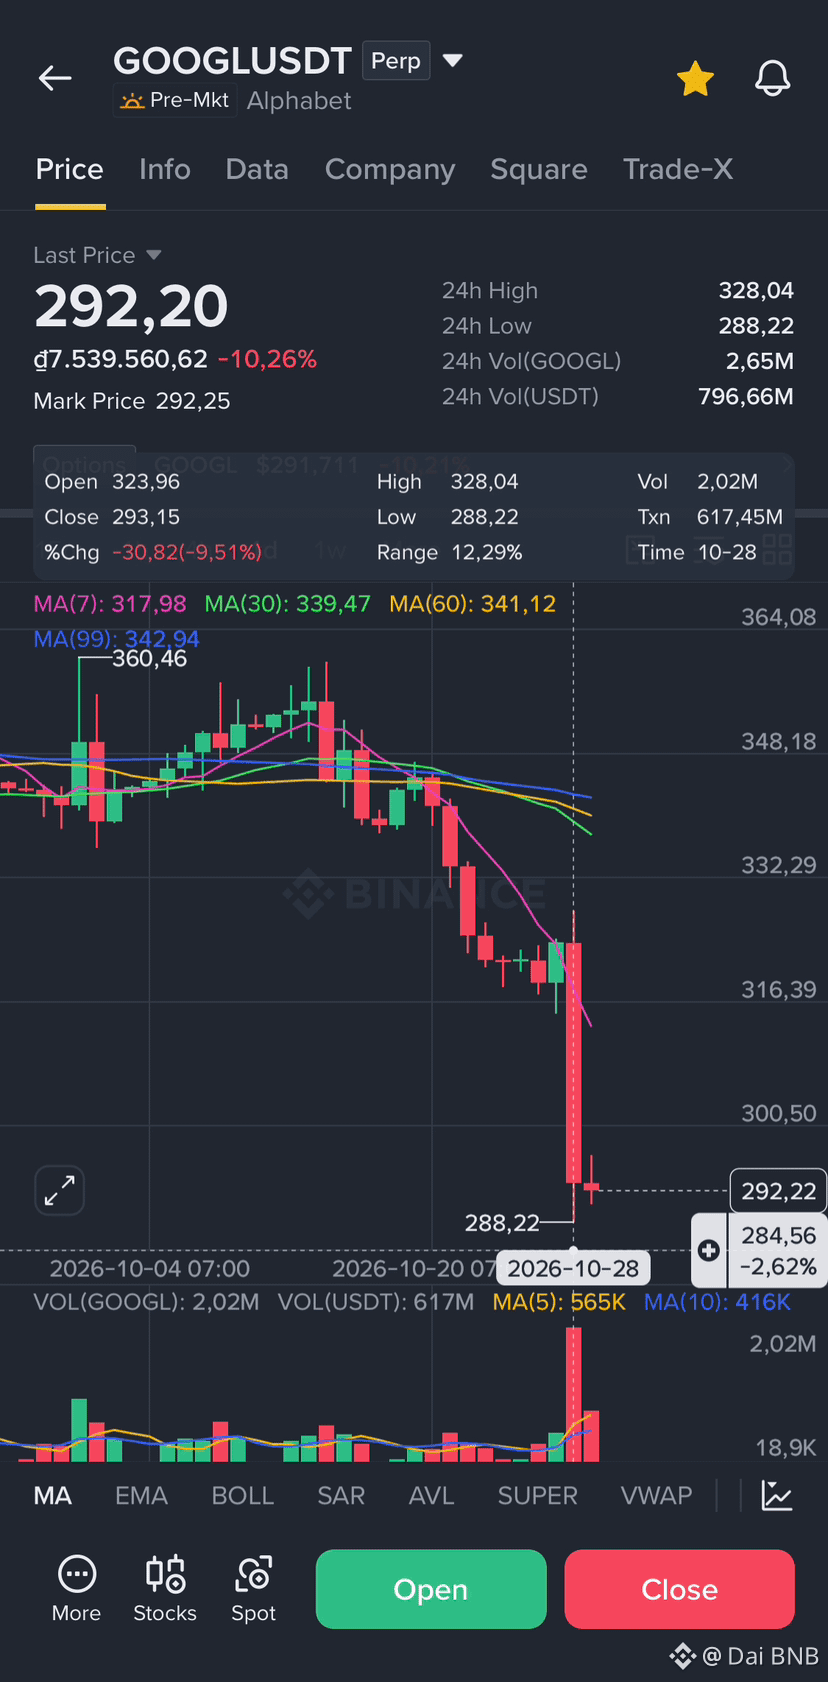
$GOOGL guy’s This is definitely not Memecoin, this is GOOGL stock. Dai BNB
{future}(GOOGLUSDT)
$GOOGL guy’s This is definitely not Memecoin, this is GOOGL stock. Dai BNB
452
·
--
Bearish
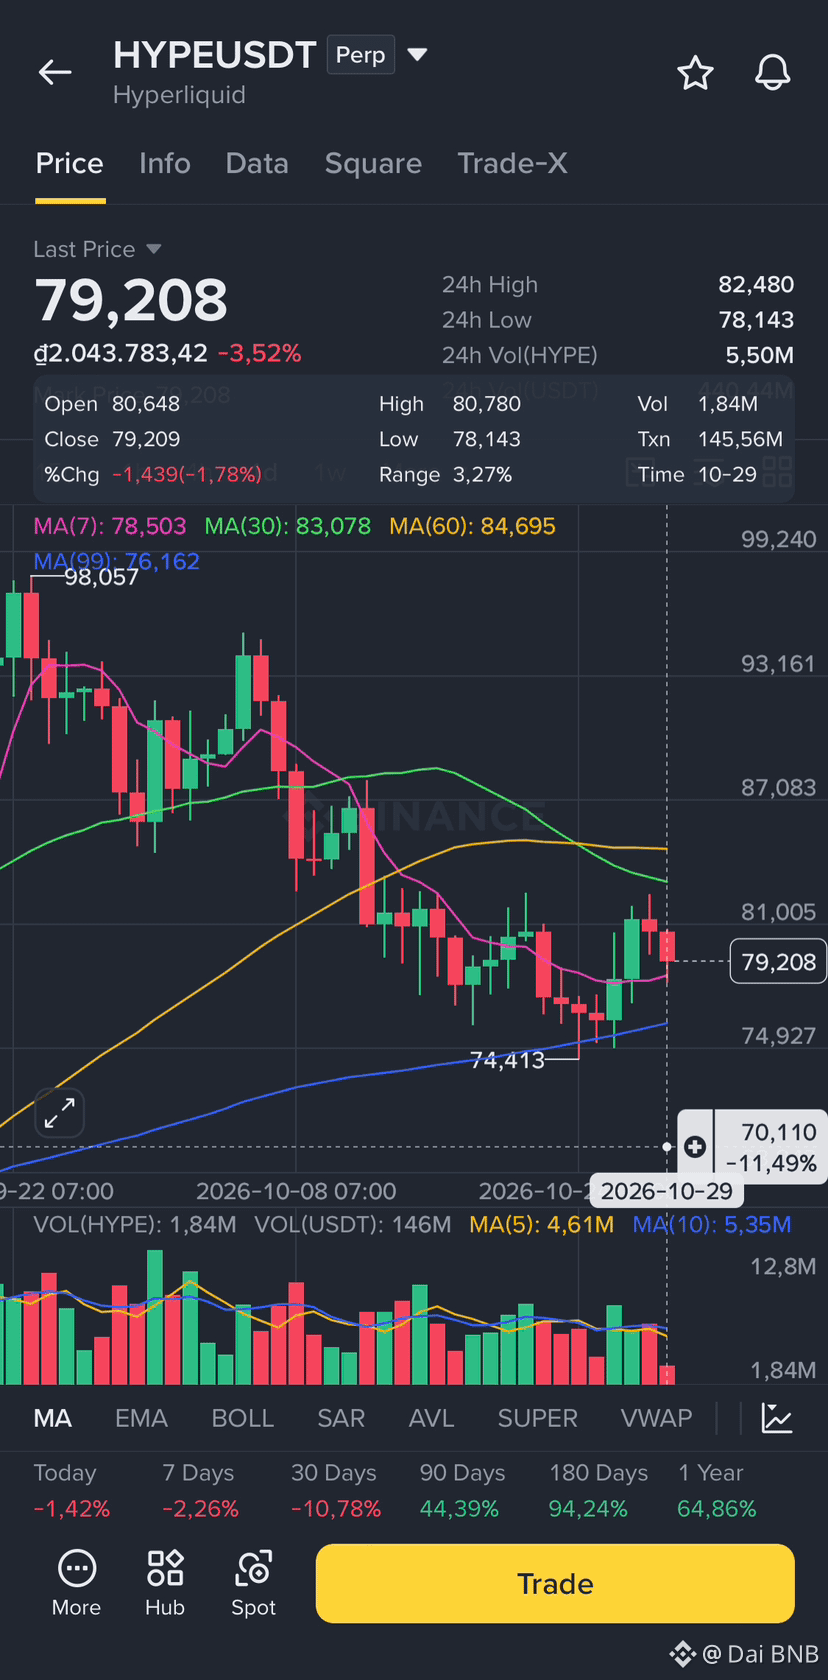
$HYPE 🔥 Whale selling pressure: Whales are transferring $53 million worth of HYPE to exchanges, along with the development team preparing to unlock tokens, creating a potential sell-off risk.
⚡️ Net outflow: Negative net inflow for the past 7 days indicates that large investors are cautiously exiting their positions.
🚀 Overconfident crowd: The 78% long position on the exchange makes it easy for buyers to wipe out liquidity.
Trade Setup: Short - HYPE 📉
Entry: $79,358
SL: $81,025
TP1: $77,068
TP2: $74,915
TP3: $70,172
✅ Click here to trade: 👇
{future}(HYPEUSDT)
$HYPE 🔥 Whale selling pressure: Whales are transferring $53 million worth of HYPE to exchanges, along with the development team preparing to unlock tokens, creating a potential sell-off risk.
⚡️ Net outflow: Negative net inflow for the past 7 days indicates that large investors are cautiously exiting their positions.
🚀 Overconfident crowd: The 78% long position on the exchange makes it easy for buyers to wipe out liquidity.
Trade Setup: Short - HYPE 📉
Entry: $79,358
SL: $81,025
TP1: $77,068
TP2: $74,915
TP3: $70,172
✅ Click here to trade: 👇
63
·
--
Bullish
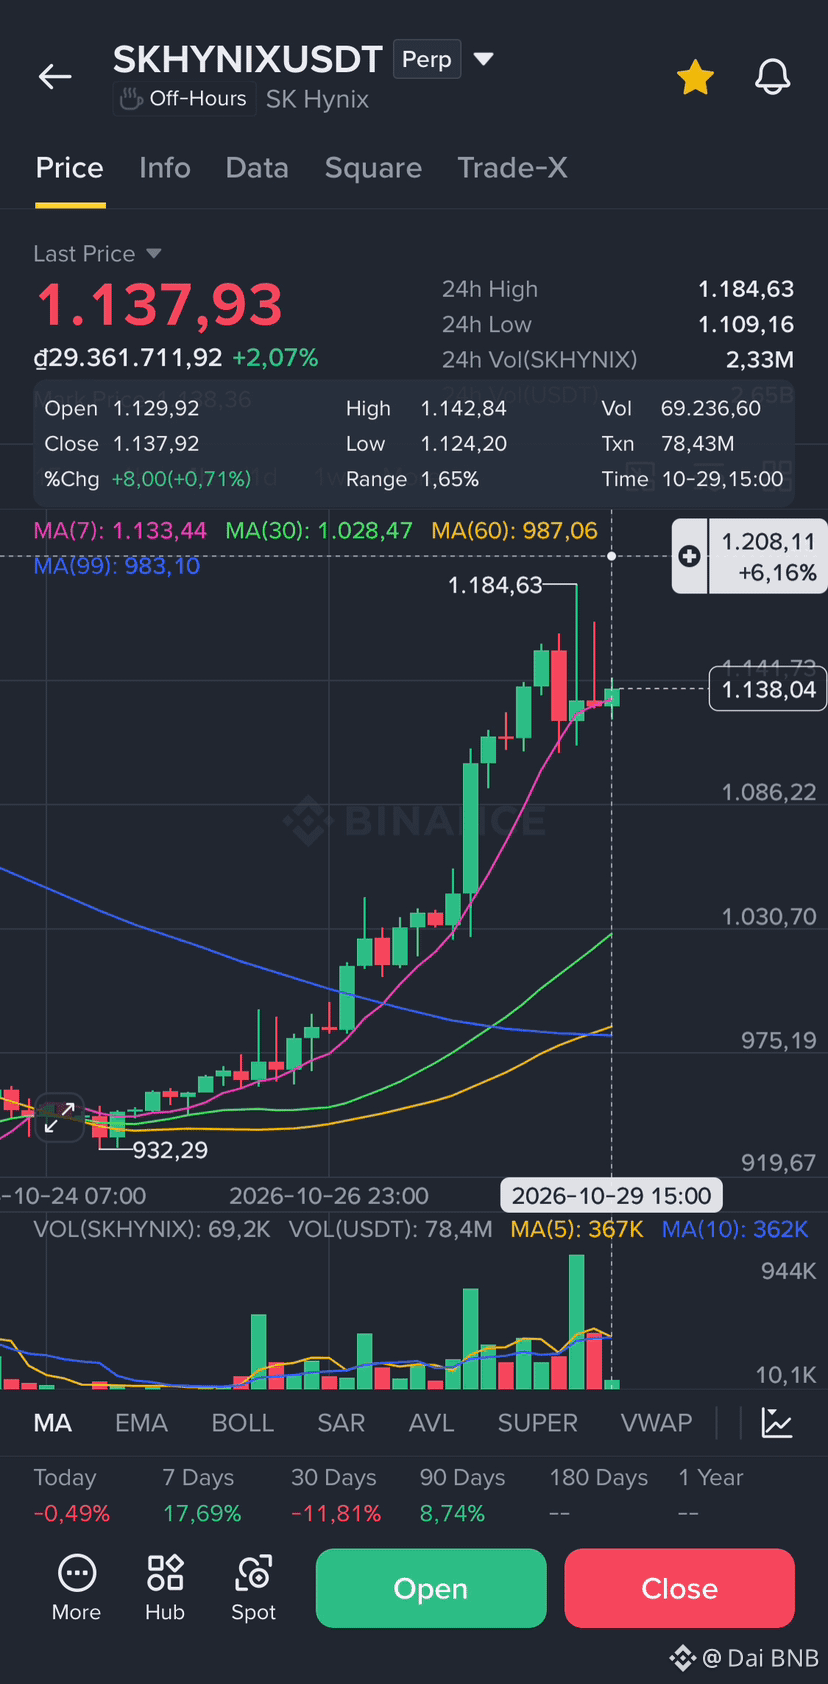
$SKHYNIX 📈 Breaking Through Resistance and Breaking the Peak
Approximately 67% of traders
If the SKHYNIX price at 1.135,52 holds above 1140 and active buying dominates, the FOMO sentiment from the Q3 earnings increase of 632% will trigger a new upward momentum targeting the 1165 resistance level.
Trade Setup: Long - SKHYNIX
Entry: $1.135,52
SL: $1.108,12
TP1: $1.165,05
TP2: $1.208,95
TP3: $1.254,09
✅ Click here to trade: 👇 #FedWatch
{future}(SKHYNIXUSDT)
$SKHYNIX 📈 Breaking Through Resistance and Breaking the Peak
Approximately 67% of traders
If the SKHYNIX price at 1.135,52 holds above 1140 and active buying dominates, the FOMO sentiment from the Q3 earnings increase of 632% will trigger a new upward momentum targeting the 1165 resistance level.
Trade Setup: Long - SKHYNIX
Entry: $1.135,52
SL: $1.108,12
TP1: $1.165,05
TP2: $1.208,95
TP3: $1.254,09
✅ Click here to trade: 👇 #FedWatch
229
·
--
Bearish
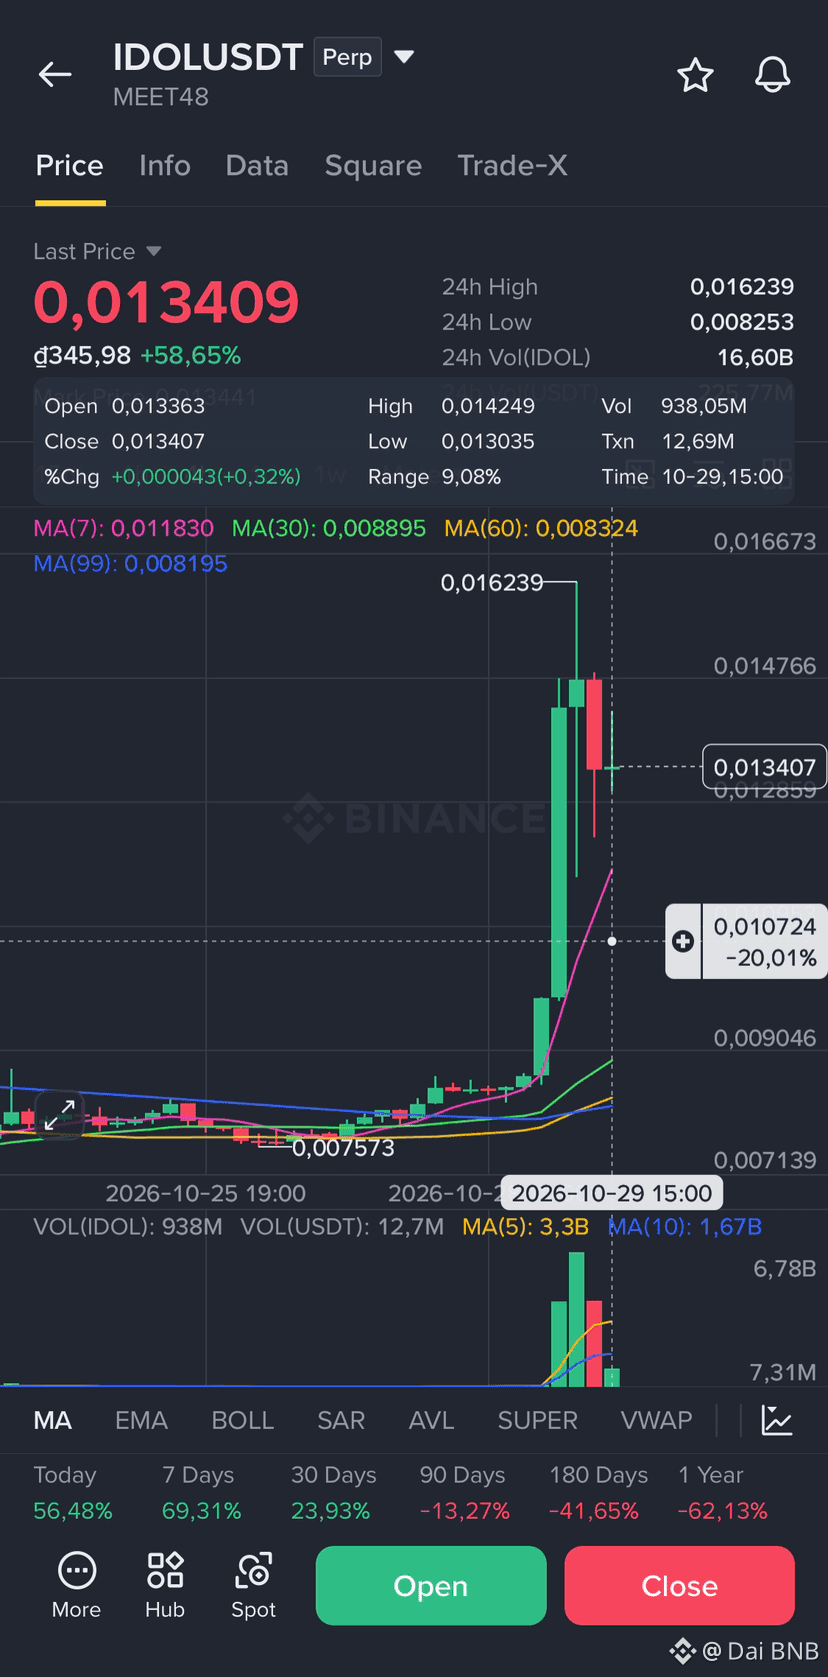
$IDOL The 4-hour timeframe chart is showing signs of trending downwards, touching the MA7 in the current chart.
Trade Setup: Short - IDOL
Entry: $0.013695
SL: $0.014315
TP1: $0.012345
TP2: $0.011565
TP3: $0.010732
✅ Click here to trade: 👇 #CanGoogleDefindItsCore
{future}(IDOLUSDT)
$IDOL The 4-hour timeframe chart is showing signs of trending downwards, touching the MA7 in the current chart.
Trade Setup: Short - IDOL
Entry: $0.013695
SL: $0.014315
TP1: $0.012345
TP2: $0.011565
TP3: $0.010732
✅ Click here to trade: 👇 #CanGoogleDefindItsCore
Trade Setup: Short - IDOL
Entry: $0.013695
SL: $0.014315
TP1: $0.012345
TP2: $0.011565
TP3: $0.010732
✅ Click here to trade: 👇 #CanGoogleDefindItsCore
109
·
--
Bearish
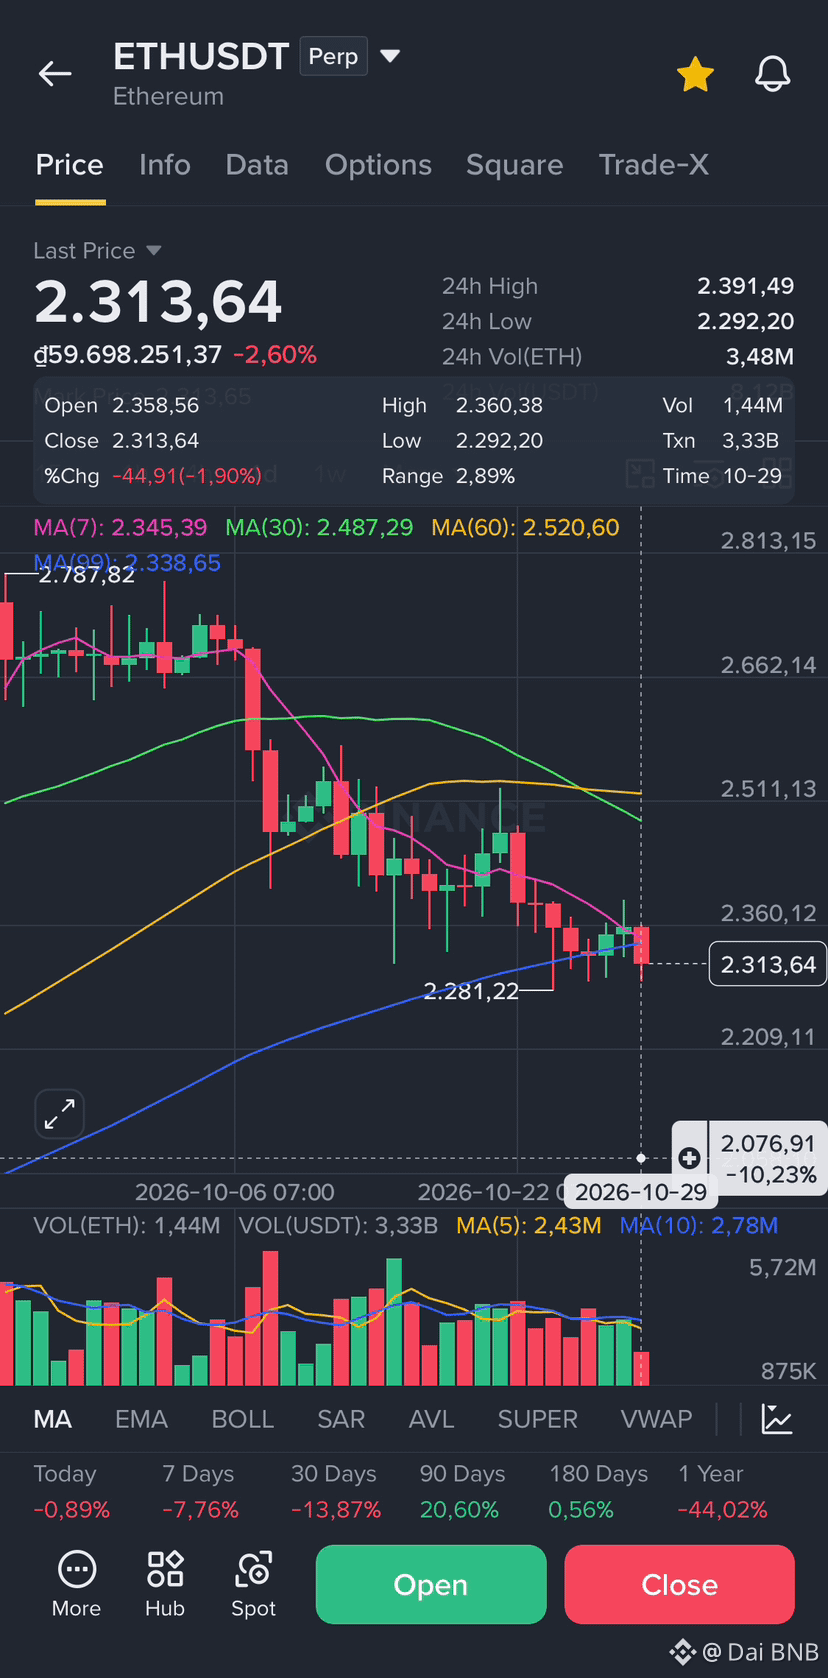
$ETH Reasons for Shorting ETH
ETF Inflows: ETH ETFs recorded continuous net outflows of over $12 billion in October, putting selling pressure on coincentral.
4-Hour Technical Analysis: Price is below the EMA20 (2340.33 USDT) and the MACD shows negative divergence, confirming a short-term downtrend.
Macroeconomic Sentiment: The Fed keeping interest rates unchanged, coupled with inflation warnings, is hindering the recovery of risky assets like ETH.
Core Conclusion: A bearish structure is forming on the 4-hour timeframe, but further RSI confirmation is needed to avoid a price trap. ⚡️ Support: 2293.00 USDT → Previous 4-hour low, dense accumulation zone.
Resistance: 2340.33 USDT → Coincides with the EMA20 on the 4-hour timeframe, where sellers dominate.
🔥The 4-hour timeframe only needs to look at two points:
💡 RSI determines the direction
RSI < 40
Confirms a decline
Loss of the
2340.33 mark
RSI < 40 + price loss of 2293.00 USDT → Short position is favorable.
Trade Setup: Short - ETH
Entry: $2.315,58 - $2.293,00
SL: $2.350,28
TP1: $2.255,35
TP2: $2.180,15
TP3: $2.076,32
✅ Click here to trade: 👇 #CanMicrosoftDeliverOnAI
{future}(ETHUSDT)
$ETH Reasons for Shorting ETH
ETF Inflows: ETH ETFs recorded continuous net outflows of over $12 billion in October, putting selling pressure on coincentral.
4-Hour Technical Analysis: Price is below the EMA20 (2340.33 USDT) and the MACD shows negative divergence, confirming a short-term downtrend.
Macroeconomic Sentiment: The Fed keeping interest rates unchanged, coupled with inflation warnings, is hindering the recovery of risky assets like ETH.
Core Conclusion: A bearish structure is forming on the 4-hour timeframe, but further RSI confirmation is needed to avoid a price trap. ⚡️ Support: 2293.00 USDT → Previous 4-hour low, dense accumulation zone.
Resistance: 2340.33 USDT → Coincides with the EMA20 on the 4-hour timeframe, where sellers dominate.
🔥The 4-hour timeframe only needs to look at two points:
💡 RSI determines the direction
RSI < 40
Confirms a decline
Loss of the
2340.33 mark
RSI < 40 + price loss of 2293.00 USDT → Short position is favorable.
Trade Setup: Short - ETH
Entry: $2.315,58 - $2.293,00
SL: $2.350,28
TP1: $2.255,35
TP2: $2.180,15
TP3: $2.076,32
✅ Click here to trade: 👇 #CanMicrosoftDeliverOnAI
1
14
·
--
Bullish
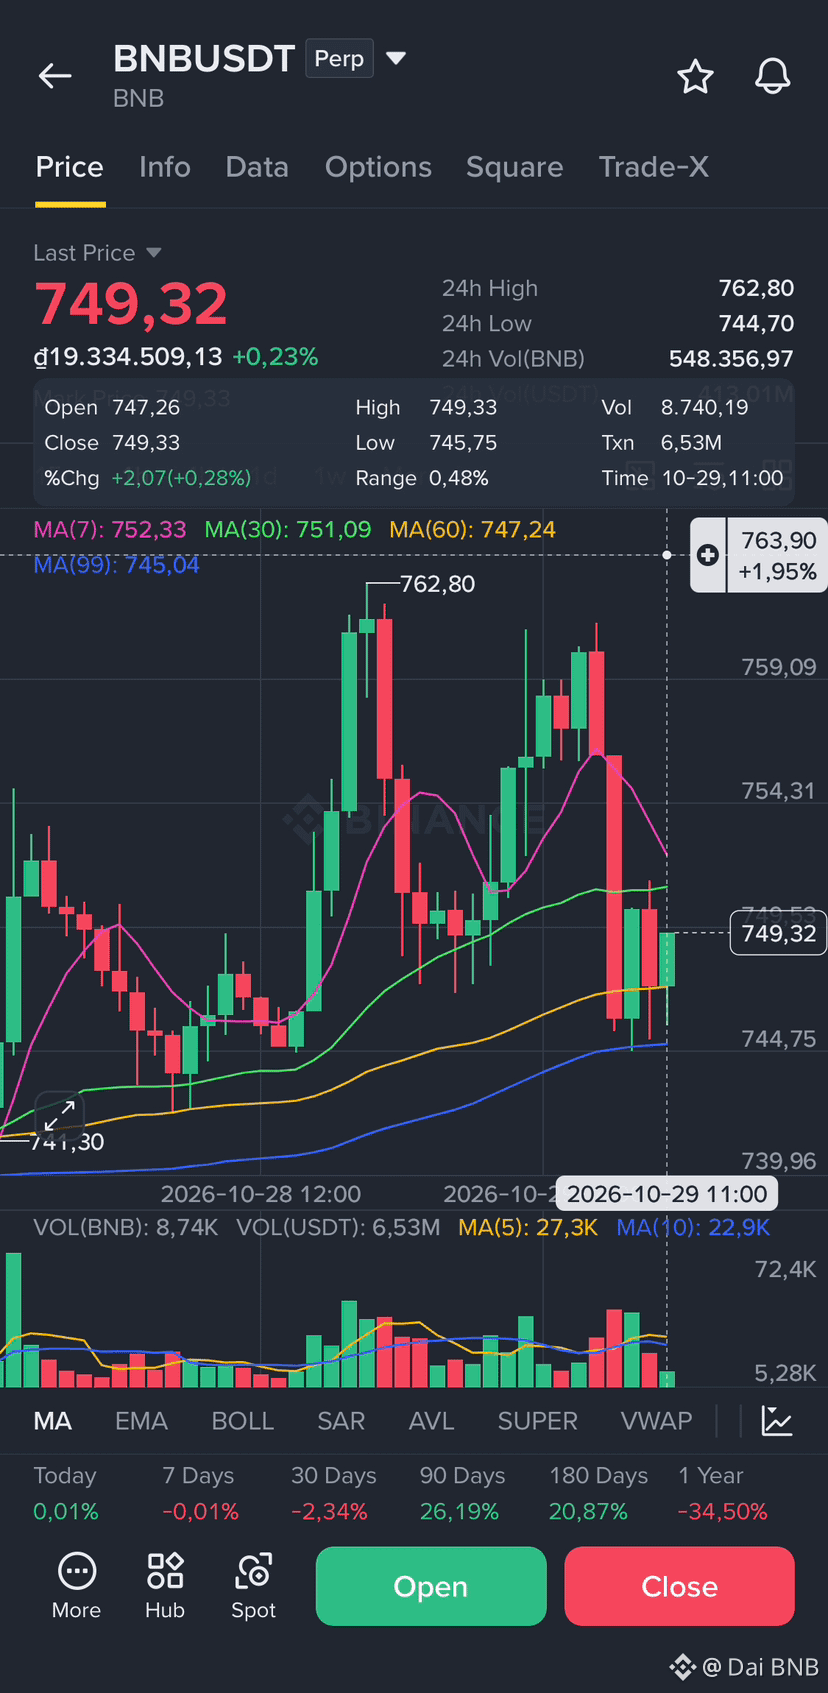
$BNB Technical Analysis (Positive 📈)
Daily MACD turns positive: The daily MACD crosses above the signal line, reinforcing the short-term recovery trend; the daily DIF approaches 0, signaling weakening selling pressure.
Positive funding fee: The BNB USDT funding rate is approximately 0.0083%, reflecting lower fees paid by contract buyers, indicating bullish market sentiment.
High long/short ratio: The long/short position ratio on the exchange is approximately 2.29-2.44 times, with elite accounts maintaining a long/short ratio of nearly 2.5 times, showing that professional traders maintain an optimistic stance. ⚡ Action
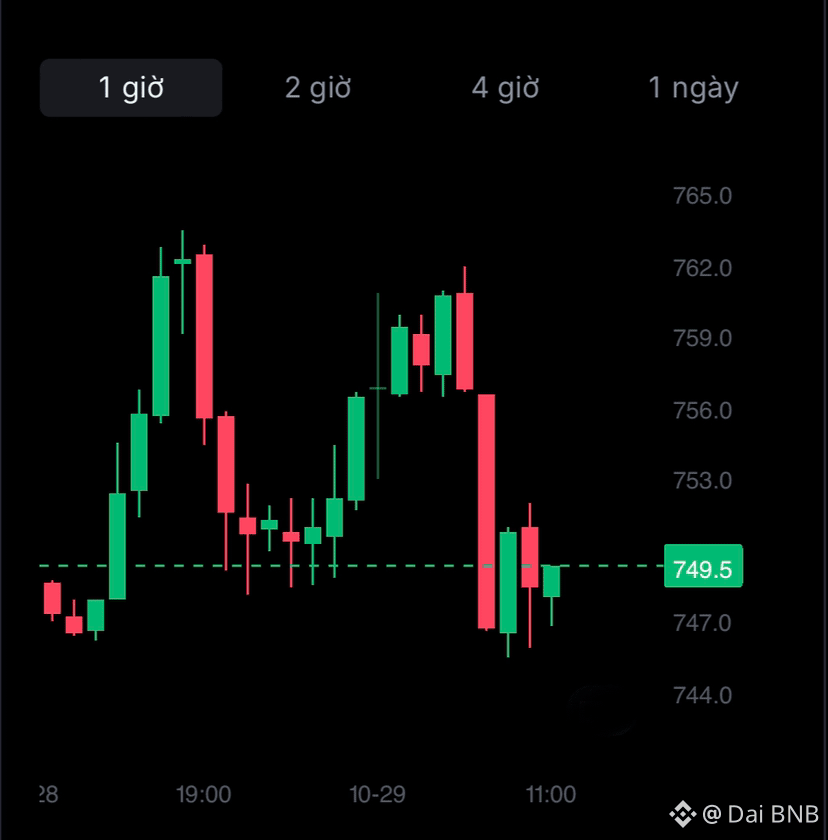
Action Plan: The probability of a short-term price increase for BNB is approximately 60% compared to a 40% decrease, meaning a 60/40 ratio favoring buyers thanks to the improved daily MACD, positive funding fee, and the positive RWA-AI ecosystem. However, unstable net cash flow and resistance at 760-764 near the price point mean the upward movement may be volatile; if the price holds above 742 (below the Bollinger Bands), the possibility of heading towards 760-780 is strengthened, conversely, a loss below 742 could lead to 730-720. The price is expected to consolidate around 740-760 before a clear direction is determined. 🔥 Bullish Scenario: Jenner testnet and Nasdaq news fuel expectations for RWA, while the daily MACD turning positive and positive funding confirm buying sentiment. Net inflow on October 27th reached over 5.6 million USDT and the long/short ratio for elite accounts is nearly 2.5 times, indicating that professional traders are leaning towards a price increase. If the price surpasses 760 accompanied by increased active buying volume, BNB could advance to 780.
Short-term Buy 📈
Entry Point: 746-750 USDT, allocate 30% of planned position
Stop Loss: 732 USDT
Take Profit: 778 USDT
#bnb
{future}(BNBUSDT)
$BNB Technical Analysis (Positive 📈)
Daily MACD turns positive: The daily MACD crosses above the signal line, reinforcing the short-term recovery trend; the daily DIF approaches 0, signaling weakening selling pressure.
Positive funding fee: The BNB USDT funding rate is approximately 0.0083%, reflecting lower fees paid by contract buyers, indicating bullish market sentiment.
High long/short ratio: The long/short position ratio on the exchange is approximately 2.29-2.44 times, with elite accounts maintaining a long/short ratio of nearly 2.5 times, showing that professional traders maintain an optimistic stance. ⚡ Action
Action Plan: The probability of a short-term price increase for BNB is approximately 60% compared to a 40% decrease, meaning a 60/40 ratio favoring buyers thanks to the improved daily MACD, positive funding fee, and the positive RWA-AI ecosystem. However, unstable net cash flow and resistance at 760-764 near the price point mean the upward movement may be volatile; if the price holds above 742 (below the Bollinger Bands), the possibility of heading towards 760-780 is strengthened, conversely, a loss below 742 could lead to 730-720. The price is expected to consolidate around 740-760 before a clear direction is determined. 🔥 Bullish Scenario: Jenner testnet and Nasdaq news fuel expectations for RWA, while the daily MACD turning positive and positive funding confirm buying sentiment. Net inflow on October 27th reached over 5.6 million USDT and the long/short ratio for elite accounts is nearly 2.5 times, indicating that professional traders are leaning towards a price increase. If the price surpasses 760 accompanied by increased active buying volume, BNB could advance to 780.
Short-term Buy 📈
Entry Point: 746-750 USDT, allocate 30% of planned position
Stop Loss: 732 USDT
Take Profit: 778 USDT
#bnb
8
·
--
Bearish
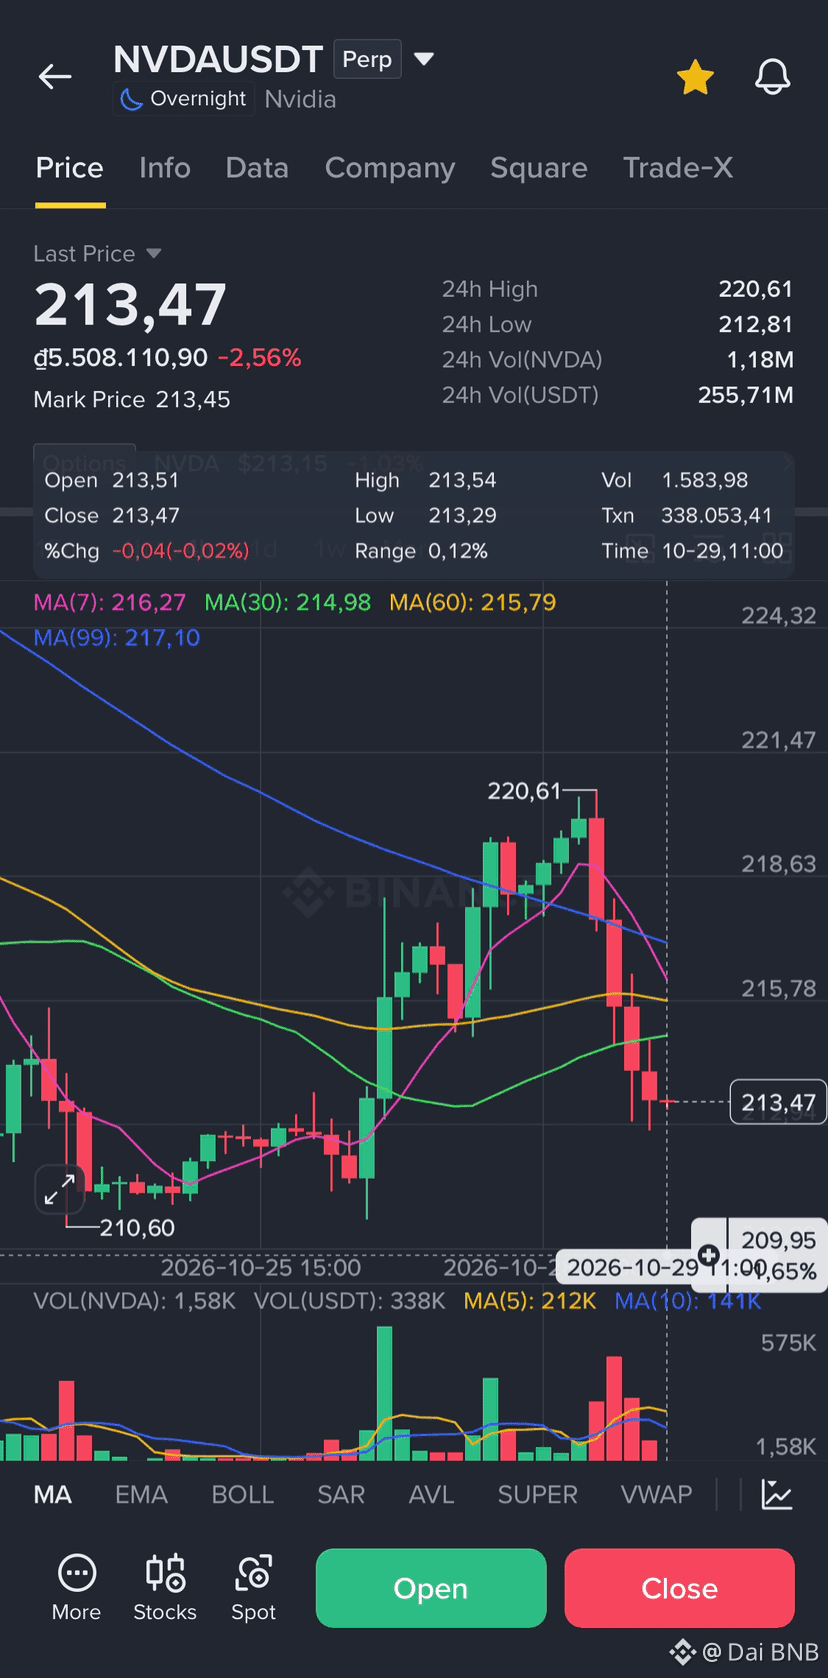
$NVDA Imbalanced Position Structure: The Long/Short ratio on the exchange reached 2.94 with 74% of traders betting on a price increase, indicating that the crowd is buying the dip too early without clear confirmation of a reversal. With funding fees at 0.00%, the market lacks the momentum to push prices up, instead facing the risk of leverage liquidation if the price breaks through the psychological support level. The concentration of Long positions at the current price makes it an attractive 'liquidity zone' for sellers to exploit before establishing a new trend.
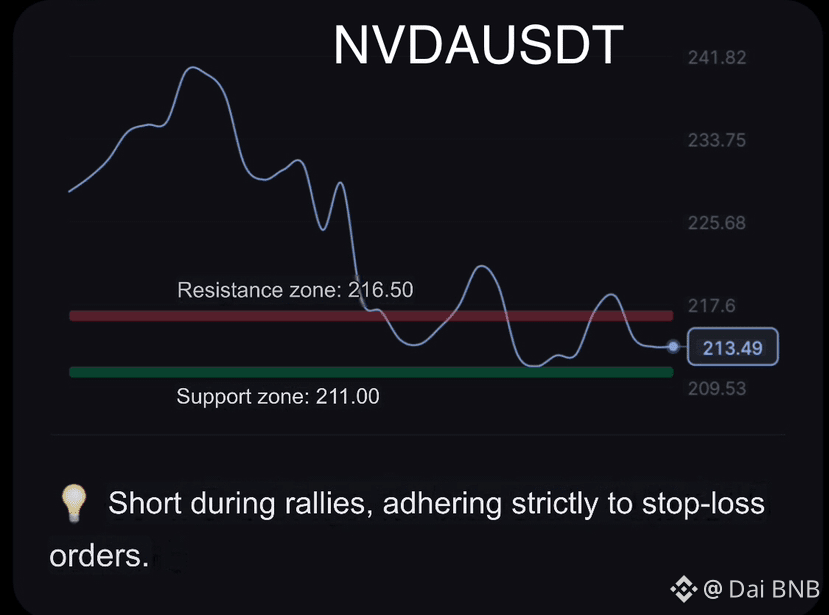
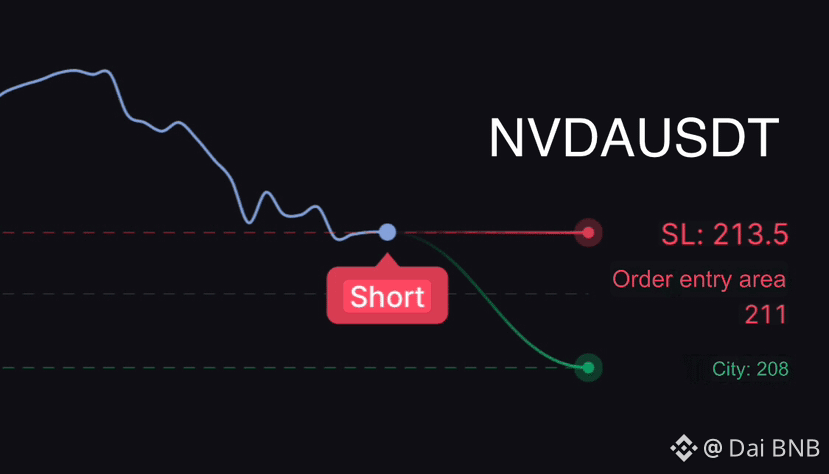
Cash Flow Confirms Downtrend: The latest active trading data shows the Buy/Sell ratio is only 0.27 during peak hours, confirming that sellers are completely dominating active buyers. Although the current price of 213.53 USDT is still above the weekly EMA200, the absence of significant buying pressure means that any technical rebound is an opportunity for distribution. Traders need to closely monitor the support zone at 211.00 USDT. If this level is breached, the short-term downtrend will be firmly confirmed. 🔥Trading direction: Open a Short NVIDIAUSDT order at the resistance zone of 215.50 – 216.50 USDT; absolutely do not attempt to buy the dip until a confirmation candle at 211.00 USDT is seen.
Key observation: Closely monitor the active Buy/Sell ratio and trading volume at the support level. If buying pressure does not improve, continue to hold the Short position.
#FedWatch
{future}(NVDAUSDT)
$NVDA Imbalanced Position Structure: The Long/Short ratio on the exchange reached 2.94 with 74% of traders betting on a price increase, indicating that the crowd is buying the dip too early without clear confirmation of a reversal. With funding fees at 0.00%, the market lacks the momentum to push prices up, instead facing the risk of leverage liquidation if the price breaks through the psychological support level. The concentration of Long positions at the current price makes it an attractive 'liquidity zone' for sellers to exploit before establishing a new trend.
Cash Flow Confirms Downtrend: The latest active trading data shows the Buy/Sell ratio is only 0.27 during peak hours, confirming that sellers are completely dominating active buyers. Although the current price of 213.53 USDT is still above the weekly EMA200, the absence of significant buying pressure means that any technical rebound is an opportunity for distribution. Traders need to closely monitor the support zone at 211.00 USDT. If this level is breached, the short-term downtrend will be firmly confirmed. 🔥Trading direction: Open a Short NVIDIAUSDT order at the resistance zone of 215.50 – 216.50 USDT; absolutely do not attempt to buy the dip until a confirmation candle at 211.00 USDT is seen.
Key observation: Closely monitor the active Buy/Sell ratio and trading volume at the support level. If buying pressure does not improve, continue to hold the Short position.
#FedWatch
124
·
--
Bearish
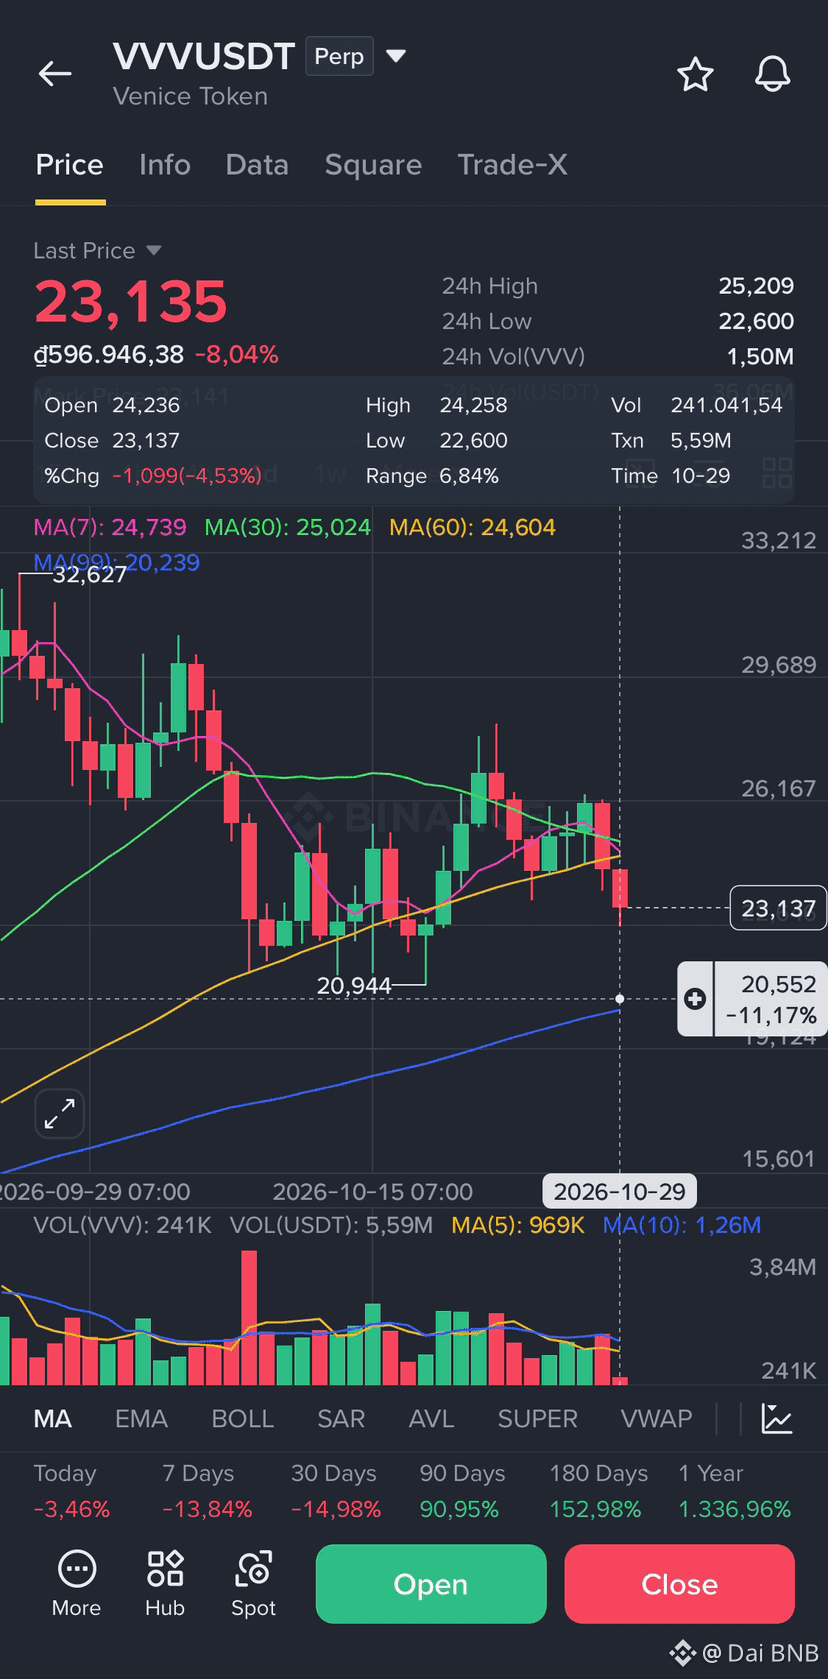
$VVV Currently at 23,179, VVV is in a short-term downtrend, remaining below key moving averages. The KDJ indicator on smaller timeframes is showing oversold signals, but a reversal hasn't been confirmed yet. Regarding cash flow, the ratio of long/short contracts in elite accounts has increased unusually high to over 3 times while the price continues to fall, suggesting a risk of liquidation of long positions if the selling continues. News indicates VVV is under pressure from the cooling down of the AI segment and profit-taking by whales, despite no fundamental negative news from the project. Therefore, the current trading strategy should lean towards defensive or short-selling rather than risky bottom-fishing.
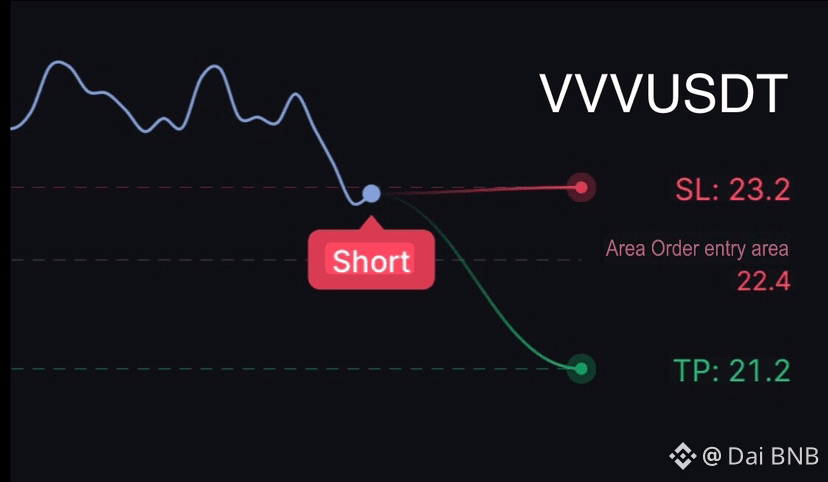
⚡️Key Action: VVV is in a weak technical rebound from the oversold region. The probability of further decline in the short term is higher than an increase, estimated at around 45/55. The divergent capital flow and overloaded elite long positions suggest that sellers still dominate as the price approaches resistance. The most likely scenario is a slight pullback to the resistance zone followed by a further retreat, making it more advisable to look for selling opportunities rather than chasing the price. The elite long/short ratio of 3.1–3.14 increases the risk of liquidation if the price loses the nearby support zone. If 22.9 is not held, selling pressure could increase rapidly.
📉 Loss of support leads to liquidation
Approximately 67% of traders
Once 22.50 is broken, selling pressure from smart money taking profits combined with cooling sentiment will trigger liquidation of long positions, pushing the price down further to the old accumulation zone.
#vvv
{future}(VVVUSDT)
$VVV Currently at 23,179, VVV is in a short-term downtrend, remaining below key moving averages. The KDJ indicator on smaller timeframes is showing oversold signals, but a reversal hasn't been confirmed yet. Regarding cash flow, the ratio of long/short contracts in elite accounts has increased unusually high to over 3 times while the price continues to fall, suggesting a risk of liquidation of long positions if the selling continues. News indicates VVV is under pressure from the cooling down of the AI segment and profit-taking by whales, despite no fundamental negative news from the project. Therefore, the current trading strategy should lean towards defensive or short-selling rather than risky bottom-fishing.
⚡️Key Action: VVV is in a weak technical rebound from the oversold region. The probability of further decline in the short term is higher than an increase, estimated at around 45/55. The divergent capital flow and overloaded elite long positions suggest that sellers still dominate as the price approaches resistance. The most likely scenario is a slight pullback to the resistance zone followed by a further retreat, making it more advisable to look for selling opportunities rather than chasing the price. The elite long/short ratio of 3.1–3.14 increases the risk of liquidation if the price loses the nearby support zone. If 22.9 is not held, selling pressure could increase rapidly.
📉 Loss of support leads to liquidation
Approximately 67% of traders
Once 22.50 is broken, selling pressure from smart money taking profits combined with cooling sentiment will trigger liquidation of long positions, pushing the price down further to the old accumulation zone.
#vvv
128
·
--
Bearish
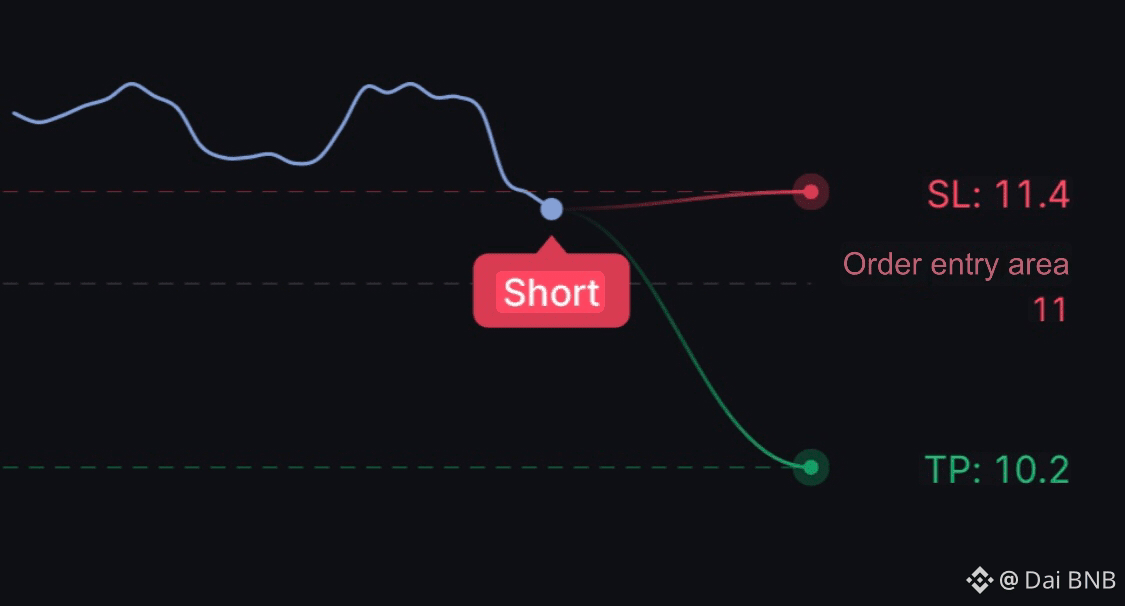
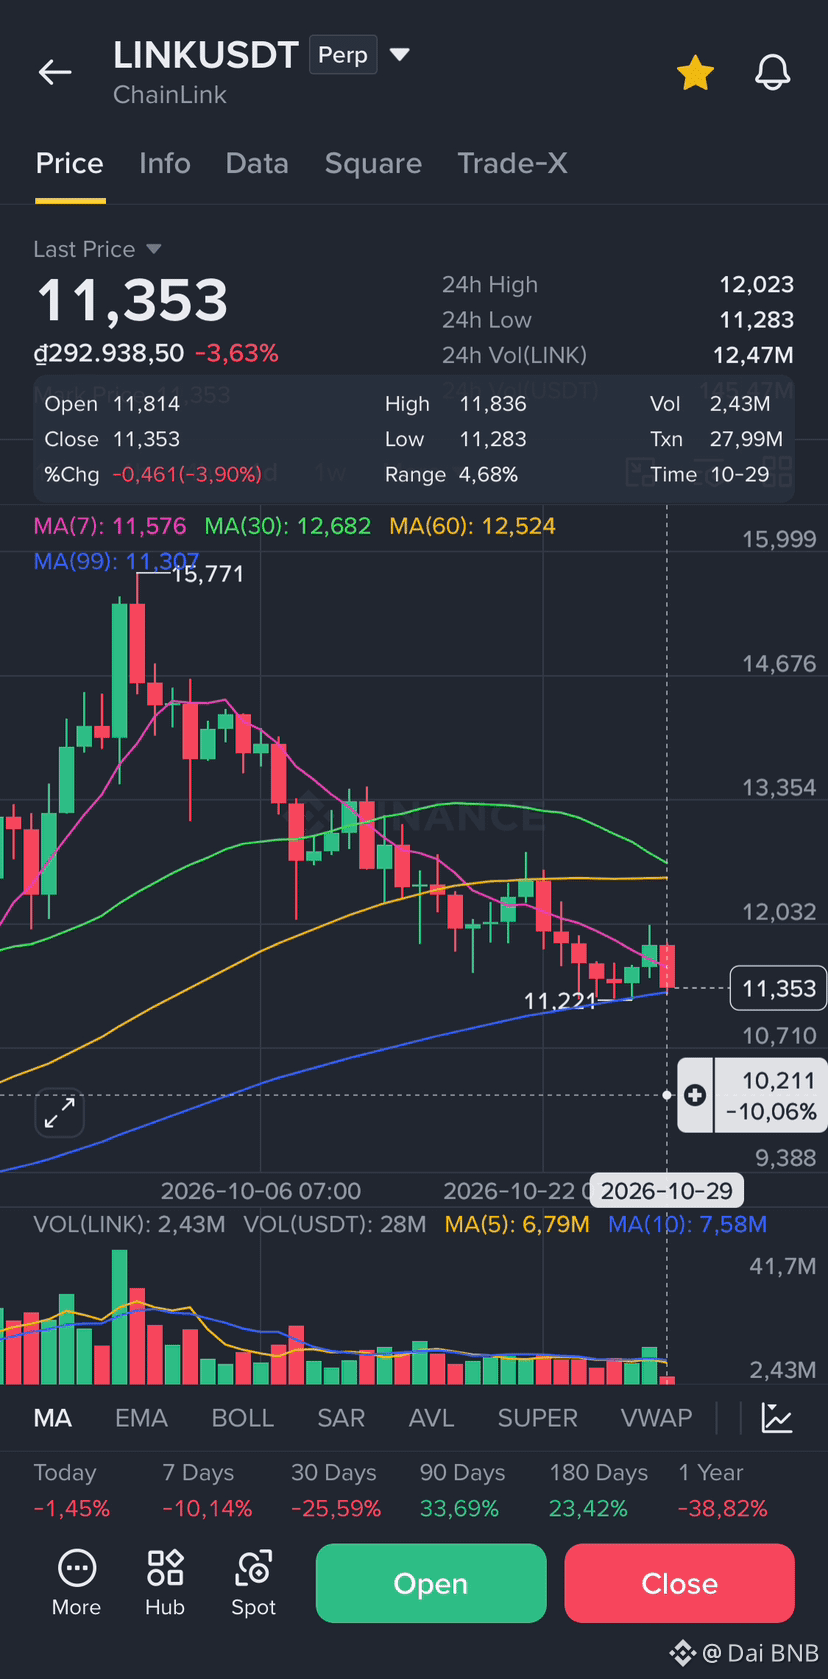
$LINK Short-Term Outlook: Just Two Points to Watch:
💡 Wait for Confirmation Signal
• Breakthrough Resistance
• Above 11.80
• Loss of Support
• Below 11.00 📉 Loss of Support Level
Approximately 21% of traders
Once the price breaks below 11.00 USDT, short-term profit-taking pressure combined with an excessively high Long position will create a chain liquidation effect, pulling the price back to test lower demand zones despite positive fundamental news.
#link
{future}(LINKUSDT)
$LINK Short-Term Outlook: Just Two Points to Watch:
💡 Wait for Confirmation Signal
• Breakthrough Resistance
• Above 11.80
• Loss of Support
• Below 11.00 📉 Loss of Support Level
Approximately 21% of traders
Once the price breaks below 11.00 USDT, short-term profit-taking pressure combined with an excessively high Long position will create a chain liquidation effect, pulling the price back to test lower demand zones despite positive fundamental news.
#link
87
·
--
Bearish
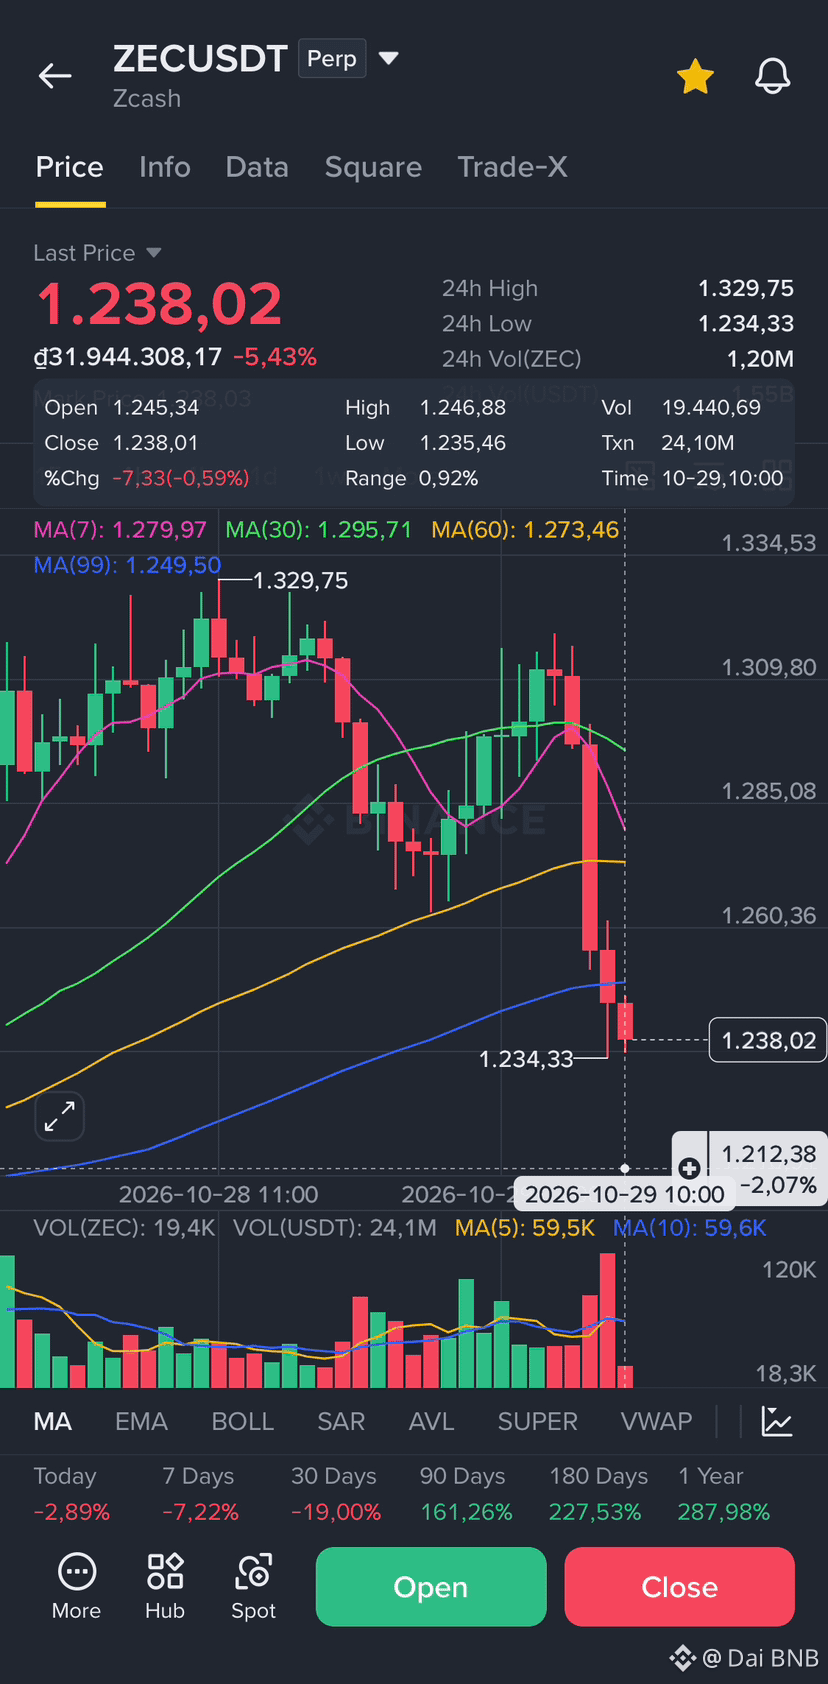
$ZEC Money Laundering Risk: The Bloom theft tool laundered nearly $1 million through 2,152 ZEC addresses, raising concerns about tightening regulations on security coins, a risk less likely to occur with ADA/USDT or XRP/USDT due to their transparency.
Technical Selling Pressure: The 1-hour KDJ indicator has fallen into oversold territory with a J value of -5 and a negative MACD divergence, warning that the short-term downtrend may continue before finding a new equilibrium.
High Leverage Volatility: Open interest (OI) has surged from $300 million to over $2 billion, accompanied by two-way liquidations, making the price more susceptible to manipulation and volatility compared to large-cap assets like $ETH/USDT.
Sell Scenario: If money laundering news spreads or $BTC/USDT loses the 78,000 USDT mark, ZEC could break through support. Increased active selling pressure and a significant positive shift in the funding rate would confirm a short-term downtrend.
Short-term sell 📉
Entry point: 1,285 USDT
Stop loss: 1,325 USDT
Take profit: 1,200 USDT
#EarningsSeason
{future}(ZECUSDT)
$ZEC Money Laundering Risk: The Bloom theft tool laundered nearly $1 million through 2,152 ZEC addresses, raising concerns about tightening regulations on security coins, a risk less likely to occur with ADA/USDT or XRP/USDT due to their transparency.
Technical Selling Pressure: The 1-hour KDJ indicator has fallen into oversold territory with a J value of -5 and a negative MACD divergence, warning that the short-term downtrend may continue before finding a new equilibrium.
High Leverage Volatility: Open interest (OI) has surged from $300 million to over $2 billion, accompanied by two-way liquidations, making the price more susceptible to manipulation and volatility compared to large-cap assets like $ETH/USDT.
Sell Scenario: If money laundering news spreads or $BTC/USDT loses the 78,000 USDT mark, ZEC could break through support. Increased active selling pressure and a significant positive shift in the funding rate would confirm a short-term downtrend.
Short-term sell 📉
Entry point: 1,285 USDT
Stop loss: 1,325 USDT
Take profit: 1,200 USDT
#EarningsSeason
138
·
--
Bearish
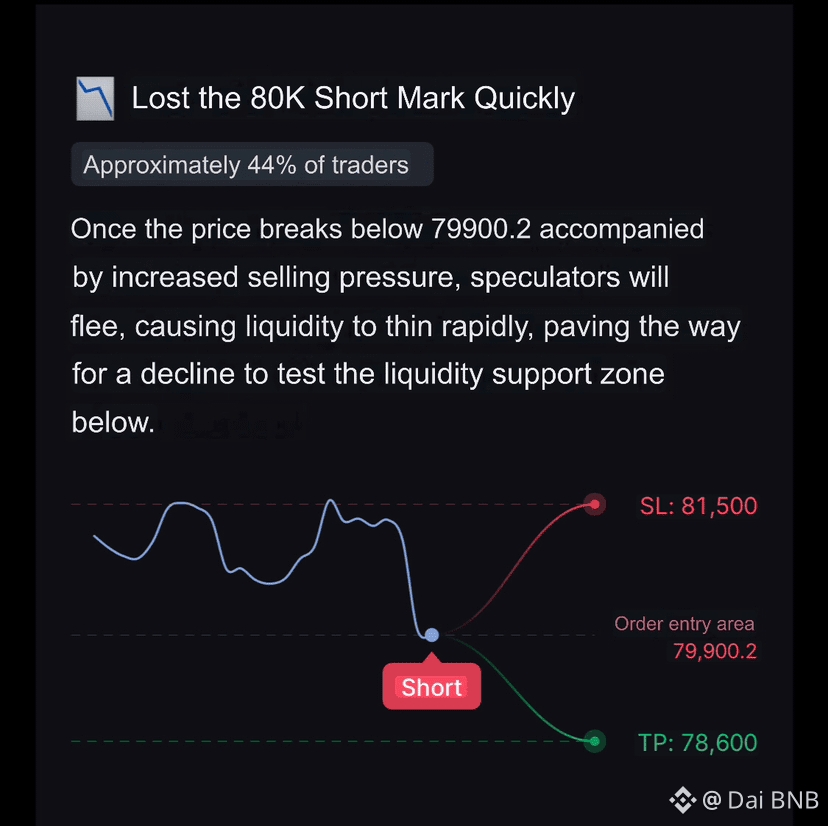
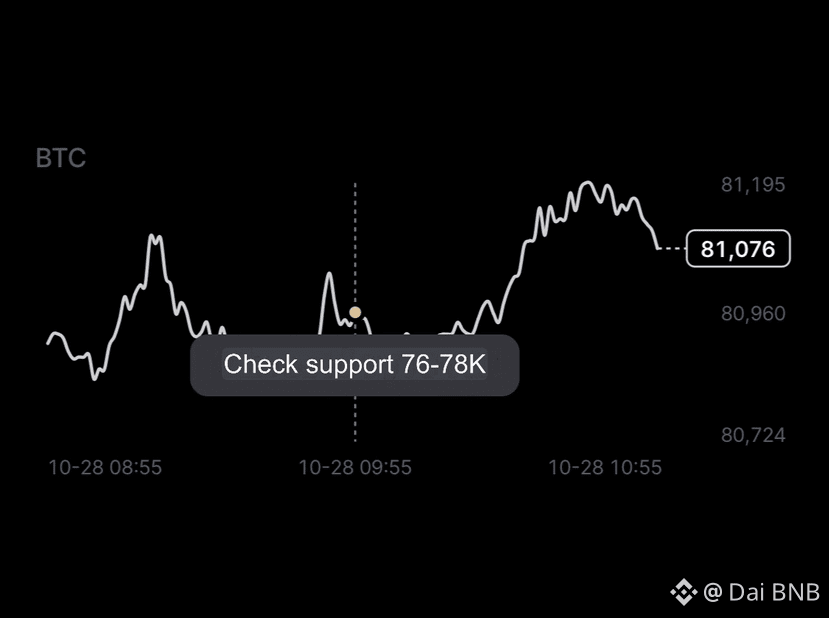
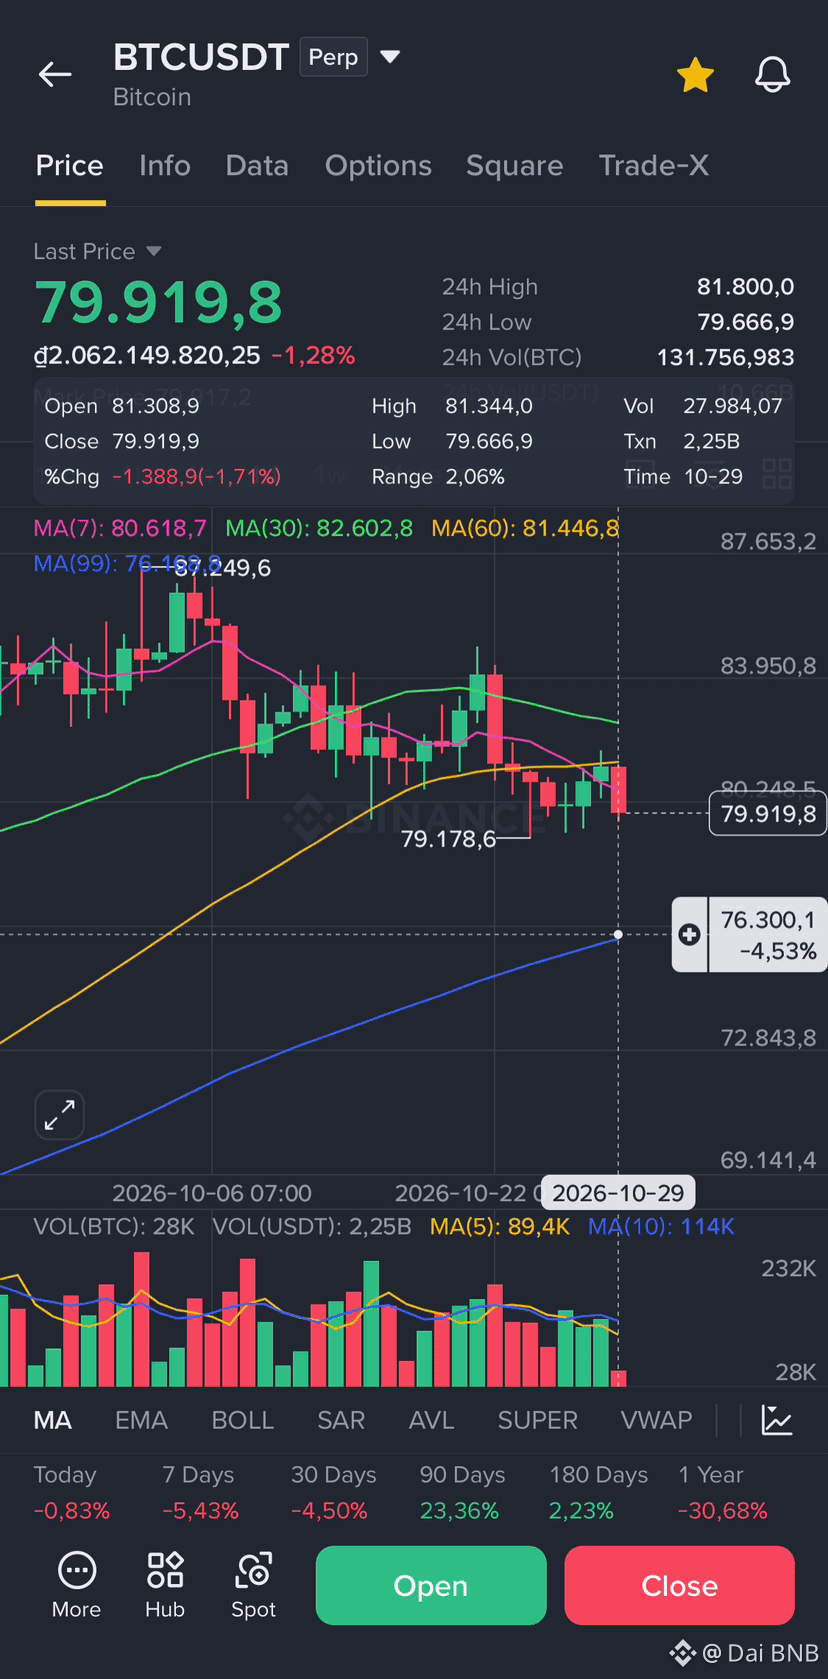
$BTC BTC faces Fed risk, the 76-78K range is key: There's a high probability the Fed will keep interest rates unchanged, but signals for December lean towards an increase, making short-term downward pressure on BTC evident. If sellers prevail, the price could retest the 76,000-78,000 USD support zone. Currently, it's advisable to wait for a price reaction in this area rather than attempting to buy the dip prematurely.
#BTC走势分析
{future}(BTCUSDT)
$BTC BTC faces Fed risk, the 76-78K range is key: There's a high probability the Fed will keep interest rates unchanged, but signals for December lean towards an increase, making short-term downward pressure on BTC evident. If sellers prevail, the price could retest the 76,000-78,000 USD support zone. Currently, it's advisable to wait for a price reaction in this area rather than attempting to buy the dip prematurely.
#BTC走势分析
#BTC走势分析
106
·
--
Bearish
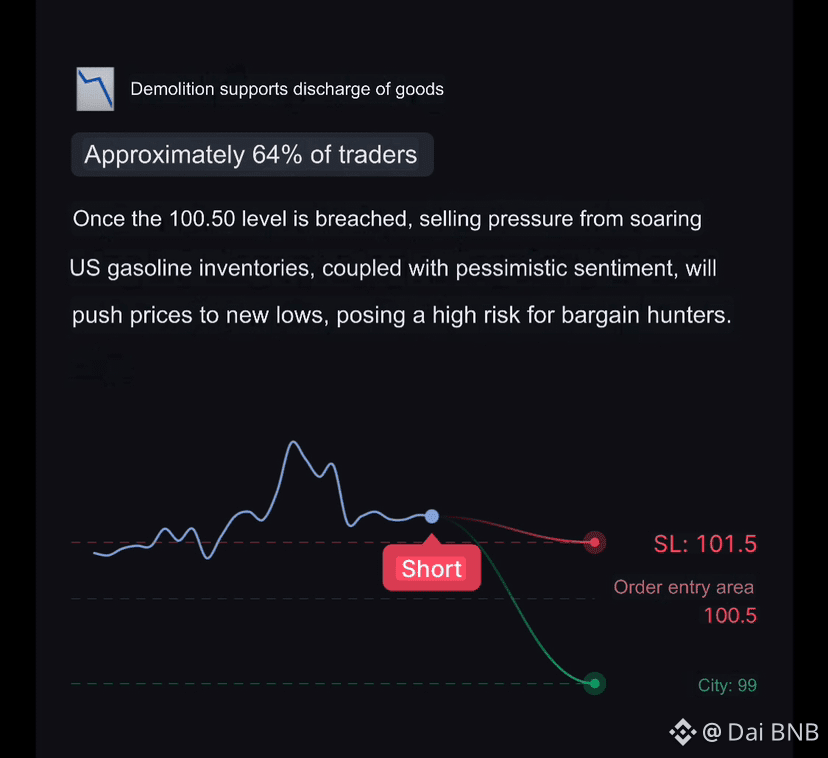
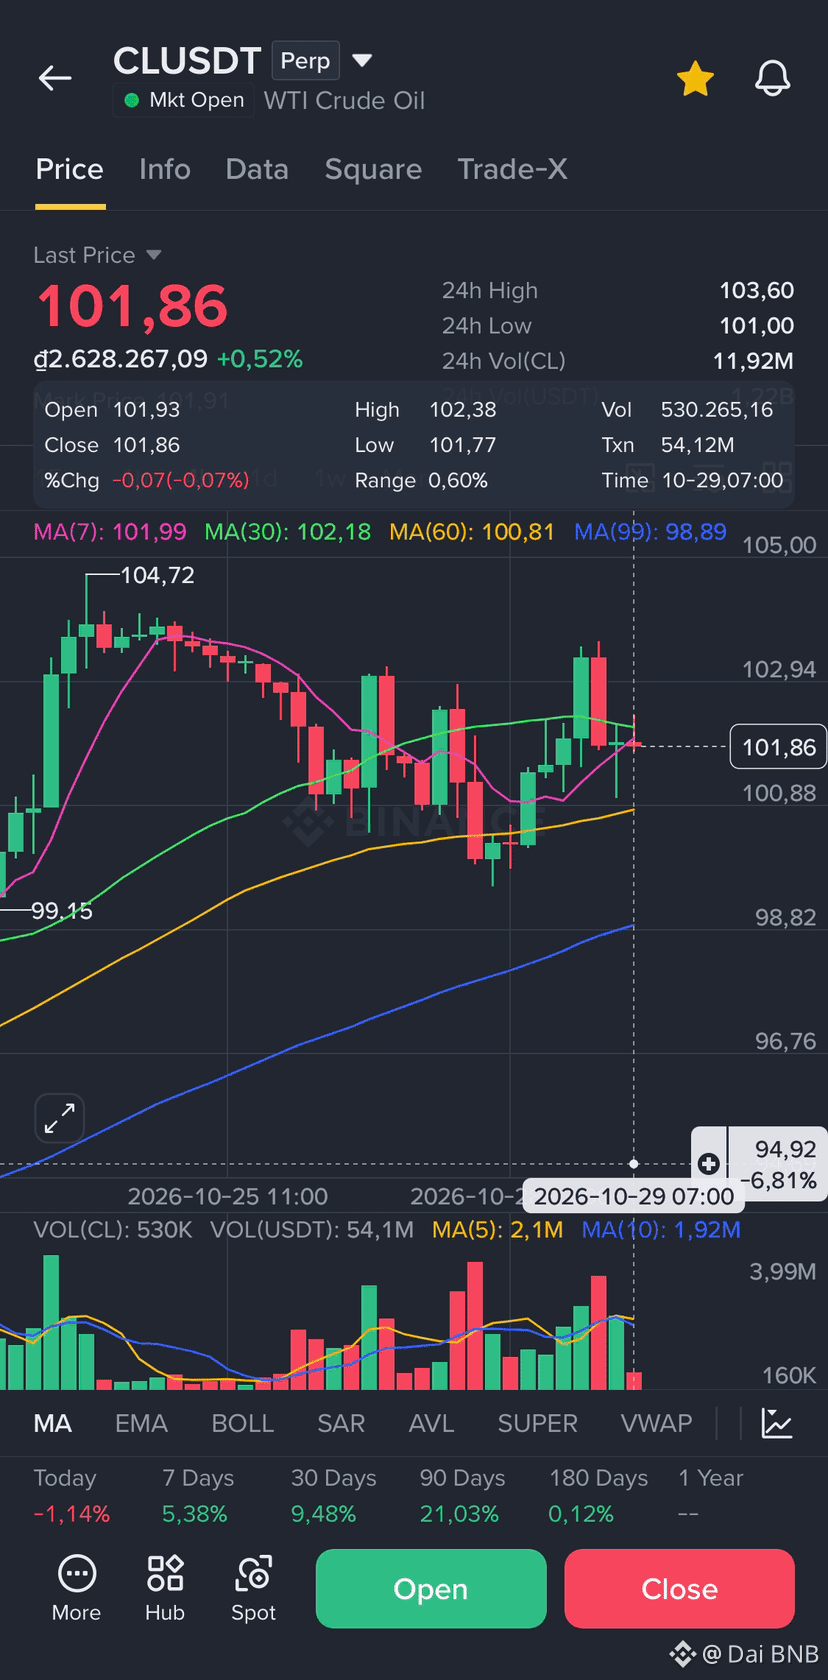
$CL ⚡️Trading Strategy: 📉 Short-term slight decline, wait for a rebound to buy:
Current price: 101.91 USDT
Key zone: 100.50 – 103.20 USDT
Status: Short-term bearish structure, sellers dominate:
🔥Trend opportunity: Wait for the price to retrace to the 100.50 USDT support zone to open a buy position; do not chase the price until news is clear.
Breakout opportunity: If the price breaks below 100.50 USDT with high volume, consider short selling following the momentum, but manage risk carefully. #cl
{future}(CLUSDT)
$CL ⚡️Trading Strategy: 📉 Short-term slight decline, wait for a rebound to buy:
Current price: 101.91 USDT
Key zone: 100.50 – 103.20 USDT
Status: Short-term bearish structure, sellers dominate:
🔥Trend opportunity: Wait for the price to retrace to the 100.50 USDT support zone to open a buy position; do not chase the price until news is clear.
Breakout opportunity: If the price breaks below 100.50 USDT with high volume, consider short selling following the momentum, but manage risk carefully. #cl
221
Log in to explore more content
Join global crypto users on Binance Square
⚡️ Get latest and useful information about crypto.
💬 Trusted by the world’s largest crypto exchange.
👍 Discover real insights from verified creators.
Email / Phone number
Trending Topics
FedWatch
16.4M views
39,718 Discussing
🚨 🇺🇸 PETER SCHIFF JUST THREW A BIG WARNING AT THE FED!
Peter Schiff is calling Kevin Warsh’s tough talk on inflation a “bluff,” and his prediction could have major implications for the markets.
Schiff believes the Fed could eventually return to money printing through quantitative easing (QE) and even cut interest rates next year, despite inflation continuing to rise.
Think about that for a moment.
🔥 Inflation could remain a problem. 🔥 The Fed could still move toward easier monetary policy. 🔥 More liquidity could flow into financial markets.
If this scenario plays out, it could create a very different market environment for stocks, gold, Bitcoin, and the wider crypto market.
But there’s a catch: if inflation stays high, the Fed could face a difficult choice between fighting rising prices and supporting the economy.
Will Warsh stick to a tough inflation policy, or will the Fed eventually change direction?
The next move could matter a lot for investors.
#FedWatch #EarningsSeason #USMidtermElections #BrazilCryptoExchangesMustApplyForLicensesByFriday #StanDruckenmillerBecomesInvestorInTradeXYZ
Jackson Liam
·4 Likes
·8.9k views
EarningsSeason
6.5M views
32,431 Discussing
USMidtermElections
60,237 views
779 Discussing