

AllInWeb3
922 Posts

AllInWeb3
Report
Block User
Open Trade

BNB Holder
High-Frequency Trader
5.5 Years
61 Following
126 Followers
392 Liked
Posts
Portfolio
All
Quotes
·
--
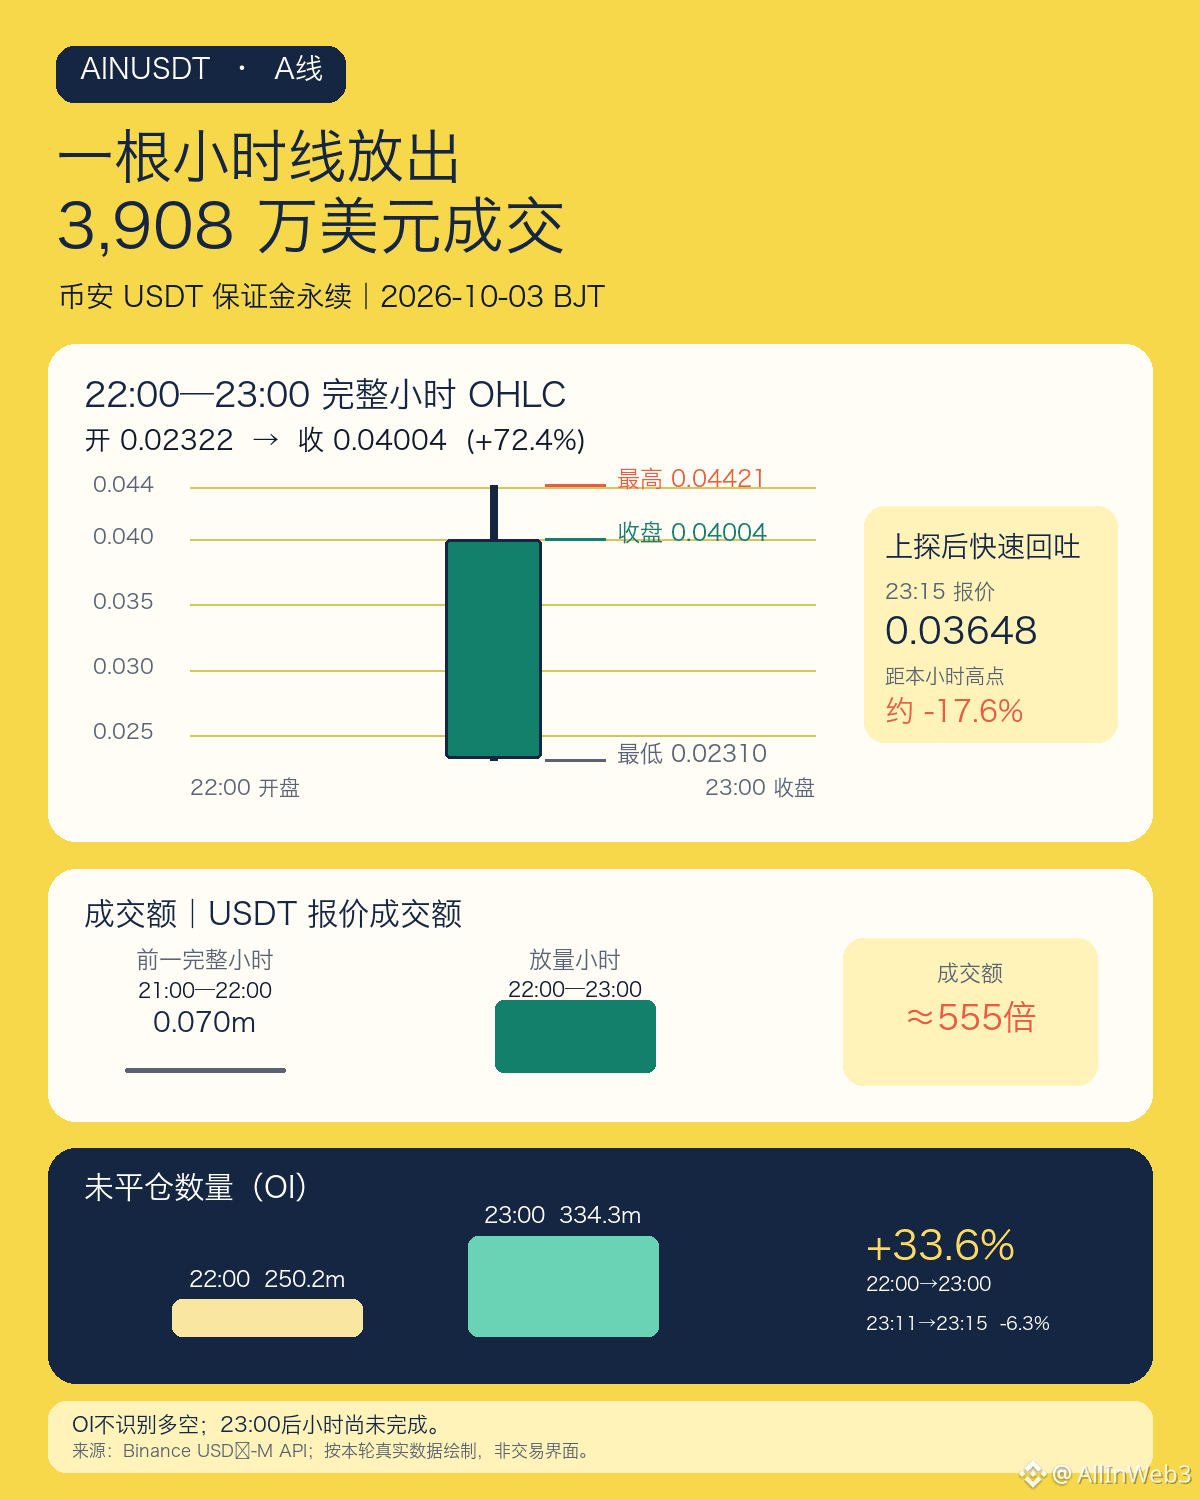
【$AINUSDT surged 72% in one hour, then spiked and pulled back】
Conclusion upfront: stay on the sidelines for now, don’t chase. A complete scan covering 526 Binance USDT-margined perpetual futures as of 23:20:23 Beijing time shows AINUSDT still ranks #1 by percentage gain. The rolling 24-hour increase is +45.828%, quoted at 0.03478, with trading volume of about $73.63 million. Compared with the 23:11:30 snapshot at 0.04364, the current price is about 20.3% lower. These two timestamps’ rolling 24-hour gains are also affected by changes in the statistics window, so they can’t be used to judge short-term returns.
The activity start is concentrated in the full 1-hour candle from 22:00 to 23:00: open 0.02322, intraday high 0.04421, low 0.02310, and it closed at 0.04004—up about 72.4% from the open. The USDT-quoted trading volume for that hour is about $39.08 million, which is 555 times the previous full hour’s roughly $70.4 thousand. After that, the single-coin quote briefly reached 0.04372 and the high was 0.04426; at 23:20 the single-coin quote was 0.03496, about 21.0% below the peak. The later hour after 23:00 has not closed yet—this pullback reflects fast price changes, not confirmation by a completed hour.
Open interest expanded first, then fell: the open contract count sample was about 250.2 million AIN at 22:00, rising to about 334.3 million at 23:00—an increase of roughly 33.6%. Current OI interface samples are about 352.8 million at 23:11, 330.6 million at 23:15, and 334.0 million at 23:20. The sample indicates the open interest size swung quickly, but it can’t distinguish long vs. short direction—so it also can’t be used to claim liquidation or net outflows. The share of actively bought trade value from 22:00 to 23:00 is about 49.95%, and there’s also no evidence of an overwhelming one-sided buyer.
On fees: the latest settlement record and the mark price interface readings don’t match, so I won’t use that to judge whether the market is crowded on the long or short side. Recheck once the same settlement window is aligned in the same reporting format. Binance’s old announcement listed AIN as Infinity Ground and confirmed that the perpetuals were already live; in this round, I didn’t find any same-day project announcement that could explain this repricing.
My view is to wait first and not chase the sudden rally. Whether the next completed full hour can reclaim and hold around 0.040, and whether during the pullback the trading volume and OI keep contracting, should be more informative than the leaderboard rank; the post-23:00 hour is still not finished yet.
【$AINUSDT surged 72% in one hour, then spiked and pulled back】
Conclusion upfront: stay on the sidelines for now, don’t chase. A complete scan covering 526 Binance USDT-margined perpetual futures as of 23:20:23 Beijing time shows AINUSDT still ranks #1 by percentage gain. The rolling 24-hour increase is +45.828%, quoted at 0.03478, with trading volume of about $73.63 million. Compared with the 23:11:30 snapshot at 0.04364, the current price is about 20.3% lower. These two timestamps’ rolling 24-hour gains are also affected by changes in the statistics window, so they can’t be used to judge short-term returns.
The activity start is concentrated in the full 1-hour candle from 22:00 to 23:00: open 0.02322, intraday high 0.04421, low 0.02310, and it closed at 0.04004—up about 72.4% from the open. The USDT-quoted trading volume for that hour is about $39.08 million, which is 555 times the previous full hour’s roughly $70.4 thousand. After that, the single-coin quote briefly reached 0.04372 and the high was 0.04426; at 23:20 the single-coin quote was 0.03496, about 21.0% below the peak. The later hour after 23:00 has not closed yet—this pullback reflects fast price changes, not confirmation by a completed hour.
Open interest expanded first, then fell: the open contract count sample was about 250.2 million AIN at 22:00, rising to about 334.3 million at 23:00—an increase of roughly 33.6%. Current OI interface samples are about 352.8 million at 23:11, 330.6 million at 23:15, and 334.0 million at 23:20. The sample indicates the open interest size swung quickly, but it can’t distinguish long vs. short direction—so it also can’t be used to claim liquidation or net outflows. The share of actively bought trade value from 22:00 to 23:00 is about 49.95%, and there’s also no evidence of an overwhelming one-sided buyer.
On fees: the latest settlement record and the mark price interface readings don’t match, so I won’t use that to judge whether the market is crowded on the long or short side. Recheck once the same settlement window is aligned in the same reporting format. Binance’s old announcement listed AIN as Infinity Ground and confirmed that the perpetuals were already live; in this round, I didn’t find any same-day project announcement that could explain this repricing.
My view is to wait first and not chase the sudden rally. Whether the next completed full hour can reclaim and hold around 0.040, and whether during the pullback the trading volume and OI keep contracting, should be more informative than the leaderboard rank; the post-23:00 hour is still not finished yet.
Conclusion upfront: stay on the sidelines for now, don’t chase. A complete scan covering 526 Binance USDT-margined perpetual futures as of 23:20:23 Beijing time shows AINUSDT still ranks #1 by percentage gain. The rolling 24-hour increase is +45.828%, quoted at 0.03478, with trading volume of about $73.63 million. Compared with the 23:11:30 snapshot at 0.04364, the current price is about 20.3% lower. These two timestamps’ rolling 24-hour gains are also affected by changes in the statistics window, so they can’t be used to judge short-term returns.
The activity start is concentrated in the full 1-hour candle from 22:00 to 23:00: open 0.02322, intraday high 0.04421, low 0.02310, and it closed at 0.04004—up about 72.4% from the open. The USDT-quoted trading volume for that hour is about $39.08 million, which is 555 times the previous full hour’s roughly $70.4 thousand. After that, the single-coin quote briefly reached 0.04372 and the high was 0.04426; at 23:20 the single-coin quote was 0.03496, about 21.0% below the peak. The later hour after 23:00 has not closed yet—this pullback reflects fast price changes, not confirmation by a completed hour.
Open interest expanded first, then fell: the open contract count sample was about 250.2 million AIN at 22:00, rising to about 334.3 million at 23:00—an increase of roughly 33.6%. Current OI interface samples are about 352.8 million at 23:11, 330.6 million at 23:15, and 334.0 million at 23:20. The sample indicates the open interest size swung quickly, but it can’t distinguish long vs. short direction—so it also can’t be used to claim liquidation or net outflows. The share of actively bought trade value from 22:00 to 23:00 is about 49.95%, and there’s also no evidence of an overwhelming one-sided buyer.
On fees: the latest settlement record and the mark price interface readings don’t match, so I won’t use that to judge whether the market is crowded on the long or short side. Recheck once the same settlement window is aligned in the same reporting format. Binance’s old announcement listed AIN as Infinity Ground and confirmed that the perpetuals were already live; in this round, I didn’t find any same-day project announcement that could explain this repricing.
My view is to wait first and not chase the sudden rally. Whether the next completed full hour can reclaim and hold around 0.040, and whether during the pullback the trading volume and OI keep contracting, should be more informative than the leaderboard rank; the post-23:00 hour is still not finished yet.
244
·
--
The 87K topic of #BTC —this round’s increase isn’t a rehash of the pump-and-dump followed by a pullback; instead, it’s already been confirmed by the $85,000 hourly close check left in the previous post.
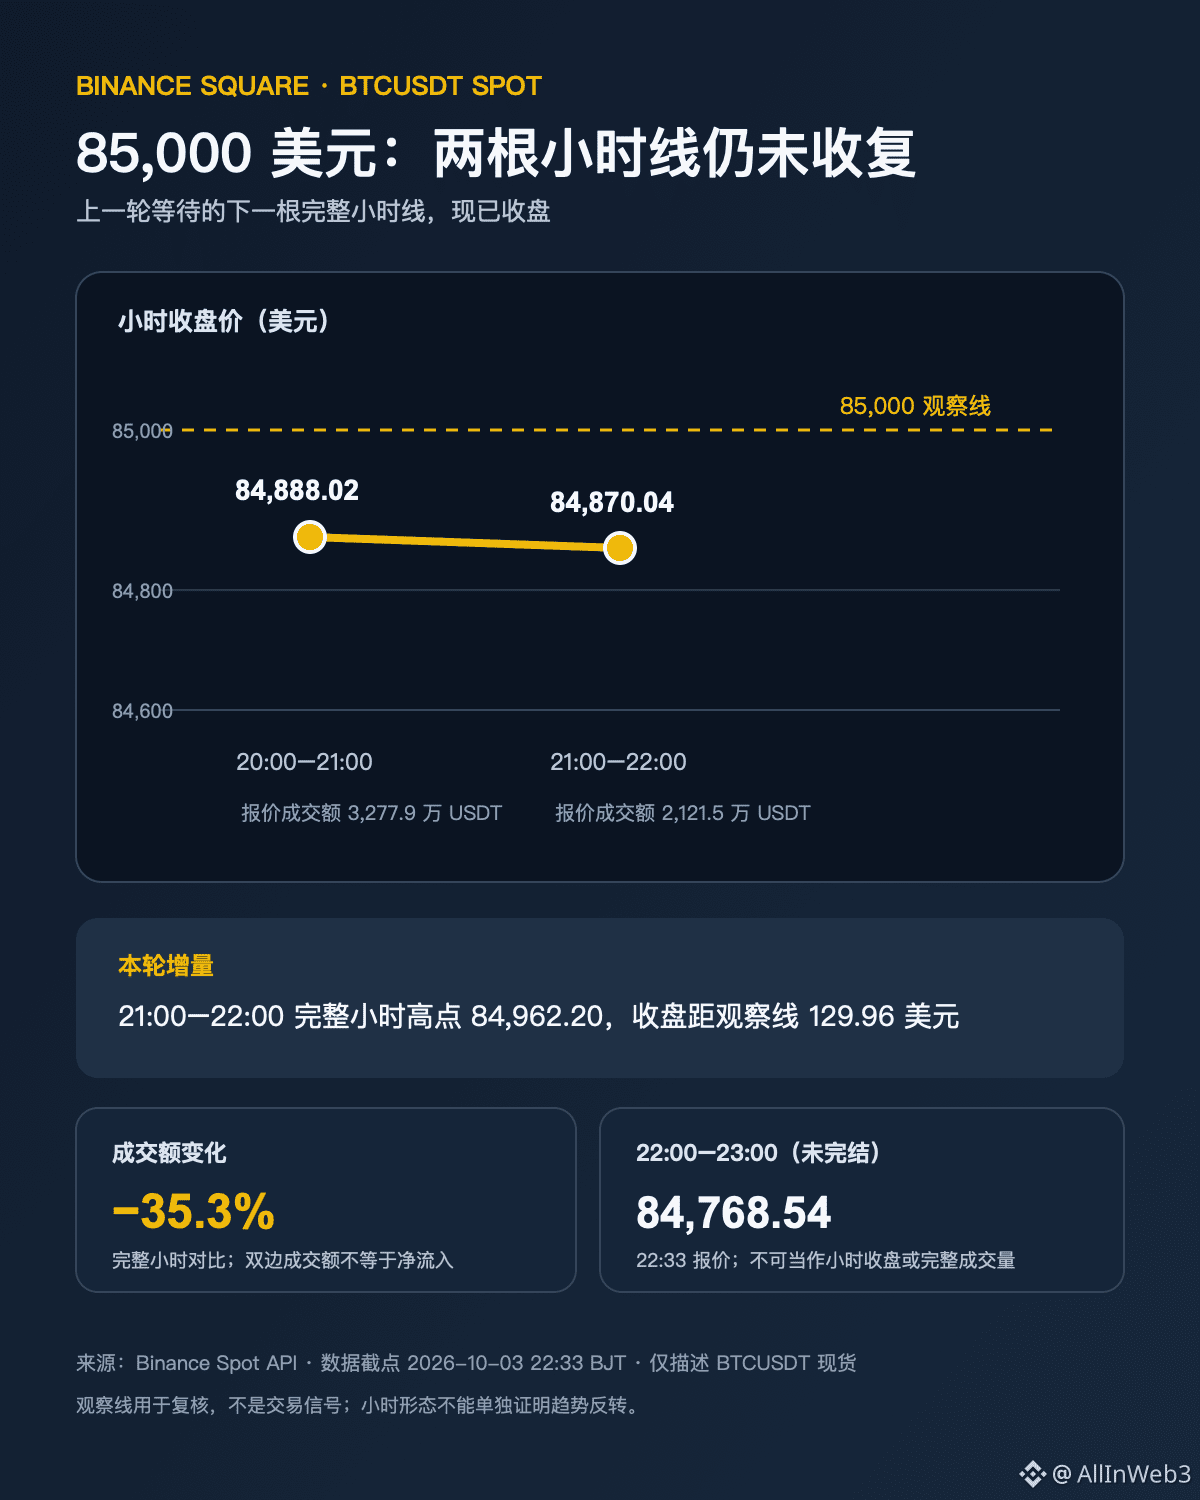
Binance spot BTCUSDT closed at $84,888.02 in the 20:00–21:00 BJT window; the next complete hour (21:00–22:00) opened at $84,888.02, with a high of $84,962.20 and a low of $84,770.35, and ultimately closed at $84,870.04. In other words, this hourly candle didn’t even touch $85,000, and the close remained $129.96 below it. The previous post with ID 373325098375454 was still waiting for this candle to close; this time it only fills in this pending, to-be-verified checkpoint.
Trading volume also provides a second boundary: the 20:00 hour’s quoted trade value was about $32.779 million USDT, while the 21:00 hour was about $21.215 million—down by roughly 35.3%. The close was also only slightly down versus the previous hour, about 0.02%. However, quoted trade value is the total matched amount between buy and sell orders; it does not equal net inflow. A drop in single-hour traded value also cannot, by itself, be used to conclude that selling pressure has already been exhausted.
As of 22:33, the 22:00–23:00 hour hasn’t finished yet. The latest quoted price is $84,768.54, and the current rolling 24-hour range is $83,888–$86,056, down about 1.35%. This is a different observation window from the earlier short-term high at 87,220. This chart does not treat an incomplete hour as a close, nor does it use the price pullback to explain causality or a trend reversal. Next, we only observe whether, in complete hours, it can close back above $85,000, and whether the成交 structure changes during any pullback. If subsequent complete hours show higher volume and close above $85,000, then that condition is considered verified; a brief intraday wick below with a close back above the line still doesn’t count as confirmation. Short-term highs, trade value, and hourly closes measure different information and can’t substitute for one another. This post also does not extrapolate a single-hour structure into a mid-term trend assessment. Price levels are the recheck condition, not a prediction or a trading signal. Data timestamp: 2026-10-03 22:33 BJT. Source: Binance Spot BTCUSDT 1-hour candlesticks and 24-hour ticker.
The 87K topic of #BTC —this round’s increase isn’t a rehash of the pump-and-dump followed by a pullback; instead, it’s already been confirmed by the $85,000 hourly close check left in the previous post.
Binance spot BTCUSDT closed at $84,888.02 in the 20:00–21:00 BJT window; the next complete hour (21:00–22:00) opened at $84,888.02, with a high of $84,962.20 and a low of $84,770.35, and ultimately closed at $84,870.04. In other words, this hourly candle didn’t even touch $85,000, and the close remained $129.96 below it. The previous post with ID 373325098375454 was still waiting for this candle to close; this time it only fills in this pending, to-be-verified checkpoint.
Trading volume also provides a second boundary: the 20:00 hour’s quoted trade value was about $32.779 million USDT, while the 21:00 hour was about $21.215 million—down by roughly 35.3%. The close was also only slightly down versus the previous hour, about 0.02%. However, quoted trade value is the total matched amount between buy and sell orders; it does not equal net inflow. A drop in single-hour traded value also cannot, by itself, be used to conclude that selling pressure has already been exhausted.
As of 22:33, the 22:00–23:00 hour hasn’t finished yet. The latest quoted price is $84,768.54, and the current rolling 24-hour range is $83,888–$86,056, down about 1.35%. This is a different observation window from the earlier short-term high at 87,220. This chart does not treat an incomplete hour as a close, nor does it use the price pullback to explain causality or a trend reversal. Next, we only observe whether, in complete hours, it can close back above $85,000, and whether the成交 structure changes during any pullback. If subsequent complete hours show higher volume and close above $85,000, then that condition is considered verified; a brief intraday wick below with a close back above the line still doesn’t count as confirmation. Short-term highs, trade value, and hourly closes measure different information and can’t substitute for one another. This post also does not extrapolate a single-hour structure into a mid-term trend assessment. Price levels are the recheck condition, not a prediction or a trading signal. Data timestamp: 2026-10-03 22:33 BJT. Source: Binance Spot BTCUSDT 1-hour candlesticks and 24-hour ticker.
Binance spot BTCUSDT closed at $84,888.02 in the 20:00–21:00 BJT window; the next complete hour (21:00–22:00) opened at $84,888.02, with a high of $84,962.20 and a low of $84,770.35, and ultimately closed at $84,870.04. In other words, this hourly candle didn’t even touch $85,000, and the close remained $129.96 below it. The previous post with ID 373325098375454 was still waiting for this candle to close; this time it only fills in this pending, to-be-verified checkpoint.
Trading volume also provides a second boundary: the 20:00 hour’s quoted trade value was about $32.779 million USDT, while the 21:00 hour was about $21.215 million—down by roughly 35.3%. The close was also only slightly down versus the previous hour, about 0.02%. However, quoted trade value is the total matched amount between buy and sell orders; it does not equal net inflow. A drop in single-hour traded value also cannot, by itself, be used to conclude that selling pressure has already been exhausted.
As of 22:33, the 22:00–23:00 hour hasn’t finished yet. The latest quoted price is $84,768.54, and the current rolling 24-hour range is $83,888–$86,056, down about 1.35%. This is a different observation window from the earlier short-term high at 87,220. This chart does not treat an incomplete hour as a close, nor does it use the price pullback to explain causality or a trend reversal. Next, we only observe whether, in complete hours, it can close back above $85,000, and whether the成交 structure changes during any pullback. If subsequent complete hours show higher volume and close above $85,000, then that condition is considered verified; a brief intraday wick below with a close back above the line still doesn’t count as confirmation. Short-term highs, trade value, and hourly closes measure different information and can’t substitute for one another. This post also does not extrapolate a single-hour structure into a mid-term trend assessment. Price levels are the recheck condition, not a prediction or a trading signal. Data timestamp: 2026-10-03 22:33 BJT. Source: Binance Spot BTCUSDT 1-hour candlesticks and 24-hour ticker.
14
·
--
Partly True
$PUMPBTCUSDT is still leading the top gainers over the past 24 hours, but the latest fully reported hourly signal is cautious: the price closed lower, the trading volume is nearly halved, and open interest expansion is starting to unwind. A high percentage gain alone cannot prove that the long side is still being actively followed.
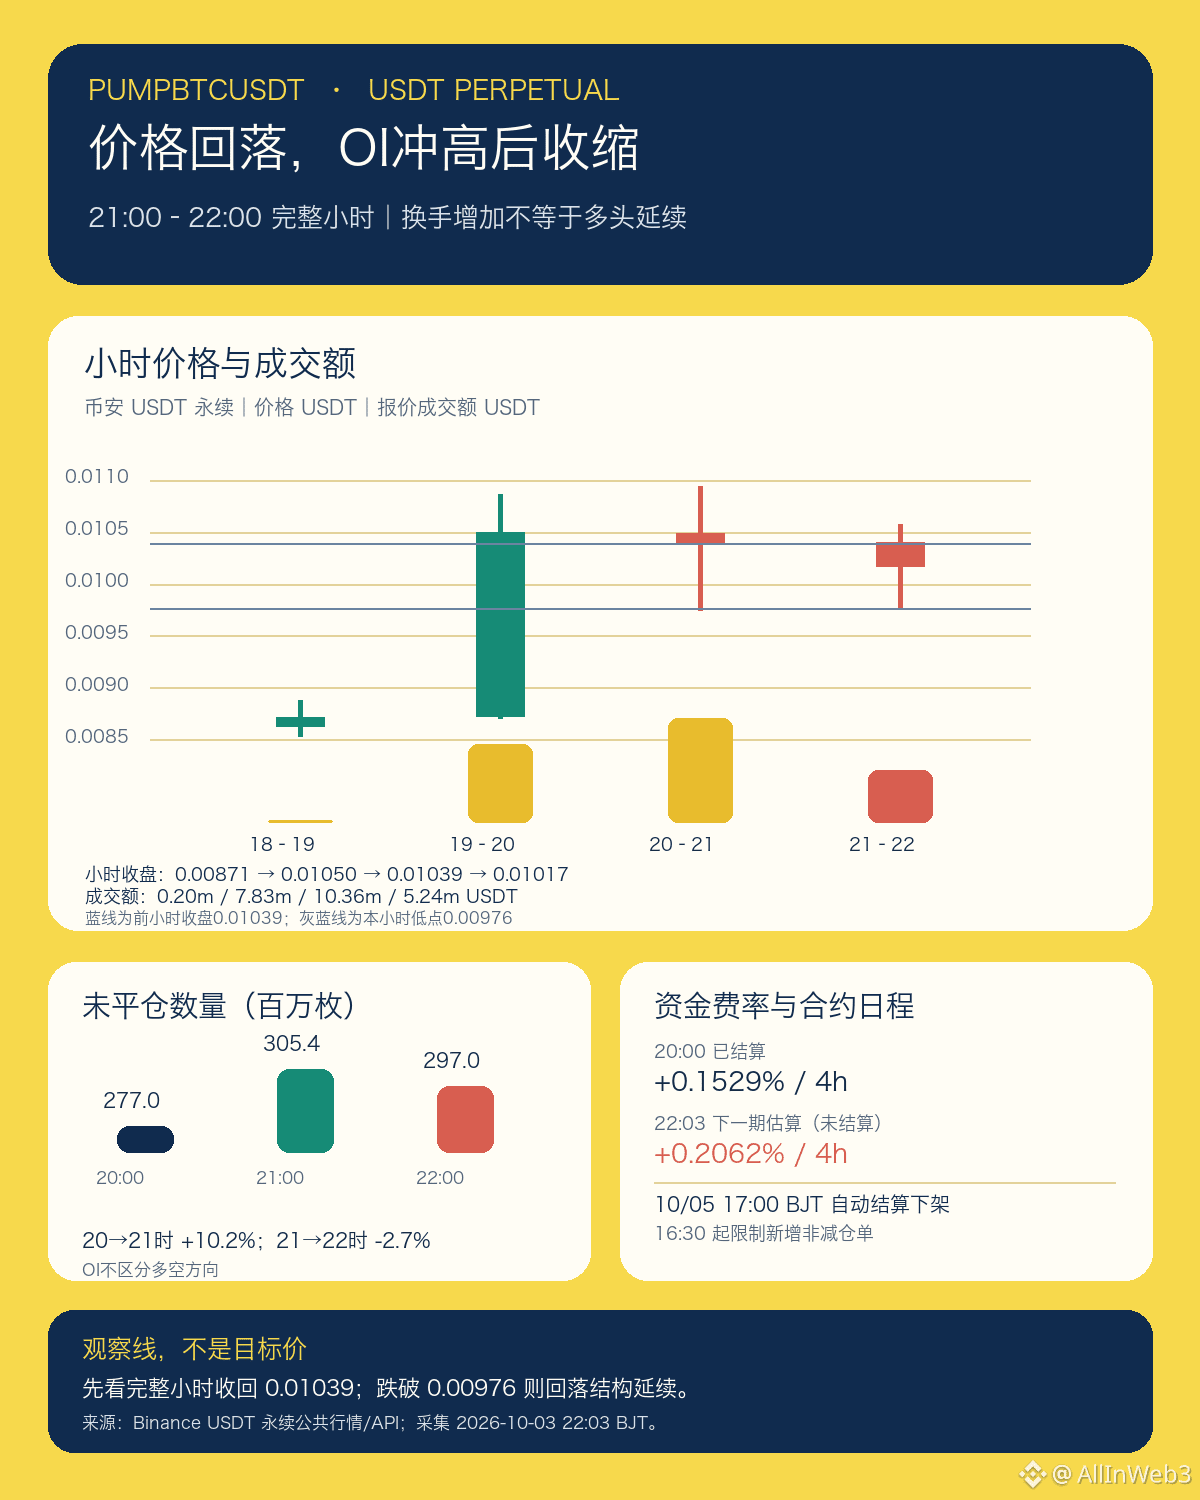
At 22:02 BJT, the market’s initial scan covered 526 normal USDT-margined perpetual contracts. PUMPBTCUSDT ranked 1 at that time: +24.846% over rolling 24 hours, quote 0.01015, and trading volume of about $30.39 million. After the second pre-release scan at 22:10, it became rank 2: +23.114%, quote 0.01012, and trading volume of about $31.16 million. Since the snapshot timestamps differ, they cannot be mixed into a single fixed price. The hourly candles below run up to 22:03, and the last fully completed hour is 21:00–22:00.
Looking at the full hours: 20:00–21:00 closed at 0.01039; trading volume was about $10.357 million. 21:00–22:00 opened at 0.01040, had a high of 0.01057, a low of 0.00976, and closed at 0.01017. The close is down about 2.1%, and trading volume dropped to about $5.24 million, which is 49.4% less than the prior hour. This looks more like a pullback and cooling off after a spike, and you cannot infer net selling just from two-sided trading volume.
The OI sample rose from about 277 million at 20:00 to 305.4 million at 21:00, an increase of about 10.2%. By 22:00 it fell back to 297 million, down about 2.7% from the previous hour. This suggests that the open interest increased first and then shrank, but OI does not distinguish between longs and shorts, so you cannot conclude that all newly added positions are longs. The latest settled funding rate at 20:00 was +0.1529% per 4 hours. The next period’s estimate at 22:03 is +0.2062% and is still not settled; the actual number may change. Be mindful of both chasing-cost and adverse price swings.
Don’t miss the risk schedule: Binance’s Oct 1 announcement states that the PUMPBTCUSDT perpetual will be automatically settled and delisted at 17:00 BJT on Oct 5, and starting 16:30 no new non-reducing orders will be accepted. This applies to the contract, not to whether PumpBTC spot tokens are delisted; the announcement also cannot explain the cause of this round of the rally.
I won’t take the #1 ranking or rising OI as confirmation to go long. Going forward, first see whether the full hour can reclaim the prior hour’s close of 0.01039, then watch around 0.01057. If it breaks below 0.00976, the pullback structure of this move is still intact. With it getting close to automatic settlement and the estimated funding rate being on the high side, we should observe risk levels above the impulse to chase.
Data as of 22:03 BJT—only analyzing this perpetual contract; this does not constitute trading or order placement advice.
$PUMPBTCUSDT is still leading the top gainers over the past 24 hours, but the latest fully reported hourly signal is cautious: the price closed lower, the trading volume is nearly halved, and open interest expansion is starting to unwind. A high percentage gain alone cannot prove that the long side is still being actively followed.
At 22:02 BJT, the market’s initial scan covered 526 normal USDT-margined perpetual contracts. PUMPBTCUSDT ranked 1 at that time: +24.846% over rolling 24 hours, quote 0.01015, and trading volume of about $30.39 million. After the second pre-release scan at 22:10, it became rank 2: +23.114%, quote 0.01012, and trading volume of about $31.16 million. Since the snapshot timestamps differ, they cannot be mixed into a single fixed price. The hourly candles below run up to 22:03, and the last fully completed hour is 21:00–22:00.
Looking at the full hours: 20:00–21:00 closed at 0.01039; trading volume was about $10.357 million. 21:00–22:00 opened at 0.01040, had a high of 0.01057, a low of 0.00976, and closed at 0.01017. The close is down about 2.1%, and trading volume dropped to about $5.24 million, which is 49.4% less than the prior hour. This looks more like a pullback and cooling off after a spike, and you cannot infer net selling just from two-sided trading volume.
The OI sample rose from about 277 million at 20:00 to 305.4 million at 21:00, an increase of about 10.2%. By 22:00 it fell back to 297 million, down about 2.7% from the previous hour. This suggests that the open interest increased first and then shrank, but OI does not distinguish between longs and shorts, so you cannot conclude that all newly added positions are longs. The latest settled funding rate at 20:00 was +0.1529% per 4 hours. The next period’s estimate at 22:03 is +0.2062% and is still not settled; the actual number may change. Be mindful of both chasing-cost and adverse price swings.
Don’t miss the risk schedule: Binance’s Oct 1 announcement states that the PUMPBTCUSDT perpetual will be automatically settled and delisted at 17:00 BJT on Oct 5, and starting 16:30 no new non-reducing orders will be accepted. This applies to the contract, not to whether PumpBTC spot tokens are delisted; the announcement also cannot explain the cause of this round of the rally.
I won’t take the #1 ranking or rising OI as confirmation to go long. Going forward, first see whether the full hour can reclaim the prior hour’s close of 0.01039, then watch around 0.01057. If it breaks below 0.00976, the pullback structure of this move is still intact. With it getting close to automatic settlement and the estimated funding rate being on the high side, we should observe risk levels above the impulse to chase.
Data as of 22:03 BJT—only analyzing this perpetual contract; this does not constitute trading or order placement advice.
At 22:02 BJT, the market’s initial scan covered 526 normal USDT-margined perpetual contracts. PUMPBTCUSDT ranked 1 at that time: +24.846% over rolling 24 hours, quote 0.01015, and trading volume of about $30.39 million. After the second pre-release scan at 22:10, it became rank 2: +23.114%, quote 0.01012, and trading volume of about $31.16 million. Since the snapshot timestamps differ, they cannot be mixed into a single fixed price. The hourly candles below run up to 22:03, and the last fully completed hour is 21:00–22:00.
Looking at the full hours: 20:00–21:00 closed at 0.01039; trading volume was about $10.357 million. 21:00–22:00 opened at 0.01040, had a high of 0.01057, a low of 0.00976, and closed at 0.01017. The close is down about 2.1%, and trading volume dropped to about $5.24 million, which is 49.4% less than the prior hour. This looks more like a pullback and cooling off after a spike, and you cannot infer net selling just from two-sided trading volume.
The OI sample rose from about 277 million at 20:00 to 305.4 million at 21:00, an increase of about 10.2%. By 22:00 it fell back to 297 million, down about 2.7% from the previous hour. This suggests that the open interest increased first and then shrank, but OI does not distinguish between longs and shorts, so you cannot conclude that all newly added positions are longs. The latest settled funding rate at 20:00 was +0.1529% per 4 hours. The next period’s estimate at 22:03 is +0.2062% and is still not settled; the actual number may change. Be mindful of both chasing-cost and adverse price swings.
Don’t miss the risk schedule: Binance’s Oct 1 announcement states that the PUMPBTCUSDT perpetual will be automatically settled and delisted at 17:00 BJT on Oct 5, and starting 16:30 no new non-reducing orders will be accepted. This applies to the contract, not to whether PumpBTC spot tokens are delisted; the announcement also cannot explain the cause of this round of the rally.
I won’t take the #1 ranking or rising OI as confirmation to go long. Going forward, first see whether the full hour can reclaim the prior hour’s close of 0.01039, then watch around 0.01057. If it breaks below 0.00976, the pullback structure of this move is still intact. With it getting close to automatic settlement and the estimated funding rate being on the high side, we should observe risk levels above the impulse to chase.
Data as of 22:03 BJT—only analyzing this perpetual contract; this does not constitute trading or order placement advice.
219
·
--
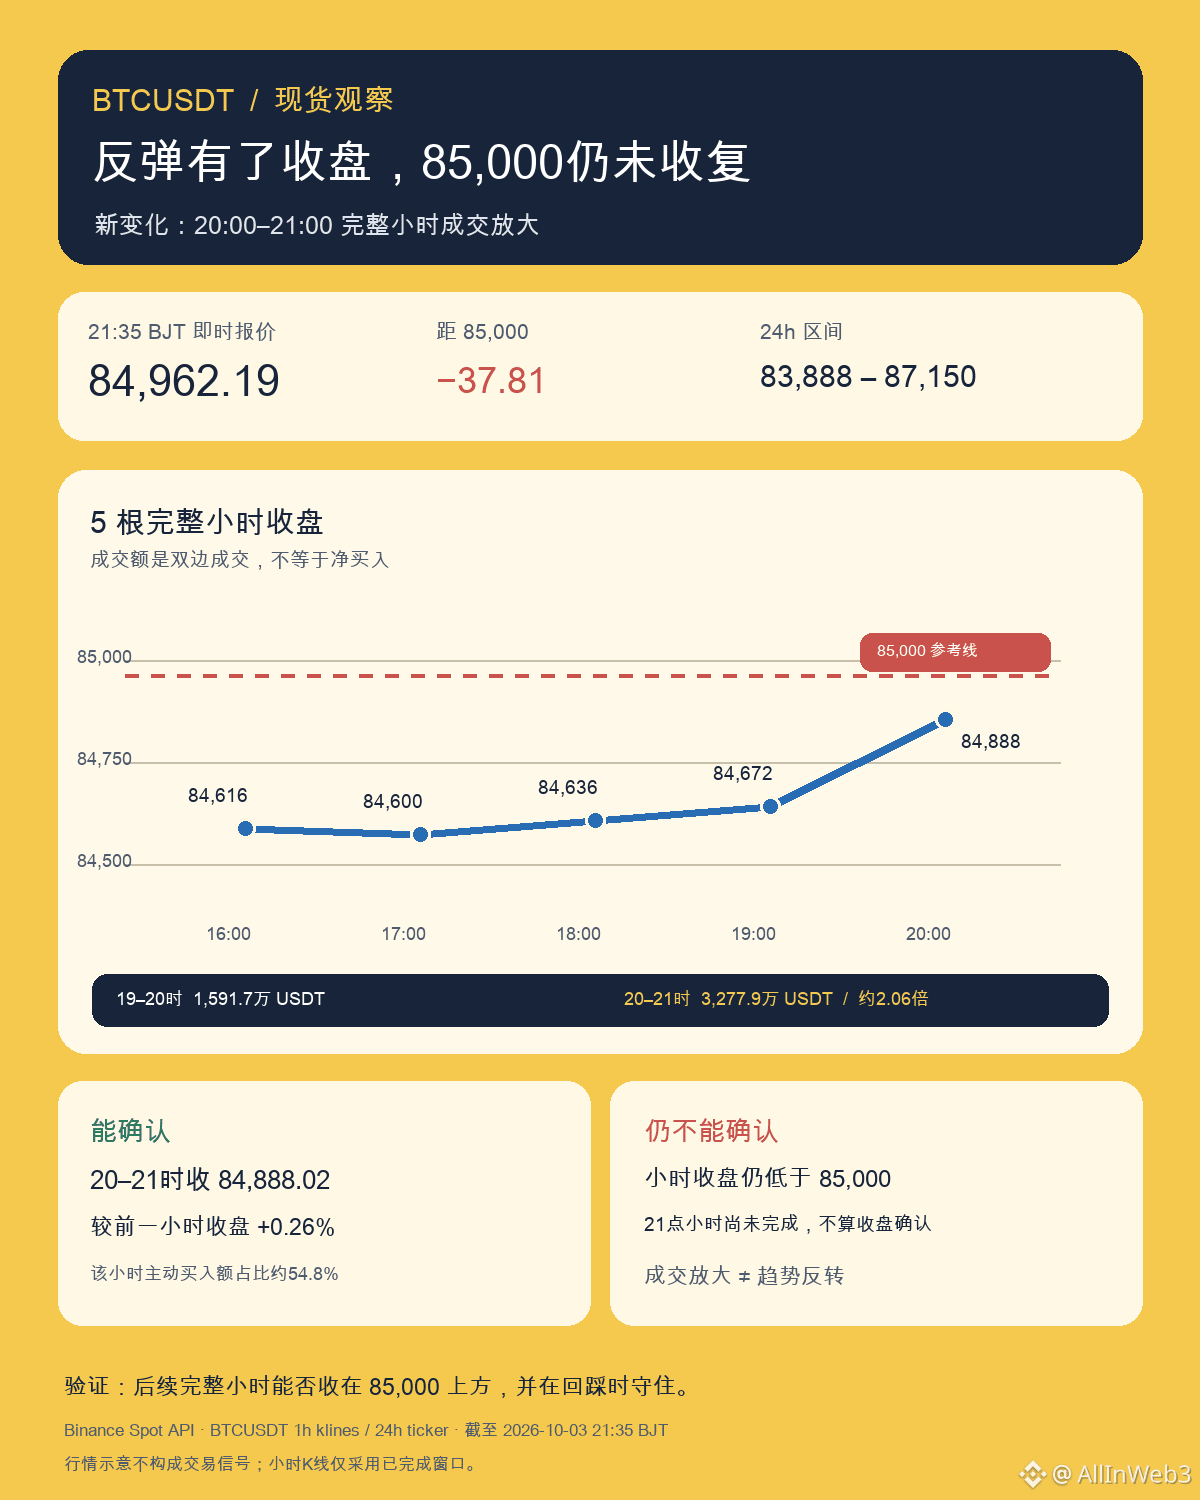
After BTC gave back from $87,220, the previous 16:42 BJT observation was that it stalled at $84,620, below $85,000. Now there is a limited new datapoint: Binance spot BTCUSDT completed the full 20:00–21:00 hour with a close at $84,888.02, up about 0.26% from the 19:00–20:00 close of $84,672.01. The traded notional for that hour was about $32.779 million, which is 2.06x the $15.917 million of the prior hour. The buy-initiated notional accounted for roughly 54.8% of that hour. The hour’s high reached $84,926.47 at 20:00, still $73.53 below $85,000; the gap at the close widened further to $111.98. “Near” does not equal “reclaim.”
This suggests the rebound produced a more actively traded full hour, but the magnitude isn’t large, and the close still did not cross above $85,000. Total turnover comes from two-sided matching; buy-initiated volume reflects the buy-side initiated trade reporting, not net inflow, and cannot by itself prove a trend reversal. With only a single hourly candle, it’s also insufficient to label the bounce as sustained buying.
At 21:35 BJT, the instantaneous price is $84,962.19, about $38 away from $85,000; however, the 21:00 hour is not yet complete, so intraday touches can’t be treated as close-confirmation. The rolling 24-hour range remains $83,888–$87,150, and it’s still about 2.5% below the range high; the 24-hour drop is 2.396%. Compared with the previous entry, the added detail here is the first high-volume rebound hour after the pullback—updating the conditions for observing whether $85,000 can be reclaimed, not rehashing the push up to 87K.
Next, watch whether the full 21:00 hour closes above $85,000, and then whether subsequent pullbacks hold. If the close remains below it, or if it tests the lower edge near $83,888 again, this high-volume rebound will still be only a range-based bounce. The key is validating the conditions, not chasing the target price. Data as of 2026-10-03 21:35 BJT. Source: Binance BTCUSDT spot hourly candles and the 24-hour market report. A rolling 24-hour change is not the same as single-day performance, and this cycle only describes the BTCUSDT spot market—it does not represent the direction of capital flow across the entire market.
After BTC gave back from $87,220, the previous 16:42 BJT observation was that it stalled at $84,620, below $85,000. Now there is a limited new datapoint: Binance spot BTCUSDT completed the full 20:00–21:00 hour with a close at $84,888.02, up about 0.26% from the 19:00–20:00 close of $84,672.01. The traded notional for that hour was about $32.779 million, which is 2.06x the $15.917 million of the prior hour. The buy-initiated notional accounted for roughly 54.8% of that hour. The hour’s high reached $84,926.47 at 20:00, still $73.53 below $85,000; the gap at the close widened further to $111.98. “Near” does not equal “reclaim.”
This suggests the rebound produced a more actively traded full hour, but the magnitude isn’t large, and the close still did not cross above $85,000. Total turnover comes from two-sided matching; buy-initiated volume reflects the buy-side initiated trade reporting, not net inflow, and cannot by itself prove a trend reversal. With only a single hourly candle, it’s also insufficient to label the bounce as sustained buying.
At 21:35 BJT, the instantaneous price is $84,962.19, about $38 away from $85,000; however, the 21:00 hour is not yet complete, so intraday touches can’t be treated as close-confirmation. The rolling 24-hour range remains $83,888–$87,150, and it’s still about 2.5% below the range high; the 24-hour drop is 2.396%. Compared with the previous entry, the added detail here is the first high-volume rebound hour after the pullback—updating the conditions for observing whether $85,000 can be reclaimed, not rehashing the push up to 87K.
Next, watch whether the full 21:00 hour closes above $85,000, and then whether subsequent pullbacks hold. If the close remains below it, or if it tests the lower edge near $83,888 again, this high-volume rebound will still be only a range-based bounce. The key is validating the conditions, not chasing the target price. Data as of 2026-10-03 21:35 BJT. Source: Binance BTCUSDT spot hourly candles and the 24-hour market report. A rolling 24-hour change is not the same as single-day performance, and this cycle only describes the BTCUSDT spot market—it does not represent the direction of capital flow across the entire market.
This suggests the rebound produced a more actively traded full hour, but the magnitude isn’t large, and the close still did not cross above $85,000. Total turnover comes from two-sided matching; buy-initiated volume reflects the buy-side initiated trade reporting, not net inflow, and cannot by itself prove a trend reversal. With only a single hourly candle, it’s also insufficient to label the bounce as sustained buying.
At 21:35 BJT, the instantaneous price is $84,962.19, about $38 away from $85,000; however, the 21:00 hour is not yet complete, so intraday touches can’t be treated as close-confirmation. The rolling 24-hour range remains $83,888–$87,150, and it’s still about 2.5% below the range high; the 24-hour drop is 2.396%. Compared with the previous entry, the added detail here is the first high-volume rebound hour after the pullback—updating the conditions for observing whether $85,000 can be reclaimed, not rehashing the push up to 87K.
Next, watch whether the full 21:00 hour closes above $85,000, and then whether subsequent pullbacks hold. If the close remains below it, or if it tests the lower edge near $83,888 again, this high-volume rebound will still be only a range-based bounce. The key is validating the conditions, not chasing the target price. Data as of 2026-10-03 21:35 BJT. Source: Binance BTCUSDT spot hourly candles and the 24-hour market report. A rolling 24-hour change is not the same as single-day performance, and this cycle only describes the BTCUSDT spot market—it does not represent the direction of capital flow across the entire market.
99
·
--
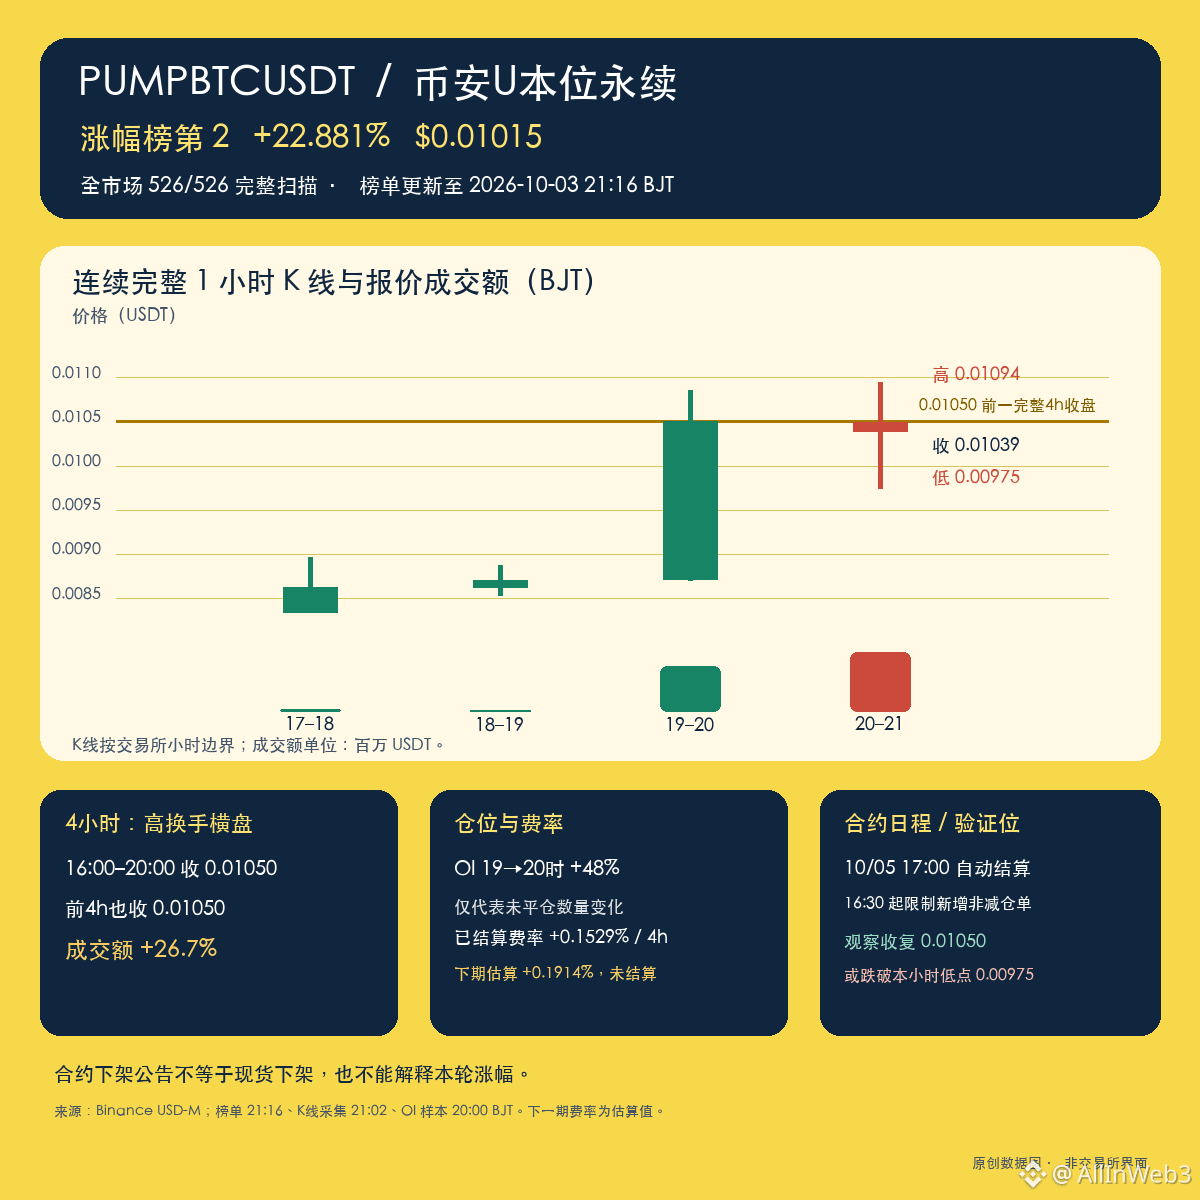
$PUMPBTCUSDT I’m not chasing longs for now: the latest complete hour after heavy trading saw a drop from 0.01094 to 0.01039, without turning the spike into a higher closing price. A full scan of the entire Binance USDT-margined perpetual futures market (covers 526 normal trading contracts) at 21:00 Beijing time shows PUMPBTCUSDT ranked #2 by price increase; over the rolling past 24 hours it is up +26.239%, price at 0.01044, and turnover around $25.276 million. At 21:02 the single-coin ticker updated to 0.01048. The full re-scan at 21:10 still ranks #2; price returns to 0.01017 and the gain falls to +23.123%. The re-scan at 21:13 still ranks #2; quote 0.01010, gain +22.573%. The latest scan at 21:16 still ranks #2; quote 0.01015, gain +22.881%, with rolling turnover about $27.284 million. Different time slices cannot be mixed into one execution price.
The new structure first looks at the complete hour 20:00–21:00: open 0.01049, high 0.01094, low 0.00975, last/close 0.01039, turnover about $10.357 million; active buy value about $5.051 million, accounting for about 48.8% of that hour’s quoted trade turnover. Volume is large, but the close is below the open, and there’s a clear drop from the high—so for now there’s no evidence of sustained buying pressure overwhelming sellers. The previous candle 19:00–20:00 closed at 0.01050; the latest hour did not continue the upside.
The four-hour window also suggests “turnover ≠ breakout”: 16:00–20:00 closed at 0.01050, nearly the same as the prior 12:00–16:00 close, but quoted trading turnover rose from about $8.352 million to $10.583 million, an increase of ~26.7%. Binance’s available OI sample is up to 20:00: from 19:00 to 20:00, open interest increased by about 48%. This only indicates a larger open-interest scale; it cannot tell whether the added positions are longs or shorts. The funding rate for positions settled at 20:00 is +0.1529% per 4 hours; the next period estimated at 21:02 is +0.1914%, not yet settled. Leverage demand looks crowded, so the risk of pullbacks when chasing longs rises accordingly.
Also put the contract schedule alongside: Binance’s Oct 1 announcement states that the PUMPBTCUSDT perpetual will be automatically settled and delisted on Oct 5 at 17:00, and starting from 16:30 it will not accept new orders that are non–position-reducing. This is a contract-processing arrangement; it does not mean the PUMPBTC spot token is delisted simultaneously. The announcement was released earlier than this round of volatility, so it cannot be used to conclude it caused the rise.
Going forward, watch whether price can re-stand above 0.01050 using the complete hour level and stabilize, rather than only spiking intrahour to 0.01094. If it breaks below this hour’s low of 0.00975 again, then the lower boundary of the current range is lost. Both are validation lines, not target prices or guarantees. In the chart, K-line, OI, and funding data are respectively through 21:02 and 20:00; the complete pre-published ranking list is through 21:16 BJT, and the funding-rate estimate is not a settled value. #PUMPBTC
$PUMPBTCUSDT I’m not chasing longs for now: the latest complete hour after heavy trading saw a drop from 0.01094 to 0.01039, without turning the spike into a higher closing price. A full scan of the entire Binance USDT-margined perpetual futures market (covers 526 normal trading contracts) at 21:00 Beijing time shows PUMPBTCUSDT ranked #2 by price increase; over the rolling past 24 hours it is up +26.239%, price at 0.01044, and turnover around $25.276 million. At 21:02 the single-coin ticker updated to 0.01048. The full re-scan at 21:10 still ranks #2; price returns to 0.01017 and the gain falls to +23.123%. The re-scan at 21:13 still ranks #2; quote 0.01010, gain +22.573%. The latest scan at 21:16 still ranks #2; quote 0.01015, gain +22.881%, with rolling turnover about $27.284 million. Different time slices cannot be mixed into one execution price.
The new structure first looks at the complete hour 20:00–21:00: open 0.01049, high 0.01094, low 0.00975, last/close 0.01039, turnover about $10.357 million; active buy value about $5.051 million, accounting for about 48.8% of that hour’s quoted trade turnover. Volume is large, but the close is below the open, and there’s a clear drop from the high—so for now there’s no evidence of sustained buying pressure overwhelming sellers. The previous candle 19:00–20:00 closed at 0.01050; the latest hour did not continue the upside.
The four-hour window also suggests “turnover ≠ breakout”: 16:00–20:00 closed at 0.01050, nearly the same as the prior 12:00–16:00 close, but quoted trading turnover rose from about $8.352 million to $10.583 million, an increase of ~26.7%. Binance’s available OI sample is up to 20:00: from 19:00 to 20:00, open interest increased by about 48%. This only indicates a larger open-interest scale; it cannot tell whether the added positions are longs or shorts. The funding rate for positions settled at 20:00 is +0.1529% per 4 hours; the next period estimated at 21:02 is +0.1914%, not yet settled. Leverage demand looks crowded, so the risk of pullbacks when chasing longs rises accordingly.
Also put the contract schedule alongside: Binance’s Oct 1 announcement states that the PUMPBTCUSDT perpetual will be automatically settled and delisted on Oct 5 at 17:00, and starting from 16:30 it will not accept new orders that are non–position-reducing. This is a contract-processing arrangement; it does not mean the PUMPBTC spot token is delisted simultaneously. The announcement was released earlier than this round of volatility, so it cannot be used to conclude it caused the rise.
Going forward, watch whether price can re-stand above 0.01050 using the complete hour level and stabilize, rather than only spiking intrahour to 0.01094. If it breaks below this hour’s low of 0.00975 again, then the lower boundary of the current range is lost. Both are validation lines, not target prices or guarantees. In the chart, K-line, OI, and funding data are respectively through 21:02 and 20:00; the complete pre-published ranking list is through 21:16 BJT, and the funding-rate estimate is not a settled value. #PUMPBTC
The new structure first looks at the complete hour 20:00–21:00: open 0.01049, high 0.01094, low 0.00975, last/close 0.01039, turnover about $10.357 million; active buy value about $5.051 million, accounting for about 48.8% of that hour’s quoted trade turnover. Volume is large, but the close is below the open, and there’s a clear drop from the high—so for now there’s no evidence of sustained buying pressure overwhelming sellers. The previous candle 19:00–20:00 closed at 0.01050; the latest hour did not continue the upside.
The four-hour window also suggests “turnover ≠ breakout”: 16:00–20:00 closed at 0.01050, nearly the same as the prior 12:00–16:00 close, but quoted trading turnover rose from about $8.352 million to $10.583 million, an increase of ~26.7%. Binance’s available OI sample is up to 20:00: from 19:00 to 20:00, open interest increased by about 48%. This only indicates a larger open-interest scale; it cannot tell whether the added positions are longs or shorts. The funding rate for positions settled at 20:00 is +0.1529% per 4 hours; the next period estimated at 21:02 is +0.1914%, not yet settled. Leverage demand looks crowded, so the risk of pullbacks when chasing longs rises accordingly.
Also put the contract schedule alongside: Binance’s Oct 1 announcement states that the PUMPBTCUSDT perpetual will be automatically settled and delisted on Oct 5 at 17:00, and starting from 16:30 it will not accept new orders that are non–position-reducing. This is a contract-processing arrangement; it does not mean the PUMPBTC spot token is delisted simultaneously. The announcement was released earlier than this round of volatility, so it cannot be used to conclude it caused the rise.
Going forward, watch whether price can re-stand above 0.01050 using the complete hour level and stabilize, rather than only spiking intrahour to 0.01094. If it breaks below this hour’s low of 0.00975 again, then the lower boundary of the current range is lost. Both are validation lines, not target prices or guarantees. In the chart, K-line, OI, and funding data are respectively through 21:02 and 20:00; the complete pre-published ranking list is through 21:16 BJT, and the funding-rate estimate is not a settled value. #PUMPBTC
1
263
·
--
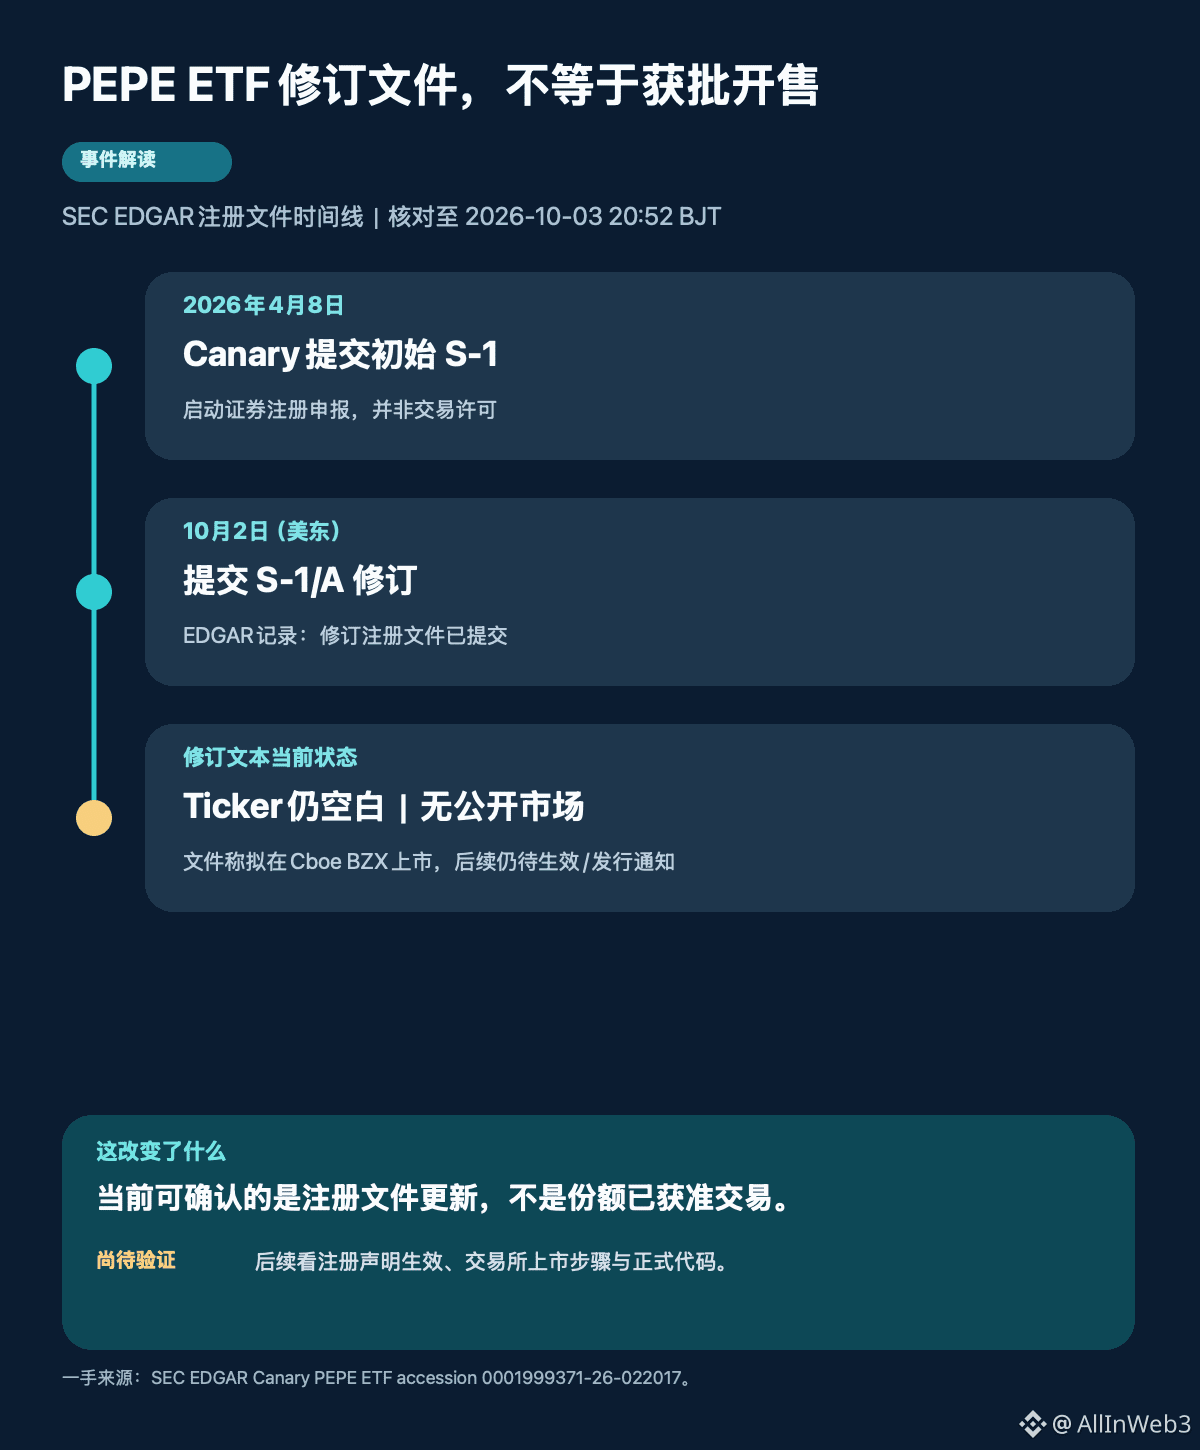
There is an important timing boundary in the PEPE ETF topic: Canary’s filing is a registration statement amendment, not SEC approval for the product to begin trading. The SEC EDGAR filing history shows that the Canary PEPE ETF submitted its initial S-1 on April 8, 2026. The latest S-1/A was dated October 2 (ET). The amendment was received at 21:12:55 ET on October 2, which converts to 09:12:55 Beijing time on October 3—about 11 hours before this round of the leaderboard.
The amended text still lists the proposed exchange as Cboe BZX, leaves the trading ticker blank, and states that there was previously no publicly traded version of that share class. It describes a proposed trust that would hold PEPE and be valued based on the CoinDesk benchmark. The filing also lists BitGo as the digital asset custodian. In other words, the incremental filing updates the issuer’s registration materials, but it does not demonstrate that the SEC has declared the registration effective, that the exchange has completed the listing process, or that investors can already buy shares.
This increment is tied to a new S-1/A registration checkpoint that appeared on October 2. Readers should next track three things separately: when the subsequent registration statement becomes effective, whether the exchange listing arrangements have been completed, and whether the ticker and the official start-of-trading date are published. If any one of these is missing, you cannot write “the ETF has been listed” based on a “submitted filing.”
If the product ultimately issues in the structure described by the filing, it would provide an indirect securities exposure to the PEPE price, and would still be affected by token volatility, benchmark pricing, and custody and trust fees. Holding shares is not the same as directly holding on-chain PEPE. At this stage, there is no basis from this amendment filing to infer new PEPE spot buy orders or to determine an exact listing date. #PEPE #ETF
Also note that shares are not the same asset as the token. If the trust is issued, holders buy and sell securities shares, and the designed price-tracking mechanism will be influenced by fees and by any market discount/premium. The on-chain PEPE spot price would still be set by the exchange and the wallet market. Even if the filing continues to move forward, you still cannot treat the expected fund holdings as PEPE purchases that have already happened. For this news, the most reliable follow-up confirmation is not social media speculation, but the SEC’s subsequent effectiveness order, the exchange’s official listing notification, and the issuer’s clearly stated ticker/date.
There is an important timing boundary in the PEPE ETF topic: Canary’s filing is a registration statement amendment, not SEC approval for the product to begin trading. The SEC EDGAR filing history shows that the Canary PEPE ETF submitted its initial S-1 on April 8, 2026. The latest S-1/A was dated October 2 (ET). The amendment was received at 21:12:55 ET on October 2, which converts to 09:12:55 Beijing time on October 3—about 11 hours before this round of the leaderboard.
The amended text still lists the proposed exchange as Cboe BZX, leaves the trading ticker blank, and states that there was previously no publicly traded version of that share class. It describes a proposed trust that would hold PEPE and be valued based on the CoinDesk benchmark. The filing also lists BitGo as the digital asset custodian. In other words, the incremental filing updates the issuer’s registration materials, but it does not demonstrate that the SEC has declared the registration effective, that the exchange has completed the listing process, or that investors can already buy shares.
This increment is tied to a new S-1/A registration checkpoint that appeared on October 2. Readers should next track three things separately: when the subsequent registration statement becomes effective, whether the exchange listing arrangements have been completed, and whether the ticker and the official start-of-trading date are published. If any one of these is missing, you cannot write “the ETF has been listed” based on a “submitted filing.”
If the product ultimately issues in the structure described by the filing, it would provide an indirect securities exposure to the PEPE price, and would still be affected by token volatility, benchmark pricing, and custody and trust fees. Holding shares is not the same as directly holding on-chain PEPE. At this stage, there is no basis from this amendment filing to infer new PEPE spot buy orders or to determine an exact listing date. #PEPE #ETF
Also note that shares are not the same asset as the token. If the trust is issued, holders buy and sell securities shares, and the designed price-tracking mechanism will be influenced by fees and by any market discount/premium. The on-chain PEPE spot price would still be set by the exchange and the wallet market. Even if the filing continues to move forward, you still cannot treat the expected fund holdings as PEPE purchases that have already happened. For this news, the most reliable follow-up confirmation is not social media speculation, but the SEC’s subsequent effectiveness order, the exchange’s official listing notification, and the issuer’s clearly stated ticker/date.
The amended text still lists the proposed exchange as Cboe BZX, leaves the trading ticker blank, and states that there was previously no publicly traded version of that share class. It describes a proposed trust that would hold PEPE and be valued based on the CoinDesk benchmark. The filing also lists BitGo as the digital asset custodian. In other words, the incremental filing updates the issuer’s registration materials, but it does not demonstrate that the SEC has declared the registration effective, that the exchange has completed the listing process, or that investors can already buy shares.
This increment is tied to a new S-1/A registration checkpoint that appeared on October 2. Readers should next track three things separately: when the subsequent registration statement becomes effective, whether the exchange listing arrangements have been completed, and whether the ticker and the official start-of-trading date are published. If any one of these is missing, you cannot write “the ETF has been listed” based on a “submitted filing.”
If the product ultimately issues in the structure described by the filing, it would provide an indirect securities exposure to the PEPE price, and would still be affected by token volatility, benchmark pricing, and custody and trust fees. Holding shares is not the same as directly holding on-chain PEPE. At this stage, there is no basis from this amendment filing to infer new PEPE spot buy orders or to determine an exact listing date. #PEPE #ETF
Also note that shares are not the same asset as the token. If the trust is issued, holders buy and sell securities shares, and the designed price-tracking mechanism will be influenced by fees and by any market discount/premium. The on-chain PEPE spot price would still be set by the exchange and the wallet market. Even if the filing continues to move forward, you still cannot treat the expected fund holdings as PEPE purchases that have already happened. For this news, the most reliable follow-up confirmation is not social media speculation, but the SEC’s subsequent effectiveness order, the exchange’s official listing notification, and the issuer’s clearly stated ticker/date.
78
·
--
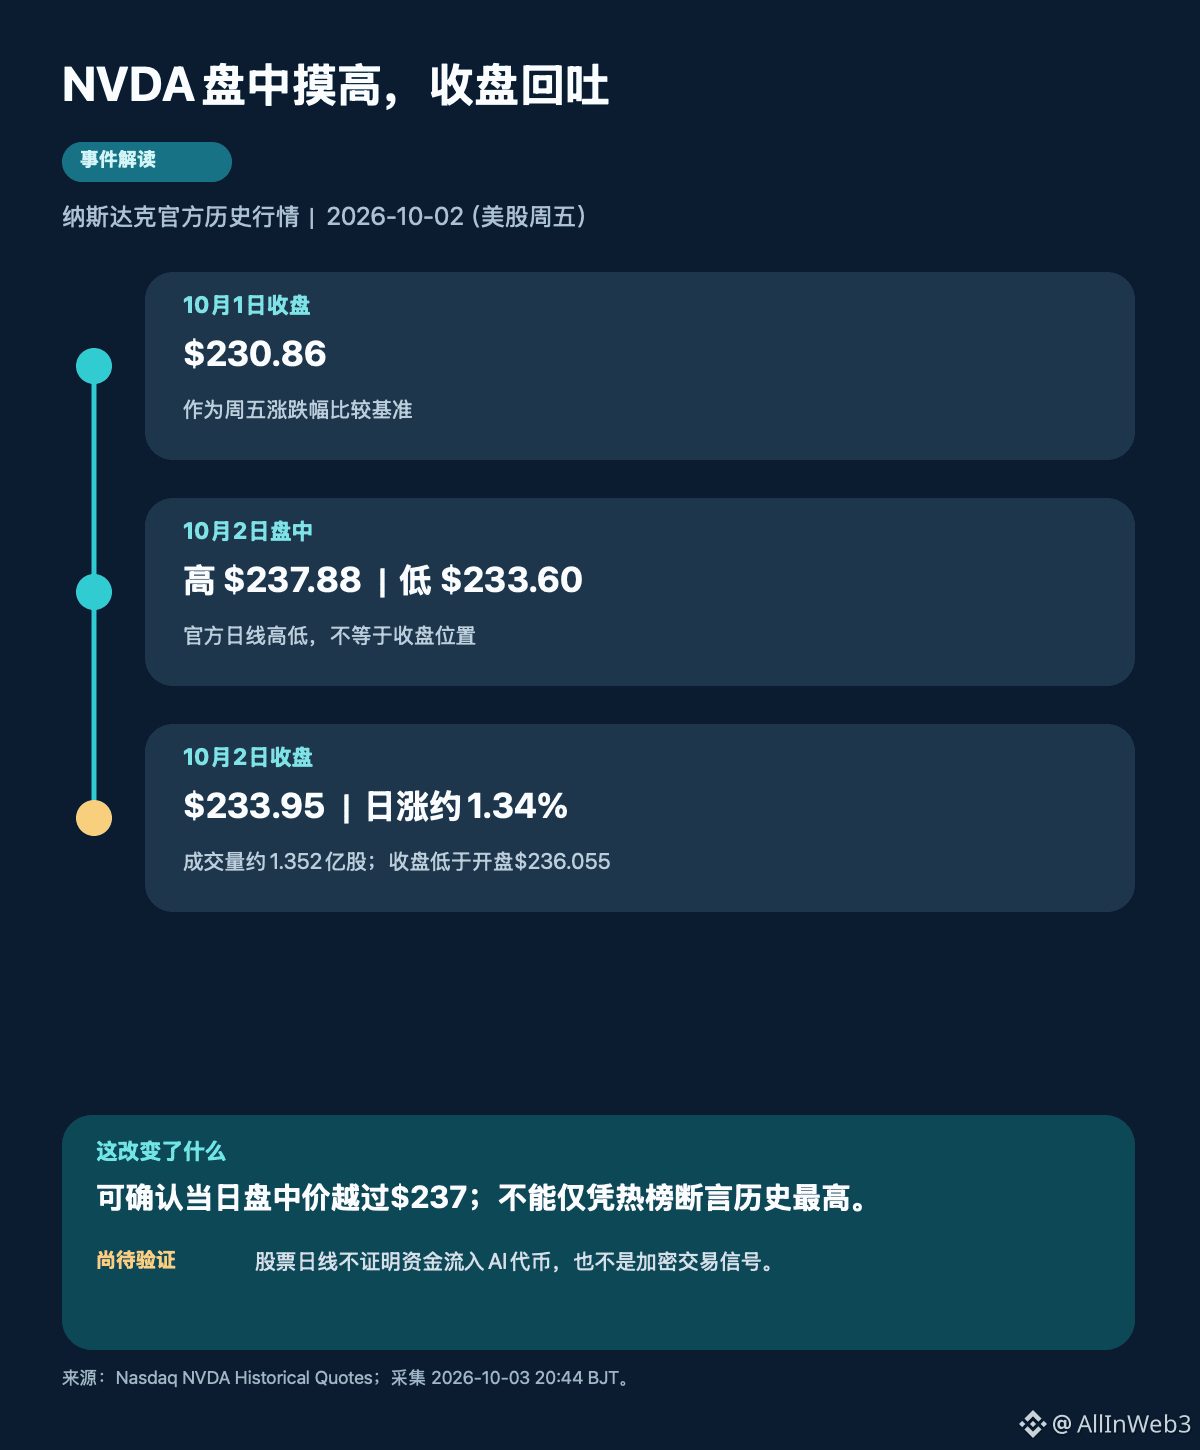
$NVDA hot-list posts “records broken, up 2.4%”—separate the intraday move from the close first. Nasdaq’s official historical quotes show that on October 2, 2026 (Friday), NVDA opened at $236.055, hit an intraday high of $237.88 and a low of $233.60, and closed at $233.95; the close on October 1 was $230.86. Therefore, Friday’s close rose by about 1.34% versus the prior close, not 2.4%; the 2.4% figure is closer to the intraday gain. The day’s trading volume was about 135.2 million shares.
This set of data can confirm the intraday high that day, but it cannot independently prove “a new all-time high.” The Nasdaq page shows a 52-week range upper bound of $236.54, with the page’s quote marked as of October 1; that figure is below October 2’s intraday high, but it is not the fully updated range statistics. To avoid treating the hot-list headline as evidence, this article only says “touched $237.88 intraday,” and does not write the entire historical record as independently verified. The fact that price topped out intraday and still closed at $233.95 also shows that the high point and the day’s closing position are not the same thing.
In the past ~24 hours, this account published reports on NVIDIA’s collaboration with OpenAI/Cerebras on compute; that discussion was about infrastructure news and the boundaries of its evidence—not this stock’s price path. What’s added here is daily OHLC and volume cross-checking, along with a breakdown of the hot-list “+2.4%/record” framing.
NVDA is a stock, not a crypto asset. Even if AI stocks are strong, whether RENDER, FET, or TAO move in sync still depends on each one’s on-chain demand, liquidity, and price structure; a single day’s stock action cannot prove capital inflows into AI tokens, nor does it constitute a buy signal. Data is as of the Nasdaq close on October 2.#NVDA #AI
Volume is also worth placing in the right context: on October 2, it was about 135.2 million shares, higher than the prior trading day’s ~98.59 million, an increase of roughly 37%. This indicates more active trading that day, but volume alone cannot confirm that a breakout is valid; the closing price was still below the day’s opening at $236.055. If later discussions ask whether it “holds after making new highs,” at minimum you should look at whether closes in the following trading days can stay above/within the breakout area, and you cannot treat a single intraday high as trend confirmation.
$NVDA hot-list posts “records broken, up 2.4%”—separate the intraday move from the close first. Nasdaq’s official historical quotes show that on October 2, 2026 (Friday), NVDA opened at $236.055, hit an intraday high of $237.88 and a low of $233.60, and closed at $233.95; the close on October 1 was $230.86. Therefore, Friday’s close rose by about 1.34% versus the prior close, not 2.4%; the 2.4% figure is closer to the intraday gain. The day’s trading volume was about 135.2 million shares.
This set of data can confirm the intraday high that day, but it cannot independently prove “a new all-time high.” The Nasdaq page shows a 52-week range upper bound of $236.54, with the page’s quote marked as of October 1; that figure is below October 2’s intraday high, but it is not the fully updated range statistics. To avoid treating the hot-list headline as evidence, this article only says “touched $237.88 intraday,” and does not write the entire historical record as independently verified. The fact that price topped out intraday and still closed at $233.95 also shows that the high point and the day’s closing position are not the same thing.
In the past ~24 hours, this account published reports on NVIDIA’s collaboration with OpenAI/Cerebras on compute; that discussion was about infrastructure news and the boundaries of its evidence—not this stock’s price path. What’s added here is daily OHLC and volume cross-checking, along with a breakdown of the hot-list “+2.4%/record” framing.
NVDA is a stock, not a crypto asset. Even if AI stocks are strong, whether RENDER, FET, or TAO move in sync still depends on each one’s on-chain demand, liquidity, and price structure; a single day’s stock action cannot prove capital inflows into AI tokens, nor does it constitute a buy signal. Data is as of the Nasdaq close on October 2.#NVDA #AI
Volume is also worth placing in the right context: on October 2, it was about 135.2 million shares, higher than the prior trading day’s ~98.59 million, an increase of roughly 37%. This indicates more active trading that day, but volume alone cannot confirm that a breakout is valid; the closing price was still below the day’s opening at $236.055. If later discussions ask whether it “holds after making new highs,” at minimum you should look at whether closes in the following trading days can stay above/within the breakout area, and you cannot treat a single intraday high as trend confirmation.
This set of data can confirm the intraday high that day, but it cannot independently prove “a new all-time high.” The Nasdaq page shows a 52-week range upper bound of $236.54, with the page’s quote marked as of October 1; that figure is below October 2’s intraday high, but it is not the fully updated range statistics. To avoid treating the hot-list headline as evidence, this article only says “touched $237.88 intraday,” and does not write the entire historical record as independently verified. The fact that price topped out intraday and still closed at $233.95 also shows that the high point and the day’s closing position are not the same thing.
In the past ~24 hours, this account published reports on NVIDIA’s collaboration with OpenAI/Cerebras on compute; that discussion was about infrastructure news and the boundaries of its evidence—not this stock’s price path. What’s added here is daily OHLC and volume cross-checking, along with a breakdown of the hot-list “+2.4%/record” framing.
NVDA is a stock, not a crypto asset. Even if AI stocks are strong, whether RENDER, FET, or TAO move in sync still depends on each one’s on-chain demand, liquidity, and price structure; a single day’s stock action cannot prove capital inflows into AI tokens, nor does it constitute a buy signal. Data is as of the Nasdaq close on October 2.#NVDA #AI
Volume is also worth placing in the right context: on October 2, it was about 135.2 million shares, higher than the prior trading day’s ~98.59 million, an increase of roughly 37%. This indicates more active trading that day, but volume alone cannot confirm that a breakout is valid; the closing price was still below the day’s opening at $236.055. If later discussions ask whether it “holds after making new highs,” at minimum you should look at whether closes in the following trading days can stay above/within the breakout area, and you cannot treat a single intraday high as trend confirmation.
23
·
--
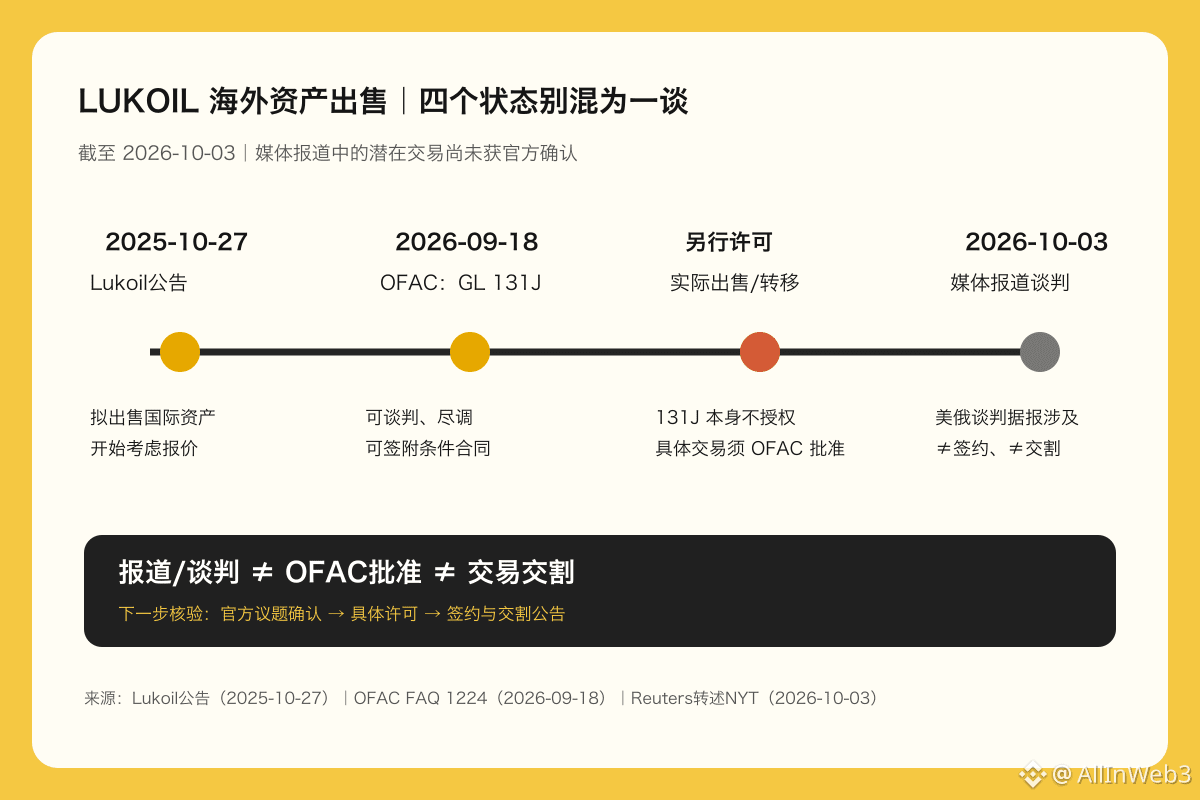
A report says Lukoil’s “multi-billion-dollar deal” involving overseas assets has entered U.S.-Russia negotiations, but the report does not mean approval has been granted, nor does it mean the deal has been closed. On October 3, Reuters, citing The New York Times, said that the U.S.-Russia talks involve a potential transaction that is contingent upon approval by the U.S. government and the Kremlin; as of the time of the report, the White House, the U.S. Treasury, and Lukoil had not responded. The buyer’s arrangements and negotiation details are still media-reported statements from sources, and cannot be written as already-signed facts.
The key boundary in this matter lies in sanctions licensing. Lukoil announced as early as October 27, 2025, that, due to restrictions implemented by some countries, it planned to sell its international assets and began considering potential buyer offers. OFAC’s FAQ 1224, updated on September 18, explains that General License 131J allows negotiations, due diligence, and signing conditional contracts related to the sale of Lukoil International GmbH and its majority-owned subsidiaries, with a deadline of October 22, 2026; however, it clearly does not authorize the actual sale, disposition, or transfer of assets. Any contract would require additional OFAC authorization.
So what’s new today is the reporting thread that “the deal topic has entered U.S.-Russia talks,” not that the sanctions gate is already open. Even if negotiations continue, it still depends on whether OFAC approves it, whether the transaction structure can sever the relationship between LIG and Lukoil, and how the sale proceeds are handled under the sanctions framework. Prior deal offers or buyer rumors cannot replace these conditions.
Next, three verifiable milestones should be monitored: whether the U.S. and Russia sides officially confirm the subject; whether OFAC issues authorization for the specific transaction; and whether Lukoil or the buyer announces the signing and closing. The three represent negotiations, regulatory licensing, and deal completion, respectively, and must not be conflated. For the oil market, even if the news is true, the impact chain is not simply that “the supply changes because assets are sold.” It also depends on the scope of the assets, operational continuity, the buyer’s control, how sale proceeds are frozen or handled, and the sanctions authorizations. Lukoil’s announcement confirms an intention to sell; OFAC documents define the limits of the license; and media reports provide negotiation leads, with different evidentiary standards. At present, there is not enough basis to judge when the transaction will be completed, nor can this be used to infer any one-directional trend in oil prices or related assets. #Lukoil #sanctions
A report says Lukoil’s “multi-billion-dollar deal” involving overseas assets has entered U.S.-Russia negotiations, but the report does not mean approval has been granted, nor does it mean the deal has been closed. On October 3, Reuters, citing The New York Times, said that the U.S.-Russia talks involve a potential transaction that is contingent upon approval by the U.S. government and the Kremlin; as of the time of the report, the White House, the U.S. Treasury, and Lukoil had not responded. The buyer’s arrangements and negotiation details are still media-reported statements from sources, and cannot be written as already-signed facts.
The key boundary in this matter lies in sanctions licensing. Lukoil announced as early as October 27, 2025, that, due to restrictions implemented by some countries, it planned to sell its international assets and began considering potential buyer offers. OFAC’s FAQ 1224, updated on September 18, explains that General License 131J allows negotiations, due diligence, and signing conditional contracts related to the sale of Lukoil International GmbH and its majority-owned subsidiaries, with a deadline of October 22, 2026; however, it clearly does not authorize the actual sale, disposition, or transfer of assets. Any contract would require additional OFAC authorization.
So what’s new today is the reporting thread that “the deal topic has entered U.S.-Russia talks,” not that the sanctions gate is already open. Even if negotiations continue, it still depends on whether OFAC approves it, whether the transaction structure can sever the relationship between LIG and Lukoil, and how the sale proceeds are handled under the sanctions framework. Prior deal offers or buyer rumors cannot replace these conditions.
Next, three verifiable milestones should be monitored: whether the U.S. and Russia sides officially confirm the subject; whether OFAC issues authorization for the specific transaction; and whether Lukoil or the buyer announces the signing and closing. The three represent negotiations, regulatory licensing, and deal completion, respectively, and must not be conflated. For the oil market, even if the news is true, the impact chain is not simply that “the supply changes because assets are sold.” It also depends on the scope of the assets, operational continuity, the buyer’s control, how sale proceeds are frozen or handled, and the sanctions authorizations. Lukoil’s announcement confirms an intention to sell; OFAC documents define the limits of the license; and media reports provide negotiation leads, with different evidentiary standards. At present, there is not enough basis to judge when the transaction will be completed, nor can this be used to infer any one-directional trend in oil prices or related assets. #Lukoil #sanctions
The key boundary in this matter lies in sanctions licensing. Lukoil announced as early as October 27, 2025, that, due to restrictions implemented by some countries, it planned to sell its international assets and began considering potential buyer offers. OFAC’s FAQ 1224, updated on September 18, explains that General License 131J allows negotiations, due diligence, and signing conditional contracts related to the sale of Lukoil International GmbH and its majority-owned subsidiaries, with a deadline of October 22, 2026; however, it clearly does not authorize the actual sale, disposition, or transfer of assets. Any contract would require additional OFAC authorization.
So what’s new today is the reporting thread that “the deal topic has entered U.S.-Russia talks,” not that the sanctions gate is already open. Even if negotiations continue, it still depends on whether OFAC approves it, whether the transaction structure can sever the relationship between LIG and Lukoil, and how the sale proceeds are handled under the sanctions framework. Prior deal offers or buyer rumors cannot replace these conditions.
Next, three verifiable milestones should be monitored: whether the U.S. and Russia sides officially confirm the subject; whether OFAC issues authorization for the specific transaction; and whether Lukoil or the buyer announces the signing and closing. The three represent negotiations, regulatory licensing, and deal completion, respectively, and must not be conflated. For the oil market, even if the news is true, the impact chain is not simply that “the supply changes because assets are sold.” It also depends on the scope of the assets, operational continuity, the buyer’s control, how sale proceeds are frozen or handled, and the sanctions authorizations. Lukoil’s announcement confirms an intention to sell; OFAC documents define the limits of the license; and media reports provide negotiation leads, with different evidentiary standards. At present, there is not enough basis to judge when the transaction will be completed, nor can this be used to infer any one-directional trend in oil prices or related assets. #Lukoil #sanctions
20
·
--
$VELVET squeezes into Binance’s top gainers list at #2. After a short-term pullback, it shows signs of repair, but we still can’t write it as a trend reversal. From my observation, I’m not going to chase longs.
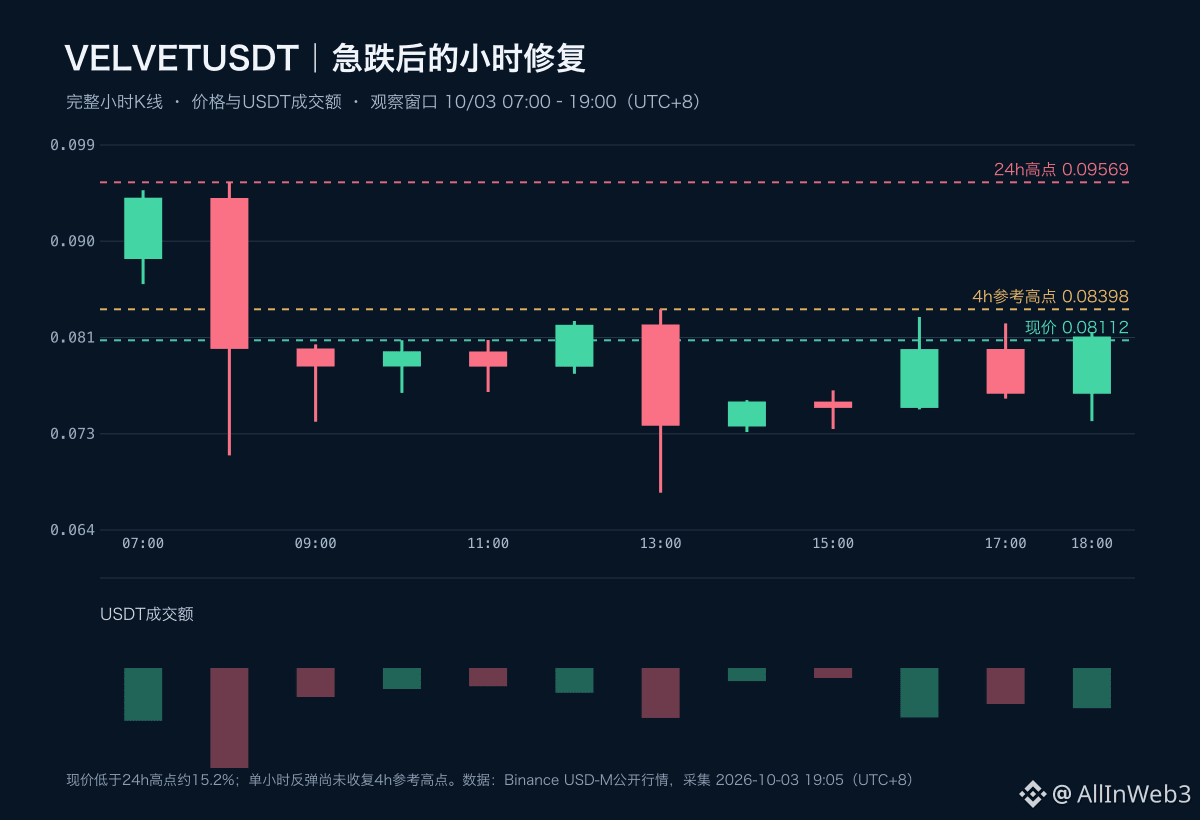
At 19:09 Beijing time on October 3, Binance completed a full scan of 526 USDT perpetual contracts within the specified range. VELVETUSDT’s rolling 24-hour gain is +27.391%, the collection price is 0.08097, ranking #2. At 19:05, the single-coin market price is about 0.08112. Both time points are roughly 15% below the 24-hour high of 0.09569.
The ranking reflects the intensity of the move, not a long signal.
Compared with the previous observation at 17:07 on this account, the incremental update lies in two newly formed complete hourly candles. From 17:00 to 18:00, it opened at 0.08032, surged to 0.08268, then pulled back to close at 0.07620, with trades of about 7.157 million USDT. From 18:00 to 19:00, it dipped to a low of 0.07367, then recovered and closed at 0.08147. Over that single hour, the price rose about 6.93% from the open, and volume was about 8.001 million USDT—roughly 11.8% more than the prior hour. This suggests dip-side bids pulled the price back, but the close still hasn’t broken above the earlier hourly high at 0.08268. A single rebound candle can’t prove that selling pressure has ended.
Positioning and funding-rate boundaries also need to be considered. Binance’s 1-hour position-size sample increased from about 79.14 million coins at 18:00 to about 81.88 million at 19:00—up about 3.47%. OI growth only indicates that open positions have expanded; it doesn’t necessarily mean net long inflows. The most recently settled funding rate is +0.006532%, while the estimated next funding rate is about +0.016903%. The estimated value will change; a positive funding rate means the long side pays the funding cost and cannot be taken as confirmation of an upside move.
Structurally: the most recent four-hour candles from 12:00 to 16:00 closed at 0.07489, with a low at 0.06707. The current 16:00 to 20:00 four-hour candle hasn’t finished yet. The latest update currently visible on the project’s official blog is product integration information dated September 29. I haven’t found a new announcement that can be verified as the direct cause of this round of volatility, and the timing sequence alone can’t establish causality.
Next, we’ll first see whether a full hourly candle can stand above 0.08268. Then we’ll observe whether the reference four-hour high near 0.08398 is reclaimed and whether pullbacks have follow-through. If it falls back below 0.07367, then this repair must be downgraded. For now, it’s more suitable to wait for confirmation rather than chase longs based on the leaderboard. After changes in price, ranking, and unsettled funding rate, the observation points above must be recalculated. The market structure and position snapshot were collected at 19:05 on October 3; the full leaderboard was rechecked at 19:09 before publication. Data comes from Binance’s publicly available USD-M API.
$VELVET squeezes into Binance’s top gainers list at #2. After a short-term pullback, it shows signs of repair, but we still can’t write it as a trend reversal. From my observation, I’m not going to chase longs.
At 19:09 Beijing time on October 3, Binance completed a full scan of 526 USDT perpetual contracts within the specified range. VELVETUSDT’s rolling 24-hour gain is +27.391%, the collection price is 0.08097, ranking #2. At 19:05, the single-coin market price is about 0.08112. Both time points are roughly 15% below the 24-hour high of 0.09569.
The ranking reflects the intensity of the move, not a long signal.
Compared with the previous observation at 17:07 on this account, the incremental update lies in two newly formed complete hourly candles. From 17:00 to 18:00, it opened at 0.08032, surged to 0.08268, then pulled back to close at 0.07620, with trades of about 7.157 million USDT. From 18:00 to 19:00, it dipped to a low of 0.07367, then recovered and closed at 0.08147. Over that single hour, the price rose about 6.93% from the open, and volume was about 8.001 million USDT—roughly 11.8% more than the prior hour. This suggests dip-side bids pulled the price back, but the close still hasn’t broken above the earlier hourly high at 0.08268. A single rebound candle can’t prove that selling pressure has ended.
Positioning and funding-rate boundaries also need to be considered. Binance’s 1-hour position-size sample increased from about 79.14 million coins at 18:00 to about 81.88 million at 19:00—up about 3.47%. OI growth only indicates that open positions have expanded; it doesn’t necessarily mean net long inflows. The most recently settled funding rate is +0.006532%, while the estimated next funding rate is about +0.016903%. The estimated value will change; a positive funding rate means the long side pays the funding cost and cannot be taken as confirmation of an upside move.
Structurally: the most recent four-hour candles from 12:00 to 16:00 closed at 0.07489, with a low at 0.06707. The current 16:00 to 20:00 four-hour candle hasn’t finished yet. The latest update currently visible on the project’s official blog is product integration information dated September 29. I haven’t found a new announcement that can be verified as the direct cause of this round of volatility, and the timing sequence alone can’t establish causality.
Next, we’ll first see whether a full hourly candle can stand above 0.08268. Then we’ll observe whether the reference four-hour high near 0.08398 is reclaimed and whether pullbacks have follow-through. If it falls back below 0.07367, then this repair must be downgraded. For now, it’s more suitable to wait for confirmation rather than chase longs based on the leaderboard. After changes in price, ranking, and unsettled funding rate, the observation points above must be recalculated. The market structure and position snapshot were collected at 19:05 on October 3; the full leaderboard was rechecked at 19:09 before publication. Data comes from Binance’s publicly available USD-M API.
At 19:09 Beijing time on October 3, Binance completed a full scan of 526 USDT perpetual contracts within the specified range. VELVETUSDT’s rolling 24-hour gain is +27.391%, the collection price is 0.08097, ranking #2. At 19:05, the single-coin market price is about 0.08112. Both time points are roughly 15% below the 24-hour high of 0.09569.
The ranking reflects the intensity of the move, not a long signal.
Compared with the previous observation at 17:07 on this account, the incremental update lies in two newly formed complete hourly candles. From 17:00 to 18:00, it opened at 0.08032, surged to 0.08268, then pulled back to close at 0.07620, with trades of about 7.157 million USDT. From 18:00 to 19:00, it dipped to a low of 0.07367, then recovered and closed at 0.08147. Over that single hour, the price rose about 6.93% from the open, and volume was about 8.001 million USDT—roughly 11.8% more than the prior hour. This suggests dip-side bids pulled the price back, but the close still hasn’t broken above the earlier hourly high at 0.08268. A single rebound candle can’t prove that selling pressure has ended.
Positioning and funding-rate boundaries also need to be considered. Binance’s 1-hour position-size sample increased from about 79.14 million coins at 18:00 to about 81.88 million at 19:00—up about 3.47%. OI growth only indicates that open positions have expanded; it doesn’t necessarily mean net long inflows. The most recently settled funding rate is +0.006532%, while the estimated next funding rate is about +0.016903%. The estimated value will change; a positive funding rate means the long side pays the funding cost and cannot be taken as confirmation of an upside move.
Structurally: the most recent four-hour candles from 12:00 to 16:00 closed at 0.07489, with a low at 0.06707. The current 16:00 to 20:00 four-hour candle hasn’t finished yet. The latest update currently visible on the project’s official blog is product integration information dated September 29. I haven’t found a new announcement that can be verified as the direct cause of this round of volatility, and the timing sequence alone can’t establish causality.
Next, we’ll first see whether a full hourly candle can stand above 0.08268. Then we’ll observe whether the reference four-hour high near 0.08398 is reclaimed and whether pullbacks have follow-through. If it falls back below 0.07367, then this repair must be downgraded. For now, it’s more suitable to wait for confirmation rather than chase longs based on the leaderboard. After changes in price, ranking, and unsettled funding rate, the observation points above must be recalculated. The market structure and position snapshot were collected at 19:05 on October 3; the full leaderboard was rechecked at 19:09 before publication. Data comes from Binance’s publicly available USD-M API.
26
·
--
$SAND bounced back and then fell again; I won’t chase it for now. The key is whether the repair can achieve a full close and confirmed trading volume, not whether it is still listed near the front of the gainers.
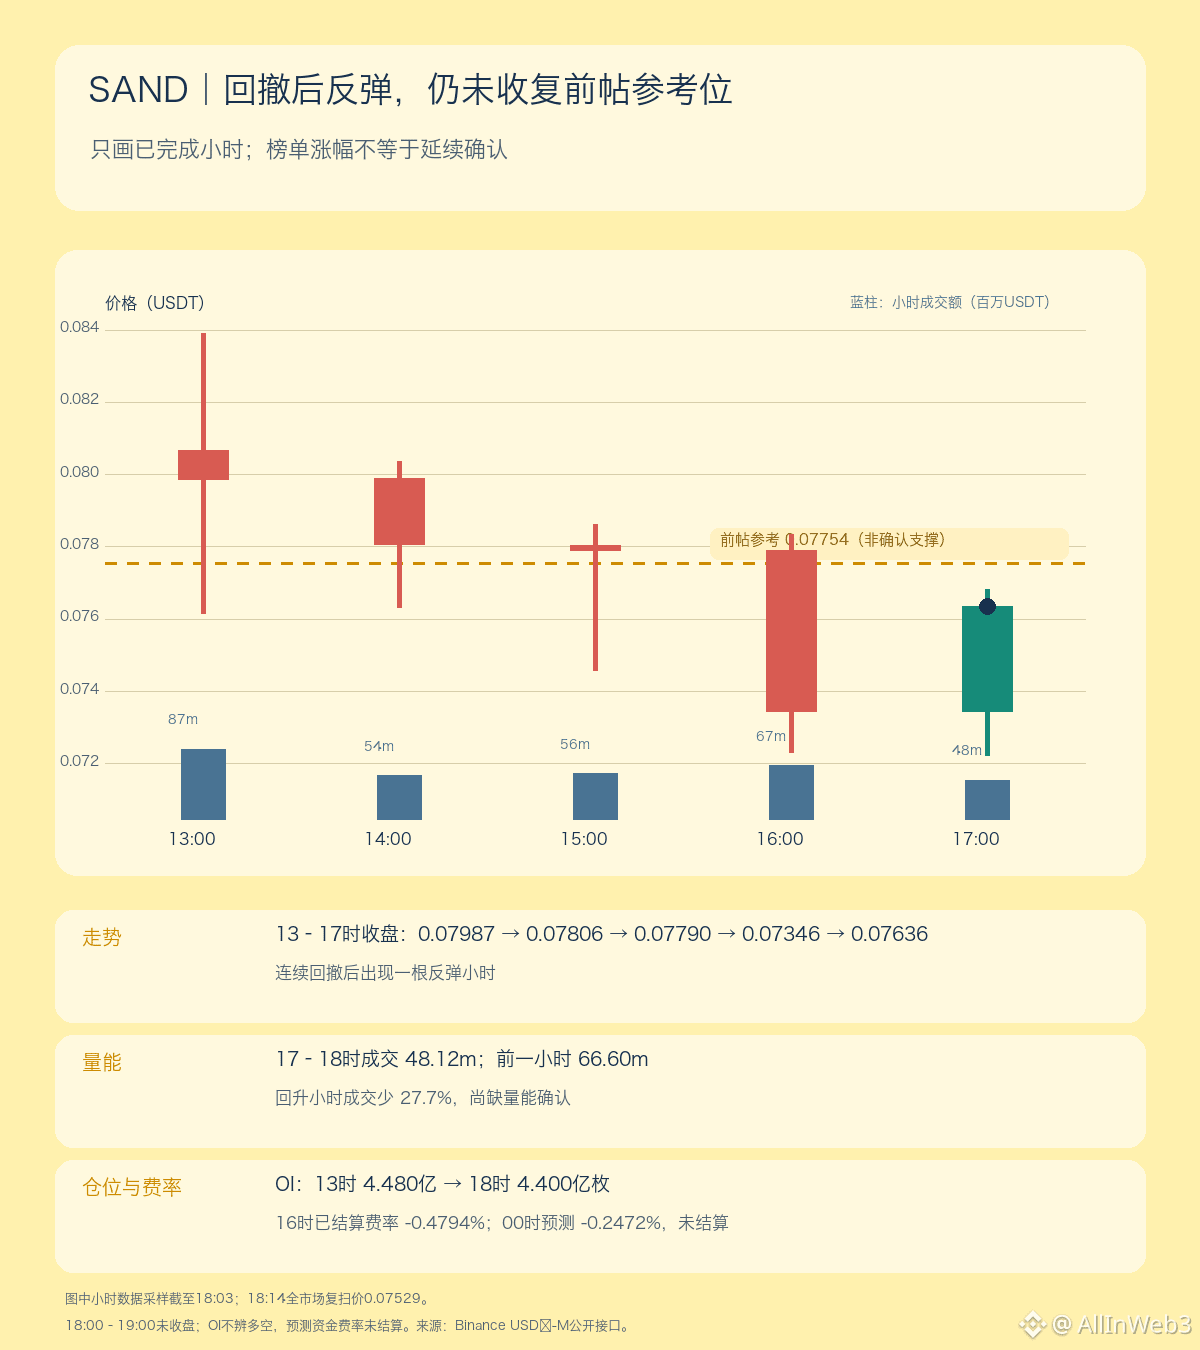
At 18:14 Beijing time, a full scan covering 526/526 Binance USDT perpetuals shows SANDUSDT ranked #2, with a rolling 24-hour gain of +22.602% and a price of 0.07529; trading volume is about $1.349 billion. At 18:03 the single-coin quote was 0.07704; about 11 minutes later, the scan price was down 2.3%. The rolling gain is affected by the moving 24-hour window, so it can’t be treated as the actual drop over that period. Compared with the scan price of 0.08165 cited in this account’s 13:13 prior post, the scan has pulled back about 7.8%. The latest full hour from 17:00 to 18:00 closed at 0.07636, about 5.4% lower than the 12:00–13:00 close of 0.08070 in the prior post. The rolling 24-hour trading volume is up about 11% versus the prior post, but the flow is mixed active buying and selling, so it can’t be considered net buying.
The hourly path isn’t a one-way decline: the close fell from 0.07987 at 13:00 to 0.07346 at 17:00, then rebounded to 0.07636 from 17:00 to 18:00. However, the rebound hour’s trading volume was about $48.12 million, down about 27.7% from roughly $66.60 million in the prior hour. 0.07222 hasn’t yet been broken by a full hourly close, but the current price at 18:14 is already below the previous hour’s close. The 18:00–19:00 hour isn’t finished yet, so this is only a “in-the-moment” condition on the chart. The reference level from the prior post, 0.07754, is still below it; you can’t call an intrahour brief reclaim the “recovery” of a level that hasn’t closed.
Positioning and fee rates haven’t been given with a clear direction. The hourly OI sample fell from about 448 million coins at 13:00 to about 440 million at 18:00—down around 1.8% net—with a drop first and then a rebound in between. OI doesn’t distinguish long vs short. The funding rate that was settled at 16:00 is -0.4794%; the 00:00 interface forecast for the next period is about -0.2472%, and it hasn’t been settled yet. A negative funding rate means the shorts pay to longs in that period; it doesn’t mean shorts are crowded or a squeeze is imminent.
Coinone and Bithumb lifted the SAND trading warning and resumed deposits/withdrawals on October 2. That is confirmed background already verified in the prior post, not new news for this wave. I didn’t find any explanation for these particular new candles in the hourly chart. Next, we’ll see whether a full hourly close can reclaim 0.07754 alongside an increase in trading volume, and whether 0.07222 can hold near that level. If rebound volume continues to contract or if a full hourly close breaks below the low, then the “repair” assessment should be downgraded. The market moves fast; after 18:14, the evaluation needs to be recalculated with the new data. #SAND
$SAND bounced back and then fell again; I won’t chase it for now. The key is whether the repair can achieve a full close and confirmed trading volume, not whether it is still listed near the front of the gainers.
At 18:14 Beijing time, a full scan covering 526/526 Binance USDT perpetuals shows SANDUSDT ranked #2, with a rolling 24-hour gain of +22.602% and a price of 0.07529; trading volume is about $1.349 billion. At 18:03 the single-coin quote was 0.07704; about 11 minutes later, the scan price was down 2.3%. The rolling gain is affected by the moving 24-hour window, so it can’t be treated as the actual drop over that period. Compared with the scan price of 0.08165 cited in this account’s 13:13 prior post, the scan has pulled back about 7.8%. The latest full hour from 17:00 to 18:00 closed at 0.07636, about 5.4% lower than the 12:00–13:00 close of 0.08070 in the prior post. The rolling 24-hour trading volume is up about 11% versus the prior post, but the flow is mixed active buying and selling, so it can’t be considered net buying.
The hourly path isn’t a one-way decline: the close fell from 0.07987 at 13:00 to 0.07346 at 17:00, then rebounded to 0.07636 from 17:00 to 18:00. However, the rebound hour’s trading volume was about $48.12 million, down about 27.7% from roughly $66.60 million in the prior hour. 0.07222 hasn’t yet been broken by a full hourly close, but the current price at 18:14 is already below the previous hour’s close. The 18:00–19:00 hour isn’t finished yet, so this is only a “in-the-moment” condition on the chart. The reference level from the prior post, 0.07754, is still below it; you can’t call an intrahour brief reclaim the “recovery” of a level that hasn’t closed.
Positioning and fee rates haven’t been given with a clear direction. The hourly OI sample fell from about 448 million coins at 13:00 to about 440 million at 18:00—down around 1.8% net—with a drop first and then a rebound in between. OI doesn’t distinguish long vs short. The funding rate that was settled at 16:00 is -0.4794%; the 00:00 interface forecast for the next period is about -0.2472%, and it hasn’t been settled yet. A negative funding rate means the shorts pay to longs in that period; it doesn’t mean shorts are crowded or a squeeze is imminent.
Coinone and Bithumb lifted the SAND trading warning and resumed deposits/withdrawals on October 2. That is confirmed background already verified in the prior post, not new news for this wave. I didn’t find any explanation for these particular new candles in the hourly chart. Next, we’ll see whether a full hourly close can reclaim 0.07754 alongside an increase in trading volume, and whether 0.07222 can hold near that level. If rebound volume continues to contract or if a full hourly close breaks below the low, then the “repair” assessment should be downgraded. The market moves fast; after 18:14, the evaluation needs to be recalculated with the new data. #SAND
At 18:14 Beijing time, a full scan covering 526/526 Binance USDT perpetuals shows SANDUSDT ranked #2, with a rolling 24-hour gain of +22.602% and a price of 0.07529; trading volume is about $1.349 billion. At 18:03 the single-coin quote was 0.07704; about 11 minutes later, the scan price was down 2.3%. The rolling gain is affected by the moving 24-hour window, so it can’t be treated as the actual drop over that period. Compared with the scan price of 0.08165 cited in this account’s 13:13 prior post, the scan has pulled back about 7.8%. The latest full hour from 17:00 to 18:00 closed at 0.07636, about 5.4% lower than the 12:00–13:00 close of 0.08070 in the prior post. The rolling 24-hour trading volume is up about 11% versus the prior post, but the flow is mixed active buying and selling, so it can’t be considered net buying.
The hourly path isn’t a one-way decline: the close fell from 0.07987 at 13:00 to 0.07346 at 17:00, then rebounded to 0.07636 from 17:00 to 18:00. However, the rebound hour’s trading volume was about $48.12 million, down about 27.7% from roughly $66.60 million in the prior hour. 0.07222 hasn’t yet been broken by a full hourly close, but the current price at 18:14 is already below the previous hour’s close. The 18:00–19:00 hour isn’t finished yet, so this is only a “in-the-moment” condition on the chart. The reference level from the prior post, 0.07754, is still below it; you can’t call an intrahour brief reclaim the “recovery” of a level that hasn’t closed.
Positioning and fee rates haven’t been given with a clear direction. The hourly OI sample fell from about 448 million coins at 13:00 to about 440 million at 18:00—down around 1.8% net—with a drop first and then a rebound in between. OI doesn’t distinguish long vs short. The funding rate that was settled at 16:00 is -0.4794%; the 00:00 interface forecast for the next period is about -0.2472%, and it hasn’t been settled yet. A negative funding rate means the shorts pay to longs in that period; it doesn’t mean shorts are crowded or a squeeze is imminent.
Coinone and Bithumb lifted the SAND trading warning and resumed deposits/withdrawals on October 2. That is confirmed background already verified in the prior post, not new news for this wave. I didn’t find any explanation for these particular new candles in the hourly chart. Next, we’ll see whether a full hourly close can reclaim 0.07754 alongside an increase in trading volume, and whether 0.07222 can hold near that level. If rebound volume continues to contract or if a full hourly close breaks below the low, then the “repair” assessment should be downgraded. The market moves fast; after 18:14, the evaluation needs to be recalculated with the new data. #SAND
1
257
·
--
$VVV currently looks more like a weak rebound after a drop. I’ll watch for now and won’t directly equate the “annual emissions reduction” with a price reversal.
As of 17:17 Beijing time on October 3, the VVV/WETH pool on the Base chain Aerodrome is quoting around $27.57. Over the past rolling 24 hours, the pool is down 6.67%, with about $2.18 million in volume. The last 24 closed hourly candlesticks moved from roughly $29.84 to $27.55. In this segment, the high was $30.31 and the low was $27.14. The most recent complete hour closed slightly higher, but the price is still below the prior traded range around $28.19. This suggests there are signs that selling pressure has eased, but buyers have not yet reclaimed the key area.
Note: what’s quoted here is an on-chain pool, not Binance spot pricing. Trading volume within one pool alone can’t represent the whole market.
There’s a supply-side change worth tracking. Venice’s plan updated on August 5 states that VVV’s annualized emissions will fall from 2.5 million tokens to 2.0 million tokens starting October 1—about a 20% reduction. This is a reduction in issuance rate; it doesn’t mean the total supply will immediately contract, nor does it prove that the on-chain parameters have already switched on the day. You still need to verify actual emissions and subsequent circulating supply.
Another arrangement the project announced in July: for every $100 of API quota sold, $5 is used to buy and burn VVV. The real impact depends on the actual quota sales and burn records; you can’t write the rule as guaranteed buying demand.
VVV’s value thesis is tied to Venice AI usage demand. Official materials describe that by staking VVV, you can lock your staked share to mint DIEM; staking DIEM then grants daily API quota. This provides the token’s product utility, but ultimately it still comes down to whether user usage, lockups, and burns are enough to offset emissions and sell pressure. Just because the product mechanism exists doesn’t necessarily mean the token price must rise.
For the short term, I’ll watch two levels: 27.14 is the low observed on this hourly chart. If it breaks down and can’t be reclaimed, the weakness hasn’t been resolved yet. On the upside, I’ll look first at 28.19. At least a complete hourly close back above it is needed; only then can we judge whether a pullback can hold and whether volume keeps up—otherwise it’s still less like a true repair. Snapshot changes can happen quickly; these levels are only for observation and reference, not limit orders or profit guarantees.
$VVV currently looks more like a weak rebound after a drop. I’ll watch for now and won’t directly equate the “annual emissions reduction” with a price reversal.
As of 17:17 Beijing time on October 3, the VVV/WETH pool on the Base chain Aerodrome is quoting around $27.57. Over the past rolling 24 hours, the pool is down 6.67%, with about $2.18 million in volume. The last 24 closed hourly candlesticks moved from roughly $29.84 to $27.55. In this segment, the high was $30.31 and the low was $27.14. The most recent complete hour closed slightly higher, but the price is still below the prior traded range around $28.19. This suggests there are signs that selling pressure has eased, but buyers have not yet reclaimed the key area.
Note: what’s quoted here is an on-chain pool, not Binance spot pricing. Trading volume within one pool alone can’t represent the whole market.
There’s a supply-side change worth tracking. Venice’s plan updated on August 5 states that VVV’s annualized emissions will fall from 2.5 million tokens to 2.0 million tokens starting October 1—about a 20% reduction. This is a reduction in issuance rate; it doesn’t mean the total supply will immediately contract, nor does it prove that the on-chain parameters have already switched on the day. You still need to verify actual emissions and subsequent circulating supply.
Another arrangement the project announced in July: for every $100 of API quota sold, $5 is used to buy and burn VVV. The real impact depends on the actual quota sales and burn records; you can’t write the rule as guaranteed buying demand.
VVV’s value thesis is tied to Venice AI usage demand. Official materials describe that by staking VVV, you can lock your staked share to mint DIEM; staking DIEM then grants daily API quota. This provides the token’s product utility, but ultimately it still comes down to whether user usage, lockups, and burns are enough to offset emissions and sell pressure. Just because the product mechanism exists doesn’t necessarily mean the token price must rise.
For the short term, I’ll watch two levels: 27.14 is the low observed on this hourly chart. If it breaks down and can’t be reclaimed, the weakness hasn’t been resolved yet. On the upside, I’ll look first at 28.19. At least a complete hourly close back above it is needed; only then can we judge whether a pullback can hold and whether volume keeps up—otherwise it’s still less like a true repair. Snapshot changes can happen quickly; these levels are only for observation and reference, not limit orders or profit guarantees.
As of 17:17 Beijing time on October 3, the VVV/WETH pool on the Base chain Aerodrome is quoting around $27.57. Over the past rolling 24 hours, the pool is down 6.67%, with about $2.18 million in volume. The last 24 closed hourly candlesticks moved from roughly $29.84 to $27.55. In this segment, the high was $30.31 and the low was $27.14. The most recent complete hour closed slightly higher, but the price is still below the prior traded range around $28.19. This suggests there are signs that selling pressure has eased, but buyers have not yet reclaimed the key area.
Note: what’s quoted here is an on-chain pool, not Binance spot pricing. Trading volume within one pool alone can’t represent the whole market.
There’s a supply-side change worth tracking. Venice’s plan updated on August 5 states that VVV’s annualized emissions will fall from 2.5 million tokens to 2.0 million tokens starting October 1—about a 20% reduction. This is a reduction in issuance rate; it doesn’t mean the total supply will immediately contract, nor does it prove that the on-chain parameters have already switched on the day. You still need to verify actual emissions and subsequent circulating supply.
Another arrangement the project announced in July: for every $100 of API quota sold, $5 is used to buy and burn VVV. The real impact depends on the actual quota sales and burn records; you can’t write the rule as guaranteed buying demand.
VVV’s value thesis is tied to Venice AI usage demand. Official materials describe that by staking VVV, you can lock your staked share to mint DIEM; staking DIEM then grants daily API quota. This provides the token’s product utility, but ultimately it still comes down to whether user usage, lockups, and burns are enough to offset emissions and sell pressure. Just because the product mechanism exists doesn’t necessarily mean the token price must rise.
For the short term, I’ll watch two levels: 27.14 is the low observed on this hourly chart. If it breaks down and can’t be reclaimed, the weakness hasn’t been resolved yet. On the upside, I’ll look first at 28.19. At least a complete hourly close back above it is needed; only then can we judge whether a pullback can hold and whether volume keeps up—otherwise it’s still less like a true repair. Snapshot changes can happen quickly; these levels are only for observation and reference, not limit orders or profit guarantees.
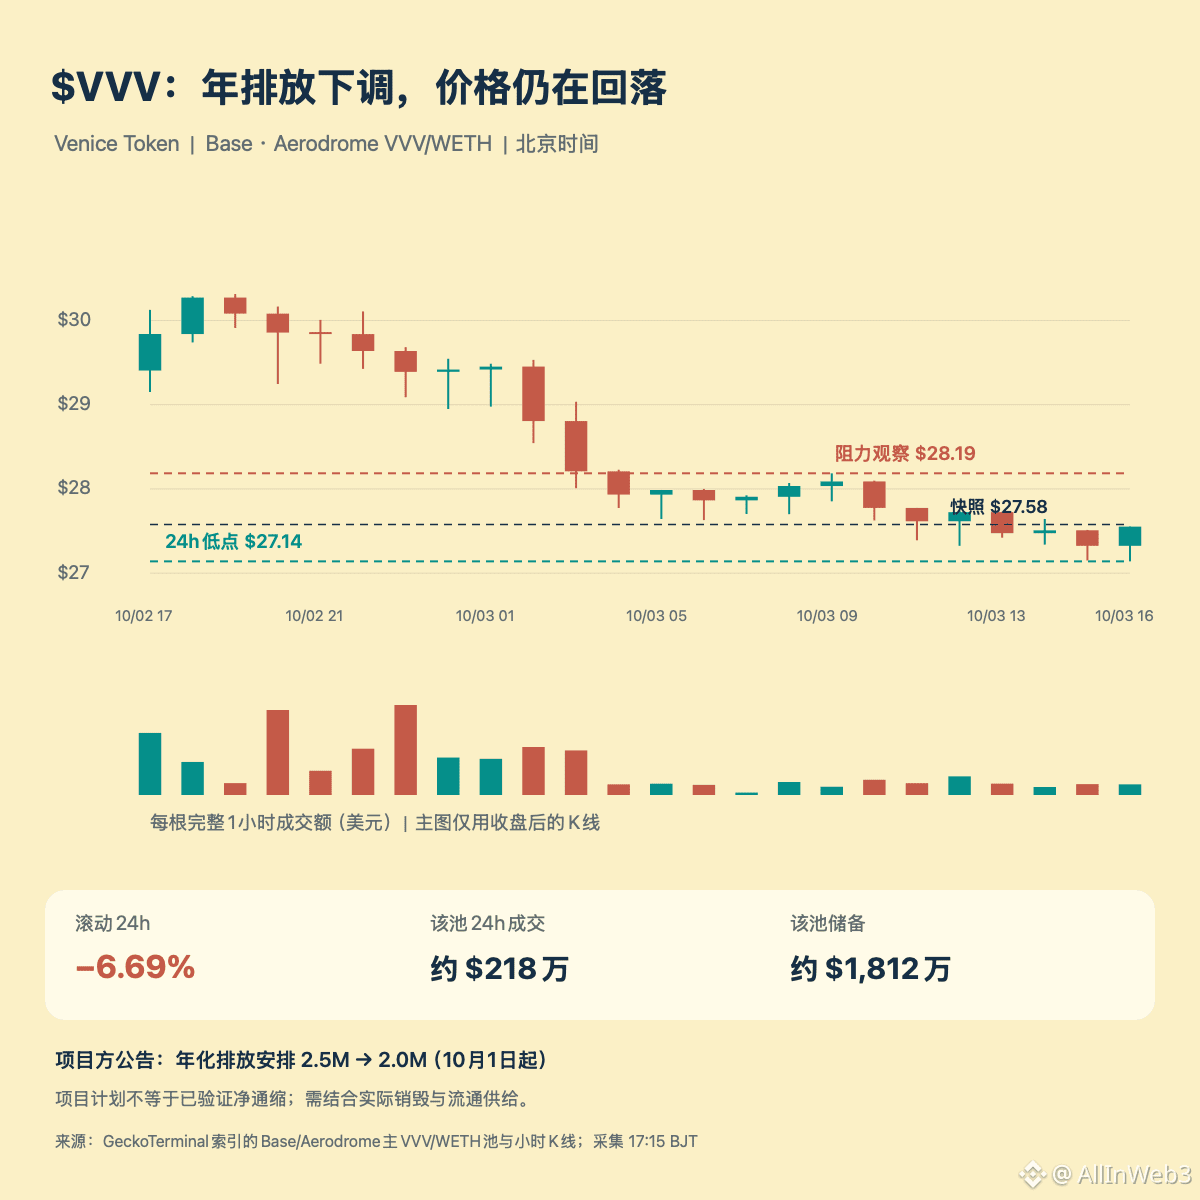
1
131
·
--
$VELVET has bounced strongly on increased volume, but we should still observe for now and not chase. On October 3 at 17:06 Beijing time, Binance’s Futures account scanned 526 USDT perpetual contracts that match the specified range in full. The rolling 24-hour percentage increase is 25.814%, ranking 2nd, with the scan price at 0.08076 USDT. Being near the top of the list does not mean it has already returned to the rising structure from this morning.
The post at 07:14 on this channel was an observation of continuous hourly volume-and-price lifting. Focus points were the prior high at 0.08880 and the prior low at 0.08091. After that, from 07:00 to 08:00 it did indeed close at 0.09427; however from 08:00 to 09:00 it surged to 0.09569 and then pulled back to close at 0.08033, breaking below the earlier observation level. Then from 13:00 to 14:00 it tested down to 0.06707. The key added this time is the repair after two clearly visible waves of retracement—so we cannot keep using the morning explanation of “continuous acceleration.”
The latest completed hour, 16:00 to 17:00, moved up from 0.07489 to 0.08031, an increase of about 7.24%. Trading volume was about 9.86 million USDT, which is 4.98 times the previous hour’s roughly 1.98 million. Compared with the 06:00 to 07:00 volume of about 7.33 million, the repair candle’s volume is larger, but the close is still about 9.4% lower. Increased activity is a valid new piece of information, but for the price to return to the original trend, that needs separate proof.
We also need to check where the repair occurred: the hour’s high was 0.08327, still lower than the 0.08398 high from 13:00 to 14:00. The four-hour candle that has completed from 12:00 to 16:00 ultimately still closed at 0.07489. The four-hour period from 16:00 to 20:00 has not closed yet, so we cannot directly write a one-hour bounce as a four-hour reversal, nor can we automatically explain the long lower wick as just a “shakeout.”
Positions have risen, but the strength is different from the price. In the OI quantity sample, from 16:00 to 17:00 it increased from about 76.39 million to 79.74 million coins, up about 4.39%. This only indicates that the scale of open contracts expanded; it does not mean a net inflow from longs. The 16:00 actual settlement funding rate is +0.006532% per 4 hours, lower than +0.026255% at 12:00. A decrease in the funding rate is not, by itself, a reason to justify buying; the next-period prediction should not be treated as a confirmed, settled result.
I rechecked Binance project announcements and Velvet’s official blog, and I still cannot verify any new catalyst that directly explains this-hour rebound. Updates to old products can only serve as background; they do not provide a strong reason that would fully account for this bullish candle.
Next, what’s more worth watching is the 0.08327–0.08398 area: we need subsequent full-hour closes above it, pullbacks that are met with acceptance, and trading activity that does not quickly fade—those would be evidence that the repair can continue. If it goes up on volume but still doesn’t rise for a long time, or if it loses the low of this hour again at 0.07475, then the current repair interpretation should be downgraded. These are structural observation levels, not guaranteed entry prices based on past signals; after price and window change, the calculation should be redone. Market conditions and position sources come from Binance’s public interface; single-coin evidence collection was at 17:03, and the accompanying chart only draws completed hours.
$VELVET has bounced strongly on increased volume, but we should still observe for now and not chase. On October 3 at 17:06 Beijing time, Binance’s Futures account scanned 526 USDT perpetual contracts that match the specified range in full. The rolling 24-hour percentage increase is 25.814%, ranking 2nd, with the scan price at 0.08076 USDT. Being near the top of the list does not mean it has already returned to the rising structure from this morning.
The post at 07:14 on this channel was an observation of continuous hourly volume-and-price lifting. Focus points were the prior high at 0.08880 and the prior low at 0.08091. After that, from 07:00 to 08:00 it did indeed close at 0.09427; however from 08:00 to 09:00 it surged to 0.09569 and then pulled back to close at 0.08033, breaking below the earlier observation level. Then from 13:00 to 14:00 it tested down to 0.06707. The key added this time is the repair after two clearly visible waves of retracement—so we cannot keep using the morning explanation of “continuous acceleration.”
The latest completed hour, 16:00 to 17:00, moved up from 0.07489 to 0.08031, an increase of about 7.24%. Trading volume was about 9.86 million USDT, which is 4.98 times the previous hour’s roughly 1.98 million. Compared with the 06:00 to 07:00 volume of about 7.33 million, the repair candle’s volume is larger, but the close is still about 9.4% lower. Increased activity is a valid new piece of information, but for the price to return to the original trend, that needs separate proof.
We also need to check where the repair occurred: the hour’s high was 0.08327, still lower than the 0.08398 high from 13:00 to 14:00. The four-hour candle that has completed from 12:00 to 16:00 ultimately still closed at 0.07489. The four-hour period from 16:00 to 20:00 has not closed yet, so we cannot directly write a one-hour bounce as a four-hour reversal, nor can we automatically explain the long lower wick as just a “shakeout.”
Positions have risen, but the strength is different from the price. In the OI quantity sample, from 16:00 to 17:00 it increased from about 76.39 million to 79.74 million coins, up about 4.39%. This only indicates that the scale of open contracts expanded; it does not mean a net inflow from longs. The 16:00 actual settlement funding rate is +0.006532% per 4 hours, lower than +0.026255% at 12:00. A decrease in the funding rate is not, by itself, a reason to justify buying; the next-period prediction should not be treated as a confirmed, settled result.
I rechecked Binance project announcements and Velvet’s official blog, and I still cannot verify any new catalyst that directly explains this-hour rebound. Updates to old products can only serve as background; they do not provide a strong reason that would fully account for this bullish candle.
Next, what’s more worth watching is the 0.08327–0.08398 area: we need subsequent full-hour closes above it, pullbacks that are met with acceptance, and trading activity that does not quickly fade—those would be evidence that the repair can continue. If it goes up on volume but still doesn’t rise for a long time, or if it loses the low of this hour again at 0.07475, then the current repair interpretation should be downgraded. These are structural observation levels, not guaranteed entry prices based on past signals; after price and window change, the calculation should be redone. Market conditions and position sources come from Binance’s public interface; single-coin evidence collection was at 17:03, and the accompanying chart only draws completed hours.
The post at 07:14 on this channel was an observation of continuous hourly volume-and-price lifting. Focus points were the prior high at 0.08880 and the prior low at 0.08091. After that, from 07:00 to 08:00 it did indeed close at 0.09427; however from 08:00 to 09:00 it surged to 0.09569 and then pulled back to close at 0.08033, breaking below the earlier observation level. Then from 13:00 to 14:00 it tested down to 0.06707. The key added this time is the repair after two clearly visible waves of retracement—so we cannot keep using the morning explanation of “continuous acceleration.”
The latest completed hour, 16:00 to 17:00, moved up from 0.07489 to 0.08031, an increase of about 7.24%. Trading volume was about 9.86 million USDT, which is 4.98 times the previous hour’s roughly 1.98 million. Compared with the 06:00 to 07:00 volume of about 7.33 million, the repair candle’s volume is larger, but the close is still about 9.4% lower. Increased activity is a valid new piece of information, but for the price to return to the original trend, that needs separate proof.
We also need to check where the repair occurred: the hour’s high was 0.08327, still lower than the 0.08398 high from 13:00 to 14:00. The four-hour candle that has completed from 12:00 to 16:00 ultimately still closed at 0.07489. The four-hour period from 16:00 to 20:00 has not closed yet, so we cannot directly write a one-hour bounce as a four-hour reversal, nor can we automatically explain the long lower wick as just a “shakeout.”
Positions have risen, but the strength is different from the price. In the OI quantity sample, from 16:00 to 17:00 it increased from about 76.39 million to 79.74 million coins, up about 4.39%. This only indicates that the scale of open contracts expanded; it does not mean a net inflow from longs. The 16:00 actual settlement funding rate is +0.006532% per 4 hours, lower than +0.026255% at 12:00. A decrease in the funding rate is not, by itself, a reason to justify buying; the next-period prediction should not be treated as a confirmed, settled result.
I rechecked Binance project announcements and Velvet’s official blog, and I still cannot verify any new catalyst that directly explains this-hour rebound. Updates to old products can only serve as background; they do not provide a strong reason that would fully account for this bullish candle.
Next, what’s more worth watching is the 0.08327–0.08398 area: we need subsequent full-hour closes above it, pullbacks that are met with acceptance, and trading activity that does not quickly fade—those would be evidence that the repair can continue. If it goes up on volume but still doesn’t rise for a long time, or if it loses the low of this hour again at 0.07475, then the current repair interpretation should be downgraded. These are structural observation levels, not guaranteed entry prices based on past signals; after price and window change, the calculation should be redone. Market conditions and position sources come from Binance’s public interface; single-coin evidence collection was at 17:03, and the accompanying chart only draws completed hours.
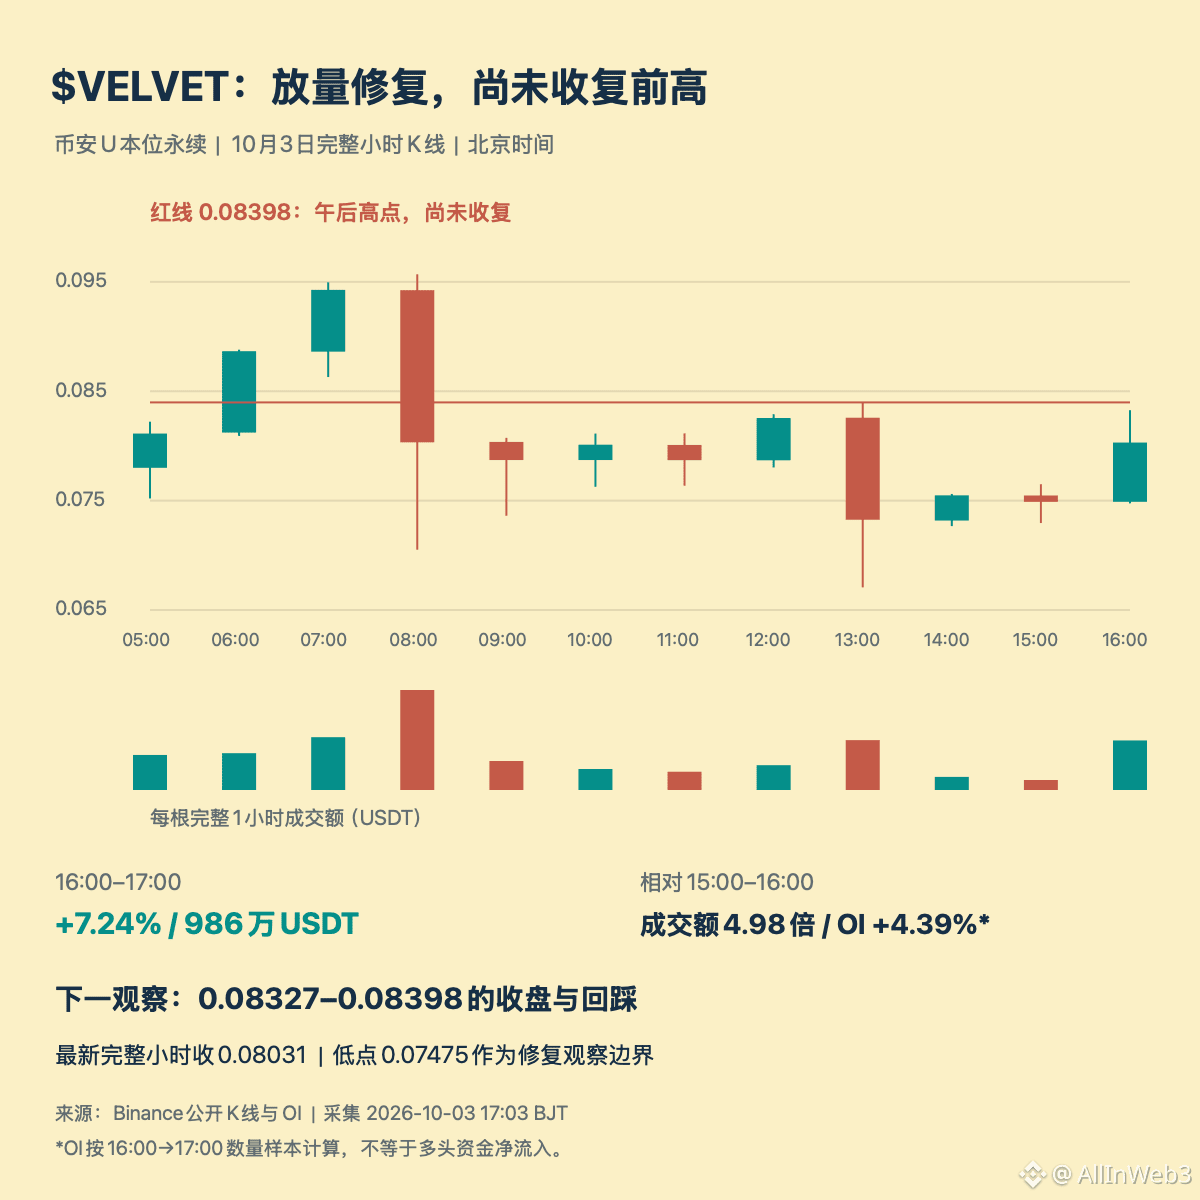
1
246
·
--
$AKE Can one go long now? My view is to wait first: after a sharp selloff, a rebound has appeared, but it hasn’t yet completed the confirmation that would justify chasing a long.
This discussion is about AKEDO’s AKEUSDT Binance USDT-margined perpetual contract. As of 16:58 Beijing time on October 3rd, the price is 0.032656 USDT, still up 4.19% over the past 24 hours; but “today’s gain is positive” and “it’s currently suitable to open longs” are two different things. At 17:00, the rechecked quote is about 0.032586, which remains below the confirmation level mentioned below.
First, let’s see where the drop happened. From 15:00 to 16:00, the full hourly candle fell from 0.036356 to 0.033079—down roughly 9.0%—with成交值 (trading value) about 7.4 million USDT, higher than the prior one-hour period of about 5 million. Then, from 16:00 to 16:15 it tested down again to 0.032078. This suggests the selloff after the rally has considerable strength, so you can’t just look at the 24-hour gain and treat the pullback as a low-entry opportunity. Also, trading value cannot directly be equated to net outflow.
Next, check whether the rebound has caught up. Two complete 15-minute candles from 16:15 to 16:30 and from 16:30 to 16:45 show trading values of about 790k and 600k USDT respectively—both below the approximately 2.04 million USDT during the 16:00 to 16:15 decline. The price leaving the low point indicates there is some support/absorption; however, rebound trading volume is decreasing, which is still insufficient to prove that active buying has regained control. Unclosed candles aren’t used to confirm a breakout, and there’s no evidence to attribute this rebound to any new positive catalyst.
Positioning also requires restraint in interpretation. Open interest fell from about 4.91600亿 AKE at 15:00 to about 4.77500亿 AKE at 16:58—a reduction of roughly 2.9%. The price pullback accompanied by declining open interest is compatible with some positions being exited; it doesn’t tell us whether longs are cutting losses, shorts are taking profit, or both occurring together—and it certainly can’t be used to conclude “the shakeout is over.”
I will first observe 0.033229: this is the high of the 16:00–16:15 bearish hourly segment candle. If, after that, there are complete 15-minute candles that close above it, and then later a pullback holds it, forming higher lows, along with成交 at comparable-length window, only then is it worth reassessing the long idea. One needle-like poke up isn’t enough; currently these conditions haven’t all happened at the same time.
For the upside, first look at the already-traded 0.033675–0.03387 zone. On the downside, watch 0.032078. If the low is broken and cannot be reclaimed, this rebound-observation logic fails. Even if the confirmation level is recovered, you still need to set the invalidation price based on the actual pullback low; use the first resistance to estimate potential space. After subtracting fees and expected slippage, if it doesn’t reach at least a 2:1 reward-to-risk, then give up—don’t move the target further just to justify opening a trade.
So the current conclusion is: don’t chase longs yet—wait for confirmation and then recalculate. The levels above come from this market snapshot; they are not permanent pending-order instructions. After the quote and structure change, the assessment must be redone.
Source: Binance’s公开合约 K-line, 24-hour market data, and open interest data. The chart imagery uses only candles that had already closed at the time of collection.
$AKE Can one go long now? My view is to wait first: after a sharp selloff, a rebound has appeared, but it hasn’t yet completed the confirmation that would justify chasing a long.
This discussion is about AKEDO’s AKEUSDT Binance USDT-margined perpetual contract. As of 16:58 Beijing time on October 3rd, the price is 0.032656 USDT, still up 4.19% over the past 24 hours; but “today’s gain is positive” and “it’s currently suitable to open longs” are two different things. At 17:00, the rechecked quote is about 0.032586, which remains below the confirmation level mentioned below.
First, let’s see where the drop happened. From 15:00 to 16:00, the full hourly candle fell from 0.036356 to 0.033079—down roughly 9.0%—with成交值 (trading value) about 7.4 million USDT, higher than the prior one-hour period of about 5 million. Then, from 16:00 to 16:15 it tested down again to 0.032078. This suggests the selloff after the rally has considerable strength, so you can’t just look at the 24-hour gain and treat the pullback as a low-entry opportunity. Also, trading value cannot directly be equated to net outflow.
Next, check whether the rebound has caught up. Two complete 15-minute candles from 16:15 to 16:30 and from 16:30 to 16:45 show trading values of about 790k and 600k USDT respectively—both below the approximately 2.04 million USDT during the 16:00 to 16:15 decline. The price leaving the low point indicates there is some support/absorption; however, rebound trading volume is decreasing, which is still insufficient to prove that active buying has regained control. Unclosed candles aren’t used to confirm a breakout, and there’s no evidence to attribute this rebound to any new positive catalyst.
Positioning also requires restraint in interpretation. Open interest fell from about 4.91600亿 AKE at 15:00 to about 4.77500亿 AKE at 16:58—a reduction of roughly 2.9%. The price pullback accompanied by declining open interest is compatible with some positions being exited; it doesn’t tell us whether longs are cutting losses, shorts are taking profit, or both occurring together—and it certainly can’t be used to conclude “the shakeout is over.”
I will first observe 0.033229: this is the high of the 16:00–16:15 bearish hourly segment candle. If, after that, there are complete 15-minute candles that close above it, and then later a pullback holds it, forming higher lows, along with成交 at comparable-length window, only then is it worth reassessing the long idea. One needle-like poke up isn’t enough; currently these conditions haven’t all happened at the same time.
For the upside, first look at the already-traded 0.033675–0.03387 zone. On the downside, watch 0.032078. If the low is broken and cannot be reclaimed, this rebound-observation logic fails. Even if the confirmation level is recovered, you still need to set the invalidation price based on the actual pullback low; use the first resistance to estimate potential space. After subtracting fees and expected slippage, if it doesn’t reach at least a 2:1 reward-to-risk, then give up—don’t move the target further just to justify opening a trade.
So the current conclusion is: don’t chase longs yet—wait for confirmation and then recalculate. The levels above come from this market snapshot; they are not permanent pending-order instructions. After the quote and structure change, the assessment must be redone.
Source: Binance’s公开合约 K-line, 24-hour market data, and open interest data. The chart imagery uses only candles that had already closed at the time of collection.
This discussion is about AKEDO’s AKEUSDT Binance USDT-margined perpetual contract. As of 16:58 Beijing time on October 3rd, the price is 0.032656 USDT, still up 4.19% over the past 24 hours; but “today’s gain is positive” and “it’s currently suitable to open longs” are two different things. At 17:00, the rechecked quote is about 0.032586, which remains below the confirmation level mentioned below.
First, let’s see where the drop happened. From 15:00 to 16:00, the full hourly candle fell from 0.036356 to 0.033079—down roughly 9.0%—with成交值 (trading value) about 7.4 million USDT, higher than the prior one-hour period of about 5 million. Then, from 16:00 to 16:15 it tested down again to 0.032078. This suggests the selloff after the rally has considerable strength, so you can’t just look at the 24-hour gain and treat the pullback as a low-entry opportunity. Also, trading value cannot directly be equated to net outflow.
Next, check whether the rebound has caught up. Two complete 15-minute candles from 16:15 to 16:30 and from 16:30 to 16:45 show trading values of about 790k and 600k USDT respectively—both below the approximately 2.04 million USDT during the 16:00 to 16:15 decline. The price leaving the low point indicates there is some support/absorption; however, rebound trading volume is decreasing, which is still insufficient to prove that active buying has regained control. Unclosed candles aren’t used to confirm a breakout, and there’s no evidence to attribute this rebound to any new positive catalyst.
Positioning also requires restraint in interpretation. Open interest fell from about 4.91600亿 AKE at 15:00 to about 4.77500亿 AKE at 16:58—a reduction of roughly 2.9%. The price pullback accompanied by declining open interest is compatible with some positions being exited; it doesn’t tell us whether longs are cutting losses, shorts are taking profit, or both occurring together—and it certainly can’t be used to conclude “the shakeout is over.”
I will first observe 0.033229: this is the high of the 16:00–16:15 bearish hourly segment candle. If, after that, there are complete 15-minute candles that close above it, and then later a pullback holds it, forming higher lows, along with成交 at comparable-length window, only then is it worth reassessing the long idea. One needle-like poke up isn’t enough; currently these conditions haven’t all happened at the same time.
For the upside, first look at the already-traded 0.033675–0.03387 zone. On the downside, watch 0.032078. If the low is broken and cannot be reclaimed, this rebound-observation logic fails. Even if the confirmation level is recovered, you still need to set the invalidation price based on the actual pullback low; use the first resistance to estimate potential space. After subtracting fees and expected slippage, if it doesn’t reach at least a 2:1 reward-to-risk, then give up—don’t move the target further just to justify opening a trade.
So the current conclusion is: don’t chase longs yet—wait for confirmation and then recalculate. The levels above come from this market snapshot; they are not permanent pending-order instructions. After the quote and structure change, the assessment must be redone.
Source: Binance’s公开合约 K-line, 24-hour market data, and open interest data. The chart imagery uses only candles that had already closed at the time of collection.
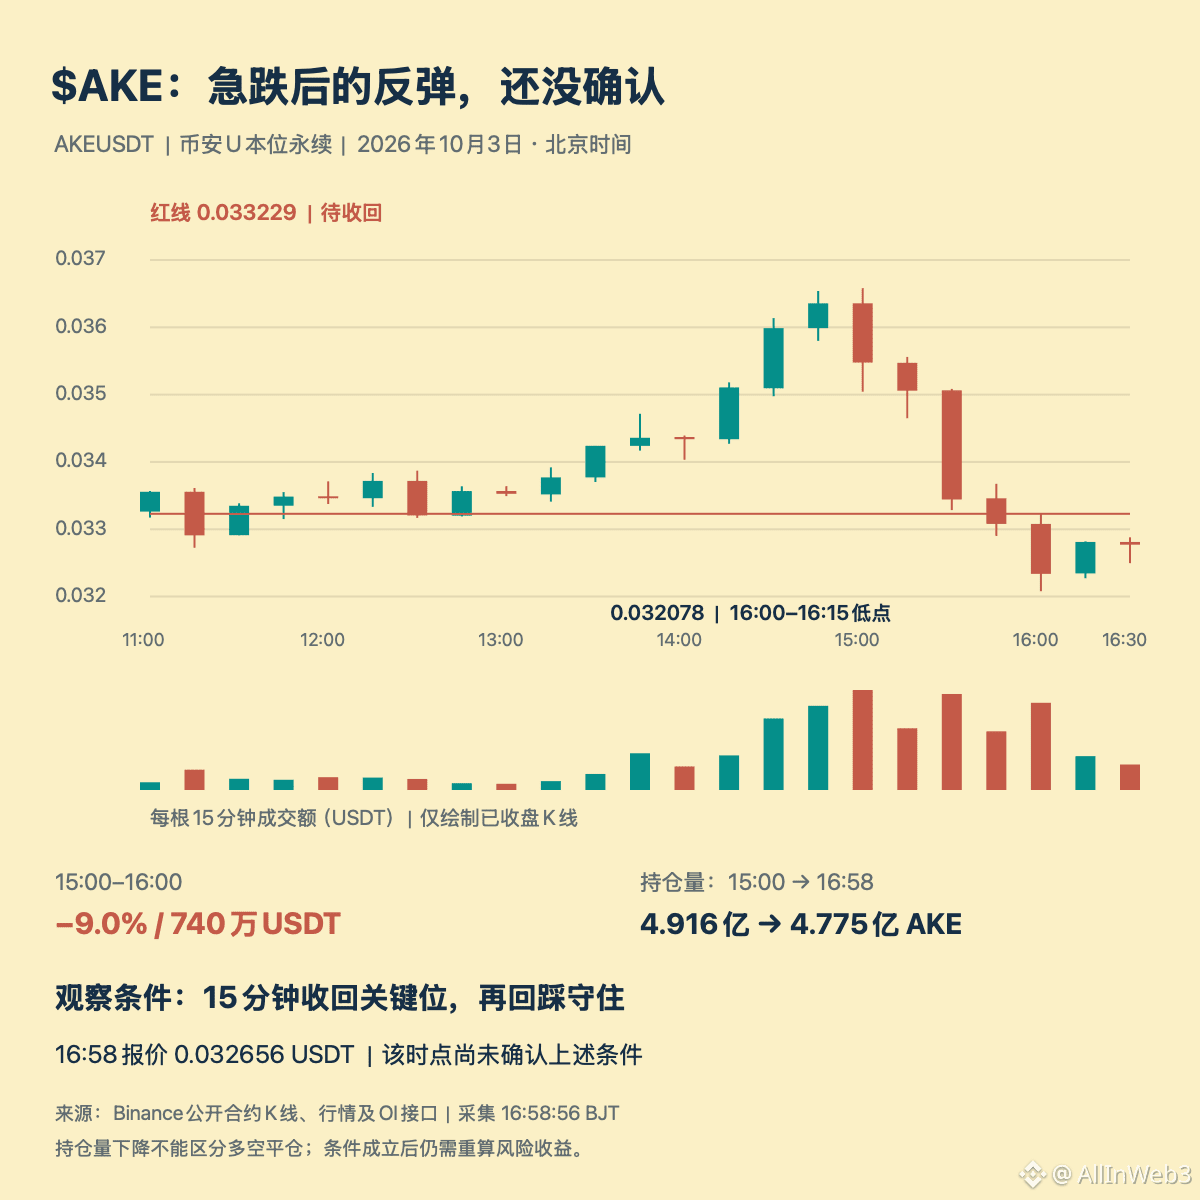
3
475
·
--
$BTC This round of “rally then give back” has a complete timeline. Binance spot BTCUSDT touched $87,220 on the 1-minute candle at 20:31 on October 2; as of 16:42 on October 3, it’s quoted at $84,620, down about 3.0% from the high point and still below $85,000.
First, align the macro event precisely: The U.S. Bureau of Labor Statistics (BLS) released the September Non-Farm Payrolls on October 2 at 20:30 (Beijing time), reporting +290,000 jobs and an unemployment rate of 4.2%. Binance’s 20:29 1-minute candle closed at $86,616, and the 20:31 1-minute candle’s high was $87,220. The high came immediately after the release; the minute candles can only show sequence, not causality. For the thesis “weak data pushed BTC,” we need independent evidence—the hot-list headline alone is not causal verification.
What matters more is the later closes: the 20:00–21:00 hour high was $87,220 and it closed at $86,810; 21:00–22:00 closed at $86,565; 22:00–23:00 closed at $85,686.93; 23:00–24:00 closed at $85,326. Then 01:00–02:00 on October 3 closed at $84,774.75, and 02:00–03:00 closed at $84,262.01. The rally didn’t hold at the top; it was gradually unwound afterward. The current rolling 24-hour range is $83,888–$87,220, a drop of about 2.1%. Pulling back from the high is about 3.0%—that’s not the same indicator as the rolling 24-hour move.
This account’s morning post 373133677978444 recorded the price around $84,639, below $85,000; what’s new this time is the path after that—first pushing above $87,000, then returning below $85,000. It doesn’t mean a trend reversal. The conclusion we can draw is limited to the price path: the spike didn’t persist into the present, and you can’t judge the next direction based only on this stretch of action. Next, watch whether the full-hour closes can reclaim $85,000, and whether the area around $83,888 is tested again; intraday quotes don’t count as confirmation. This is observation, not a trading signal. Data as of 16:42 BJT on October 3. #BTC
$BTC This round of “rally then give back” has a complete timeline. Binance spot BTCUSDT touched $87,220 on the 1-minute candle at 20:31 on October 2; as of 16:42 on October 3, it’s quoted at $84,620, down about 3.0% from the high point and still below $85,000.
First, align the macro event precisely: The U.S. Bureau of Labor Statistics (BLS) released the September Non-Farm Payrolls on October 2 at 20:30 (Beijing time), reporting +290,000 jobs and an unemployment rate of 4.2%. Binance’s 20:29 1-minute candle closed at $86,616, and the 20:31 1-minute candle’s high was $87,220. The high came immediately after the release; the minute candles can only show sequence, not causality. For the thesis “weak data pushed BTC,” we need independent evidence—the hot-list headline alone is not causal verification.
What matters more is the later closes: the 20:00–21:00 hour high was $87,220 and it closed at $86,810; 21:00–22:00 closed at $86,565; 22:00–23:00 closed at $85,686.93; 23:00–24:00 closed at $85,326. Then 01:00–02:00 on October 3 closed at $84,774.75, and 02:00–03:00 closed at $84,262.01. The rally didn’t hold at the top; it was gradually unwound afterward. The current rolling 24-hour range is $83,888–$87,220, a drop of about 2.1%. Pulling back from the high is about 3.0%—that’s not the same indicator as the rolling 24-hour move.
This account’s morning post 373133677978444 recorded the price around $84,639, below $85,000; what’s new this time is the path after that—first pushing above $87,000, then returning below $85,000. It doesn’t mean a trend reversal. The conclusion we can draw is limited to the price path: the spike didn’t persist into the present, and you can’t judge the next direction based only on this stretch of action. Next, watch whether the full-hour closes can reclaim $85,000, and whether the area around $83,888 is tested again; intraday quotes don’t count as confirmation. This is observation, not a trading signal. Data as of 16:42 BJT on October 3. #BTC
First, align the macro event precisely: The U.S. Bureau of Labor Statistics (BLS) released the September Non-Farm Payrolls on October 2 at 20:30 (Beijing time), reporting +290,000 jobs and an unemployment rate of 4.2%. Binance’s 20:29 1-minute candle closed at $86,616, and the 20:31 1-minute candle’s high was $87,220. The high came immediately after the release; the minute candles can only show sequence, not causality. For the thesis “weak data pushed BTC,” we need independent evidence—the hot-list headline alone is not causal verification.
What matters more is the later closes: the 20:00–21:00 hour high was $87,220 and it closed at $86,810; 21:00–22:00 closed at $86,565; 22:00–23:00 closed at $85,686.93; 23:00–24:00 closed at $85,326. Then 01:00–02:00 on October 3 closed at $84,774.75, and 02:00–03:00 closed at $84,262.01. The rally didn’t hold at the top; it was gradually unwound afterward. The current rolling 24-hour range is $83,888–$87,220, a drop of about 2.1%. Pulling back from the high is about 3.0%—that’s not the same indicator as the rolling 24-hour move.
This account’s morning post 373133677978444 recorded the price around $84,639, below $85,000; what’s new this time is the path after that—first pushing above $87,000, then returning below $85,000. It doesn’t mean a trend reversal. The conclusion we can draw is limited to the price path: the spike didn’t persist into the present, and you can’t judge the next direction based only on this stretch of action. Next, watch whether the full-hour closes can reclaim $85,000, and whether the area around $83,888 is tested again; intraday quotes don’t count as confirmation. This is observation, not a trading signal. Data as of 16:42 BJT on October 3. #BTC
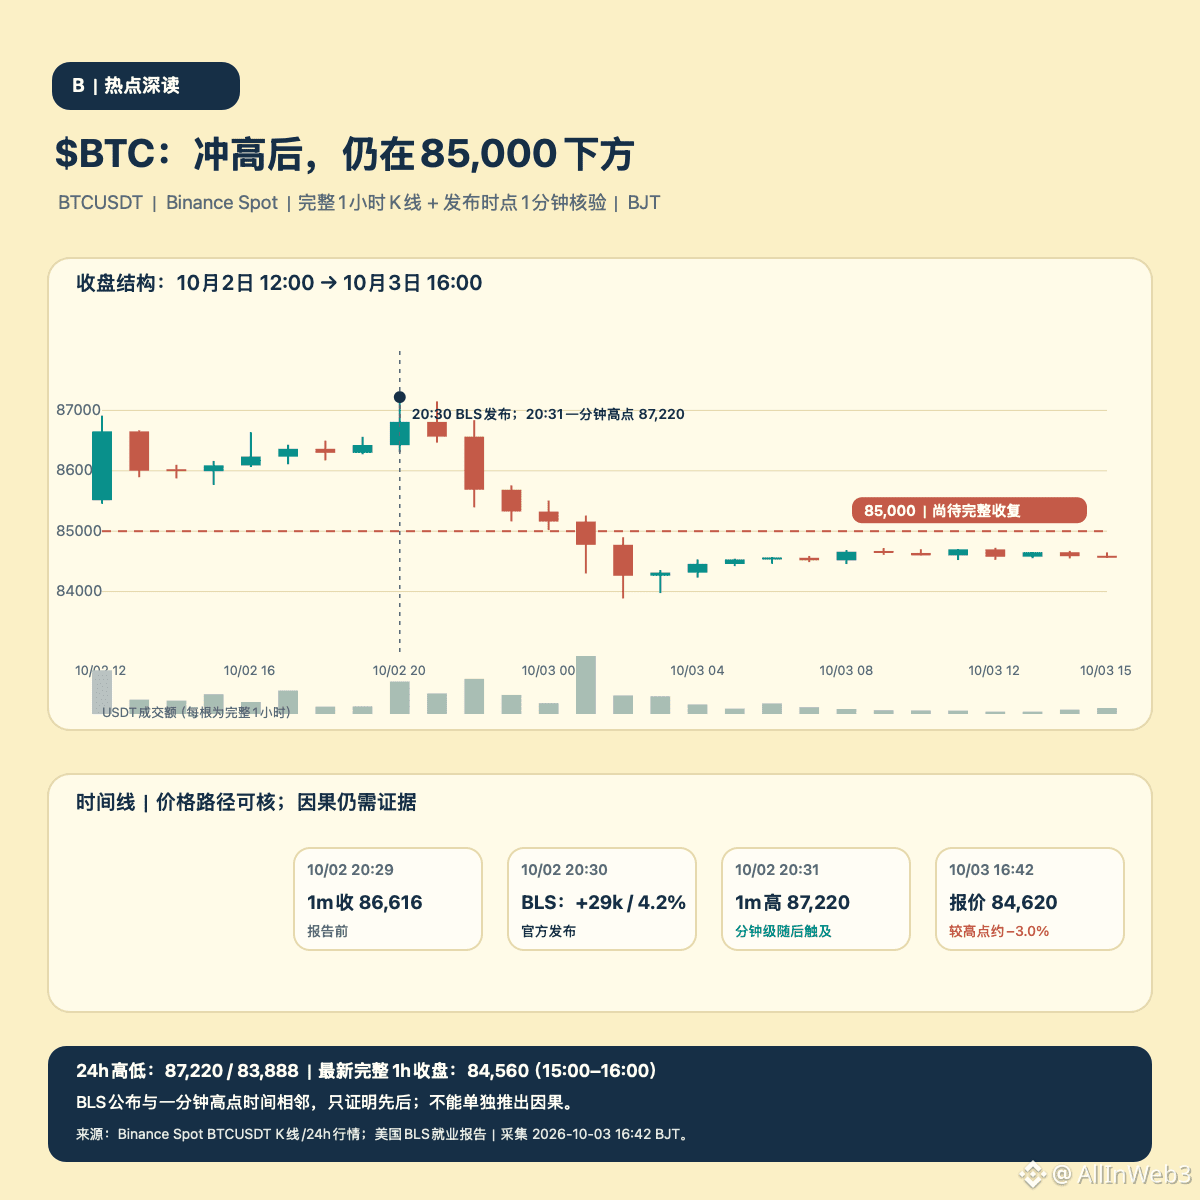
92
·
--
In the short term, wait and observe first—don’t chase the leaderboard. Regarding <龙虾> (Lobster/ <龙虾USDT> ), don’t take the 4-hour close back above the observation level as confirmation. It fully closed over 4 hours between 12:00—16:00 at 0.04859, above 0.04802; but a full 5 minutes between 16:05—16:10 closed at 0.04788, then another full 5 minutes between 16:10—16:15 closed at 0.04720, with both returning below that level. At 16:18:05 the single-coin quote was 0.04683, still below the observation level. New information isn’t a “breakout,” but rather a failed hold after reclaiming.
The divergence in this round’s short-cycle closes is worth weighting more than the 24-hour leaderboard movement. The latest 4 hours went from 0.04485 to 0.04859, up 8.34%, with a high of 0.04933; but the estimated traded value is about $53.45 million, which is 54.4% less than the previous full 4 hours from 08:00—12:00 at $117.3 million. The traded value from 15:00—16:00 is about $16.71 million, up 26% versus $13.26 million in the prior hour; after that, several subsequent 5-minute candles weakened again. An increase in single-candle traded value doesn’t equal net buying, and you can’t replace sustained stabilization with just one 4-hour close.
The rolling 24-hour numbers change quickly: at 16:02 the Lobster/USDT row was scanned as #1, with a +67.605% rise and a price of 0.04884; at 16:21:56 it was scanned again as #1, with a +46.051% rise and a price of 0.04567. Compared to the 16:02 scan price of 0.04884, it dropped about 6.5% within 20 minutes. The 24-hour rise field is lower by 21.554 percentage points; the latter is also affected by the rolling window update, so it can’t be used as the basis for the current hour’s drawdown. The latest scan price is also below the 0.04703 shown in this post at 14:26—so you can’t treat a top-of-leaderboard percentage (or earlier high percentage) as new momentum.
Positions and funding rates still don’t provide a directional conclusion. The OI sample from about 14:00 to 16:00 rose from ~662.3 million coins to ~667.0 million (about +0.7%), and it doesn’t distinguish long vs. short. The settled funding rate at 16:00 is +0.03217% per 4 hours; a positive value means longs are paying shorts. That’s lower than the +0.03580% at 12:00, but it isn’t a reversal signal. A single order-book snapshot doesn’t represent ongoing acceptance. The Binance futures listing announcement only confirms the underlying asset identity; for this round, no new project announcement explaining the volatility was found.
Next, first watch whether the price can reclaim 0.04802, then see whether there is transaction support in the full hour. If it continues to press below that level and breaks below the recent full-hour low of 0.04511, then the earlier 4-hour close looks even more like a brief reclaim. Leaderboard snapshots across the whole market as of 16:21:56 BJT; single-coin cross-check as of 16:18:05; the 5-minute candles from 16:15—16:20 have not yet completed. #龙虾USDT
In the short term, wait and observe first—don’t chase the leaderboard. Regarding <龙虾> (Lobster/ <龙虾USDT> ), don’t take the 4-hour close back above the observation level as confirmation. It fully closed over 4 hours between 12:00—16:00 at 0.04859, above 0.04802; but a full 5 minutes between 16:05—16:10 closed at 0.04788, then another full 5 minutes between 16:10—16:15 closed at 0.04720, with both returning below that level. At 16:18:05 the single-coin quote was 0.04683, still below the observation level. New information isn’t a “breakout,” but rather a failed hold after reclaiming.
The divergence in this round’s short-cycle closes is worth weighting more than the 24-hour leaderboard movement. The latest 4 hours went from 0.04485 to 0.04859, up 8.34%, with a high of 0.04933; but the estimated traded value is about $53.45 million, which is 54.4% less than the previous full 4 hours from 08:00—12:00 at $117.3 million. The traded value from 15:00—16:00 is about $16.71 million, up 26% versus $13.26 million in the prior hour; after that, several subsequent 5-minute candles weakened again. An increase in single-candle traded value doesn’t equal net buying, and you can’t replace sustained stabilization with just one 4-hour close.
The rolling 24-hour numbers change quickly: at 16:02 the Lobster/USDT row was scanned as #1, with a +67.605% rise and a price of 0.04884; at 16:21:56 it was scanned again as #1, with a +46.051% rise and a price of 0.04567. Compared to the 16:02 scan price of 0.04884, it dropped about 6.5% within 20 minutes. The 24-hour rise field is lower by 21.554 percentage points; the latter is also affected by the rolling window update, so it can’t be used as the basis for the current hour’s drawdown. The latest scan price is also below the 0.04703 shown in this post at 14:26—so you can’t treat a top-of-leaderboard percentage (or earlier high percentage) as new momentum.
Positions and funding rates still don’t provide a directional conclusion. The OI sample from about 14:00 to 16:00 rose from ~662.3 million coins to ~667.0 million (about +0.7%), and it doesn’t distinguish long vs. short. The settled funding rate at 16:00 is +0.03217% per 4 hours; a positive value means longs are paying shorts. That’s lower than the +0.03580% at 12:00, but it isn’t a reversal signal. A single order-book snapshot doesn’t represent ongoing acceptance. The Binance futures listing announcement only confirms the underlying asset identity; for this round, no new project announcement explaining the volatility was found.
Next, first watch whether the price can reclaim 0.04802, then see whether there is transaction support in the full hour. If it continues to press below that level and breaks below the recent full-hour low of 0.04511, then the earlier 4-hour close looks even more like a brief reclaim. Leaderboard snapshots across the whole market as of 16:21:56 BJT; single-coin cross-check as of 16:18:05; the 5-minute candles from 16:15—16:20 have not yet completed. #龙虾USDT
The divergence in this round’s short-cycle closes is worth weighting more than the 24-hour leaderboard movement. The latest 4 hours went from 0.04485 to 0.04859, up 8.34%, with a high of 0.04933; but the estimated traded value is about $53.45 million, which is 54.4% less than the previous full 4 hours from 08:00—12:00 at $117.3 million. The traded value from 15:00—16:00 is about $16.71 million, up 26% versus $13.26 million in the prior hour; after that, several subsequent 5-minute candles weakened again. An increase in single-candle traded value doesn’t equal net buying, and you can’t replace sustained stabilization with just one 4-hour close.
The rolling 24-hour numbers change quickly: at 16:02 the Lobster/USDT row was scanned as #1, with a +67.605% rise and a price of 0.04884; at 16:21:56 it was scanned again as #1, with a +46.051% rise and a price of 0.04567. Compared to the 16:02 scan price of 0.04884, it dropped about 6.5% within 20 minutes. The 24-hour rise field is lower by 21.554 percentage points; the latter is also affected by the rolling window update, so it can’t be used as the basis for the current hour’s drawdown. The latest scan price is also below the 0.04703 shown in this post at 14:26—so you can’t treat a top-of-leaderboard percentage (or earlier high percentage) as new momentum.
Positions and funding rates still don’t provide a directional conclusion. The OI sample from about 14:00 to 16:00 rose from ~662.3 million coins to ~667.0 million (about +0.7%), and it doesn’t distinguish long vs. short. The settled funding rate at 16:00 is +0.03217% per 4 hours; a positive value means longs are paying shorts. That’s lower than the +0.03580% at 12:00, but it isn’t a reversal signal. A single order-book snapshot doesn’t represent ongoing acceptance. The Binance futures listing announcement only confirms the underlying asset identity; for this round, no new project announcement explaining the volatility was found.
Next, first watch whether the price can reclaim 0.04802, then see whether there is transaction support in the full hour. If it continues to press below that level and breaks below the recent full-hour low of 0.04511, then the earlier 4-hour close looks even more like a brief reclaim. Leaderboard snapshots across the whole market as of 16:21:56 BJT; single-coin cross-check as of 16:18:05; the 5-minute candles from 16:15—16:20 have not yet completed. #龙虾USDT
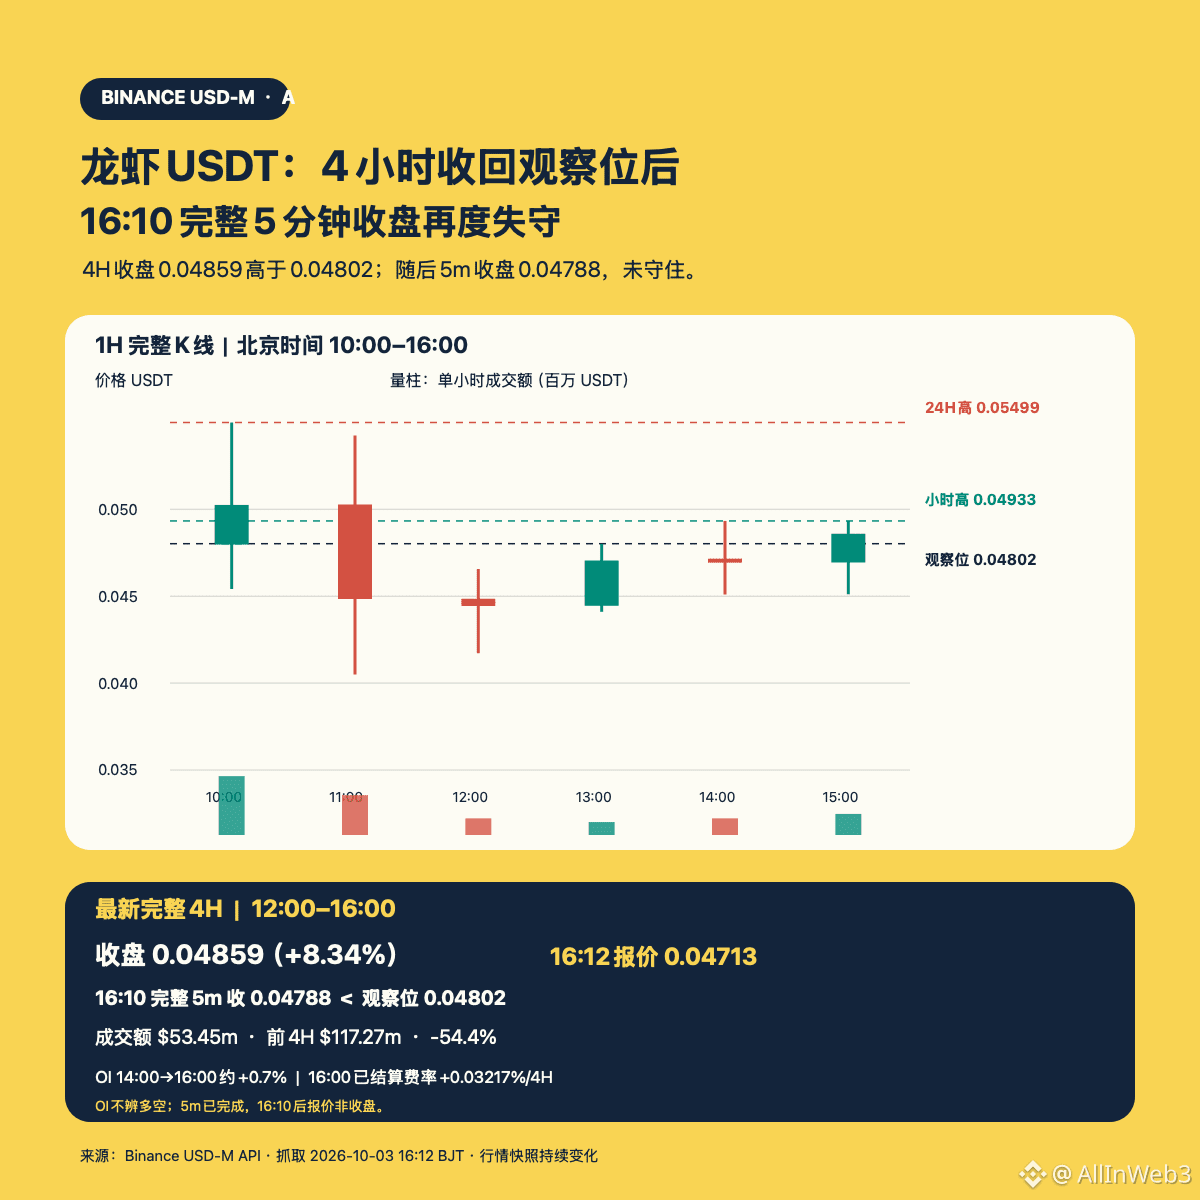
1
630
·
--
[Has OpenAI switched from NVIDIA to Cerebras—did the partnership end? Existing evidence does not support that leap]
Binance’s hot rankings put Cerebras’ nearly 20% drop alongside the claim that “NVIDIA will supply compute power for OpenAI,” but this only shows the market is repricing a key customer—it’s not enough to prove that OpenAI and Cerebras’ collaboration has been canceled. A more accurate breakdown is: the specific hardware arrangement for GPT‑6.1 Sol Ultrafast is still only what research institutions say; meanwhile, the multi-year compute deal Cerebras disclosed earlier remains in public filings.
On September 30, SemiAnalysis wrote on X that GPT‑6.1 Sol Ultrafast is not running on Cerebras, but instead is being run on NVIDIA GPUs in low-volume mode. We checked the original post link, but at the time the X page returned 403, preventing us from independently reading the full context; nor did OpenAI or Cerebras confirm this deployment in any official announcement identified in this round of verification. Therefore, this article treats it as an industry report awaiting verification, rather than presenting it as a fact the company has confirmed, and certainly not using it to claim the partnership was terminated.
Company disclosures that can be directly verified come in two layers. A Cerebras press release in August 2026 states that GPT‑5.6 Sol Ultrafast in the OpenAI API uses compute provided by Cerebras. This shows that a particular model version and tier did use its system, but it cannot be automatically extrapolated to GPT‑6.1. In its SEC filing for Q1 2026, Cerebras states that the two sides signed a multi-year master agreement in December 2025: OpenAI committed to purchasing 750MW of inference compute and related services, with batch deployments expected from 2026 to 2028; there is also an additional purchase option of up to 1.25GW. The option is not a committed capacity, and the document does not list, item by item, the chip routing for each model tier.
All three points can be true at the same time: different model versions and speed tiers may use different hardware; the capacity defined in the contract does not prove that a specific new tier is already going live; and a single deployment rumor cannot, by itself, prove that a big-customer contract was withdrawn. The Q1 10‑Q disclosure also cannot answer whether there were revisions after that.
What could truly change the assessment is later formal clarification by OpenAI or Cerebras about the GPT‑6.1 service path, the deployment and revenue progress in Cerebras’ next filing, and whether the agreement has been publicly amended. The hot-tracker’s claimed stock-price drop and the timing of the hardware rumor are adjacent, but that does not equal proof that a single piece of news caused the entire drop. #AI算力 #OpenAI #Cerebras
[Has OpenAI switched from NVIDIA to Cerebras—did the partnership end? Existing evidence does not support that leap]
Binance’s hot rankings put Cerebras’ nearly 20% drop alongside the claim that “NVIDIA will supply compute power for OpenAI,” but this only shows the market is repricing a key customer—it’s not enough to prove that OpenAI and Cerebras’ collaboration has been canceled. A more accurate breakdown is: the specific hardware arrangement for GPT‑6.1 Sol Ultrafast is still only what research institutions say; meanwhile, the multi-year compute deal Cerebras disclosed earlier remains in public filings.
On September 30, SemiAnalysis wrote on X that GPT‑6.1 Sol Ultrafast is not running on Cerebras, but instead is being run on NVIDIA GPUs in low-volume mode. We checked the original post link, but at the time the X page returned 403, preventing us from independently reading the full context; nor did OpenAI or Cerebras confirm this deployment in any official announcement identified in this round of verification. Therefore, this article treats it as an industry report awaiting verification, rather than presenting it as a fact the company has confirmed, and certainly not using it to claim the partnership was terminated.
Company disclosures that can be directly verified come in two layers. A Cerebras press release in August 2026 states that GPT‑5.6 Sol Ultrafast in the OpenAI API uses compute provided by Cerebras. This shows that a particular model version and tier did use its system, but it cannot be automatically extrapolated to GPT‑6.1. In its SEC filing for Q1 2026, Cerebras states that the two sides signed a multi-year master agreement in December 2025: OpenAI committed to purchasing 750MW of inference compute and related services, with batch deployments expected from 2026 to 2028; there is also an additional purchase option of up to 1.25GW. The option is not a committed capacity, and the document does not list, item by item, the chip routing for each model tier.
All three points can be true at the same time: different model versions and speed tiers may use different hardware; the capacity defined in the contract does not prove that a specific new tier is already going live; and a single deployment rumor cannot, by itself, prove that a big-customer contract was withdrawn. The Q1 10‑Q disclosure also cannot answer whether there were revisions after that.
What could truly change the assessment is later formal clarification by OpenAI or Cerebras about the GPT‑6.1 service path, the deployment and revenue progress in Cerebras’ next filing, and whether the agreement has been publicly amended. The hot-tracker’s claimed stock-price drop and the timing of the hardware rumor are adjacent, but that does not equal proof that a single piece of news caused the entire drop. #AI算力 #OpenAI #Cerebras
Binance’s hot rankings put Cerebras’ nearly 20% drop alongside the claim that “NVIDIA will supply compute power for OpenAI,” but this only shows the market is repricing a key customer—it’s not enough to prove that OpenAI and Cerebras’ collaboration has been canceled. A more accurate breakdown is: the specific hardware arrangement for GPT‑6.1 Sol Ultrafast is still only what research institutions say; meanwhile, the multi-year compute deal Cerebras disclosed earlier remains in public filings.
On September 30, SemiAnalysis wrote on X that GPT‑6.1 Sol Ultrafast is not running on Cerebras, but instead is being run on NVIDIA GPUs in low-volume mode. We checked the original post link, but at the time the X page returned 403, preventing us from independently reading the full context; nor did OpenAI or Cerebras confirm this deployment in any official announcement identified in this round of verification. Therefore, this article treats it as an industry report awaiting verification, rather than presenting it as a fact the company has confirmed, and certainly not using it to claim the partnership was terminated.
Company disclosures that can be directly verified come in two layers. A Cerebras press release in August 2026 states that GPT‑5.6 Sol Ultrafast in the OpenAI API uses compute provided by Cerebras. This shows that a particular model version and tier did use its system, but it cannot be automatically extrapolated to GPT‑6.1. In its SEC filing for Q1 2026, Cerebras states that the two sides signed a multi-year master agreement in December 2025: OpenAI committed to purchasing 750MW of inference compute and related services, with batch deployments expected from 2026 to 2028; there is also an additional purchase option of up to 1.25GW. The option is not a committed capacity, and the document does not list, item by item, the chip routing for each model tier.
All three points can be true at the same time: different model versions and speed tiers may use different hardware; the capacity defined in the contract does not prove that a specific new tier is already going live; and a single deployment rumor cannot, by itself, prove that a big-customer contract was withdrawn. The Q1 10‑Q disclosure also cannot answer whether there were revisions after that.
What could truly change the assessment is later formal clarification by OpenAI or Cerebras about the GPT‑6.1 service path, the deployment and revenue progress in Cerebras’ next filing, and whether the agreement has been publicly amended. The hot-tracker’s claimed stock-price drop and the timing of the hardware rumor are adjacent, but that does not equal proof that a single piece of news caused the entire drop. #AI算力 #OpenAI #Cerebras
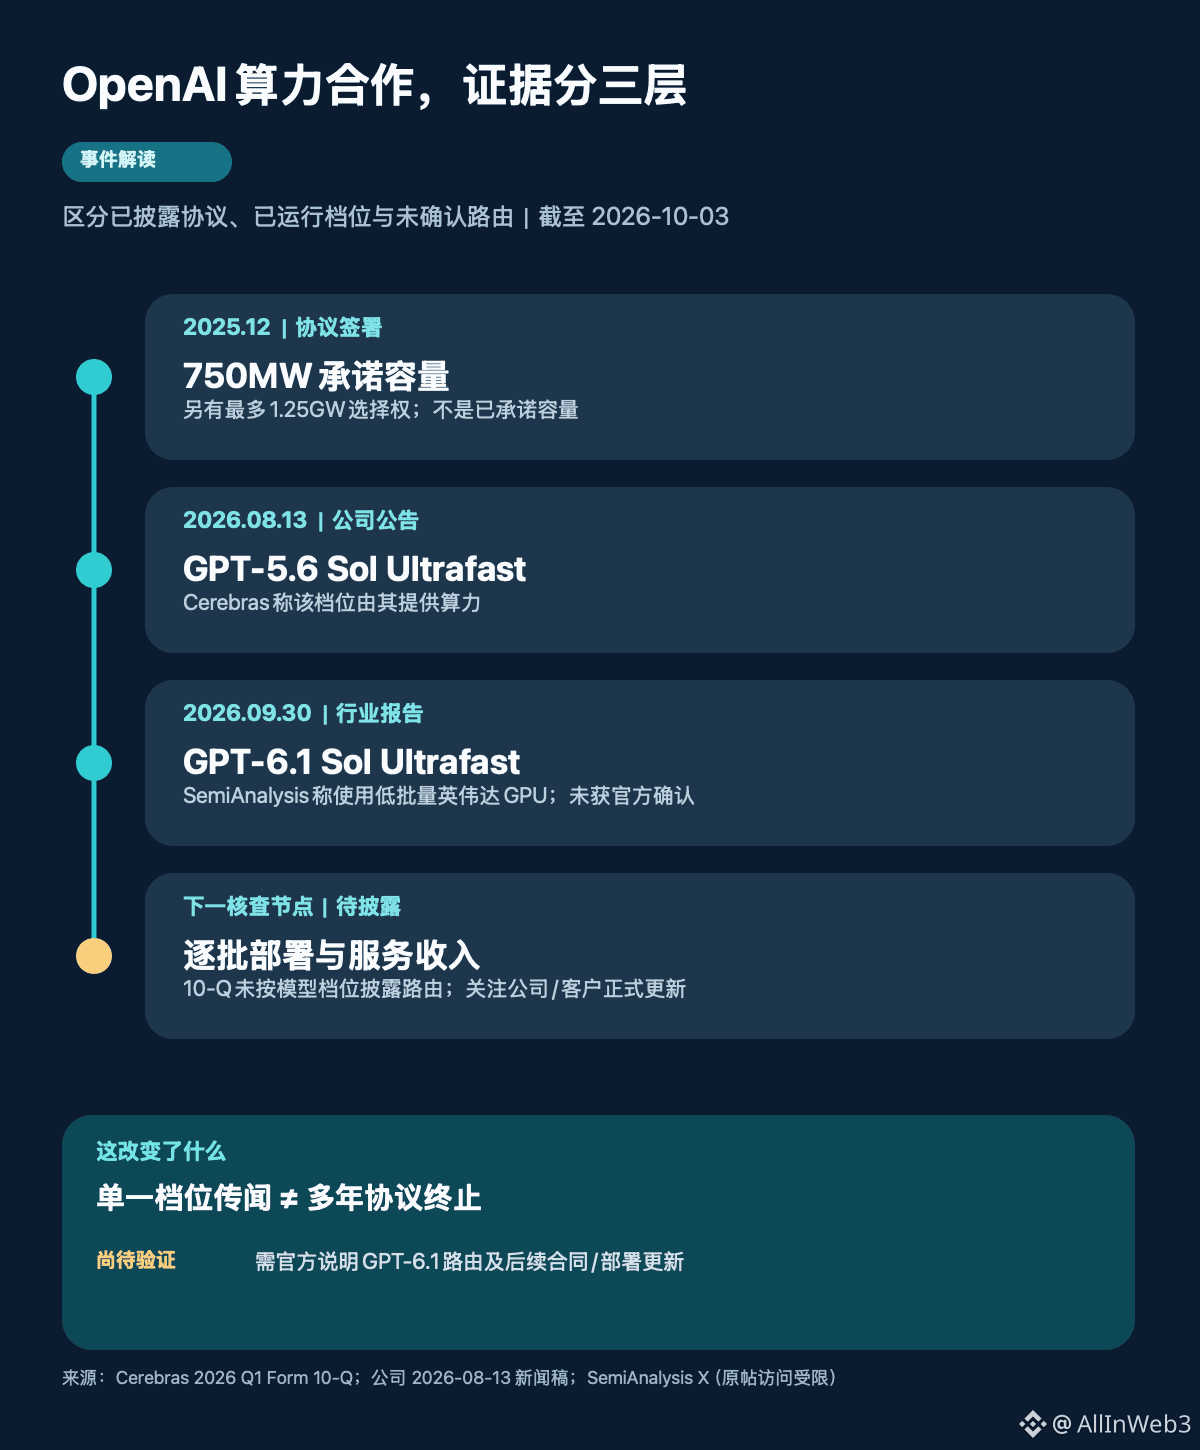
1
10
·
--
Write the conclusion first: observe, don’t chase. The key to this $Lobster USDT leg isn’t treating a 50%+ rise as continuous buy pressure. Before the release at 14:26:16, I scanned and verified all 526/526 Binance USDT-margined perpetuals; $Lobster USDT ranked #2, with a 24h increase of +53.944%. The scan price was 0.04703 and the traded value was about $534 million. It rose from #3 at 14:00:38 to #2, but the ranking change alone doesn’t confirm the trend. The 14:25 scan showed +54.043%, price 0.04706; the 14:18 scan showed +47.837%, price 0.04716. At 14:14, the single-pair snapshot was 0.04692, with a rolling 24h gain of +49.570%. The price is mostly flat while the rolling gain changes, indicating the 24h statistical window is shifting too—so you can’t interpret everything as new buying.
Most striking is the full four-hour window from 08:00–12:00: open 0.03924, close 0.04484, up about 14.3%, yet the range stretched from 0.03500 to 0.05499, leaving a very wide amplitude. The quoted成交 value for that segment was about $117.3 million, roughly 8x the previous full four hours (04:00–08:00, about $14.58 million). Volume and price rise occurred together, but the wide spike-and-fall suggests the path wasn’t smooth; traded value isn’t the same as net-buy statistics.
Looking at hourly closes makes the process clearer: 09:00–10:00 close at 0.04798; 10:00–11:00 close at 0.05025; then 11:00–12:00 fell back to 0.04484; 12:00–13:00 closed at 0.04444; the low was 0.04172. 13:00–14:00 closed at 0.04705—about 5.8% above the open 0.04445. But hourly traded value dropped from $13.21 million to $10.27 million, down about 22%. The 14:14 quote at 0.04692 is slightly below that hourly close, and also below the hourly high 0.04802 and the 24h high 0.05499. At this stage, it can only be called a partial rebound after a pullback.
OI rose from about 650.5 million contracts at ~08:00 to about 662.3 million at ~14:00, up roughly 1.8%. OI can’t distinguish long vs. short. The funding rate settled at 12:00 was +0.035796% per 4 hours. A positive rate means longs pay shorts. It describes crowded positioning cost, but it doesn’t indicate which side will definitely win. In the 14:14 order-book snapshot, the bid/ask around the mid price within 0.5% were about $265k on the buy side and $462k on the sell side; the spread is about 4.27 bps. A single order can be cancelled, so it can’t be taken as evidence of continuous support.
Binance’s March 11 contract announcement describes $Lobster as a Chinese meme coin on the BNB Chain, with a maximum leverage of 5x. That’s only the asset identity and contract rules—not the catalyst for this round. As of 14:18, I haven’t verified any recent project team announcement or exchange news that could explain the sharp surge. Going forward, we need to watch whether the completed 12:00–16:00 four-hour segment can stand above 0.04802, or if it falls back below 0.04172. Whichever direction, confirmation requires subsequent candlestick closes. #LobsterUSDT
Write the conclusion first: observe, don’t chase. The key to this $Lobster USDT leg isn’t treating a 50%+ rise as continuous buy pressure. Before the release at 14:26:16, I scanned and verified all 526/526 Binance USDT-margined perpetuals; $Lobster USDT ranked #2, with a 24h increase of +53.944%. The scan price was 0.04703 and the traded value was about $534 million. It rose from #3 at 14:00:38 to #2, but the ranking change alone doesn’t confirm the trend. The 14:25 scan showed +54.043%, price 0.04706; the 14:18 scan showed +47.837%, price 0.04716. At 14:14, the single-pair snapshot was 0.04692, with a rolling 24h gain of +49.570%. The price is mostly flat while the rolling gain changes, indicating the 24h statistical window is shifting too—so you can’t interpret everything as new buying.
Most striking is the full four-hour window from 08:00–12:00: open 0.03924, close 0.04484, up about 14.3%, yet the range stretched from 0.03500 to 0.05499, leaving a very wide amplitude. The quoted成交 value for that segment was about $117.3 million, roughly 8x the previous full four hours (04:00–08:00, about $14.58 million). Volume and price rise occurred together, but the wide spike-and-fall suggests the path wasn’t smooth; traded value isn’t the same as net-buy statistics.
Looking at hourly closes makes the process clearer: 09:00–10:00 close at 0.04798; 10:00–11:00 close at 0.05025; then 11:00–12:00 fell back to 0.04484; 12:00–13:00 closed at 0.04444; the low was 0.04172. 13:00–14:00 closed at 0.04705—about 5.8% above the open 0.04445. But hourly traded value dropped from $13.21 million to $10.27 million, down about 22%. The 14:14 quote at 0.04692 is slightly below that hourly close, and also below the hourly high 0.04802 and the 24h high 0.05499. At this stage, it can only be called a partial rebound after a pullback.
OI rose from about 650.5 million contracts at ~08:00 to about 662.3 million at ~14:00, up roughly 1.8%. OI can’t distinguish long vs. short. The funding rate settled at 12:00 was +0.035796% per 4 hours. A positive rate means longs pay shorts. It describes crowded positioning cost, but it doesn’t indicate which side will definitely win. In the 14:14 order-book snapshot, the bid/ask around the mid price within 0.5% were about $265k on the buy side and $462k on the sell side; the spread is about 4.27 bps. A single order can be cancelled, so it can’t be taken as evidence of continuous support.
Binance’s March 11 contract announcement describes $Lobster as a Chinese meme coin on the BNB Chain, with a maximum leverage of 5x. That’s only the asset identity and contract rules—not the catalyst for this round. As of 14:18, I haven’t verified any recent project team announcement or exchange news that could explain the sharp surge. Going forward, we need to watch whether the completed 12:00–16:00 four-hour segment can stand above 0.04802, or if it falls back below 0.04172. Whichever direction, confirmation requires subsequent candlestick closes. #LobsterUSDT
Most striking is the full four-hour window from 08:00–12:00: open 0.03924, close 0.04484, up about 14.3%, yet the range stretched from 0.03500 to 0.05499, leaving a very wide amplitude. The quoted成交 value for that segment was about $117.3 million, roughly 8x the previous full four hours (04:00–08:00, about $14.58 million). Volume and price rise occurred together, but the wide spike-and-fall suggests the path wasn’t smooth; traded value isn’t the same as net-buy statistics.
Looking at hourly closes makes the process clearer: 09:00–10:00 close at 0.04798; 10:00–11:00 close at 0.05025; then 11:00–12:00 fell back to 0.04484; 12:00–13:00 closed at 0.04444; the low was 0.04172. 13:00–14:00 closed at 0.04705—about 5.8% above the open 0.04445. But hourly traded value dropped from $13.21 million to $10.27 million, down about 22%. The 14:14 quote at 0.04692 is slightly below that hourly close, and also below the hourly high 0.04802 and the 24h high 0.05499. At this stage, it can only be called a partial rebound after a pullback.
OI rose from about 650.5 million contracts at ~08:00 to about 662.3 million at ~14:00, up roughly 1.8%. OI can’t distinguish long vs. short. The funding rate settled at 12:00 was +0.035796% per 4 hours. A positive rate means longs pay shorts. It describes crowded positioning cost, but it doesn’t indicate which side will definitely win. In the 14:14 order-book snapshot, the bid/ask around the mid price within 0.5% were about $265k on the buy side and $462k on the sell side; the spread is about 4.27 bps. A single order can be cancelled, so it can’t be taken as evidence of continuous support.
Binance’s March 11 contract announcement describes $Lobster as a Chinese meme coin on the BNB Chain, with a maximum leverage of 5x. That’s only the asset identity and contract rules—not the catalyst for this round. As of 14:18, I haven’t verified any recent project team announcement or exchange news that could explain the sharp surge. Going forward, we need to watch whether the completed 12:00–16:00 four-hour segment can stand above 0.04802, or if it falls back below 0.04172. Whichever direction, confirmation requires subsequent candlestick closes. #LobsterUSDT
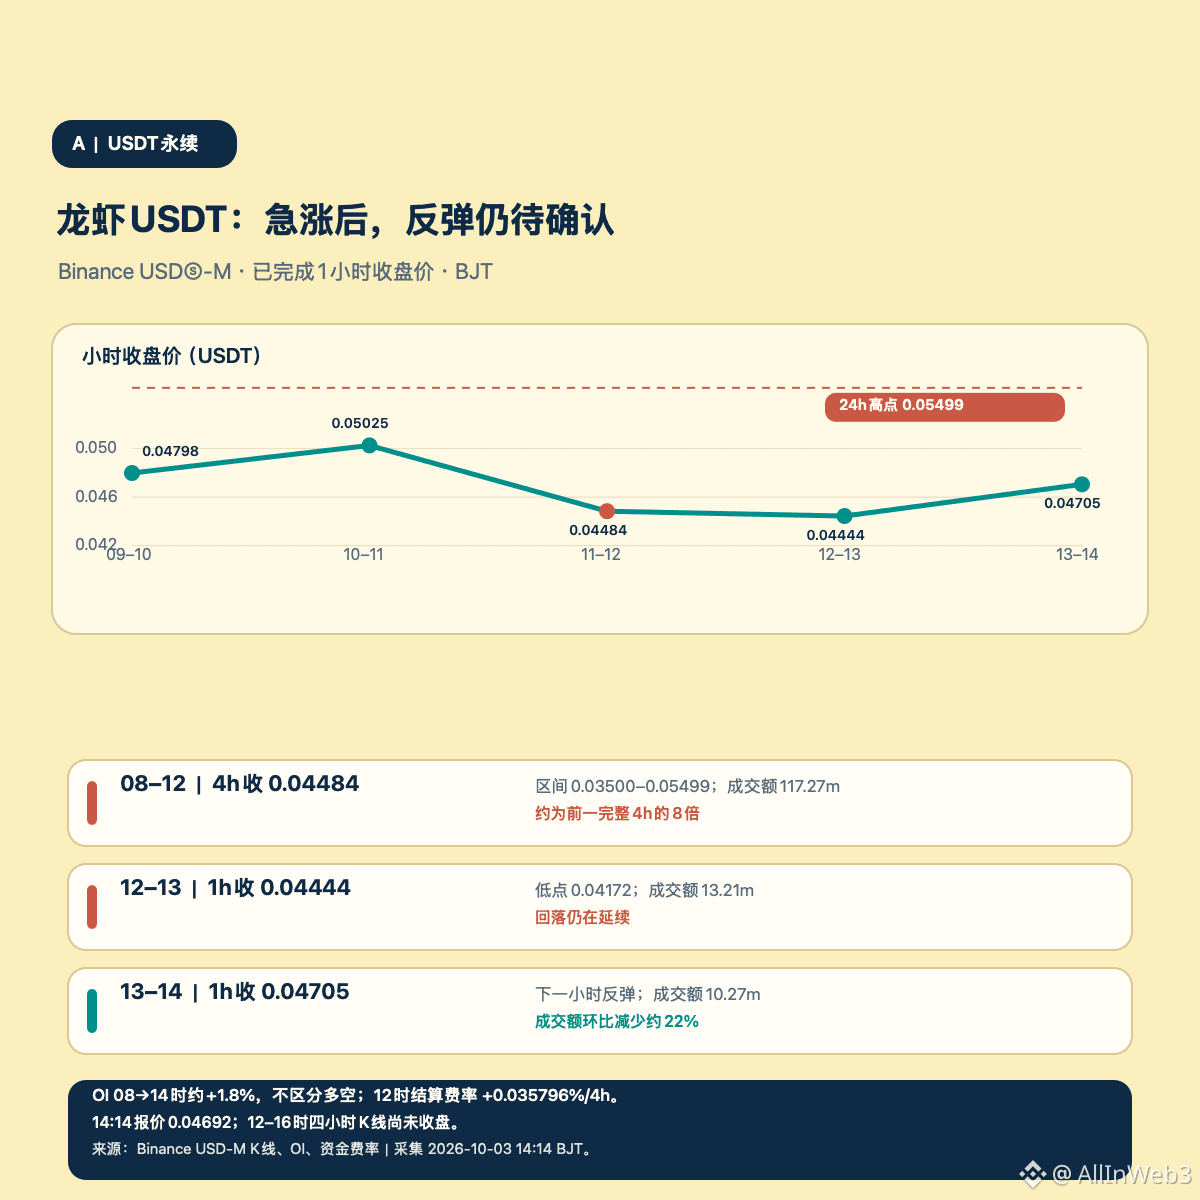
1
264
·
--
NEAR Intents: A key development has emerged in the roughly $3.8 million incident. On October 2, the person in charge, Alex Shevchenko, updated that the funds have been fully returned and that the team has stopped its investigation. This progress differs from what this account’s earlier post 372883493109296 recorded: “identified the parties involved and provided a 48-hour repayment window”—at that time it was still unclear whether the funds had actually arrived. Now the lead’s original post provides a new status, but the items “project confirmation,” “publicly verifiable on-chain amounts,” and “users received compensation” should be separated.
The first layer is the incident ledger. NEAR Intents previously said its preliminary loss was about $3.8 million and promised full compensation. This represents a loss estimate and a commitment to repay; it is not proof of funds having been received.
The second layer is repayment evidence. The Bitcoin refund address published by the administrator received 34.59 BTC between 14:31 and 15:05 UTC on October 2. At that time, this was roughly $852,000 per BTC, totaling about $2.95 million. On BNB Chain, there is also a separate transaction sent to a designated address; the input data states “all funds have been returned.” On-chain, it can prove that this text was written into the transaction, but it cannot confirm the sender’s identity using only an address label. The负责人 later replied to an on-chain researcher’s assessment of other channels: “You’re right—yes, that is the case.”
The third layer still requires caution: the publicly visible Bitcoin inflow is about 78% of the estimated $3.8 million, while the remaining portion did not form an independently verifiable asset list on these already published addresses. The project lead claims full repayment, but what on-chain observers can verify is limited to specific addresses and specific transactions—these forms of evidence cover different scopes. Full repayment also does not mean that affected users have already received compensation. Stopping the team’s investigation does not equal law enforcement closing the case.
What truly deserves to be waited for next is not repeating the attempt to “recover the $3.8 million,” but NEAR Intents’ post-incident report, confirmation that affected users received compensation, and verifiable explanations of the repayment routes for the remaining roughly $850,000. The previously announced 48-hour deadline, the lead’s announcement that the funds had been returned, and the users’ compensation hitting their accounts are three different points in time. #NEAR # security incident
NEAR Intents: A key development has emerged in the roughly $3.8 million incident. On October 2, the person in charge, Alex Shevchenko, updated that the funds have been fully returned and that the team has stopped its investigation. This progress differs from what this account’s earlier post 372883493109296 recorded: “identified the parties involved and provided a 48-hour repayment window”—at that time it was still unclear whether the funds had actually arrived. Now the lead’s original post provides a new status, but the items “project confirmation,” “publicly verifiable on-chain amounts,” and “users received compensation” should be separated.
The first layer is the incident ledger. NEAR Intents previously said its preliminary loss was about $3.8 million and promised full compensation. This represents a loss estimate and a commitment to repay; it is not proof of funds having been received.
The second layer is repayment evidence. The Bitcoin refund address published by the administrator received 34.59 BTC between 14:31 and 15:05 UTC on October 2. At that time, this was roughly $852,000 per BTC, totaling about $2.95 million. On BNB Chain, there is also a separate transaction sent to a designated address; the input data states “all funds have been returned.” On-chain, it can prove that this text was written into the transaction, but it cannot confirm the sender’s identity using only an address label. The负责人 later replied to an on-chain researcher’s assessment of other channels: “You’re right—yes, that is the case.”
The third layer still requires caution: the publicly visible Bitcoin inflow is about 78% of the estimated $3.8 million, while the remaining portion did not form an independently verifiable asset list on these already published addresses. The project lead claims full repayment, but what on-chain observers can verify is limited to specific addresses and specific transactions—these forms of evidence cover different scopes. Full repayment also does not mean that affected users have already received compensation. Stopping the team’s investigation does not equal law enforcement closing the case.
What truly deserves to be waited for next is not repeating the attempt to “recover the $3.8 million,” but NEAR Intents’ post-incident report, confirmation that affected users received compensation, and verifiable explanations of the repayment routes for the remaining roughly $850,000. The previously announced 48-hour deadline, the lead’s announcement that the funds had been returned, and the users’ compensation hitting their accounts are three different points in time. #NEAR # security incident
The first layer is the incident ledger. NEAR Intents previously said its preliminary loss was about $3.8 million and promised full compensation. This represents a loss estimate and a commitment to repay; it is not proof of funds having been received.
The second layer is repayment evidence. The Bitcoin refund address published by the administrator received 34.59 BTC between 14:31 and 15:05 UTC on October 2. At that time, this was roughly $852,000 per BTC, totaling about $2.95 million. On BNB Chain, there is also a separate transaction sent to a designated address; the input data states “all funds have been returned.” On-chain, it can prove that this text was written into the transaction, but it cannot confirm the sender’s identity using only an address label. The负责人 later replied to an on-chain researcher’s assessment of other channels: “You’re right—yes, that is the case.”
The third layer still requires caution: the publicly visible Bitcoin inflow is about 78% of the estimated $3.8 million, while the remaining portion did not form an independently verifiable asset list on these already published addresses. The project lead claims full repayment, but what on-chain observers can verify is limited to specific addresses and specific transactions—these forms of evidence cover different scopes. Full repayment also does not mean that affected users have already received compensation. Stopping the team’s investigation does not equal law enforcement closing the case.
What truly deserves to be waited for next is not repeating the attempt to “recover the $3.8 million,” but NEAR Intents’ post-incident report, confirmation that affected users received compensation, and verifiable explanations of the repayment routes for the remaining roughly $850,000. The previously announced 48-hour deadline, the lead’s announcement that the funds had been returned, and the users’ compensation hitting their accounts are three different points in time. #NEAR # security incident
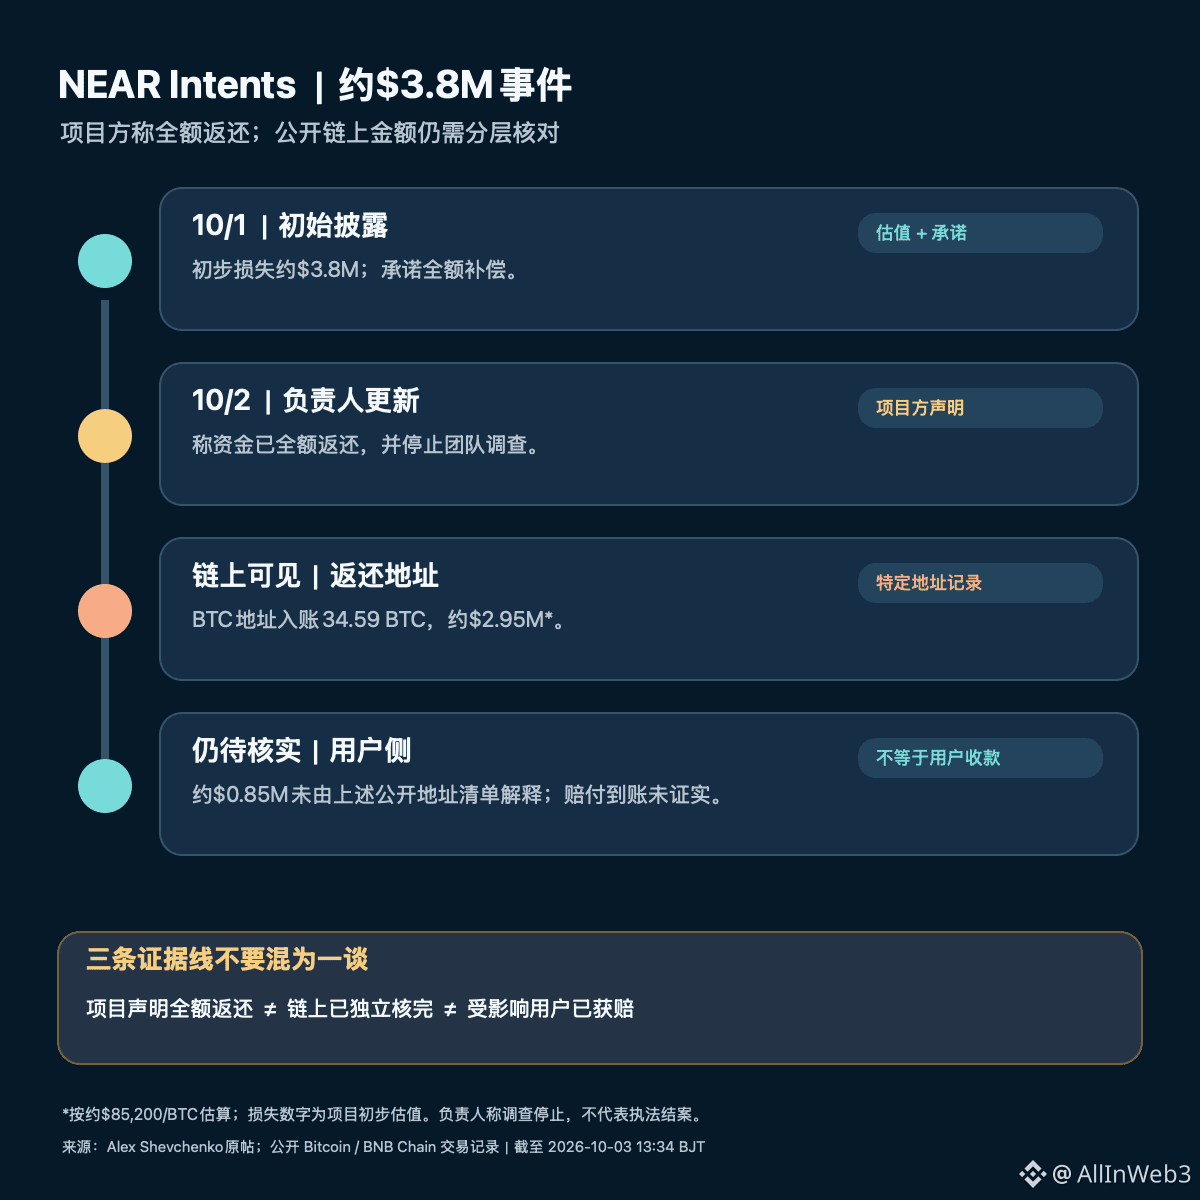
1
314
·
--
【$SAND短线先观望、不追:成交降温,收盘确认仍关键】
13:09 Beijing time, the full rescan is still complete at 526/526. SANDUSDT maintains the #1 gain position, up 24 hours by +76.445%, scan price 0.08180, and an estimated trading value of about $1.215 billion. At 13:09:30, the single-coin quote is 0.08165, which is about 10.4% higher than the sampled price of 0.07394 from this account’s earlier post at 11:08. The rolling gain widened by 11.14 percentage points. This is a new change after the acceleration segment in the earlier post, and it does not mean the rally can be extrapolated.
The new structure looks more like raising the closing after topping out, rather than a straight-line surge. From 11:00 to 12:00, the hourly high was 0.08269 and the close was 0.07851; from 12:00 to 13:00, the high was 0.08200 and the low was 0.07754, and the close was 0.08070—about 2.8% higher than the previous hour’s close. However, in the subsequent hour, the contract trading value was about $69.96 million, down about 44% from the prior hour’s $124.9 million. This suggests that when the price is pushed higher, the trading drive weakens. You cannot confirm a breakout just by the close moving up; you need to watch whether it can rise with volume and close above 0.08269, or whether any pullback holds the 0.07754 level.
Derivatives provide positioning context, not proof of direction. The Binance hourly OI quantity sample increased from about 422.4 million around 11:00 to about 448.0 million around 13:00, up roughly 6.1%. OI does not distinguish between longs and shorts. The 08:00 settled funding rate is -0.70582% per 8 hours. As of 13:09, the predicted funding rate for the next interval is -1.11343%, expected to settle around 16:00 but not yet confirmed. A negative funding rate means, under this metric, shorts pay funding to longs; you therefore cannot conclude from this that shorts are crowded or that a short squeeze is inevitable.
At present, no verifiable new announcement has been found that can explain this round of acceleration. The trading warning being lifted is background from the earlier post that was checked, and should not be treated as a new catalyst. What short-term needs verification is whether there are complete hourly closes above 0.08269 with trading support (volume/presence), and whether the funding settlement value deviates significantly from the forecast. If trading continues to shrink and the price breaks below the recent hourly low, the explanation for the current elevated close would need to be reassessed. Data sampling is up to 13:09:30 Beijing time, and the full order-book rescan is at 13:09; the market situation and any yet-to-settle funding rates will continue to change.
【$SAND 短线先观望、不追:成交降温,收盘确认仍关键】
13:09 Beijing time, the full rescan is still complete at 526/526. SANDUSDT maintains the #1 gain position, up 24 hours by +76.445%, scan price 0.08180, and an estimated trading value of about $1.215 billion. At 13:09:30, the single-coin quote is 0.08165, which is about 10.4% higher than the sampled price of 0.07394 from this account’s earlier post at 11:08. The rolling gain widened by 11.14 percentage points. This is a new change after the acceleration segment in the earlier post, and it does not mean the rally can be extrapolated.
The new structure looks more like raising the closing after topping out, rather than a straight-line surge. From 11:00 to 12:00, the hourly high was 0.08269 and the close was 0.07851; from 12:00 to 13:00, the high was 0.08200 and the low was 0.07754, and the close was 0.08070—about 2.8% higher than the previous hour’s close. However, in the subsequent hour, the contract trading value was about $69.96 million, down about 44% from the prior hour’s $124.9 million. This suggests that when the price is pushed higher, the trading drive weakens. You cannot confirm a breakout just by the close moving up; you need to watch whether it can rise with volume and close above 0.08269, or whether any pullback holds the 0.07754 level.
Derivatives provide positioning context, not proof of direction. The Binance hourly OI quantity sample increased from about 422.4 million around 11:00 to about 448.0 million around 13:00, up roughly 6.1%. OI does not distinguish between longs and shorts. The 08:00 settled funding rate is -0.70582% per 8 hours. As of 13:09, the predicted funding rate for the next interval is -1.11343%, expected to settle around 16:00 but not yet confirmed. A negative funding rate means, under this metric, shorts pay funding to longs; you therefore cannot conclude from this that shorts are crowded or that a short squeeze is inevitable.
At present, no verifiable new announcement has been found that can explain this round of acceleration. The trading warning being lifted is background from the earlier post that was checked, and should not be treated as a new catalyst. What short-term needs verification is whether there are complete hourly closes above 0.08269 with trading support (volume/presence), and whether the funding settlement value deviates significantly from the forecast. If trading continues to shrink and the price breaks below the recent hourly low, the explanation for the current elevated close would need to be reassessed. Data sampling is up to 13:09:30 Beijing time, and the full order-book rescan is at 13:09; the market situation and any yet-to-settle funding rates will continue to change.
13:09 Beijing time, the full rescan is still complete at 526/526. SANDUSDT maintains the #1 gain position, up 24 hours by +76.445%, scan price 0.08180, and an estimated trading value of about $1.215 billion. At 13:09:30, the single-coin quote is 0.08165, which is about 10.4% higher than the sampled price of 0.07394 from this account’s earlier post at 11:08. The rolling gain widened by 11.14 percentage points. This is a new change after the acceleration segment in the earlier post, and it does not mean the rally can be extrapolated.
The new structure looks more like raising the closing after topping out, rather than a straight-line surge. From 11:00 to 12:00, the hourly high was 0.08269 and the close was 0.07851; from 12:00 to 13:00, the high was 0.08200 and the low was 0.07754, and the close was 0.08070—about 2.8% higher than the previous hour’s close. However, in the subsequent hour, the contract trading value was about $69.96 million, down about 44% from the prior hour’s $124.9 million. This suggests that when the price is pushed higher, the trading drive weakens. You cannot confirm a breakout just by the close moving up; you need to watch whether it can rise with volume and close above 0.08269, or whether any pullback holds the 0.07754 level.
Derivatives provide positioning context, not proof of direction. The Binance hourly OI quantity sample increased from about 422.4 million around 11:00 to about 448.0 million around 13:00, up roughly 6.1%. OI does not distinguish between longs and shorts. The 08:00 settled funding rate is -0.70582% per 8 hours. As of 13:09, the predicted funding rate for the next interval is -1.11343%, expected to settle around 16:00 but not yet confirmed. A negative funding rate means, under this metric, shorts pay funding to longs; you therefore cannot conclude from this that shorts are crowded or that a short squeeze is inevitable.
At present, no verifiable new announcement has been found that can explain this round of acceleration. The trading warning being lifted is background from the earlier post that was checked, and should not be treated as a new catalyst. What short-term needs verification is whether there are complete hourly closes above 0.08269 with trading support (volume/presence), and whether the funding settlement value deviates significantly from the forecast. If trading continues to shrink and the price breaks below the recent hourly low, the explanation for the current elevated close would need to be reassessed. Data sampling is up to 13:09:30 Beijing time, and the full order-book rescan is at 13:09; the market situation and any yet-to-settle funding rates will continue to change.
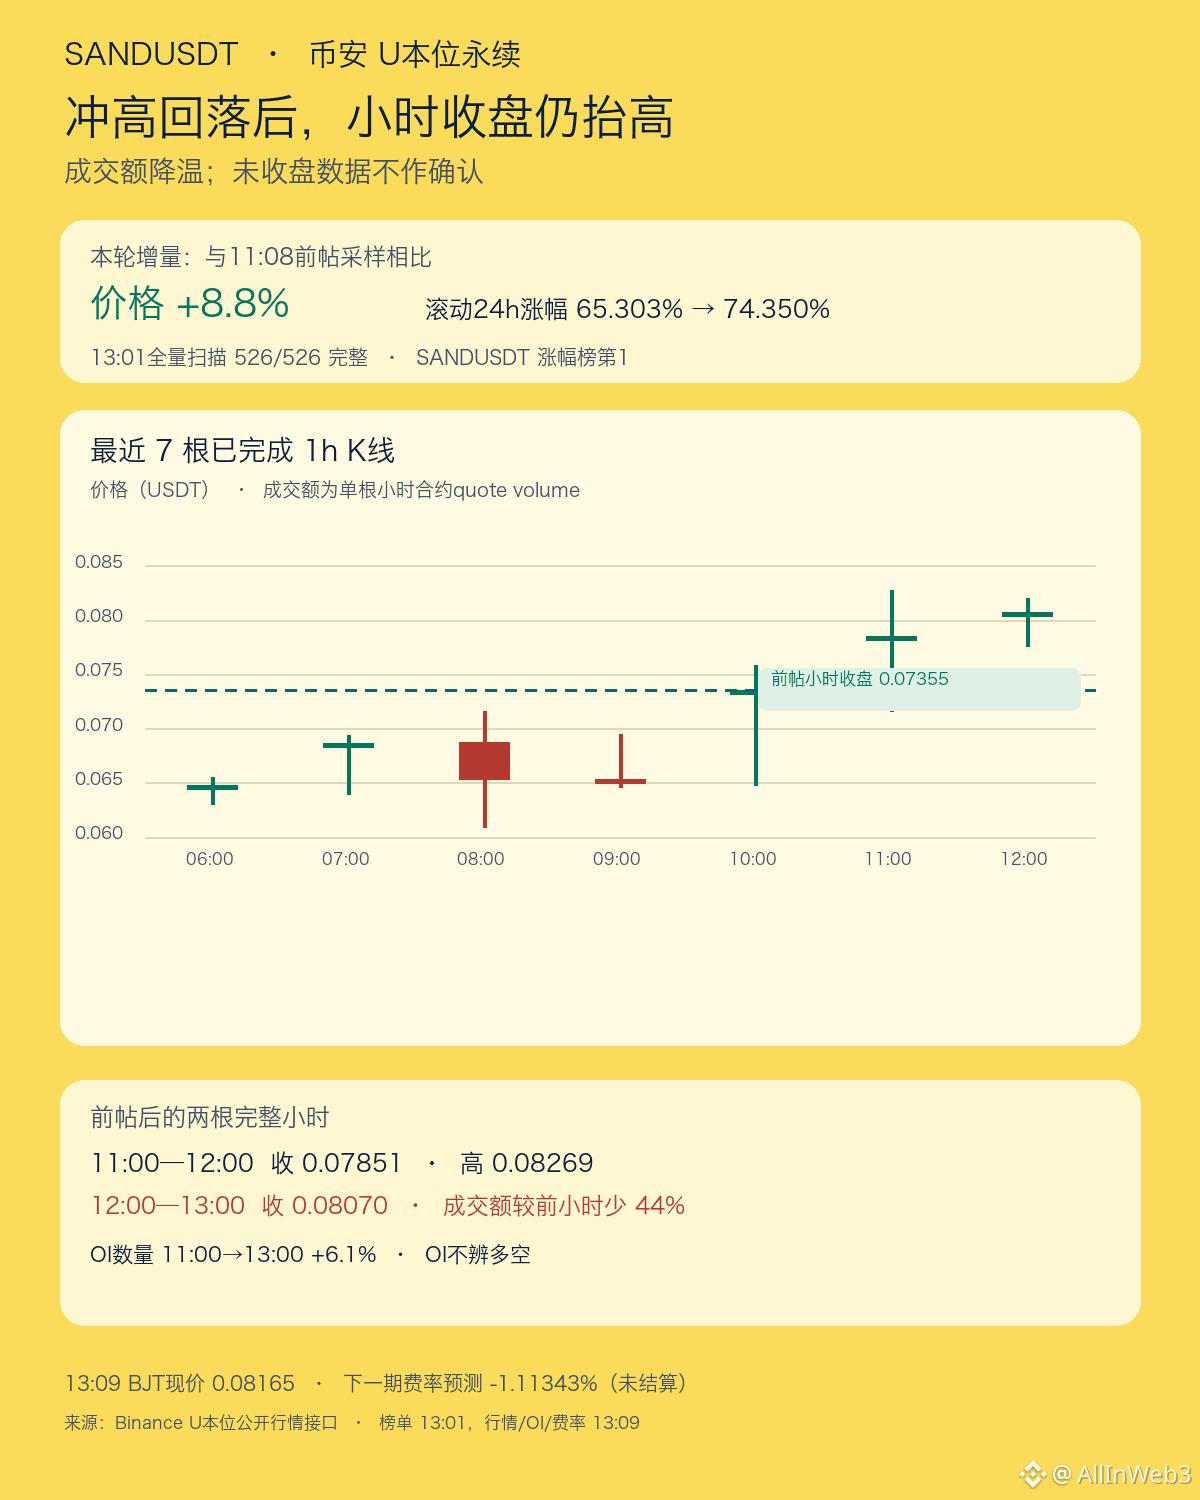
1
127
·
--
[ZEC rebounded about 4% from its intraday low, but is still down about 22% from the stage high]
Binance Square 11:32 (Beijing time) realtime topic leaderboard, ranked #8, quoted: “Zcash has fallen 21% from its September peak.” This percentage needs to be refreshed using the same trading pair and the same price reference. The daily K chart for Binance spot ZECUSDT shows that the high price on September 26 was 1,698 USDT. As of October 3 at 11:48, the latest spot price is 1,323.84, which is about 22.0% lower than that stage high. This only represents the Binance ZECUSDT sample and does not mean a uniform market-wide peak.
On the other hand, the lowest traded price over the rolling 24-hour range is 1,271.09. The latest price is about 4.1% higher than that low; meanwhile, the 24-hour change in the same period is still -0.646%. In other words, both can be true at the same time: there is a rebound during the day, but the pullback from the high can also occur concurrently. The 24-hour high is 1,412.12; the range is wider. Looking only at the percentage of rebound from the low, you cannot conclude that the downtrend has already reversed, nor can you determine which piece of news triggered the rebound.
This re-check brings new data compared with the post at 02:54 in this account (373047484267284): at the time, the recorded price was 1,290.07, with a rolling 24-hour drop of 3.526%, and a pullback of about 24.0% versus the September reference high. Now the price is about 2.6% higher; the 24-hour decline has narrowed, and the pullback is about 22.0%. The direction of change is a repair, not a new low. The calculation benchmark remains the September 26 high of 1,698 from Binance spot daily K; the current price and the 24-hour low come from the ticker at 11:48. You cannot mix these windows into a single daily-candle conclusion.
Another time boundary is also important: the October 3 UTC daily K had not finished collecting at the time of capture, so you cannot count it in advance as a bullish close. Going forward, wait for the complete daily K, then compare it with trading volume and the longer-interval structure. If you only reference the hot-list “21%” without indicating the quote timestamp, the percentage will quickly become outdated. This article only updates the price window and does not confirm any catalyst; it does not constitute a buy or sell judgment.
Emphasizing the definitions one more time: 22.0% is measured by the current price versus the September 26 high; 4.1% is measured from the low of the past 24 hours. The two use different windows and different denominators, so they cannot be added together, and you also cannot write that a short-term rebound means the stage pullback has already been repaired.
[ZEC rebounded about 4% from its intraday low, but is still down about 22% from the stage high]
Binance Square 11:32 (Beijing time) realtime topic leaderboard, ranked #8, quoted: “Zcash has fallen 21% from its September peak.” This percentage needs to be refreshed using the same trading pair and the same price reference. The daily K chart for Binance spot ZECUSDT shows that the high price on September 26 was 1,698 USDT. As of October 3 at 11:48, the latest spot price is 1,323.84, which is about 22.0% lower than that stage high. This only represents the Binance ZECUSDT sample and does not mean a uniform market-wide peak.
On the other hand, the lowest traded price over the rolling 24-hour range is 1,271.09. The latest price is about 4.1% higher than that low; meanwhile, the 24-hour change in the same period is still -0.646%. In other words, both can be true at the same time: there is a rebound during the day, but the pullback from the high can also occur concurrently. The 24-hour high is 1,412.12; the range is wider. Looking only at the percentage of rebound from the low, you cannot conclude that the downtrend has already reversed, nor can you determine which piece of news triggered the rebound.
This re-check brings new data compared with the post at 02:54 in this account (373047484267284): at the time, the recorded price was 1,290.07, with a rolling 24-hour drop of 3.526%, and a pullback of about 24.0% versus the September reference high. Now the price is about 2.6% higher; the 24-hour decline has narrowed, and the pullback is about 22.0%. The direction of change is a repair, not a new low. The calculation benchmark remains the September 26 high of 1,698 from Binance spot daily K; the current price and the 24-hour low come from the ticker at 11:48. You cannot mix these windows into a single daily-candle conclusion.
Another time boundary is also important: the October 3 UTC daily K had not finished collecting at the time of capture, so you cannot count it in advance as a bullish close. Going forward, wait for the complete daily K, then compare it with trading volume and the longer-interval structure. If you only reference the hot-list “21%” without indicating the quote timestamp, the percentage will quickly become outdated. This article only updates the price window and does not confirm any catalyst; it does not constitute a buy or sell judgment.
Emphasizing the definitions one more time: 22.0% is measured by the current price versus the September 26 high; 4.1% is measured from the low of the past 24 hours. The two use different windows and different denominators, so they cannot be added together, and you also cannot write that a short-term rebound means the stage pullback has already been repaired.
Binance Square 11:32 (Beijing time) realtime topic leaderboard, ranked #8, quoted: “Zcash has fallen 21% from its September peak.” This percentage needs to be refreshed using the same trading pair and the same price reference. The daily K chart for Binance spot ZECUSDT shows that the high price on September 26 was 1,698 USDT. As of October 3 at 11:48, the latest spot price is 1,323.84, which is about 22.0% lower than that stage high. This only represents the Binance ZECUSDT sample and does not mean a uniform market-wide peak.
On the other hand, the lowest traded price over the rolling 24-hour range is 1,271.09. The latest price is about 4.1% higher than that low; meanwhile, the 24-hour change in the same period is still -0.646%. In other words, both can be true at the same time: there is a rebound during the day, but the pullback from the high can also occur concurrently. The 24-hour high is 1,412.12; the range is wider. Looking only at the percentage of rebound from the low, you cannot conclude that the downtrend has already reversed, nor can you determine which piece of news triggered the rebound.
This re-check brings new data compared with the post at 02:54 in this account (373047484267284): at the time, the recorded price was 1,290.07, with a rolling 24-hour drop of 3.526%, and a pullback of about 24.0% versus the September reference high. Now the price is about 2.6% higher; the 24-hour decline has narrowed, and the pullback is about 22.0%. The direction of change is a repair, not a new low. The calculation benchmark remains the September 26 high of 1,698 from Binance spot daily K; the current price and the 24-hour low come from the ticker at 11:48. You cannot mix these windows into a single daily-candle conclusion.
Another time boundary is also important: the October 3 UTC daily K had not finished collecting at the time of capture, so you cannot count it in advance as a bullish close. Going forward, wait for the complete daily K, then compare it with trading volume and the longer-interval structure. If you only reference the hot-list “21%” without indicating the quote timestamp, the percentage will quickly become outdated. This article only updates the price window and does not confirm any catalyst; it does not constitute a buy or sell judgment.
Emphasizing the definitions one more time: 22.0% is measured by the current price versus the September 26 high; 4.1% is measured from the low of the past 24 hours. The two use different windows and different denominators, so they cannot be added together, and you also cannot write that a short-term rebound means the stage pullback has already been repaired.
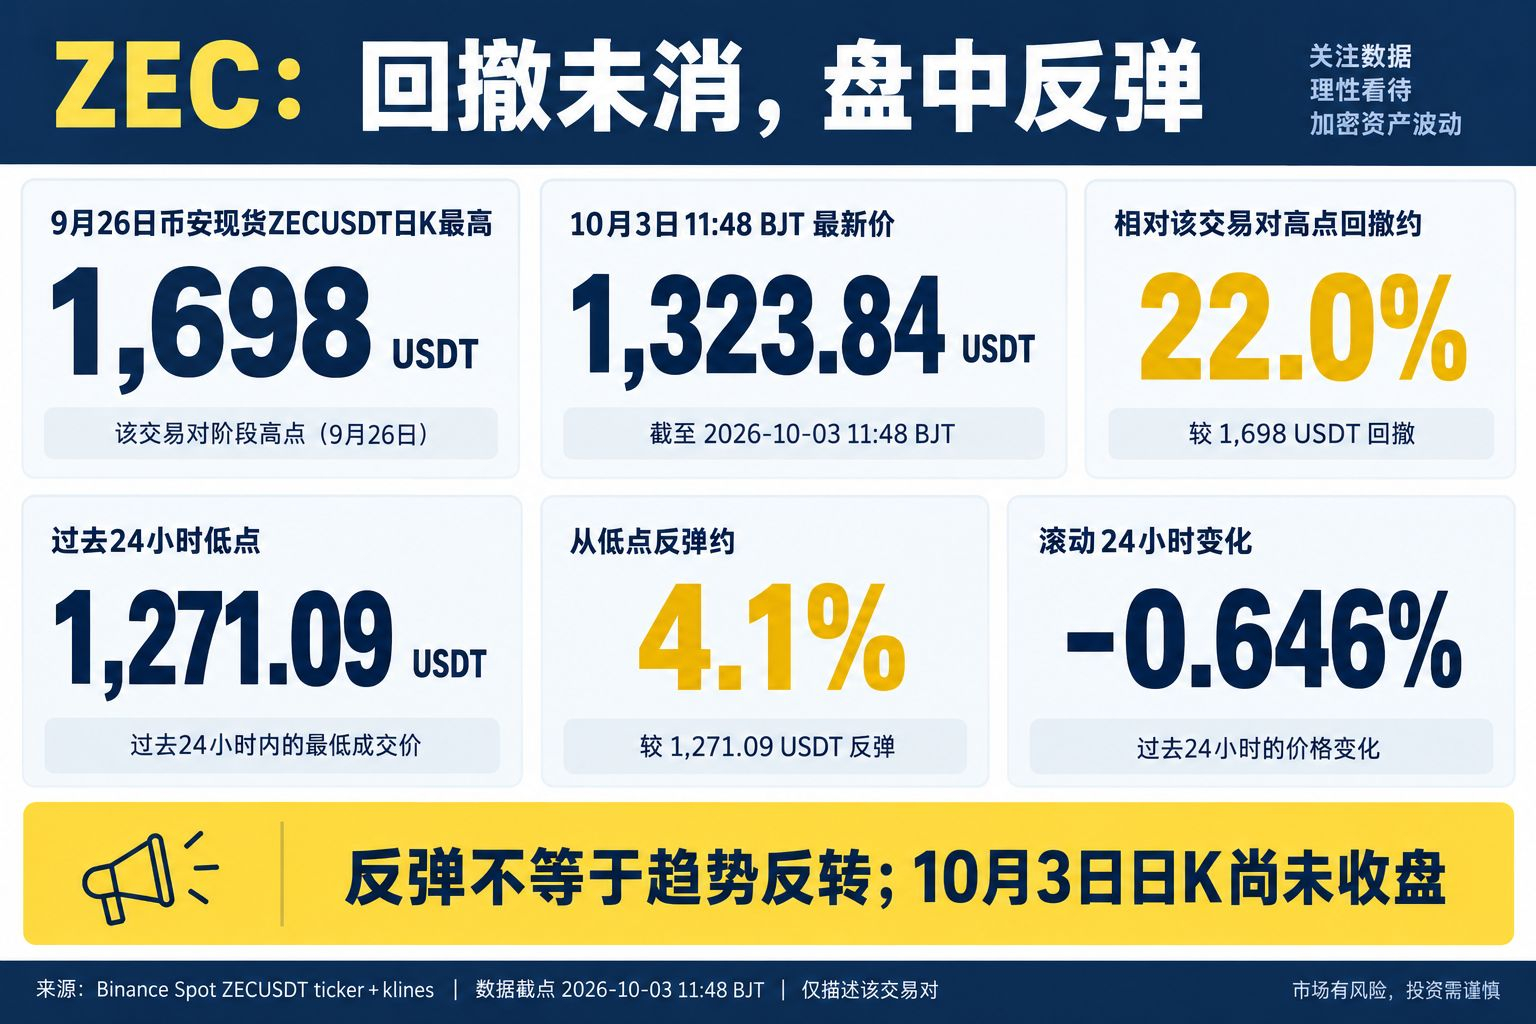
1
86
Log in to explore more content
Join global crypto users on Binance Square
⚡️ Get latest and useful information about crypto.
💬 Trusted by the world’s largest crypto exchange.
👍 Discover real insights from verified creators.
Email / Phone number
Trending Topics
ZcashETFPostsFirstWeeklyOutflow$93.6M
293 views
28 Discussing
#ZcashETFPostsFirstWeeklyOutflow$93.6M 📊 Grayscale Zcash ETF Records First Weekly Outflow of $93.6m
The first U.S. spot Zcash ETF has reached a notable market milestone. After weeks of strong initial demand, the fund has recorded its first significant weekly redemption.
📰 Core News
• Grayscale’s Zcash spot ETF (Ticker: ZCSH) recorded approximately $93.6 million in net outflows over a single week [[37]].
• Launched on August 25, 2026, the fund initially saw robust demand, briefly accounting for 32.5% of all spot crypto ETF trading volume [[34]].
• Despite this recent pullback, the fund remains net positive on cumulative inflows since its debut, with assets under management (AUM) adjusting to around $751 million from its peak [[36]].
📈 Market Impact
• Token Supply Dynamics Large ETF redemptions can introduce short-term selling pressure, especially since the fund previously held nearly 3.5% of ZEC’s total circulating supply [[38]].
• Institutional Sentiment This cooling momentum reflects a broader market trend where initial capital rotation into new altcoin ETF products normalizes into more measured, steady demand.
• Ecosystem Development While weekly outflows draw attention, the continued trading of regulated investment vehicles for privacy-focused assets remains a structural development for the broader crypto ecosystem.
💬 Engagement
Do you view this weekly outflow as a healthy market normalization after a strong launch, or a sign of shifting institutional sentiment toward privacy-focused assets? Share your analysis below! 👇
#Zcash #ZEC #CryptoETF #Grayscale #CryptoMarket
This is for educational purposes only. Not Financial Advice (NFA). Always Do Your Own Research (DYOR).
$GLMR $QI $SAND
珍妮丝 kgf
·0 Likes
·103 views
GreekPoliceBustCryptoScamRingArrest17
585 views
104 Discussing
BitcoinRejectedAt$87K
52,266 views
91 Discussing