
Ethereum (ETH) has been declining in price in recent days after once again failing to break above the $2,000 mark on the 1-day chart. However, that may now be changing, as historically accurate trend indicators show.
Cryptocurrency traders and analysts are constantly looking for reliable indicators to navigate volatile markets. One such indicator to watch is the Tom Demark 9 (TD9), which generates a buy signal for Ethereum (ETH) on the daily chart. Renowned analyst Joe McCann shared his insights via Twitter, revealing that ETH’s historical TD9 buy signals have a 78% success rate.
Ethereum (ETH) Buy Signal
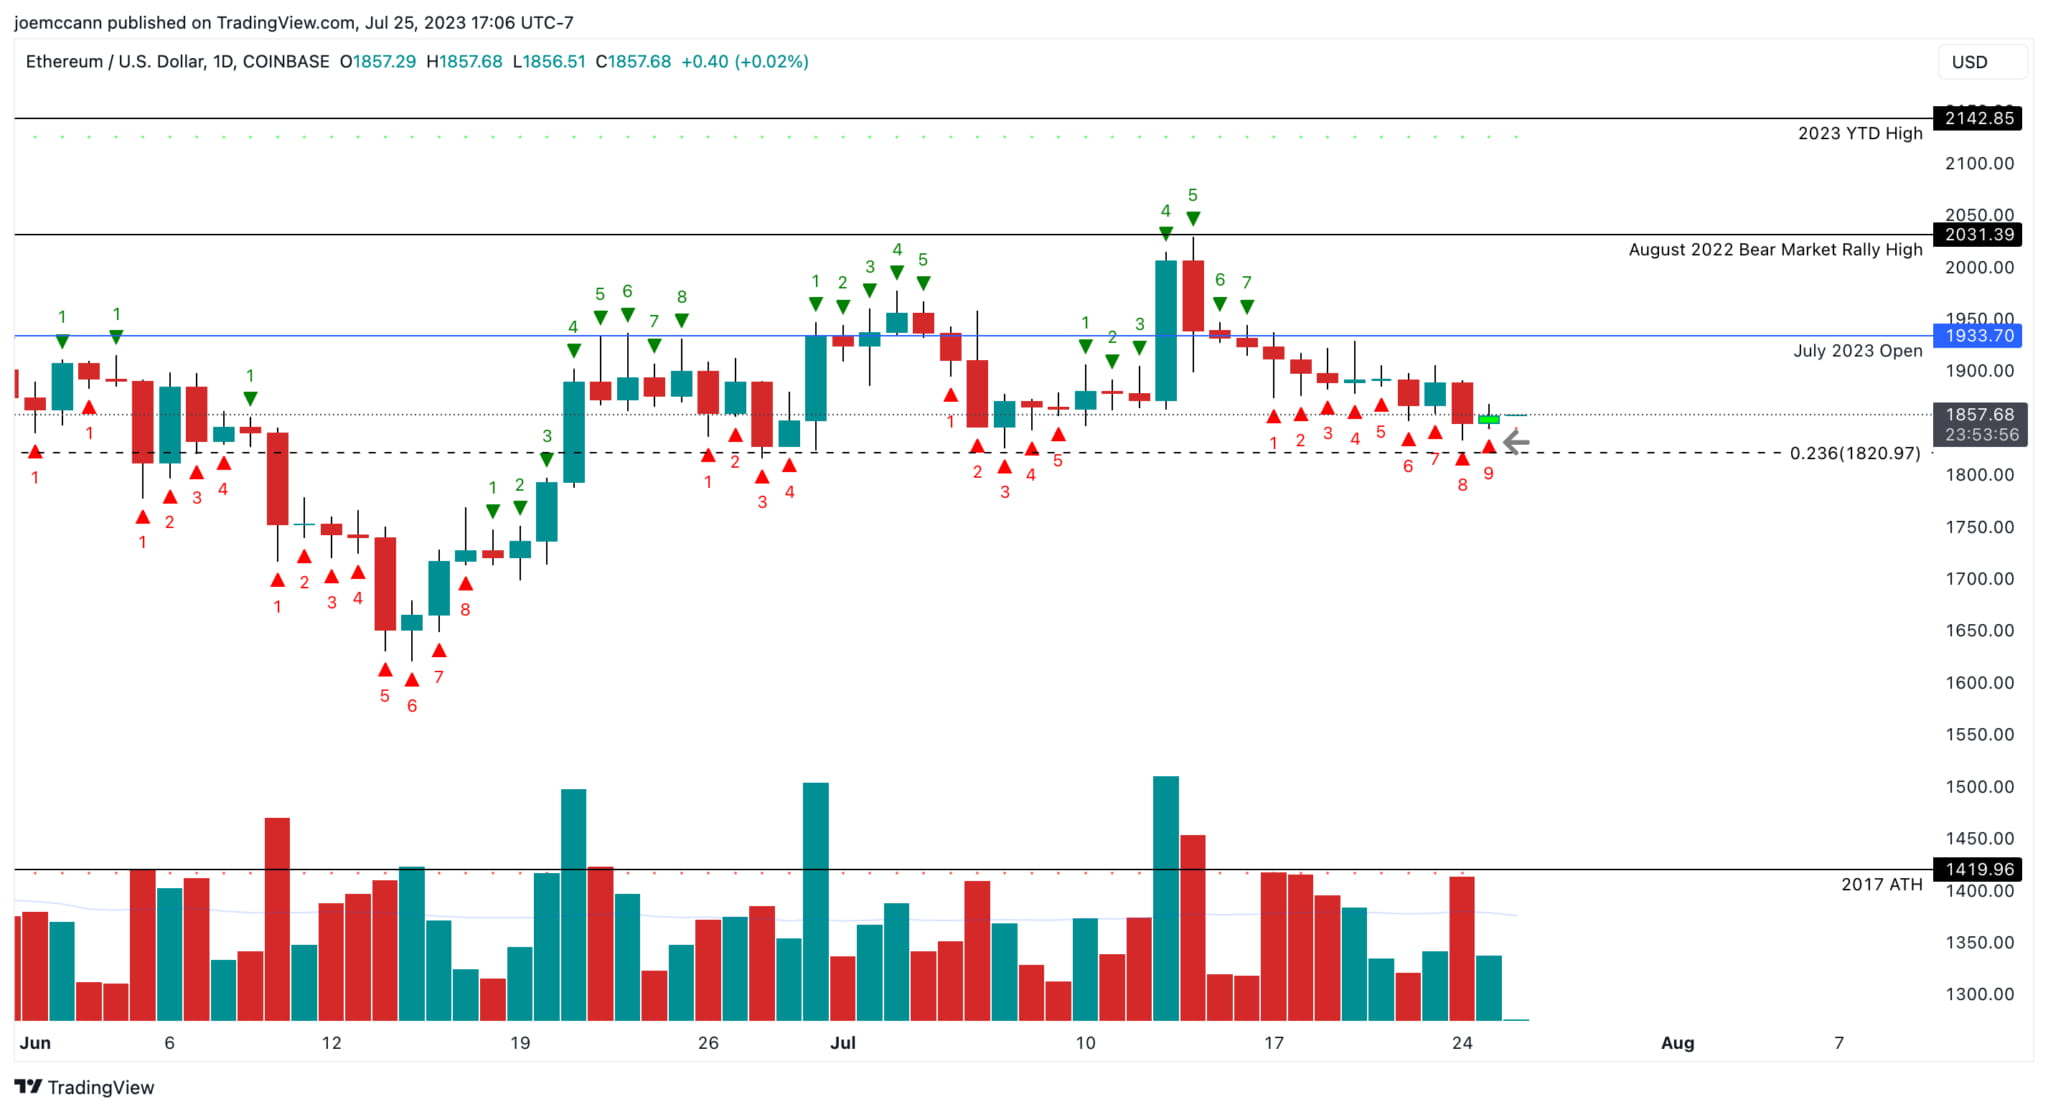
Joe McCann's tweet drew attention to the ETHUSD TD9 buy signal, which appeared after the asset fell 8.7% from its recent high. The TD9 indicator is also a measure of whether an asset is overbought or oversold, similar to the RSI, and is designed to identify potential trend reversals. According to McCann, historical data shows that the TD9 buy signal is very accurate for ETH, with a win rate of nearly 78%.
The analyst said possible price targets include the July open at $1,933, the August 2022 bear market rally high at $2,031 and the 2021 year-to-date high at $2,142.
Digging deeper into the data, McCann highlighted ETH’s impressive performance following a TD9 buy signal. Statistics show that the asset surged by an average of more than 2.6% in the seven days following the signal, with a median return of nearly 5%. These numbers alone should pique the interest of traders seeking an edge in the cryptocurrency market.
To provide a more nuanced picture, McCann narrowed the data to examine 2019, a period he believes resembles the crypto market cycle of 2023. The results were even more striking, showing a win rate of nearly 90% for TD9 buy signals during this period.
However, if we look back to 2019 (a year very similar to 2023 in terms of the cryptocurrency market cycle), ETH’s win rate was close to 90%, with an average return of over +7%.
However, as with any indicator, there are exceptions and occasional inaccuracies. McCann’s data shows several instances where the TD9 buy signal failed to accurately predict ETH price action.
It is worth noting that on March 13, 2018, when the buy signal was issued, the ETH price fell sharply. The ETH price plummeted 19.3% in 7 days and 34.8% in the next 14 days. The signal on May 8, 2018 was equally bad, after which ETH fell 22.1% in the next 7 days and 26.7% in the next 14 days.
On the other hand, TD9 buy signals have foreshadowed some massive rallies. For example, on December 10, 2018, after the signal was issued, ETH initially rose 3.7% in the first 7 days, but then rose 53.0% in 14 days and 64.5% in 30 days. The most recent TD9 buy signal on March 11, 20223, saw a price increase of 18.8% in the first 7 days and a price increase of 29.9% after 30 days.
Overall, it can be seen that the accuracy of the TD9 indicator decreases over time. While the indicator had a success rate of 78% in the first 7 days, an average 7-day forward return of +2.65%, and a median return of nearly 5%, the success rate decreased in the subsequent period. After 14 days, the TD9 indicator has a success rate of only 55.5% (average 3.8%, median 5.7%), and a success rate of 63.0% (average 6.9%, median 3.8%) after 30 days since 2018.
Fed meeting looms
Although the TD9 buy signal paints a positive picture for ETH, the cryptocurrency market remains vulnerable to external factors, including today’s upcoming FOMC meeting. The probability of a 25 basis point rate hike is 98.9%. But the big question is whether this will be the last rate hike of this cycle. McCann wrote:
July 26 is the latest Fed meeting, with Jerome Powell expected to raise interest rates by 25 basis points. Will Jerome Powell ruin the party for ETH bulls at his press conference?
At press time, Ether (ETH) is trading at $1,859.


