
Before we start briefly looking at #bitcoin chart here is an overview of what top 10 crypto currencies are doing right now.

BTCUSD (Weekly)

last week I said a potential move to the down side is more likely and we saw that how price witnessed a sharp move down. Going into this week is still expect price to continue pushing down and i would like to see price takes out those two weekly low and that is where i will start looking for a potential bounce play on bitcoin and altcoins once price will start trading under that low of $21200
Another Weekly Perspective

2 weeks back when i started sharing a potential of pullback , i shared this H & S pattern that you will see people posting this pattern once price will start to go down. keeping that into perspective $19500-21,000 is the area that will keep this patterns intact. $21000 is somehow aligning with our main idea of price taking the lows out. in between 19500-21000 is a good area to add the dips. i'm not saying we will see price will go that low to 19500 but keep the perspective in your mind.

Bitcoin 4hr Chart
The reason why i'm not sharing daily chart but the 4hr chart is there is nothing much going on , on daily chart but the 4hr chart is much cleaner.

This 4hr chart is almost as same as the one i shared last week, Last time $23500-$23800 area was previously support and was turning as resistance. right now we are witnessing the same scenario. Old area turning as resistance. As long as price is trading below $22800 Expect some more downside.

To add more into the 4hr chart
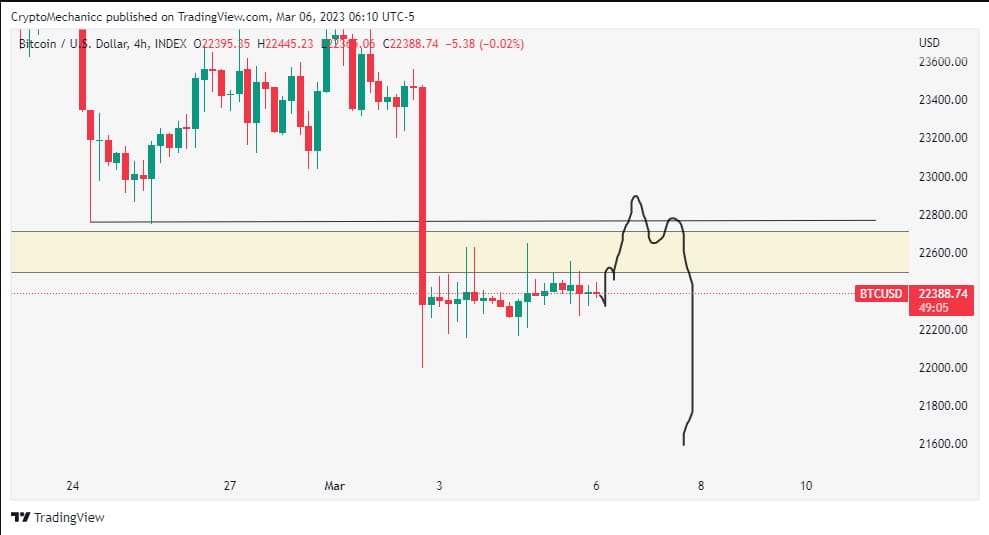
Do not get too excited if something like this happens.
This was it for today's #BTC weekly forecast, i hope you enjoyed reading it.
Stay safe and stay profitable, i will see you next week with another weekly update.


