
#tranding
tranding
224,957 views
522 Discussing
Hot
Latest

·
--
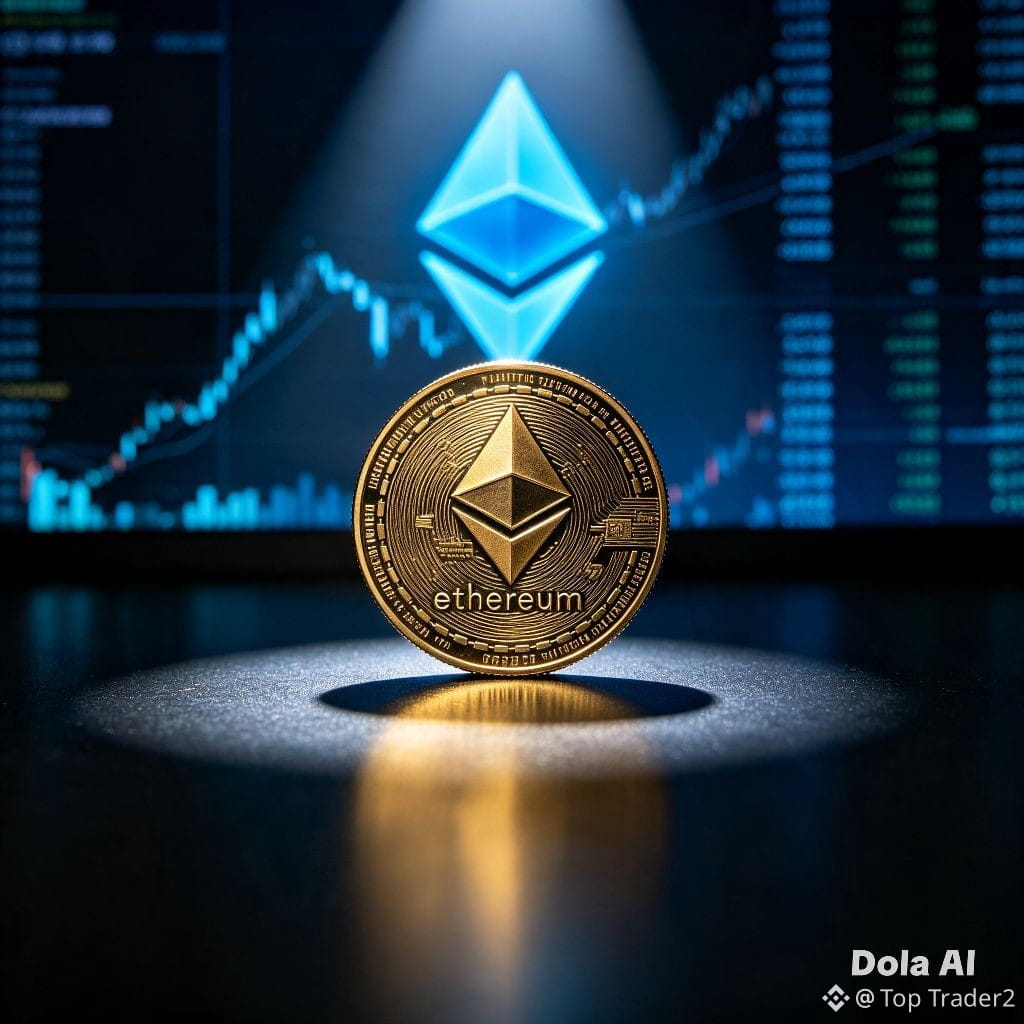
$ETH $ETH $ETH 🚨 Ethereum (ETH) — This Week’s Big News & Analysis
🔥 Big News: U.S. spot Ethereum ETFs recorded about $216M net inflows on Sept. 11, with BlackRock’s ETHA leading at $149M.
📊 Analysis: ETH has been consolidating after a strong rally. A move above $2,550–$2,800 could strengthen the bullish setup, while $2,350–$2,425 is an important support zone. Reuters noted a potential bull-flag structure with a technical target around $3,050.
🎯 Short-term view: 🟢 Bullish above $2,550 | 🔴 Weak below $2,425
*Not financial advice.*
{spot}(ETHUSDT)
#BigNews🚨🚨🚨 #tranding #ETH🔥🔥🔥🔥🔥🔥 #analysis
$ETH $ETH $ETH 🚨 Ethereum (ETH) — This Week’s Big News & Analysis
🔥 Big News: U.S. spot Ethereum ETFs recorded about $216M net inflows on Sept. 11, with BlackRock’s ETHA leading at $149M.
📊 Analysis: ETH has been consolidating after a strong rally. A move above $2,550–$2,800 could strengthen the bullish setup, while $2,350–$2,425 is an important support zone. Reuters noted a potential bull-flag structure with a technical target around $3,050.
🎯 Short-term view: 🟢 Bullish above $2,550 | 🔴 Weak below $2,425
*Not financial advice.*
#BigNews🚨🚨🚨 #tranding #ETH🔥🔥🔥🔥🔥🔥 #analysis
🔥 Big News: U.S. spot Ethereum ETFs recorded about $216M net inflows on Sept. 11, with BlackRock’s ETHA leading at $149M.
📊 Analysis: ETH has been consolidating after a strong rally. A move above $2,550–$2,800 could strengthen the bullish setup, while $2,350–$2,425 is an important support zone. Reuters noted a potential bull-flag structure with a technical target around $3,050.
🎯 Short-term view: 🟢 Bullish above $2,550 | 🔴 Weak below $2,425
*Not financial advice.*
#BigNews🚨🚨🚨 #tranding #ETH🔥🔥🔥🔥🔥🔥 #analysis
106

Verified
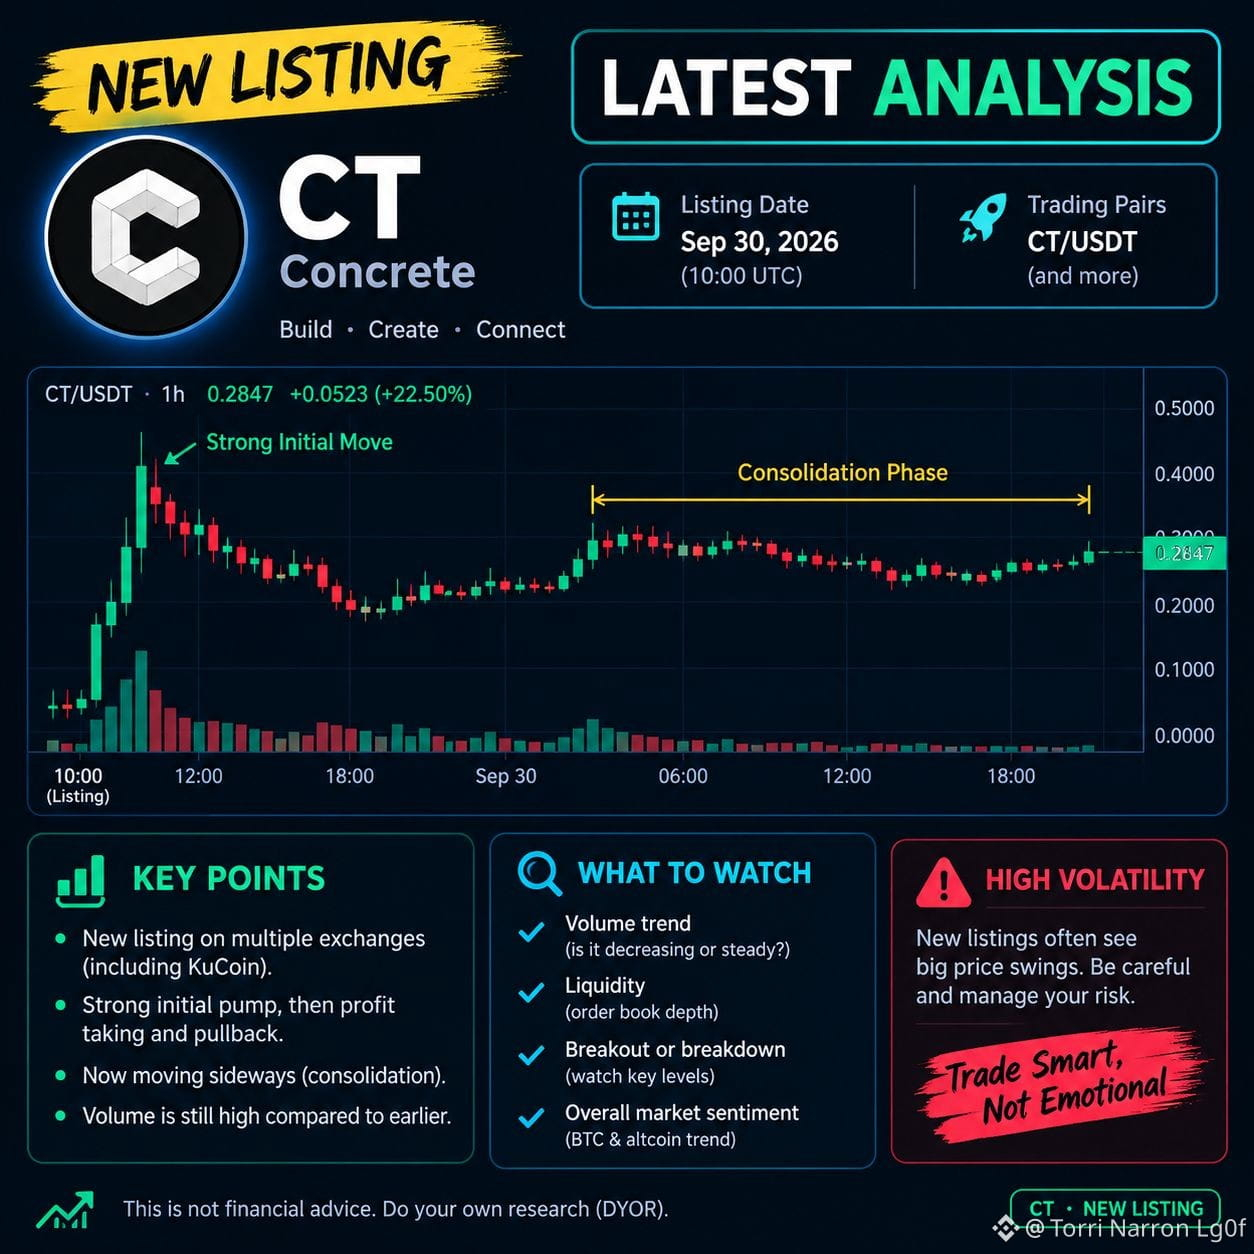
$CT (Concrete) — New Listing Analysis
CT was newly listed on multiple exchanges on September 30, 2026, including KuCoin. �
KuCoin +1
Short analysis: Strong initial volatility → profit-taking/pullback → consolidation. Watch volume, liquidity, and breakout/breakdown confirmation rather than chasing the first pump. New listings can move sharply in both directions.
#trandingtopic #tranding #NewsAboutCrypto
{alpha}(560x0a092e544da31150b439a1aaa1a3a2214a867f46)
$CT (Concrete) — New Listing Analysis
CT was newly listed on multiple exchanges on September 30, 2026, including KuCoin. �
KuCoin +1
Short analysis: Strong initial volatility → profit-taking/pullback → consolidation. Watch volume, liquidity, and breakout/breakdown confirmation rather than chasing the first pump. New listings can move sharply in both directions.
#trandingtopic #tranding #NewsAboutCrypto
CT was newly listed on multiple exchanges on September 30, 2026, including KuCoin. �
KuCoin +1
Short analysis: Strong initial volatility → profit-taking/pullback → consolidation. Watch volume, liquidity, and breakout/breakdown confirmation rather than chasing the first pump. New listings can move sharply in both directions.
#trandingtopic #tranding #NewsAboutCrypto
938

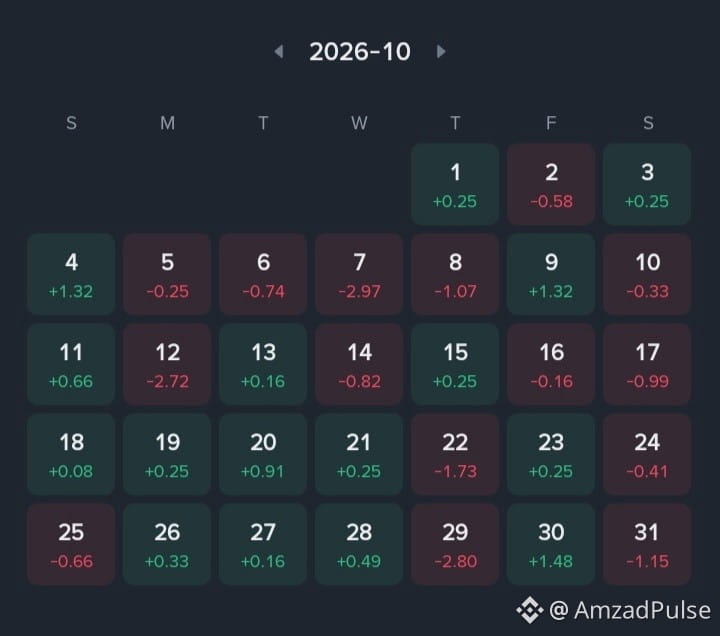
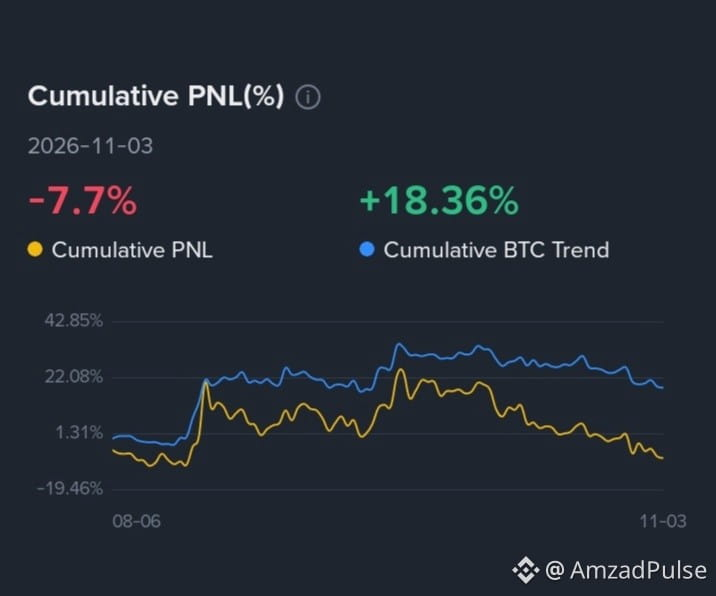
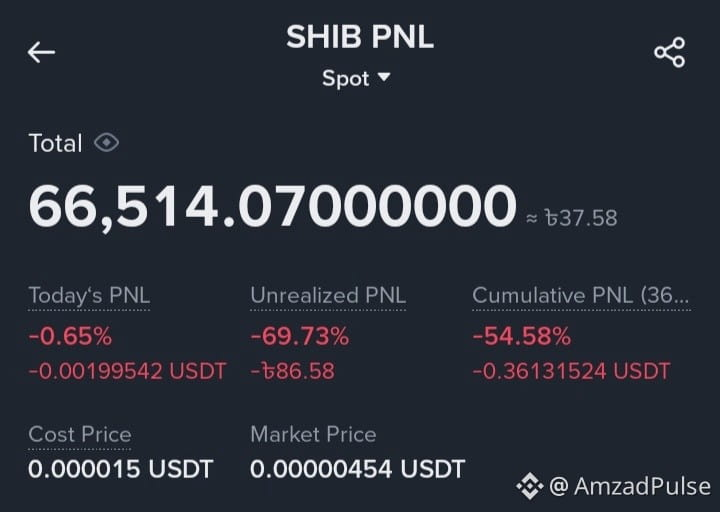

I’m keeping this 20X Long position open on ETHUSDT Perp, entered at 2,379.98. The market has been correcting, and it’s currently showing a -41.00% loss.
The trader’s journey isn’t always linear; dealing with losing positions and assessing whether the structure is holding up are part of the daily learning process. 🧠🛡️
How do you manage trades when the price enters the red zone? I’m all ears! 👇
#ETHUSDT #TradingJourney #RiskManagement #Binance #BinanceSquare #tranding #MundoCripto $ETH
I’m keeping this 20X Long position open on ETHUSDT Perp, entered at 2,379.98. The market has been correcting, and it’s currently showing a -41.00% loss.
The trader’s journey isn’t always linear; dealing with losing positions and assessing whether the structure is holding up are part of the daily learning process. 🧠🛡️
How do you manage trades when the price enters the red zone? I’m all ears! 👇
#ETHUSDT #TradingJourney #RiskManagement #Binance #BinanceSquare #tranding #MundoCripto $ETH
The trader’s journey isn’t always linear; dealing with losing positions and assessing whether the structure is holding up are part of the daily learning process. 🧠🛡️
How do you manage trades when the price enters the red zone? I’m all ears! 👇
#ETHUSDT #TradingJourney #RiskManagement #Binance #BinanceSquare #tranding #MundoCripto $ETH
1
105



·
--
$IRYS
📊 IRYS/USDT Market Analysis — 23 October 2026
Market Trend: Bullish Momentum | High Volatility
IRYS/USDT has shown strong upward momentum with increased trading volume. Buyers remain active, but a short-term pullback is possible after the sharp rally. �
BingX +1
🟢 Resistance: $0.0242
🟢 Support: $0.0216
🔵 Lower Support: $0.0175
🚀 Bullish Signal: A confirmed breakout above $0.0242 could support further upside.
⚠️ Risk: A break below $0.0216 could trigger a pullback toward $0.0175. �
TradingGain
Conclusion: IRYS remains bullish in the short term, but wait for candle confirmation before entering a trade. Manage risk carefully.
*Note: These are reference levels, not guaranteed predictions or live-verified entry signals.*
#IrysToken #MarketAnalysis" #tranding #Benince
{future}(IRYSUSDT)
$IRYS
📊 IRYS/USDT Market Analysis — 23 October 2026
Market Trend: Bullish Momentum | High Volatility
IRYS/USDT has shown strong upward momentum with increased trading volume. Buyers remain active, but a short-term pullback is possible after the sharp rally. �
BingX +1
🟢 Resistance: $0.0242
🟢 Support: $0.0216
🔵 Lower Support: $0.0175
🚀 Bullish Signal: A confirmed breakout above $0.0242 could support further upside.
⚠️ Risk: A break below $0.0216 could trigger a pullback toward $0.0175. �
TradingGain
Conclusion: IRYS remains bullish in the short term, but wait for candle confirmation before entering a trade. Manage risk carefully.
*Note: These are reference levels, not guaranteed predictions or live-verified entry signals.*
#IrysToken #MarketAnalysis" #tranding #Benince
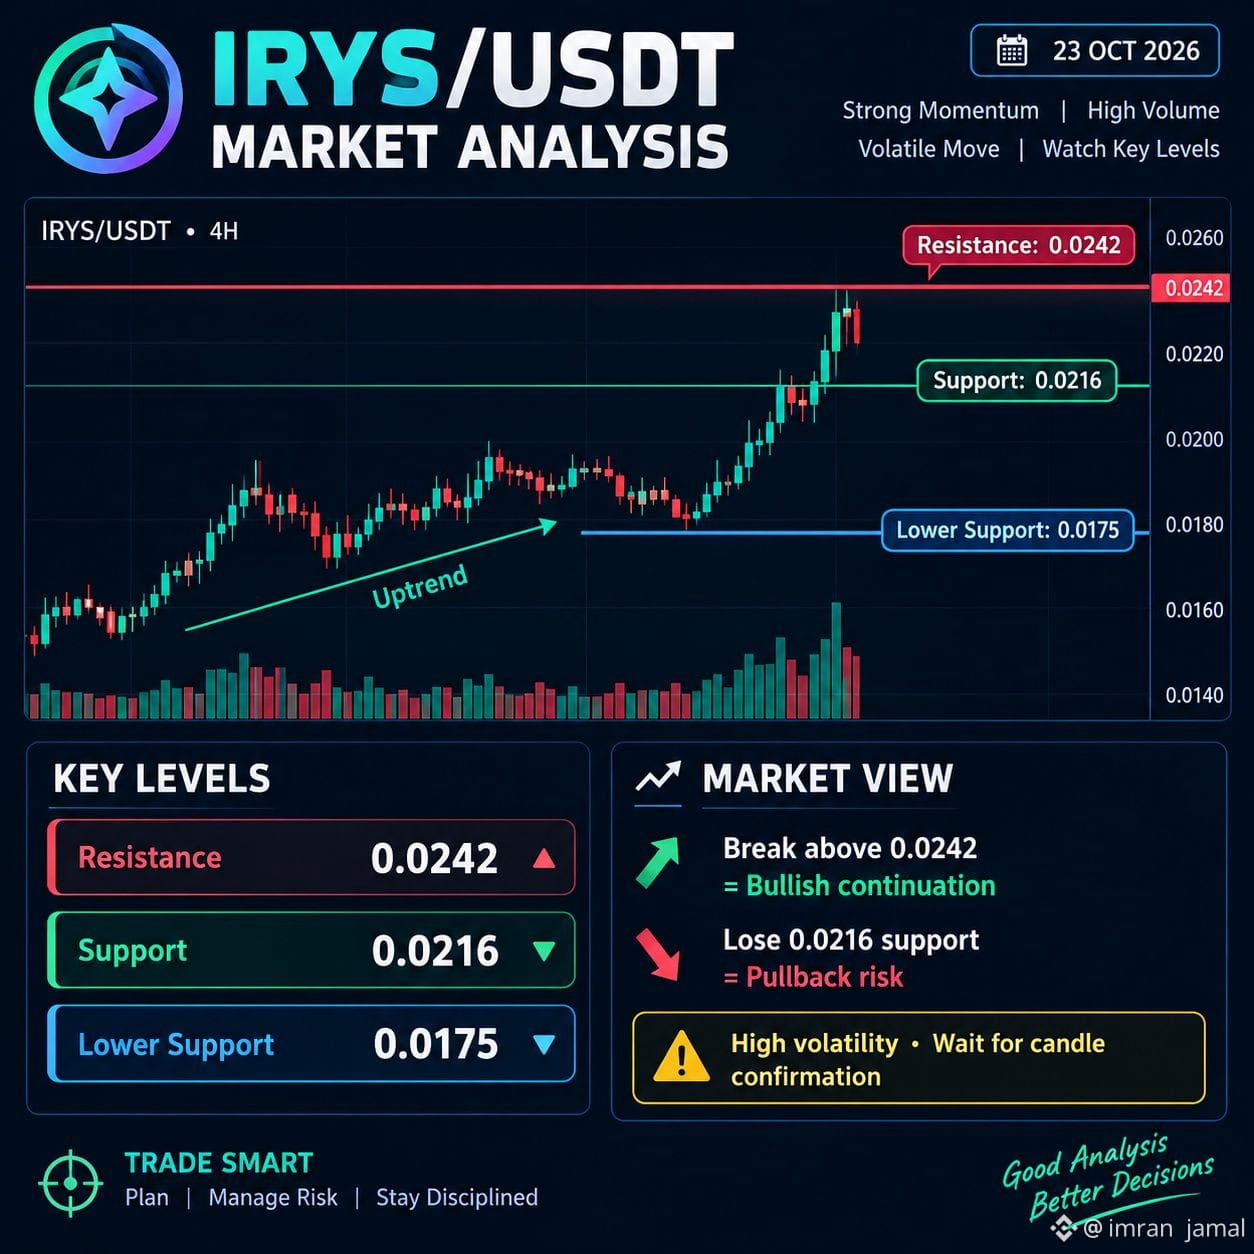
📊 IRYS/USDT Market Analysis — 23 October 2026
Market Trend: Bullish Momentum | High Volatility
IRYS/USDT has shown strong upward momentum with increased trading volume. Buyers remain active, but a short-term pullback is possible after the sharp rally. �
BingX +1
🟢 Resistance: $0.0242
🟢 Support: $0.0216
🔵 Lower Support: $0.0175
🚀 Bullish Signal: A confirmed breakout above $0.0242 could support further upside.
⚠️ Risk: A break below $0.0216 could trigger a pullback toward $0.0175. �
TradingGain
Conclusion: IRYS remains bullish in the short term, but wait for candle confirmation before entering a trade. Manage risk carefully.
*Note: These are reference levels, not guaranteed predictions or live-verified entry signals.*
#IrysToken #MarketAnalysis" #tranding #Benince
654



·
--
$PEPE /USDT Technical Analysis & Trade Setup
Pepe (PEPE) has started an upward recovery after bouncing strongly off its key support level. The price action indicates a potential bullish continuation moving toward the target resistance zone.
📌 Trade Setup (1H Timeframe):
Direction: LONG 🟢
Entry Zone: 0.00000388 - 0.00000390
Take Profit (TP): 0.00000433
Stop Loss (SL): 0.00000373
⚠️ Risk Warning: Always follow proper risk management and position sizing before entering any trade!
{spot}(PEPEUSDT)
#pepe #BİNANCE #BinanceSquareFamily #tranding
$PEPE /USDT Technical Analysis & Trade Setup
Pepe (PEPE) has started an upward recovery after bouncing strongly off its key support level. The price action indicates a potential bullish continuation moving toward the target resistance zone.
📌 Trade Setup (1H Timeframe):
Direction: LONG 🟢
Entry Zone: 0.00000388 - 0.00000390
Take Profit (TP): 0.00000433
Stop Loss (SL): 0.00000373
⚠️ Risk Warning: Always follow proper risk management and position sizing before entering any trade!
#pepe #BİNANCE #BinanceSquareFamily #tranding
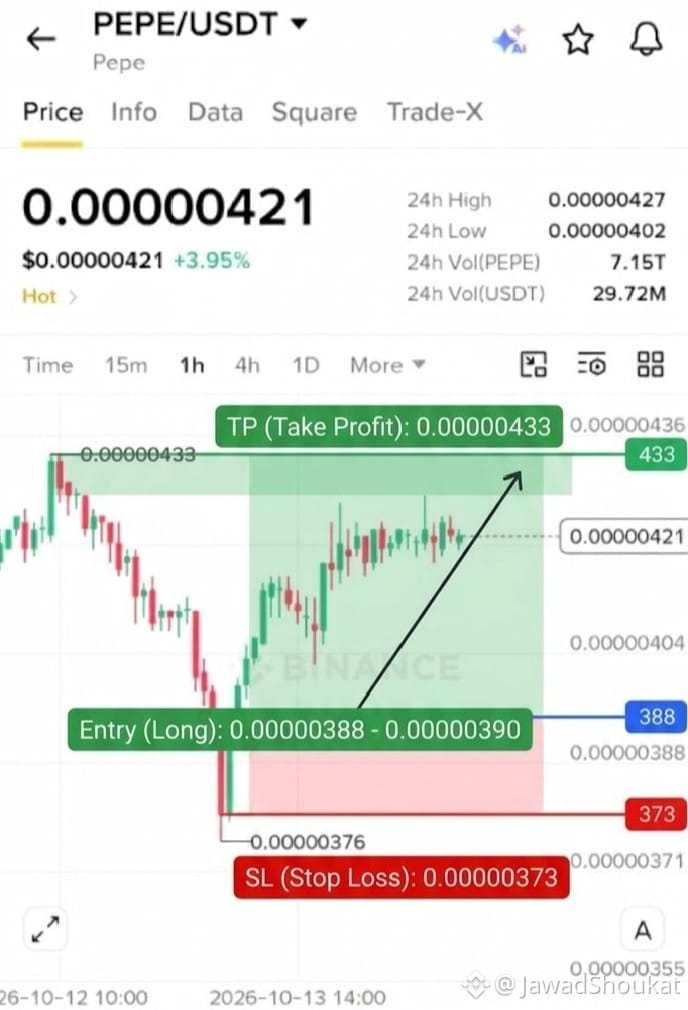
Pepe (PEPE) has started an upward recovery after bouncing strongly off its key support level. The price action indicates a potential bullish continuation moving toward the target resistance zone.
📌 Trade Setup (1H Timeframe):
Direction: LONG 🟢
Entry Zone: 0.00000388 - 0.00000390
Take Profit (TP): 0.00000433
Stop Loss (SL): 0.00000373
⚠️ Risk Warning: Always follow proper risk management and position sizing before entering any trade!
#pepe #BİNANCE #BinanceSquareFamily #tranding
1
94
·
--
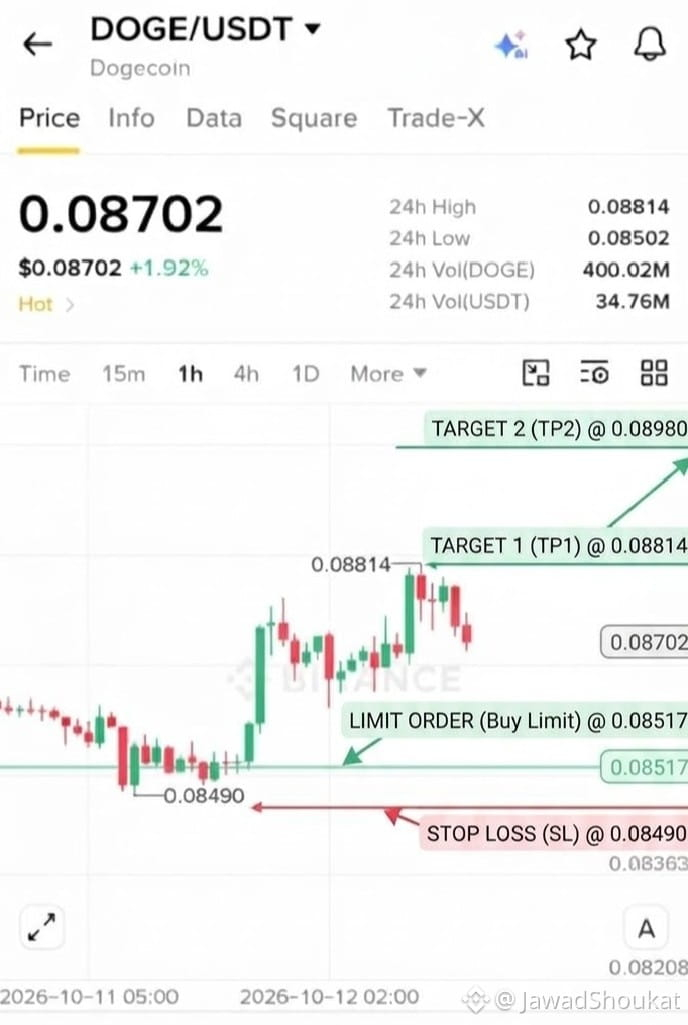
$DOGE This is a technical analysis of the DOGE/USDT trading pair on a 1-hour chart from Binance. The chart shows a potential long trade based on a buy limit order. The key trade levels are clearly marked:
Entry: A Buy Limit order is set at $0.08517.
Stop Loss (SL): $0.08490
Target 1 (TP1): $0.08814.
Target 2 (TP2): $0.08980.
{spot}(DOGEUSDT)
#doge⚡ #BinanceSquareTalks #BinanceSquareFamily #tranding
$DOGE This is a technical analysis of the DOGE/USDT trading pair on a 1-hour chart from Binance. The chart shows a potential long trade based on a buy limit order. The key trade levels are clearly marked:
Entry: A Buy Limit order is set at $0.08517.
Stop Loss (SL): $0.08490
Target 1 (TP1): $0.08814.
Target 2 (TP2): $0.08980.
#doge⚡ #BinanceSquareTalks #BinanceSquareFamily #tranding
Entry: A Buy Limit order is set at $0.08517.
Stop Loss (SL): $0.08490
Target 1 (TP1): $0.08814.
Target 2 (TP2): $0.08980.
#doge⚡ #BinanceSquareTalks #BinanceSquareFamily #tranding
1
175
·
--
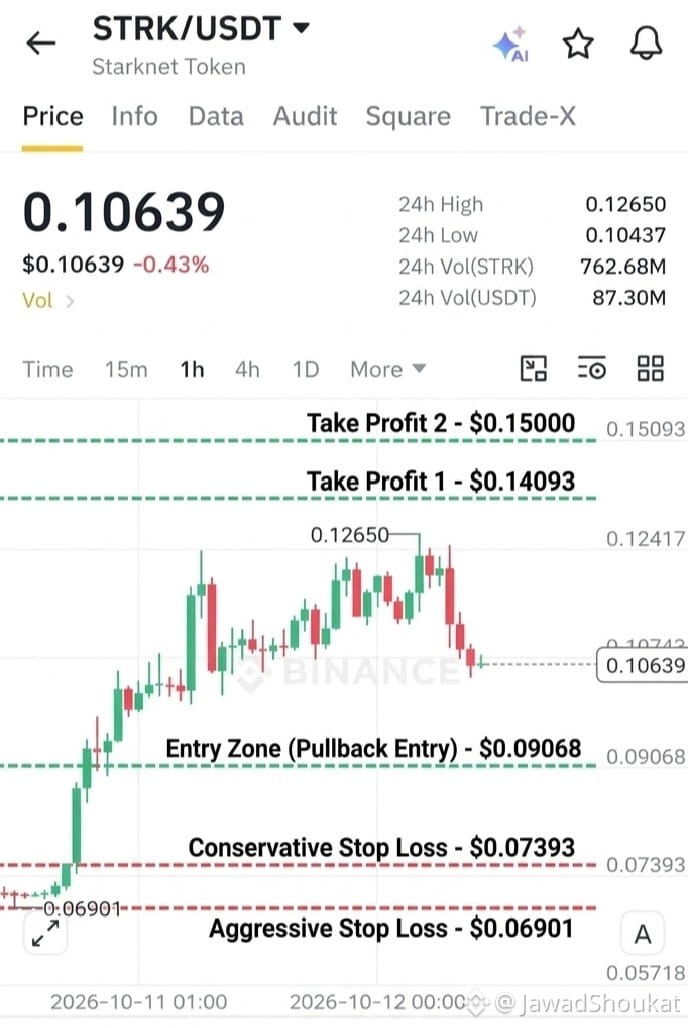
🚀 $STRK /USDT Technical Analysis & Quick Trade Setup
Starknet Token (STRK) is currently trading at $0.10639. This setup offers a favorable pullback entry point along with strong upside targets.
📌 Trade Setup Details:
Trading Pair: STRK/USDT (1-Hour Chart)
Entry Zone (Pullback Entry): $0.09068
Take Profit 1 (TP1): $0.14093
Take Profit 2 (TP2): $0.15000
Stop Loss (SL): Conservative: $0.07393 | Aggressive: $0.06901
⚠️ Risk Warning: Cryptocurrency markets involve high volatility. Always practice proper risk management and make sure to use a stop loss!
{spot}(STRKUSDT)
#strk #BinanceSquareTalks #BinanceSquareFamily #tranding
🚀 $STRK /USDT Technical Analysis & Quick Trade Setup
Starknet Token (STRK) is currently trading at $0.10639. This setup offers a favorable pullback entry point along with strong upside targets.
📌 Trade Setup Details:
Trading Pair: STRK/USDT (1-Hour Chart)
Entry Zone (Pullback Entry): $0.09068
Take Profit 1 (TP1): $0.14093
Take Profit 2 (TP2): $0.15000
Stop Loss (SL): Conservative: $0.07393 | Aggressive: $0.06901
⚠️ Risk Warning: Cryptocurrency markets involve high volatility. Always practice proper risk management and make sure to use a stop loss!
#strk #BinanceSquareTalks #BinanceSquareFamily #tranding
Starknet Token (STRK) is currently trading at $0.10639. This setup offers a favorable pullback entry point along with strong upside targets.
📌 Trade Setup Details:
Trading Pair: STRK/USDT (1-Hour Chart)
Entry Zone (Pullback Entry): $0.09068
Take Profit 1 (TP1): $0.14093
Take Profit 2 (TP2): $0.15000
Stop Loss (SL): Conservative: $0.07393 | Aggressive: $0.06901
⚠️ Risk Warning: Cryptocurrency markets involve high volatility. Always practice proper risk management and make sure to use a stop loss!
#strk #BinanceSquareTalks #BinanceSquareFamily #tranding
1
439

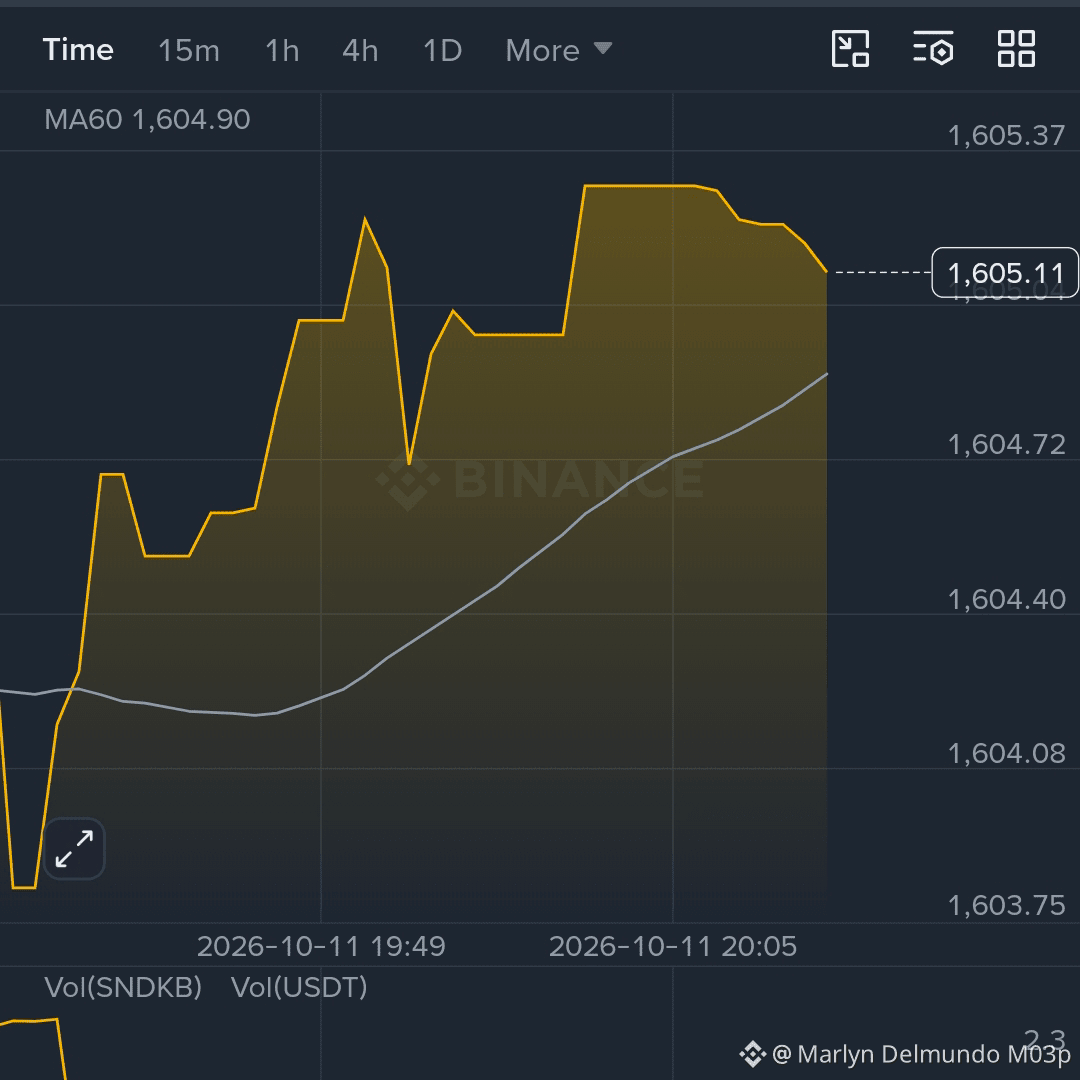
$SNDKB
Could it be that, as a blessing in disguise, he didn’t rebound on Friday, but on Monday?
{spot}(SNDKBUSDT)
#viralmypost #tranding #SNDK #BTC走势分析
$SNDKB
Could it be that, as a blessing in disguise, he didn’t rebound on Friday, but on Monday?
#viralmypost #tranding #SNDK #BTC走势分析
Could it be that, as a blessing in disguise, he didn’t rebound on Friday, but on Monday?
#viralmypost #tranding #SNDK #BTC走势分析
197

·
--
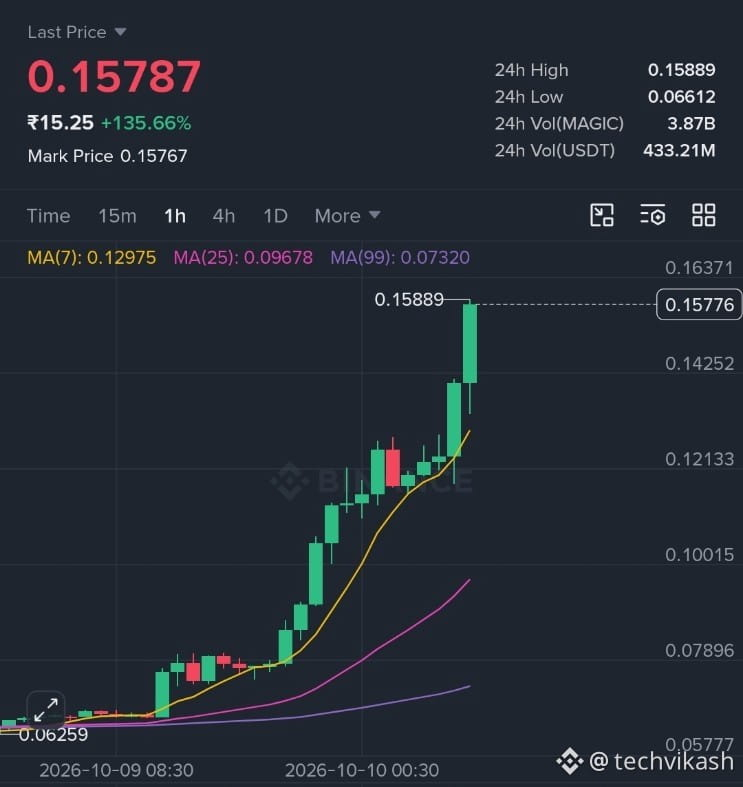
🚀 $MAGIC LONG SETUP | BULLISH MOMENTUM 🔥
📍 Entry: $0.151285 – $0.154235
🎯 TP1: $0.160627
🎯 TP2: $0.166921
🎯 TP3: $0.173215
🛑 Stop-Loss: $0.144893
📊 What's Driving the Setup?
🔥 Expanding trading volume
📈 9/21/50 EMA structure remains bullish
👀 Momentum building — key levels in focus!
⚠️ Wait for confirmation and manage risk carefully. DYOR.
#MAGIC/USDT #tranding #bnb
🚀 $MAGIC LONG SETUP | BULLISH MOMENTUM 🔥
📍 Entry: $0.151285 – $0.154235
🎯 TP1: $0.160627
🎯 TP2: $0.166921
🎯 TP3: $0.173215
🛑 Stop-Loss: $0.144893
📊 What's Driving the Setup?
🔥 Expanding trading volume
📈 9/21/50 EMA structure remains bullish
👀 Momentum building — key levels in focus!
⚠️ Wait for confirmation and manage risk carefully. DYOR.
#MAGIC/USDT #tranding #bnb
📍 Entry: $0.151285 – $0.154235
🎯 TP1: $0.160627
🎯 TP2: $0.166921
🎯 TP3: $0.173215
🛑 Stop-Loss: $0.144893
📊 What's Driving the Setup?
🔥 Expanding trading volume
📈 9/21/50 EMA structure remains bullish
👀 Momentum building — key levels in focus!
⚠️ Wait for confirmation and manage risk carefully. DYOR.
#MAGIC/USDT #tranding #bnb
250

·
--
Article
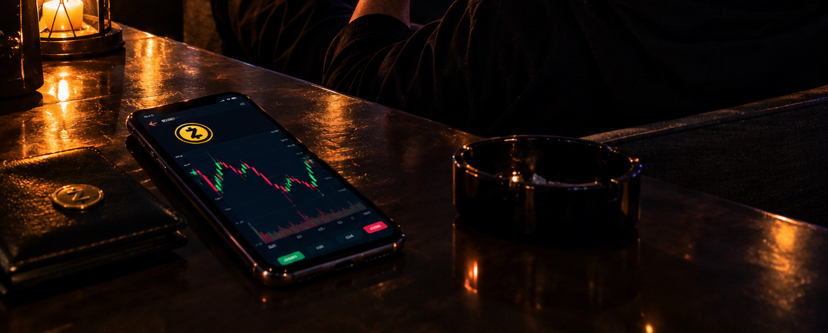
$ZEC 🌙 Taking the Night Off!Sometimes, you just need a break from the charts. 📊
I’m closing my positions for tonight and heading out to enjoy life. No trading, no stress, and definitely no gambling tonight! 😎🔥
Crypto will always be here tomorrow, but moments with friends and good vibes are worth enjoying today. 🥂
Time to relax, recharge, and forget about the market for a while.
Enjoy life beyond the charts! ❤️
What about you guys? Are you still watching the market or taking the night off too? 👇
#zec #crypto #tranding #goodvibes #CryptoCommunitys
$ZEC 🌙 Taking the Night Off!
Sometimes, you just need a break from the charts. 📊
I’m closing my positions for tonight and heading out to enjoy life. No trading, no stress, and definitely no gambling tonight! 😎🔥
Crypto will always be here tomorrow, but moments with friends and good vibes are worth enjoying today. 🥂
Time to relax, recharge, and forget about the market for a while.
Enjoy life beyond the charts! ❤️
What about you guys? Are you still watching the market or taking the night off too? 👇
#zec #crypto #tranding #goodvibes #CryptoCommunitys
I’m closing my positions for tonight and heading out to enjoy life. No trading, no stress, and definitely no gambling tonight! 😎🔥
Crypto will always be here tomorrow, but moments with friends and good vibes are worth enjoying today. 🥂
Time to relax, recharge, and forget about the market for a while.
Enjoy life beyond the charts! ❤️
What about you guys? Are you still watching the market or taking the night off too? 👇
#zec #crypto #tranding #goodvibes #CryptoCommunitys
1
298
·
--
Bullish
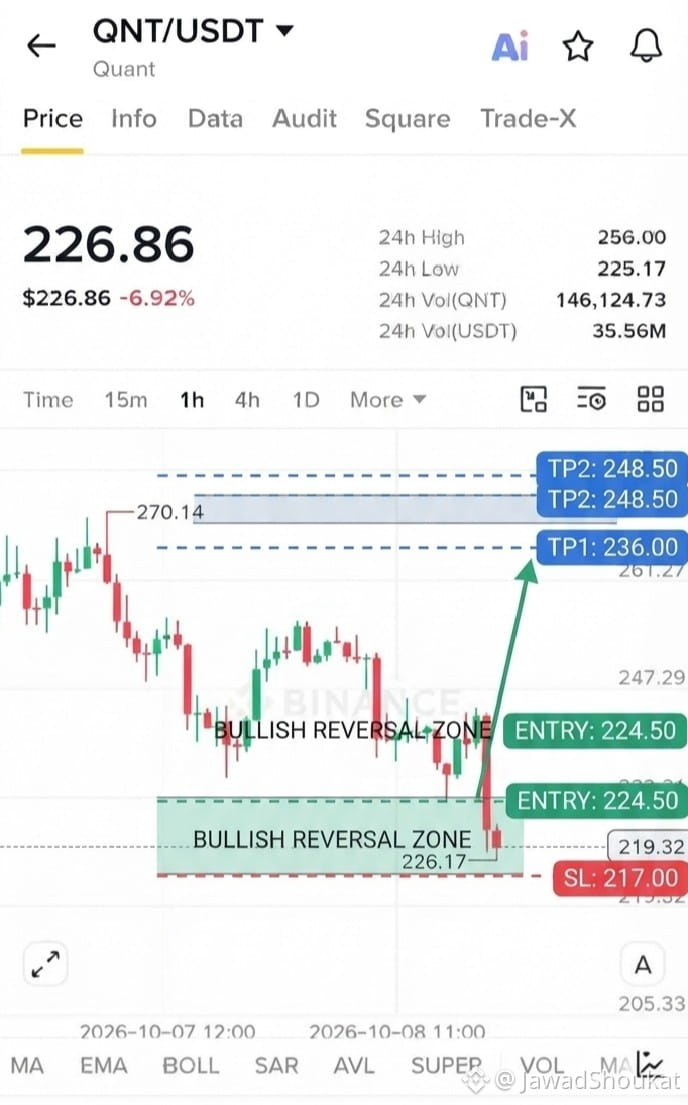
$QNT /USDT Technical Setup - 1h Chart Analysis
The chart indicates that QNT/USDT has tested a strong support zone near $225.17 and is forming a potential bullish reversal pattern on the 1-hour timeframe.
Entry: 224.50
Take Profit 1: 236.00
Take Profit 2: 248.50
Stop Loss: 217.00
Monitoring for a solid recovery bounce towards upper resistance levels. Always manage your risk properly.
{spot}(QNTUSDT)
#QNTUSDT #BinanceSquareTalks #tranding
$QNT /USDT Technical Setup - 1h Chart Analysis
The chart indicates that QNT/USDT has tested a strong support zone near $225.17 and is forming a potential bullish reversal pattern on the 1-hour timeframe.
Entry: 224.50
Take Profit 1: 236.00
Take Profit 2: 248.50
Stop Loss: 217.00
Monitoring for a solid recovery bounce towards upper resistance levels. Always manage your risk properly.
#QNTUSDT #BinanceSquareTalks #tranding
The chart indicates that QNT/USDT has tested a strong support zone near $225.17 and is forming a potential bullish reversal pattern on the 1-hour timeframe.
Entry: 224.50
Take Profit 1: 236.00
Take Profit 2: 248.50
Stop Loss: 217.00
Monitoring for a solid recovery bounce towards upper resistance levels. Always manage your risk properly.
#QNTUSDT #BinanceSquareTalks #tranding
1
447
·
--
Bullish
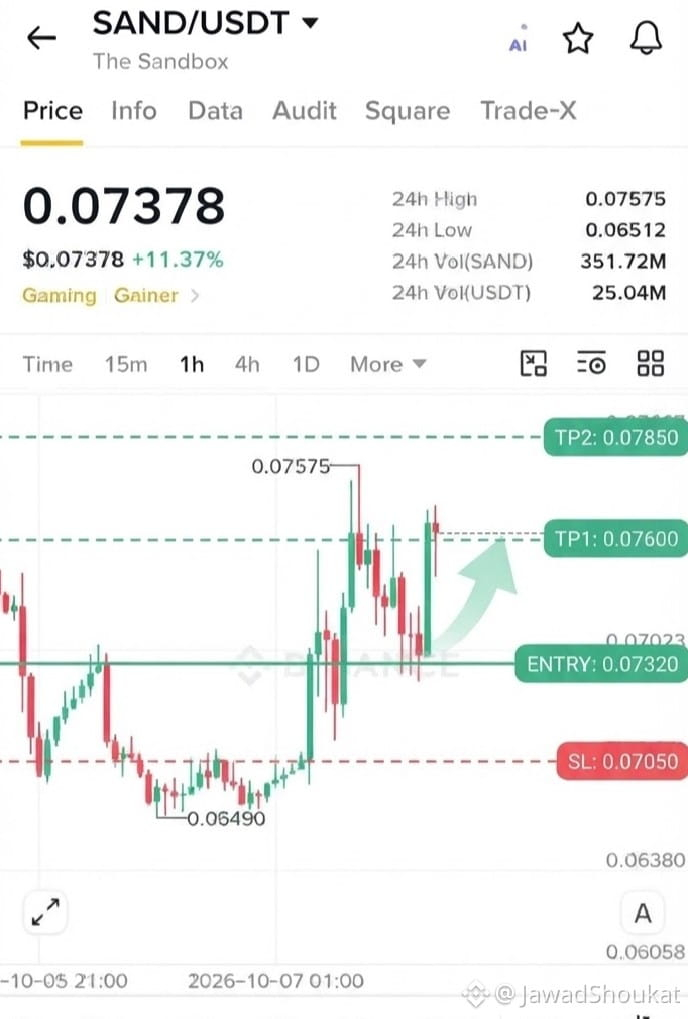
$SAND /USDT Technical Setup - 1h Chart Analysis
The chart shows a strong bullish continuation setup as SAND recovers nicely from recent lows, showing positive upside momentum near support.
Entry: 0.07320
Take Profit 1: 0.07600
Take Profit 2: 0.07850
Stop Loss: 0.07050
Monitoring for further upside movement towards upper targets. Always manage your risk properly.
{spot}(SANDUSDT)
#sand #BinanceSquareTalks #tranding
$SAND /USDT Technical Setup - 1h Chart Analysis
The chart shows a strong bullish continuation setup as SAND recovers nicely from recent lows, showing positive upside momentum near support.
Entry: 0.07320
Take Profit 1: 0.07600
Take Profit 2: 0.07850
Stop Loss: 0.07050
Monitoring for further upside movement towards upper targets. Always manage your risk properly.
#sand #BinanceSquareTalks #tranding
The chart shows a strong bullish continuation setup as SAND recovers nicely from recent lows, showing positive upside momentum near support.
Entry: 0.07320
Take Profit 1: 0.07600
Take Profit 2: 0.07850
Stop Loss: 0.07050
Monitoring for further upside movement towards upper targets. Always manage your risk properly.
#sand #BinanceSquareTalks #tranding
1
132
·
--
The Ultimate Guide: How to Survive and Thrive in Crypto with Risk Management and Technical AnalysisHere’s the updated article for Binance Square, including the step-by-step explanatory section with a detailed numerical example of how to calculate position size based on the Stop Loss.
🛡️️ The Ultimate Guide: How to Survive and Thrive in Crypto with Risk Management and Technical Analysis
In the crypto market, making money isn’t about guessing which token will do a 100x—it’s about protecting your capital so you can keep playing the game tomorrow.
Beginner traders often focus 90% on when to enter and only 10% on how to manage the trade. Profitable traders reverse that equation. Today, we’re breaking down the essential risk management and technical analysis (TA) techniques that will save you from liquidations and FOMO.
The Ultimate Guide: How to Survive and Thrive in Crypto with Risk Management and Technical Analysis
Here’s the updated article for Binance Square, including the step-by-step explanatory section with a detailed numerical example of how to calculate position size based on the Stop Loss.
🛡️️ The Ultimate Guide: How to Survive and Thrive in Crypto with Risk Management and Technical Analysis
In the crypto market, making money isn’t about guessing which token will do a 100x—it’s about protecting your capital so you can keep playing the game tomorrow.
Beginner traders often focus 90% on when to enter and only 10% on how to manage the trade. Profitable traders reverse that equation. Today, we’re breaking down the essential risk management and technical analysis (TA) techniques that will save you from liquidations and FOMO.
🛡️️ The Ultimate Guide: How to Survive and Thrive in Crypto with Risk Management and Technical Analysis
In the crypto market, making money isn’t about guessing which token will do a 100x—it’s about protecting your capital so you can keep playing the game tomorrow.
Beginner traders often focus 90% on when to enter and only 10% on how to manage the trade. Profitable traders reverse that equation. Today, we’re breaking down the essential risk management and technical analysis (TA) techniques that will save you from liquidations and FOMO.
139

·
--

Article
ANALYSIS OpenLedgerdAnalyzing the $OPEN USDT pair involves tracking market trends, price action, and trading volume on exchanges like Binance. $OPEN price movement depends on market demand and overall crypto sentiment. Traders usually monitor support and resistance levels to identify possible breakout or reversal zones. Volatility remains important, so proper risk management such as stop-loss orders is essential. If buying pressure continues to increase, $OPEN USDT could see stronger momentum in upcoming sessions.
@Openledger #OpenLedger #Binance #tranding
ANALYSIS OpenLedgerd
Analyzing the $OPEN USDT pair involves tracking market trends, price action, and trading volume on exchanges like Binance. $OPEN price movement depends on market demand and overall crypto sentiment. Traders usually monitor support and resistance levels to identify possible breakout or reversal zones. Volatility remains important, so proper risk management such as stop-loss orders is essential. If buying pressure continues to increase, $OPEN USDT could see stronger momentum in upcoming sessions.
@OpenLedger #OpenLedger #Binance #tranding
@OpenLedger #OpenLedger #Binance #tranding
1
1
18

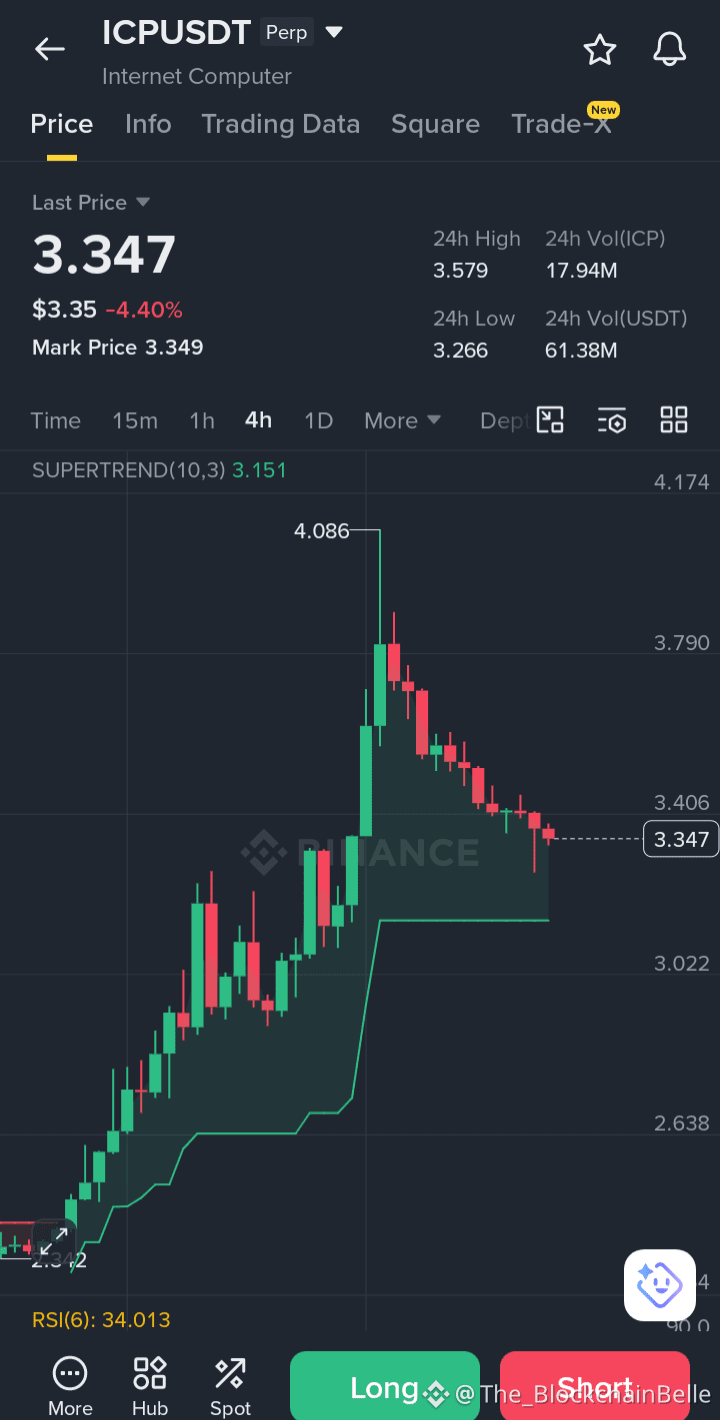
$ICP had a strong push to 4.08… but sellers stepped in hard 😮💨
Now sitting around 3.3 on 4H — this zone really matters.
RSI is cooling, momentum feels weak short term.
For me, $3.15 – $3.26 is the key support 👀
If buyers defend it, we could see a solid bounce.
But if it breaks… downside could come fast 📉
No rush here — watching price action only.
Smart entries > emotional trades 📊
What’s your view… bounce or more correction? 🚀
{future}(ICPUSDT)
#ICP #tranding
$ICP had a strong push to 4.08… but sellers stepped in hard 😮💨
Now sitting around 3.3 on 4H — this zone really matters.
RSI is cooling, momentum feels weak short term.
For me, $3.15 – $3.26 is the key support 👀
If buyers defend it, we could see a solid bounce.
But if it breaks… downside could come fast 📉
No rush here — watching price action only.
Smart entries > emotional trades 📊
What’s your view… bounce or more correction? 🚀
#ICP #tranding
Now sitting around 3.3 on 4H — this zone really matters.
RSI is cooling, momentum feels weak short term.
For me, $3.15 – $3.26 is the key support 👀
If buyers defend it, we could see a solid bounce.
But if it breaks… downside could come fast 📉
No rush here — watching price action only.
Smart entries > emotional trades 📊
What’s your view… bounce or more correction? 🚀
#ICP #tranding
1
22

🚨 MARKET ALERT: INFLATION & WAR PRESSURE BUILDING 🚨
Fed official Kashkari warns that global conflict is already pushing inflation higher, and supply chains may take months to stabilize.
If inflation remains sticky, the Federal Reserve could be forced to keep interest rates higher for longer — or even increase them further.
📉 What this means for markets:
Higher interest rates = pressure on crypto & stocks in the short term
Liquidity tightens = risk assets become more volatile
Investors may shift toward safer assets temporarily
But remember: markets don’t move on headlines alone — they react to data, not fear.
⚠️ Stay focused on CPI, Fed decisions, and liquidity trends instead of emotional trading.
💭 Question: Do you think crypto can still stay bullish in a high interest rate environment?
#Crypto #Fed #Inflation #MarketUpdate #tranding
🚨 MARKET ALERT: INFLATION & WAR PRESSURE BUILDING 🚨
Fed official Kashkari warns that global conflict is already pushing inflation higher, and supply chains may take months to stabilize.
If inflation remains sticky, the Federal Reserve could be forced to keep interest rates higher for longer — or even increase them further.
📉 What this means for markets:
Higher interest rates = pressure on crypto & stocks in the short term
Liquidity tightens = risk assets become more volatile
Investors may shift toward safer assets temporarily
But remember: markets don’t move on headlines alone — they react to data, not fear.
⚠️ Stay focused on CPI, Fed decisions, and liquidity trends instead of emotional trading.
💭 Question: Do you think crypto can still stay bullish in a high interest rate environment?
#Crypto #Fed #Inflation #MarketUpdate #tranding
Fed official Kashkari warns that global conflict is already pushing inflation higher, and supply chains may take months to stabilize.
If inflation remains sticky, the Federal Reserve could be forced to keep interest rates higher for longer — or even increase them further.
📉 What this means for markets:
Higher interest rates = pressure on crypto & stocks in the short term
Liquidity tightens = risk assets become more volatile
Investors may shift toward safer assets temporarily
But remember: markets don’t move on headlines alone — they react to data, not fear.
⚠️ Stay focused on CPI, Fed decisions, and liquidity trends instead of emotional trading.
💭 Question: Do you think crypto can still stay bullish in a high interest rate environment?
#Crypto #Fed #Inflation #MarketUpdate #tranding

1
112
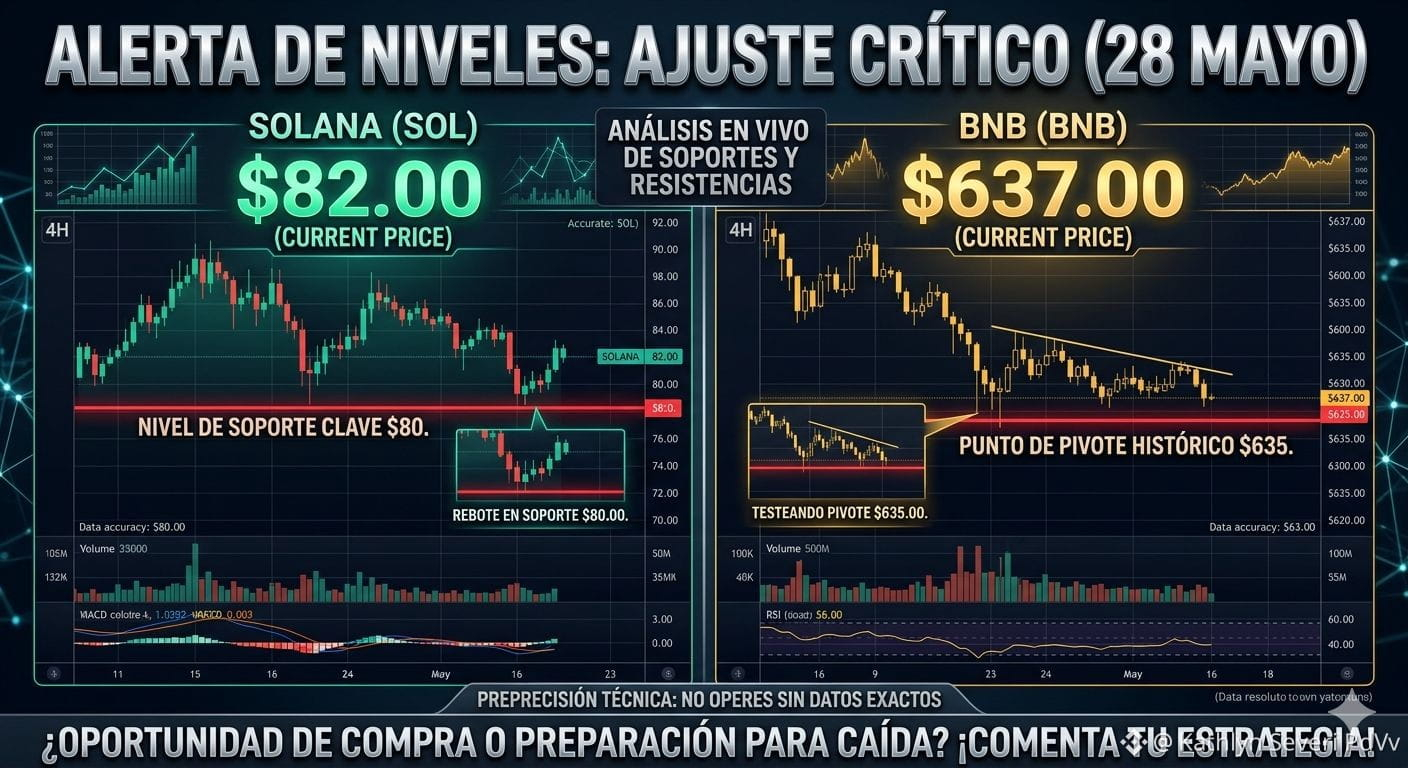
🚨 LEVEL ALERT: Critical adjustment in the market 📉
Volatility doesn't forgive and precision is our only defense. We've updated the support levels for today, May 28, after the latest price movements.
☀️ SOLANA ($82): After hitting $80, SOL shows a slight recovery sitting at $82. Don't get it twisted: it's still a testing zone. To confirm a real bounce, we need to see strength to reclaim $85. Otherwise, the risk of revisiting lows remains imminent.
🟡 BNB ($637): The giant adjusts to $637. Although it lost the $640 level we were watching, this $637 zone is a historic pivot point. Holding this price is crucial to avoid a liquidation cascade before the monthly close.
⚙️ Strategy Adjustment: The market is redefining its stops. If you're a trader, this isn't the time to trade on emotion, but on exact levels.
👇 UPDATE YOUR PLAN: Are you adjusting your stop losses or capitalizing on these prices to enter? Drop your entry level in the comments! #CryptoAlert#Solana#BNB#Tranding
{spot}(BNBUSDT)
{spot}(SOLUSDT)
🚨 LEVEL ALERT: Critical adjustment in the market 📉
Volatility doesn't forgive and precision is our only defense. We've updated the support levels for today, May 28, after the latest price movements.
☀️ SOLANA ($82): After hitting $80, SOL shows a slight recovery sitting at $82. Don't get it twisted: it's still a testing zone. To confirm a real bounce, we need to see strength to reclaim $85. Otherwise, the risk of revisiting lows remains imminent.
🟡 BNB ($637): The giant adjusts to $637. Although it lost the $640 level we were watching, this $637 zone is a historic pivot point. Holding this price is crucial to avoid a liquidation cascade before the monthly close.
⚙️ Strategy Adjustment: The market is redefining its stops. If you're a trader, this isn't the time to trade on emotion, but on exact levels.
👇 UPDATE YOUR PLAN: Are you adjusting your stop losses or capitalizing on these prices to enter? Drop your entry level in the comments! #CryptoAlert#Solana#BNB#Tranding
Volatility doesn't forgive and precision is our only defense. We've updated the support levels for today, May 28, after the latest price movements.
☀️ SOLANA ($82): After hitting $80, SOL shows a slight recovery sitting at $82. Don't get it twisted: it's still a testing zone. To confirm a real bounce, we need to see strength to reclaim $85. Otherwise, the risk of revisiting lows remains imminent.
🟡 BNB ($637): The giant adjusts to $637. Although it lost the $640 level we were watching, this $637 zone is a historic pivot point. Holding this price is crucial to avoid a liquidation cascade before the monthly close.
⚙️ Strategy Adjustment: The market is redefining its stops. If you're a trader, this isn't the time to trade on emotion, but on exact levels.
👇 UPDATE YOUR PLAN: Are you adjusting your stop losses or capitalizing on these prices to enter? Drop your entry level in the comments! #CryptoAlert#Solana#BNB#Tranding
187
Log in to explore more content
Join global crypto users on Binance Square
⚡️ Get latest and useful information about crypto.
💬 Trusted by the world’s largest crypto exchange.
👍 Discover real insights from verified creators.
Email / Phone number
Trending Topics
1
#BitcoinRebounds$75KAsChipsLead
1,456 views
49 Discussing
2
#JobsReportRaisesHikeOdds
44,910 views
626 Discussing
3
#US Data Center Rules May Constrain AI Expansion
6,297 views
72 Discussing
4
#$2TWipedOutHedgeFundsFaceLiquidation
9,232 views
81 Discussing
5
#WillAnthropicListOnTime
3,143 views
109 Discussing
6
#USNovemberMichiganExpectationsIndexPrelimAt50.9
9,003 views
214 Discussing
7
#OilPlungesBelow$100
10,571 views
31 Discussing
8
#TradFiForBeginners
4,950 views
116 Discussing
9
#USMidtermsCouldShakeUpUS-IranTies
24,645 views
388 Discussing
10
#RussianCentralBankNamesBTCETHUSDTForNonQualifiedInvestors
346 views
7 Discussing