

#payment
payment
132,517 views
340 Discussing
Hot
Latest

·
--
Bullish
🚀 Are #Stablecoins becoming the future of global payments?
We interviewed Eric Barbier, Founder & CEO of Triple-A, to explore crypto payments, real-world adoption, and the evolving payment ecosystem.
Discover the conversation on Bitnxt -
https://bitnxt.io/interviews/eric-barbier-triple-a
#CryptoPayment #Payment #crypto
🚀 Are #Stablecoins becoming the future of global payments?
We interviewed Eric Barbier, Founder & CEO of Triple-A, to explore crypto payments, real-world adoption, and the evolving payment ecosystem.
Discover the conversation on Bitnxt -
https://bitnxt.io/interviews/eric-barbier-triple-a
#CryptoPayment #Payment #crypto
We interviewed Eric Barbier, Founder & CEO of Triple-A, to explore crypto payments, real-world adoption, and the evolving payment ecosystem.
Discover the conversation on Bitnxt -
https://bitnxt.io/interviews/eric-barbier-triple-a
#CryptoPayment #Payment #crypto

1
66



·
--
Bullish
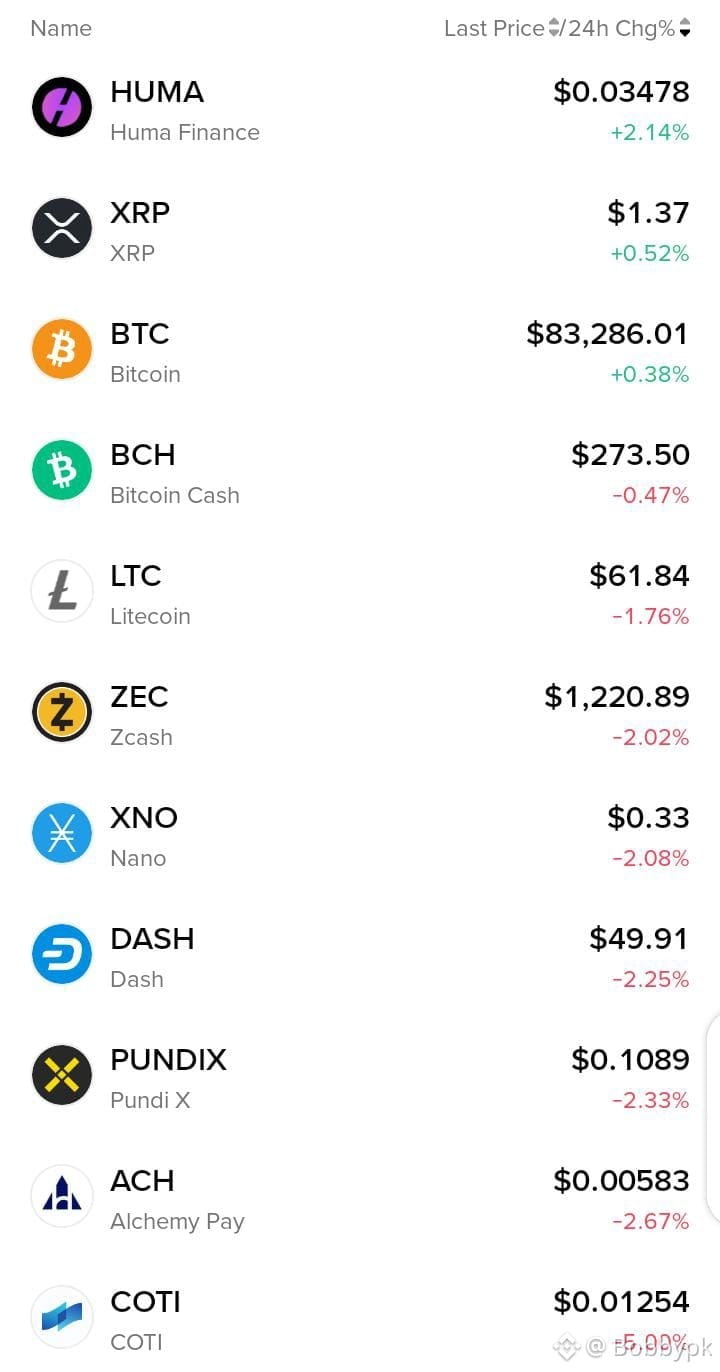
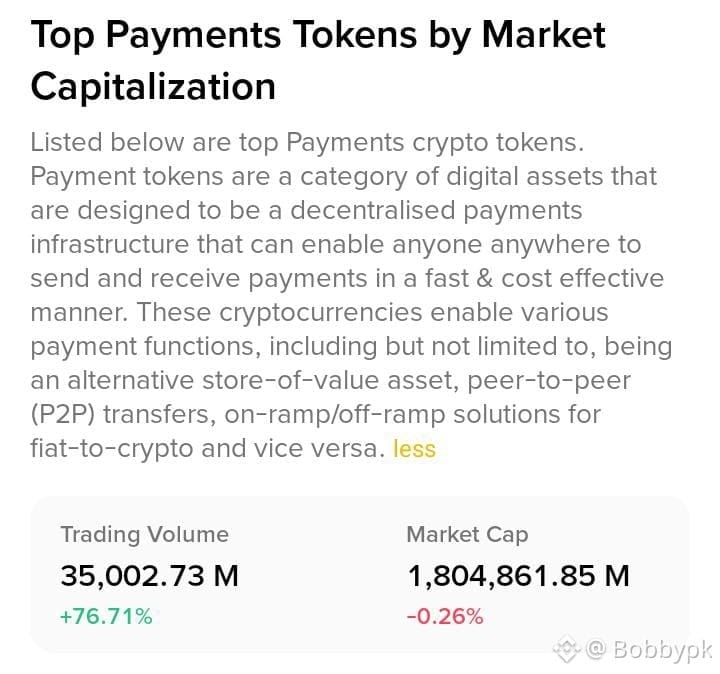
💥Dear friends very important information for you:- Payments💰 tokens are busy, but prices aren’t really reacting. In the last 24 hours, trading volume shot up by almost 77% we’re talking about $35 billion moving around but overall market cap dipped just a tiny bit to $1.8 trillion. So, lots of action, but nobody’s really picking a side yet.
Looking at winners, $HUMA climbed 2.14%, $XRP edged up 0.52%, and Bitcoin ticked up 0.38% to $83,286. On the flip side, $COTI dropped 5%, and ACH slid 2.67%.
Is this real rotation, or just noise before things settle down? We’ll see if the volume keeps up as the week goes on.
Bigger question: Will confidential compliance chains take over, or do standard EVM chains remain king for payments? What do you think?
#Payment
#CPIWatch
#GNS
#Bobbypk
{spot}(XRPUSDT)
{spot}(HUMAUSDT)
{spot}(GNSUSDT)
💥Dear friends very important information for you:- Payments💰 tokens are busy, but prices aren’t really reacting. In the last 24 hours, trading volume shot up by almost 77% we’re talking about $35 billion moving around but overall market cap dipped just a tiny bit to $1.8 trillion. So, lots of action, but nobody’s really picking a side yet.
Looking at winners, $HUMA climbed 2.14%, $XRP edged up 0.52%, and Bitcoin ticked up 0.38% to $83,286. On the flip side, $COTI dropped 5%, and ACH slid 2.67%.
Is this real rotation, or just noise before things settle down? We’ll see if the volume keeps up as the week goes on.
Bigger question: Will confidential compliance chains take over, or do standard EVM chains remain king for payments? What do you think?
#Payment
#CPIWatch
#GNS
#Bobbypk
Looking at winners, $HUMA climbed 2.14%, $XRP edged up 0.52%, and Bitcoin ticked up 0.38% to $83,286. On the flip side, $COTI dropped 5%, and ACH slid 2.67%.
Is this real rotation, or just noise before things settle down? We’ll see if the volume keeps up as the week goes on.
Bigger question: Will confidential compliance chains take over, or do standard EVM chains remain king for payments? What do you think?
#Payment
#CPIWatch
#GNS
#Bobbypk
2
1
1.3k

·
--
$SUI will be fly 💸 Let's go
SUI × Alibaba Cloud 🤝
AI agents can now pay for services per call using stablecoins through $SUI AI Agent Payments.
#SuiBasecamp2026 $BABAB #Payment #PartnershipAnnouncement
$SUI will be fly 💸 Let's go
SUI × Alibaba Cloud 🤝
AI agents can now pay for services per call using stablecoins through $SUI AI Agent Payments.
#SuiBasecamp2026 $BABAB #Payment #PartnershipAnnouncement
SUI × Alibaba Cloud 🤝
AI agents can now pay for services per call using stablecoins through $SUI AI Agent Payments.
#SuiBasecamp2026 $BABAB #Payment #PartnershipAnnouncement
1
291

·
--
🚀$NVDAB $NVDAB $NVDA.US Stablecoin adoption continues to accelerate.
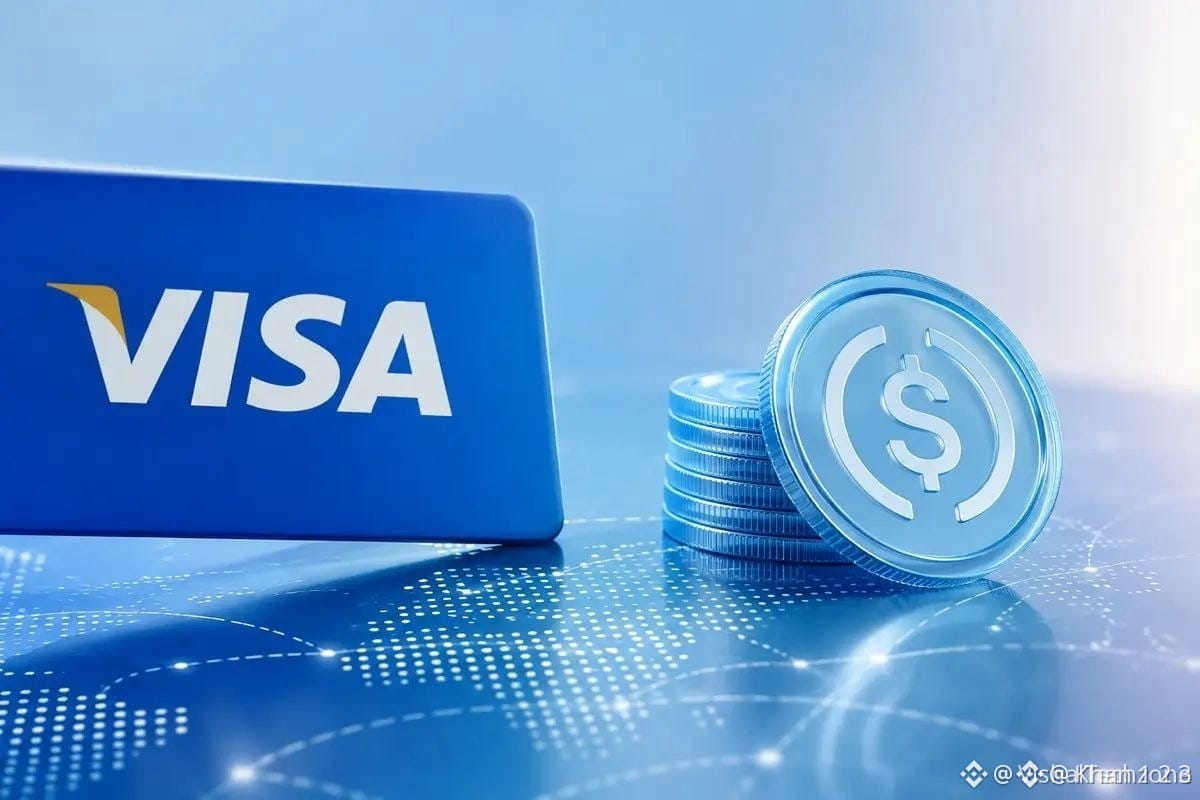
Visa reports that payment volume across its stablecoin-linked card programs has surged nearly 200% year-over-year.
📊 Business & commercial cards now account for approximately 17% of that volume, highlighting growing stablecoin use in real-world payments and business transactions.
The shift from crypto speculation toward everyday payments and financial infrastructure is becoming increasingly visible.
#Visa #stablecoin oins #fintech pto #fintech h #Payment ents #DigitalAssets
🚀$NVDAB $NVDAB $NVDA.US Stablecoin adoption continues to accelerate.
Visa reports that payment volume across its stablecoin-linked card programs has surged nearly 200% year-over-year.
📊 Business & commercial cards now account for approximately 17% of that volume, highlighting growing stablecoin use in real-world payments and business transactions.
The shift from crypto speculation toward everyday payments and financial infrastructure is becoming increasingly visible.
#Visa #stablecoin oins #fintech pto #fintech h #Payment ents #DigitalAssets
Visa reports that payment volume across its stablecoin-linked card programs has surged nearly 200% year-over-year.
📊 Business & commercial cards now account for approximately 17% of that volume, highlighting growing stablecoin use in real-world payments and business transactions.
The shift from crypto speculation toward everyday payments and financial infrastructure is becoming increasingly visible.
#Visa #stablecoin oins #fintech pto #fintech h #Payment ents #DigitalAssets
NVDAB+0.00%
NVDAUS+0.32%
78

·
--
{spot}(TRXUSDT)
🚨 #TRON is making serious moves! 🔥
TRON now processes nearly 44% of all enterprise payout volume on NOWPayments, highlighting its growing role in real-world crypto payments. 💰
Utility is winning. 👀
#CryptoNews #Payment #TrumpRejectsIranHormuzReopening
🚨 #TRON is making serious moves! 🔥
TRON now processes nearly 44% of all enterprise payout volume on NOWPayments, highlighting its growing role in real-world crypto payments. 💰
Utility is winning. 👀
#CryptoNews #Payment #TrumpRejectsIranHormuzReopening
TRON now processes nearly 44% of all enterprise payout volume on NOWPayments, highlighting its growing role in real-world crypto payments. 💰
Utility is winning. 👀
#CryptoNews #Payment #TrumpRejectsIranHormuzReopening


1
2
110

🇺🇸 Breaking news: JPMorgan, Citi, UBS and other leading banks achieve success in testing a Tokenized Payments cross-border payment system that can process transactions in an average time of just 80 seconds.
💡 This test shows that large financial institutions are accelerating the adoption of Blockchain and Tokenization technology to develop faster, more efficient international money transfer systems, while reducing payment processing costs.
📌 This is another sign that bringing assets into Tokenization and Blockchain-based financial systems is moving toward real-world use in the global finance sector.
#Blockchain #Tokenization #Payment
{stock_us}(NVDA.US)
{stock_us}(AAPL.US)
{stock_us}(TSM.US)
🇺🇸 Breaking news: JPMorgan, Citi, UBS and other leading banks achieve success in testing a Tokenized Payments cross-border payment system that can process transactions in an average time of just 80 seconds.
💡 This test shows that large financial institutions are accelerating the adoption of Blockchain and Tokenization technology to develop faster, more efficient international money transfer systems, while reducing payment processing costs.
📌 This is another sign that bringing assets into Tokenization and Blockchain-based financial systems is moving toward real-world use in the global finance sector.
#Blockchain #Tokenization #Payment
💡 This test shows that large financial institutions are accelerating the adoption of Blockchain and Tokenization technology to develop faster, more efficient international money transfer systems, while reducing payment processing costs.
📌 This is another sign that bringing assets into Tokenization and Blockchain-based financial systems is moving toward real-world use in the global finance sector.
#Blockchain #Tokenization #Payment
AAPLUS-1.07%
NVDAUS+0.32%
TSMUS-0.24%
132

#Payment #AI
The Future Where Software Pays Software: Why Visa, Mastercard, and Google Back x402
For over 30 years, the HTTP 402 (“Payment Required”) error code has been sitting idly by in Internet standards. Traditional bank cards couldn’t process micropayments without incurring huge fees.
Now, the Linux Foundation has officially adopted the x402 protocol, created by Coinbase, to finally solve this problem for the AI era.
🤝 Who supported the initiative?
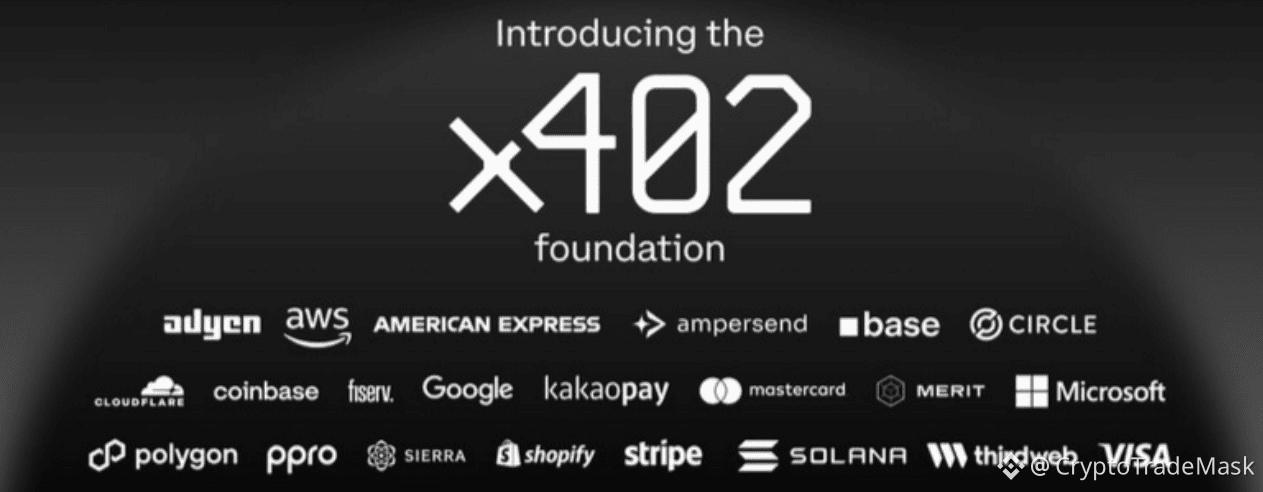
The newly formed x402 Foundation includes 40 of the largest players in the finance and technology market. Premium members include:
Payment giants: Visa, Mastercard, American Express, Stripe, Adyen, Fiserv.
Tech giants: Google, Amazon Web Services (AWS), Cloudflare, Shopify.
Crypto platforms: Coinbase (which developed the protocol), Ripple, Circle, MoonPay, and the Solana and Stellar funds.
🤖 How does it work for AI?
An autonomous AI agent can’t open a bank account or sign a SaaS contract, but it can sign a crypto transaction.
With x402, one piece of software can instantly pay another in stablecoins (USDC) in seconds — without registrations, card bindings, or intermediaries. Google has already integrated x402 into its AI payment tools, and Cloudflare has integrated it into its developer suite.
📊 Figures that prove the viability of the concept
The protocol has processed 75,000,000 transactions in the last 30 days (that’s about 29 transactions every second).
$24 million — the total volume of transfers per month between 94,000 buyers and 22,000 sellers.
32 cents — the average size of one payment.
#Payment #AI
The Future Where Software Pays Software: Why Visa, Mastercard, and Google Back x402
For over 30 years, the HTTP 402 (“Payment Required”) error code has been sitting idly by in Internet standards. Traditional bank cards couldn’t process micropayments without incurring huge fees.
Now, the Linux Foundation has officially adopted the x402 protocol, created by Coinbase, to finally solve this problem for the AI era.
🤝 Who supported the initiative?
The newly formed x402 Foundation includes 40 of the largest players in the finance and technology market. Premium members include:
Payment giants: Visa, Mastercard, American Express, Stripe, Adyen, Fiserv.
Tech giants: Google, Amazon Web Services (AWS), Cloudflare, Shopify.
Crypto platforms: Coinbase (which developed the protocol), Ripple, Circle, MoonPay, and the Solana and Stellar funds.
🤖 How does it work for AI?
An autonomous AI agent can’t open a bank account or sign a SaaS contract, but it can sign a crypto transaction.
With x402, one piece of software can instantly pay another in stablecoins (USDC) in seconds — without registrations, card bindings, or intermediaries. Google has already integrated x402 into its AI payment tools, and Cloudflare has integrated it into its developer suite.
📊 Figures that prove the viability of the concept
The protocol has processed 75,000,000 transactions in the last 30 days (that’s about 29 transactions every second).
$24 million — the total volume of transfers per month between 94,000 buyers and 22,000 sellers.
32 cents — the average size of one payment.
The Future Where Software Pays Software: Why Visa, Mastercard, and Google Back x402
For over 30 years, the HTTP 402 (“Payment Required”) error code has been sitting idly by in Internet standards. Traditional bank cards couldn’t process micropayments without incurring huge fees.
Now, the Linux Foundation has officially adopted the x402 protocol, created by Coinbase, to finally solve this problem for the AI era.
🤝 Who supported the initiative?
The newly formed x402 Foundation includes 40 of the largest players in the finance and technology market. Premium members include:
Payment giants: Visa, Mastercard, American Express, Stripe, Adyen, Fiserv.
Tech giants: Google, Amazon Web Services (AWS), Cloudflare, Shopify.
Crypto platforms: Coinbase (which developed the protocol), Ripple, Circle, MoonPay, and the Solana and Stellar funds.
🤖 How does it work for AI?
An autonomous AI agent can’t open a bank account or sign a SaaS contract, but it can sign a crypto transaction.
With x402, one piece of software can instantly pay another in stablecoins (USDC) in seconds — without registrations, card bindings, or intermediaries. Google has already integrated x402 into its AI payment tools, and Cloudflare has integrated it into its developer suite.
📊 Figures that prove the viability of the concept
The protocol has processed 75,000,000 transactions in the last 30 days (that’s about 29 transactions every second).
$24 million — the total volume of transfers per month between 94,000 buyers and 22,000 sellers.
32 cents — the average size of one payment.
1
86

·
--
Article
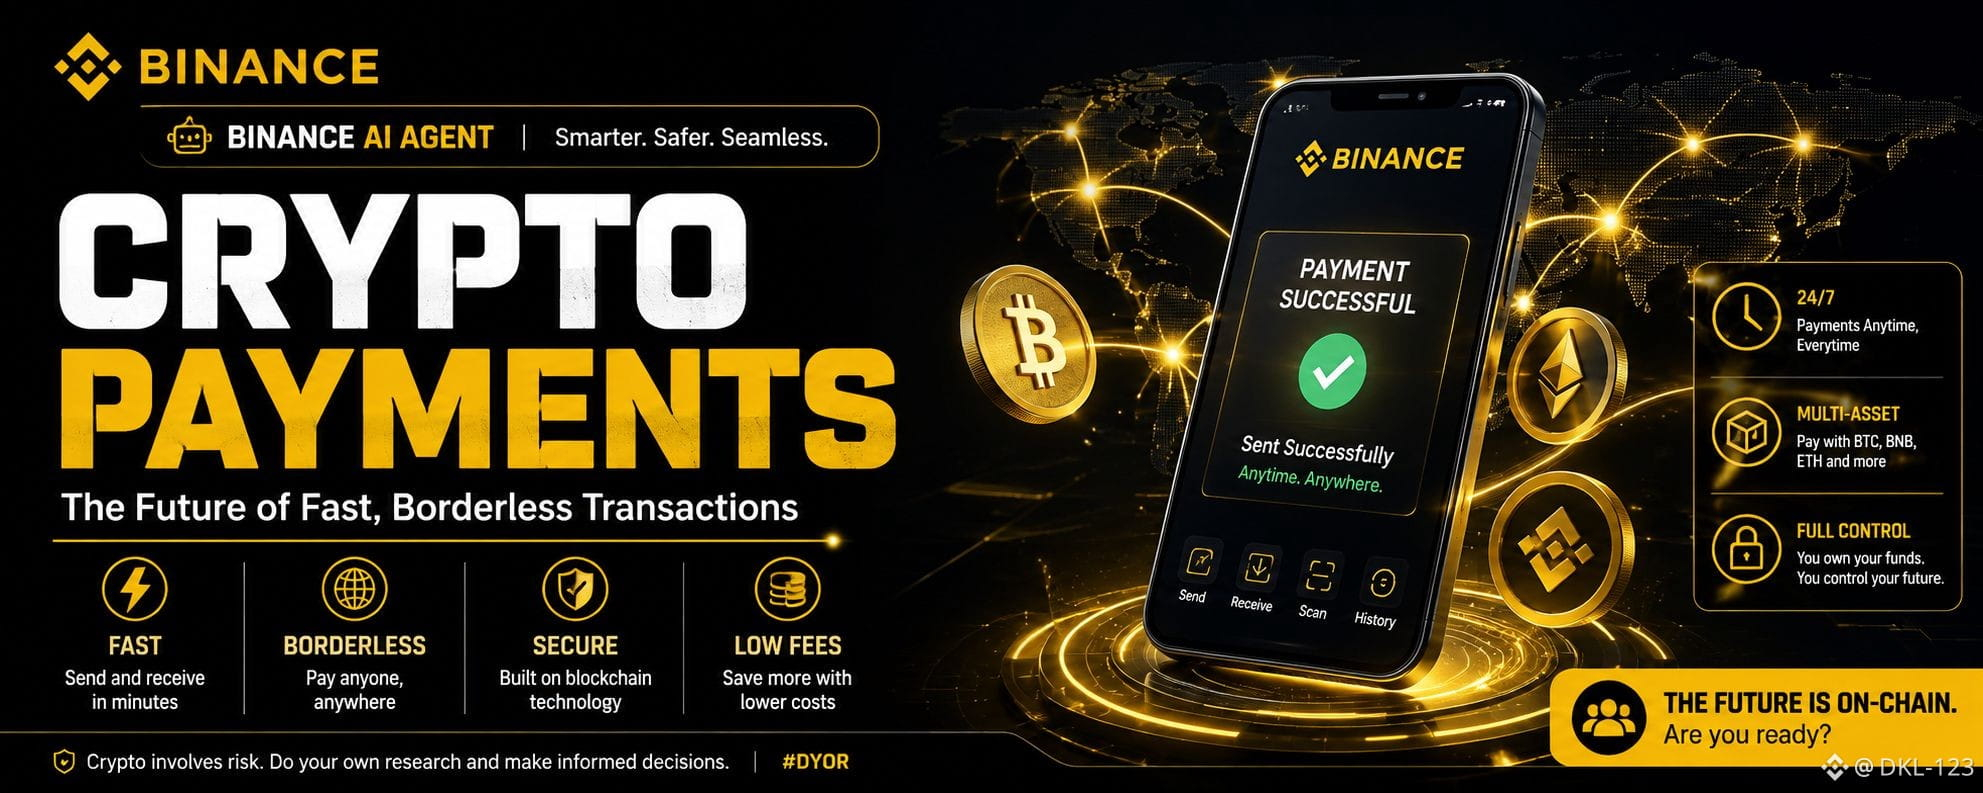
💳 Why Crypto Payments Are Changing the Way We Send Money.For years, sending money across borders has often meant high fees, long waiting times, and relying on multiple financial institutions. Crypto payments are changing that by making transactions faster, more transparent, and available around the clock.
With blockchain technology, users can send digital assets directly to one another without waiting for traditional banking hours. As adoption grows, crypto payments are becoming more common for online shopping, international transfers, and business transactions.
However, speed isn't everything. Before making any crypto payment, it's important to:
✅ Double-check the wallet address.
✅ Choose the correct blockchain network.
✅ Be aware of transaction fees.
✅ Protect your wallet with strong security practices.
As AI tools continue to evolve, they may also help users review transactions, detect potential mistakes, and improve the overall payment experience.
💬 Let's Discuss!
Do you think crypto payments will become as common as mobile money or bank transfers in the next five years?
👍 Yes, definitely.
❤️ Not yet, there are still challenges.
💬 Share your opinion in the comments and tell us why!
$BTC $BNB $ETH #USToCancelIranAttackSubjectToDeal #Payment #BlockchainLifeAwards2024 #Web3 #Binance
💳 Why Crypto Payments Are Changing the Way We Send Money.
For years, sending money across borders has often meant high fees, long waiting times, and relying on multiple financial institutions. Crypto payments are changing that by making transactions faster, more transparent, and available around the clock.
With blockchain technology, users can send digital assets directly to one another without waiting for traditional banking hours. As adoption grows, crypto payments are becoming more common for online shopping, international transfers, and business transactions.
However, speed isn't everything. Before making any crypto payment, it's important to:
✅ Double-check the wallet address.
✅ Choose the correct blockchain network.
✅ Be aware of transaction fees.
✅ Protect your wallet with strong security practices.
As AI tools continue to evolve, they may also help users review transactions, detect potential mistakes, and improve the overall payment experience.
💬 Let's Discuss!
Do you think crypto payments will become as common as mobile money or bank transfers in the next five years?
👍 Yes, definitely.
❤️ Not yet, there are still challenges.
💬 Share your opinion in the comments and tell us why!
$BTC $BNB $ETH #USToCancelIranAttackSubjectToDeal #Payment #BlockchainLifeAwards2024 #Web3 #Binance
With blockchain technology, users can send digital assets directly to one another without waiting for traditional banking hours. As adoption grows, crypto payments are becoming more common for online shopping, international transfers, and business transactions.
However, speed isn't everything. Before making any crypto payment, it's important to:
✅ Double-check the wallet address.
✅ Choose the correct blockchain network.
✅ Be aware of transaction fees.
✅ Protect your wallet with strong security practices.
As AI tools continue to evolve, they may also help users review transactions, detect potential mistakes, and improve the overall payment experience.
💬 Let's Discuss!
Do you think crypto payments will become as common as mobile money or bank transfers in the next five years?
👍 Yes, definitely.
❤️ Not yet, there are still challenges.
💬 Share your opinion in the comments and tell us why!
$BTC $BNB $ETH #USToCancelIranAttackSubjectToDeal #Payment #BlockchainLifeAwards2024 #Web3 #Binance
110


·
--
Exploring bPay and how digital bill payments make everyday payments simpler and more convenient.
CA: 0xb13003bf44de426dd2a3aae3df9c3400de0a7777
Code: BP-2BB3C06F0BA3
#bPay #DigitalPayments #Payment #Fintech
Exploring bPay and how digital bill payments make everyday payments simpler and more convenient.
CA: 0xb13003bf44de426dd2a3aae3df9c3400de0a7777
Code: BP-2BB3C06F0BA3
#bPay #DigitalPayments #Payment #Fintech
CA: 0xb13003bf44de426dd2a3aae3df9c3400de0a7777
Code: BP-2BB3C06F0BA3
#bPay #DigitalPayments #Payment #Fintech
1
1
277

·
--
Bullish
$AMP : Taking a fairly strong push, put the 👀 into this token that promises a lot with its payment system in stores 💵
#Payment
$AMP : Taking a fairly strong push, put the 👀 into this token that promises a lot with its payment system in stores 💵
#Payment
#Payment
1
2
814

·
--
Bullish
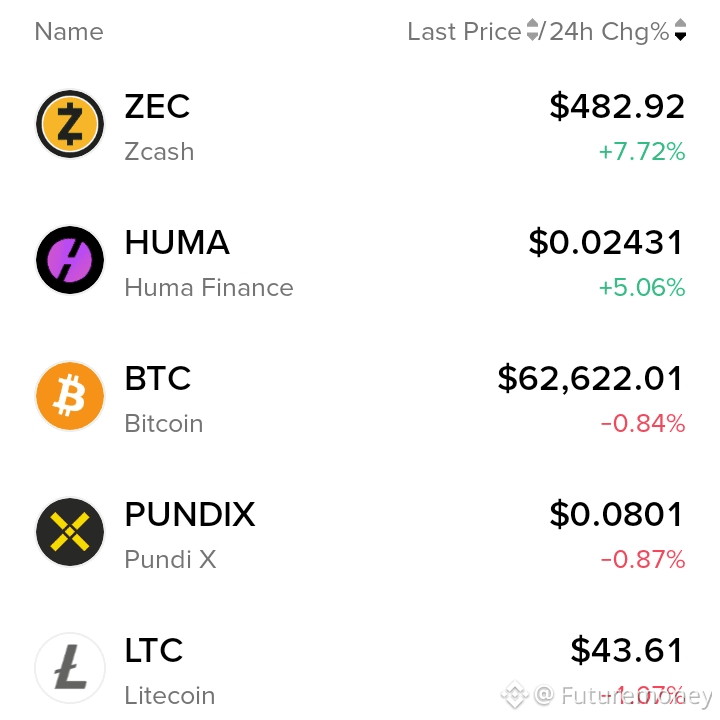
💥 Top Three Payment Tokens By The Market Capitalisation! 💸💰
1- $ZEC
2- $HUMA
3- $BTC
What do you think about these coins?
#Payment
💥 Top Three Payment Tokens By The Market Capitalisation! 💸💰
1- $ZEC
2- $HUMA
3- $BTC
What do you think about these coins?
#Payment
1- $ZEC
2- $HUMA
3- $BTC
What do you think about these coins?
#Payment
224

·
--
$COTI
A single line was stretched from 0.0077 to 0.0205, a 166% increase. Then it strung together bearish candles and retraced to 0.0152.
A typical long profit-trap stampede. But I don’t think this round is over yet.
First, let’s look at the market signals. On the 4-hour timeframe, from the 0.0205 high, there have been four consecutive bearish candles, with the low dropping to 0.013818. But the real body of each bearish candle is shrinking, while the lower wicks are getting longer. The last candle already printed a clear lower wick; after falling to 0.013818, it was quickly pulled back to 0.0152. Selling pressure is fading. This is not a breakdown—it’s healthy pullback.
The spread between the 24-hour high and low is from 0.013818 to 0.01815, an amplitude of 31%. Volatility hasn’t declined, which means the battle is still ongoing.
In terms of market sentiment, the funding rate is -0.116%. Shorts are paying money to longs. After a 166% surge, retail traders collectively chase shorts, thinking it finally dropped and now it’s time to short. But this kind of unanimity is often a reversal warning. The mark price is 0.01520799; the spot index is 0.01544162; the futures are trading at a discount of nearly 16 basis points. The short side is crowded too visibly. Historically, after such an extreme negative funding rate appears, price usually rebounds within 24 to 48 hours. The more extreme the retail sentiment, the more likely you’ll get slapped.
As for the actions of large players, volume has crashed from the peak of 8.8 billion to the current 680 million. A volume-decreasing selloff. If the main force truly wanted to dump and escape, they wouldn’t let trading volume shrink to this level. They’re waiting—waiting for the floating supply to be cleaned out, and waiting for leveraged shorts to accumulate enough to set up a squeeze. In the past 24 hours, total volume is $244 million; that absolute number is still not low, suggesting big money is picking up below. The turnover rate is among the top tier for high-cap coins. Over 30 consecutive 4-hour candles, total volume exceeds $15 billion, indicating very high participation. Large holders don’t care about short-term up or down; they’re waiting for a better entry.
In terms of volume-price structure, 0.0138 is the lowest point of this pullback, and also the upper edge of the consolidation range before the prior upswing. That level is holding. Overhead 0.0172 and 0.0182 are two resistance zones. If a retest of 0.0138 doesn’t break, the structure remains bullish. More importantly, the weighted average price is 0.01614, and the current price 0.01519 is about 11% below that average—within a reasonable deviation range. Only excessive deviation will be pulled back by the average. From 0.0138 to 0.0205 took less than three days; the momentum is extremely strong—this can’t be pushed by retail.
The candlestick details recently are worth watching. In the last ten 4-hour candles, the highs have dropped steadily from 0.0182 to 0.0147, and the lows have fallen steadily from 0.0169 to 0.0138. The downward channel is intact. But the third-to-last candle saw a volume surge with an upper wick thrusting to 0.017261, suggesting someone was testing the sell side above. The second-to-last candle had a long lower wick dipping to 0.013818, indicating someone is picking up below. Both sides are testing—direction is coming soon. Volume has shrunk from 8.8 billion to 680 million. The old saying about “low volume reveals low prices; low volume reveals where it’s worth it” isn’t without reason.
COTI is building payment infrastructure, and after the on-chain migration, the ecosystem is expanding. This round of explosive growth isn’t random air-coin speculation—fundamentals are supporting it. The more it rallies, the more it naturally needs to retrace, but the logic hasn’t broken. A pullback of within 30% is still normal technical adjustment. This sector has been developing quietly all along—it’s just that nobody noticed. The market is always like this: when it’s up, everyone is a stock god; when it’s down, everyone is an analyst.
Nini’s plan: Current price 0.0151940. I will build a long position in batches from 0.0145 to 0.0152, with a stop loss at 0.0133. First target 0.0172, second target 0.0182. Position size: 30%. If it breaks below 0.0138, exit everything—don’t hold.
Bias: bullish. Wait for 0.0138 to confirm support before taking action.
$COTI #Payment #Layer1
$COTI
A single line was stretched from 0.0077 to 0.0205, a 166% increase. Then it strung together bearish candles and retraced to 0.0152.
A typical long profit-trap stampede. But I don’t think this round is over yet.
First, let’s look at the market signals. On the 4-hour timeframe, from the 0.0205 high, there have been four consecutive bearish candles, with the low dropping to 0.013818. But the real body of each bearish candle is shrinking, while the lower wicks are getting longer. The last candle already printed a clear lower wick; after falling to 0.013818, it was quickly pulled back to 0.0152. Selling pressure is fading. This is not a breakdown—it’s healthy pullback.
The spread between the 24-hour high and low is from 0.013818 to 0.01815, an amplitude of 31%. Volatility hasn’t declined, which means the battle is still ongoing.
In terms of market sentiment, the funding rate is -0.116%. Shorts are paying money to longs. After a 166% surge, retail traders collectively chase shorts, thinking it finally dropped and now it’s time to short. But this kind of unanimity is often a reversal warning. The mark price is 0.01520799; the spot index is 0.01544162; the futures are trading at a discount of nearly 16 basis points. The short side is crowded too visibly. Historically, after such an extreme negative funding rate appears, price usually rebounds within 24 to 48 hours. The more extreme the retail sentiment, the more likely you’ll get slapped.
As for the actions of large players, volume has crashed from the peak of 8.8 billion to the current 680 million. A volume-decreasing selloff. If the main force truly wanted to dump and escape, they wouldn’t let trading volume shrink to this level. They’re waiting—waiting for the floating supply to be cleaned out, and waiting for leveraged shorts to accumulate enough to set up a squeeze. In the past 24 hours, total volume is $244 million; that absolute number is still not low, suggesting big money is picking up below. The turnover rate is among the top tier for high-cap coins. Over 30 consecutive 4-hour candles, total volume exceeds $15 billion, indicating very high participation. Large holders don’t care about short-term up or down; they’re waiting for a better entry.
In terms of volume-price structure, 0.0138 is the lowest point of this pullback, and also the upper edge of the consolidation range before the prior upswing. That level is holding. Overhead 0.0172 and 0.0182 are two resistance zones. If a retest of 0.0138 doesn’t break, the structure remains bullish. More importantly, the weighted average price is 0.01614, and the current price 0.01519 is about 11% below that average—within a reasonable deviation range. Only excessive deviation will be pulled back by the average. From 0.0138 to 0.0205 took less than three days; the momentum is extremely strong—this can’t be pushed by retail.
The candlestick details recently are worth watching. In the last ten 4-hour candles, the highs have dropped steadily from 0.0182 to 0.0147, and the lows have fallen steadily from 0.0169 to 0.0138. The downward channel is intact. But the third-to-last candle saw a volume surge with an upper wick thrusting to 0.017261, suggesting someone was testing the sell side above. The second-to-last candle had a long lower wick dipping to 0.013818, indicating someone is picking up below. Both sides are testing—direction is coming soon. Volume has shrunk from 8.8 billion to 680 million. The old saying about “low volume reveals low prices; low volume reveals where it’s worth it” isn’t without reason.
COTI is building payment infrastructure, and after the on-chain migration, the ecosystem is expanding. This round of explosive growth isn’t random air-coin speculation—fundamentals are supporting it. The more it rallies, the more it naturally needs to retrace, but the logic hasn’t broken. A pullback of within 30% is still normal technical adjustment. This sector has been developing quietly all along—it’s just that nobody noticed. The market is always like this: when it’s up, everyone is a stock god; when it’s down, everyone is an analyst.
Nini’s plan: Current price 0.0151940. I will build a long position in batches from 0.0145 to 0.0152, with a stop loss at 0.0133. First target 0.0172, second target 0.0182. Position size: 30%. If it breaks below 0.0138, exit everything—don’t hold.
Bias: bullish. Wait for 0.0138 to confirm support before taking action.
$COTI #Payment #Layer1
A single line was stretched from 0.0077 to 0.0205, a 166% increase. Then it strung together bearish candles and retraced to 0.0152.
A typical long profit-trap stampede. But I don’t think this round is over yet.
First, let’s look at the market signals. On the 4-hour timeframe, from the 0.0205 high, there have been four consecutive bearish candles, with the low dropping to 0.013818. But the real body of each bearish candle is shrinking, while the lower wicks are getting longer. The last candle already printed a clear lower wick; after falling to 0.013818, it was quickly pulled back to 0.0152. Selling pressure is fading. This is not a breakdown—it’s healthy pullback.
The spread between the 24-hour high and low is from 0.013818 to 0.01815, an amplitude of 31%. Volatility hasn’t declined, which means the battle is still ongoing.
In terms of market sentiment, the funding rate is -0.116%. Shorts are paying money to longs. After a 166% surge, retail traders collectively chase shorts, thinking it finally dropped and now it’s time to short. But this kind of unanimity is often a reversal warning. The mark price is 0.01520799; the spot index is 0.01544162; the futures are trading at a discount of nearly 16 basis points. The short side is crowded too visibly. Historically, after such an extreme negative funding rate appears, price usually rebounds within 24 to 48 hours. The more extreme the retail sentiment, the more likely you’ll get slapped.
As for the actions of large players, volume has crashed from the peak of 8.8 billion to the current 680 million. A volume-decreasing selloff. If the main force truly wanted to dump and escape, they wouldn’t let trading volume shrink to this level. They’re waiting—waiting for the floating supply to be cleaned out, and waiting for leveraged shorts to accumulate enough to set up a squeeze. In the past 24 hours, total volume is $244 million; that absolute number is still not low, suggesting big money is picking up below. The turnover rate is among the top tier for high-cap coins. Over 30 consecutive 4-hour candles, total volume exceeds $15 billion, indicating very high participation. Large holders don’t care about short-term up or down; they’re waiting for a better entry.
In terms of volume-price structure, 0.0138 is the lowest point of this pullback, and also the upper edge of the consolidation range before the prior upswing. That level is holding. Overhead 0.0172 and 0.0182 are two resistance zones. If a retest of 0.0138 doesn’t break, the structure remains bullish. More importantly, the weighted average price is 0.01614, and the current price 0.01519 is about 11% below that average—within a reasonable deviation range. Only excessive deviation will be pulled back by the average. From 0.0138 to 0.0205 took less than three days; the momentum is extremely strong—this can’t be pushed by retail.
The candlestick details recently are worth watching. In the last ten 4-hour candles, the highs have dropped steadily from 0.0182 to 0.0147, and the lows have fallen steadily from 0.0169 to 0.0138. The downward channel is intact. But the third-to-last candle saw a volume surge with an upper wick thrusting to 0.017261, suggesting someone was testing the sell side above. The second-to-last candle had a long lower wick dipping to 0.013818, indicating someone is picking up below. Both sides are testing—direction is coming soon. Volume has shrunk from 8.8 billion to 680 million. The old saying about “low volume reveals low prices; low volume reveals where it’s worth it” isn’t without reason.
COTI is building payment infrastructure, and after the on-chain migration, the ecosystem is expanding. This round of explosive growth isn’t random air-coin speculation—fundamentals are supporting it. The more it rallies, the more it naturally needs to retrace, but the logic hasn’t broken. A pullback of within 30% is still normal technical adjustment. This sector has been developing quietly all along—it’s just that nobody noticed. The market is always like this: when it’s up, everyone is a stock god; when it’s down, everyone is an analyst.
Nini’s plan: Current price 0.0151940. I will build a long position in batches from 0.0145 to 0.0152, with a stop loss at 0.0133. First target 0.0172, second target 0.0182. Position size: 30%. If it breaks below 0.0138, exit everything—don’t hold.
Bias: bullish. Wait for 0.0138 to confirm support before taking action.
$COTI #Payment #Layer1
157

·
--
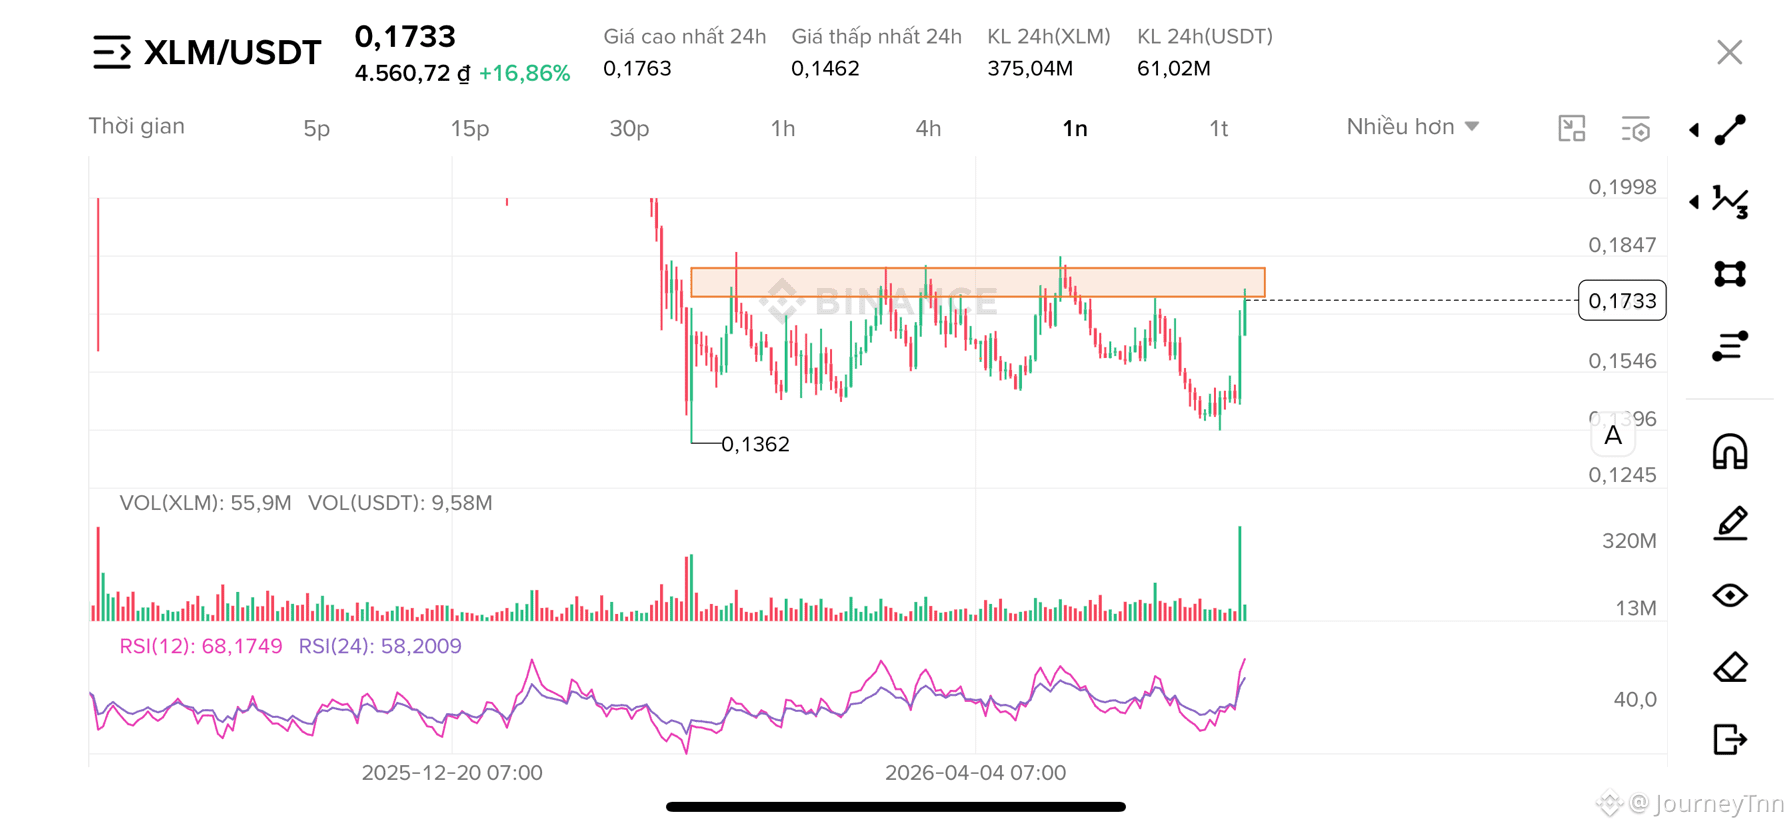
$XLM is a top performer in the payment sector, but don't rush to conclusions; perhaps we should wait for the candle to close to see if the price can break through this resistance zone.
#payment #StablecoinRatings
$XLM is a top performer in the payment sector, but don't rush to conclusions; perhaps we should wait for the candle to close to see if the price can break through this resistance zone.
#payment #StablecoinRatings
#payment #StablecoinRatings
151


·
--
Bullish
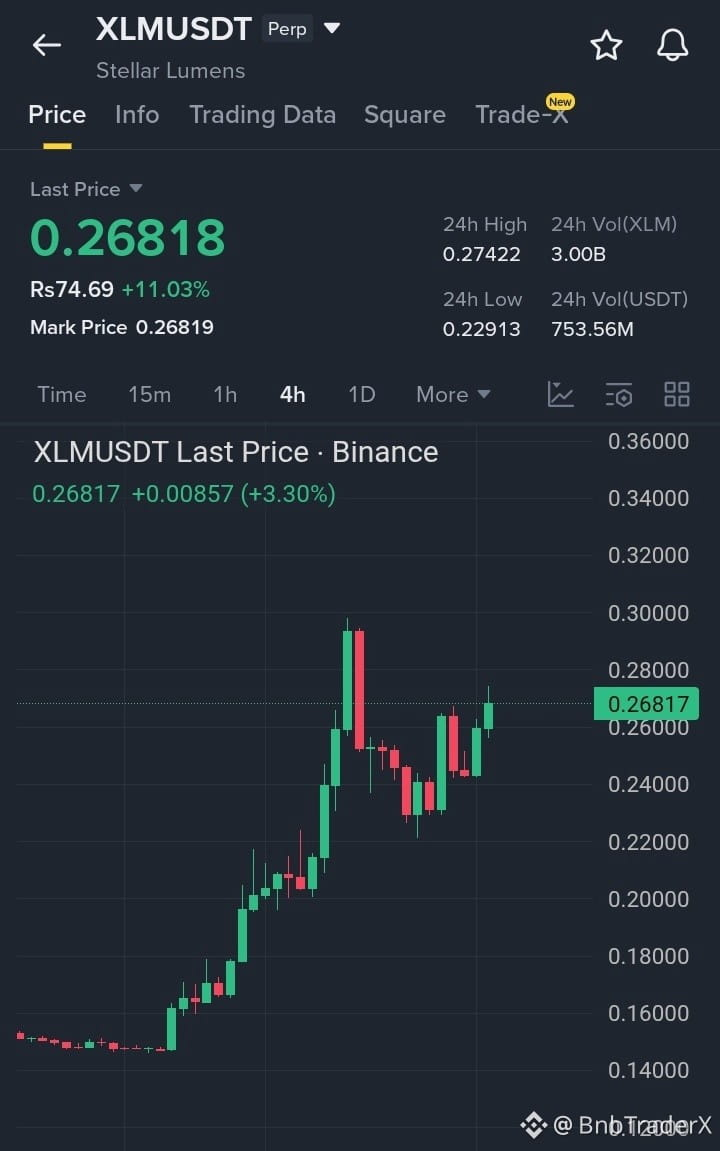
$XLM in Screenshot_20260601_081554.jpg shows a highly constructive bullish market structure following a healthy correction. After surging from its multi-day base to a peak near 0.2900, the asset completed a perfect retest of support around the 0.2400 level, printing a clear higher low. The current 4-hour candle shows buyers returning with significant momentum, pushing the price up over 11% in the last 24 hours to trade at 0.26818. This aggressive bounce confirms that demand remains incredibly strong on dips, clearing the way for a retest of local highs and a potential breakout into a fresh macro expansion phase.
* Target 1: 0.29500
* Target 2: 0.32000
* Target 3: 0.35000
#XLM #Payment #Crypto
{spot}(XLMUSDT)
$XLM in Screenshot_20260601_081554.jpg shows a highly constructive bullish market structure following a healthy correction. After surging from its multi-day base to a peak near 0.2900, the asset completed a perfect retest of support around the 0.2400 level, printing a clear higher low. The current 4-hour candle shows buyers returning with significant momentum, pushing the price up over 11% in the last 24 hours to trade at 0.26818. This aggressive bounce confirms that demand remains incredibly strong on dips, clearing the way for a retest of local highs and a potential breakout into a fresh macro expansion phase.
* Target 1: 0.29500
* Target 2: 0.32000
* Target 3: 0.35000
#XLM #Payment #Crypto
* Target 1: 0.29500
* Target 2: 0.32000
* Target 3: 0.35000
#XLM #Payment #Crypto
2
176

🔐 $COTI /USDT — 🔴 SHORT · Conf 72%
━━━━━━━━━━━━━━
📍 Entry: 0.0114854 – 0.0115546
🛑 SL: 0.0122700
🎯 TP1: 0.0109440
✅ TP2: 0.0104832
🏆 TP3: 0.0097920
━━━━━━━━━━━━━━
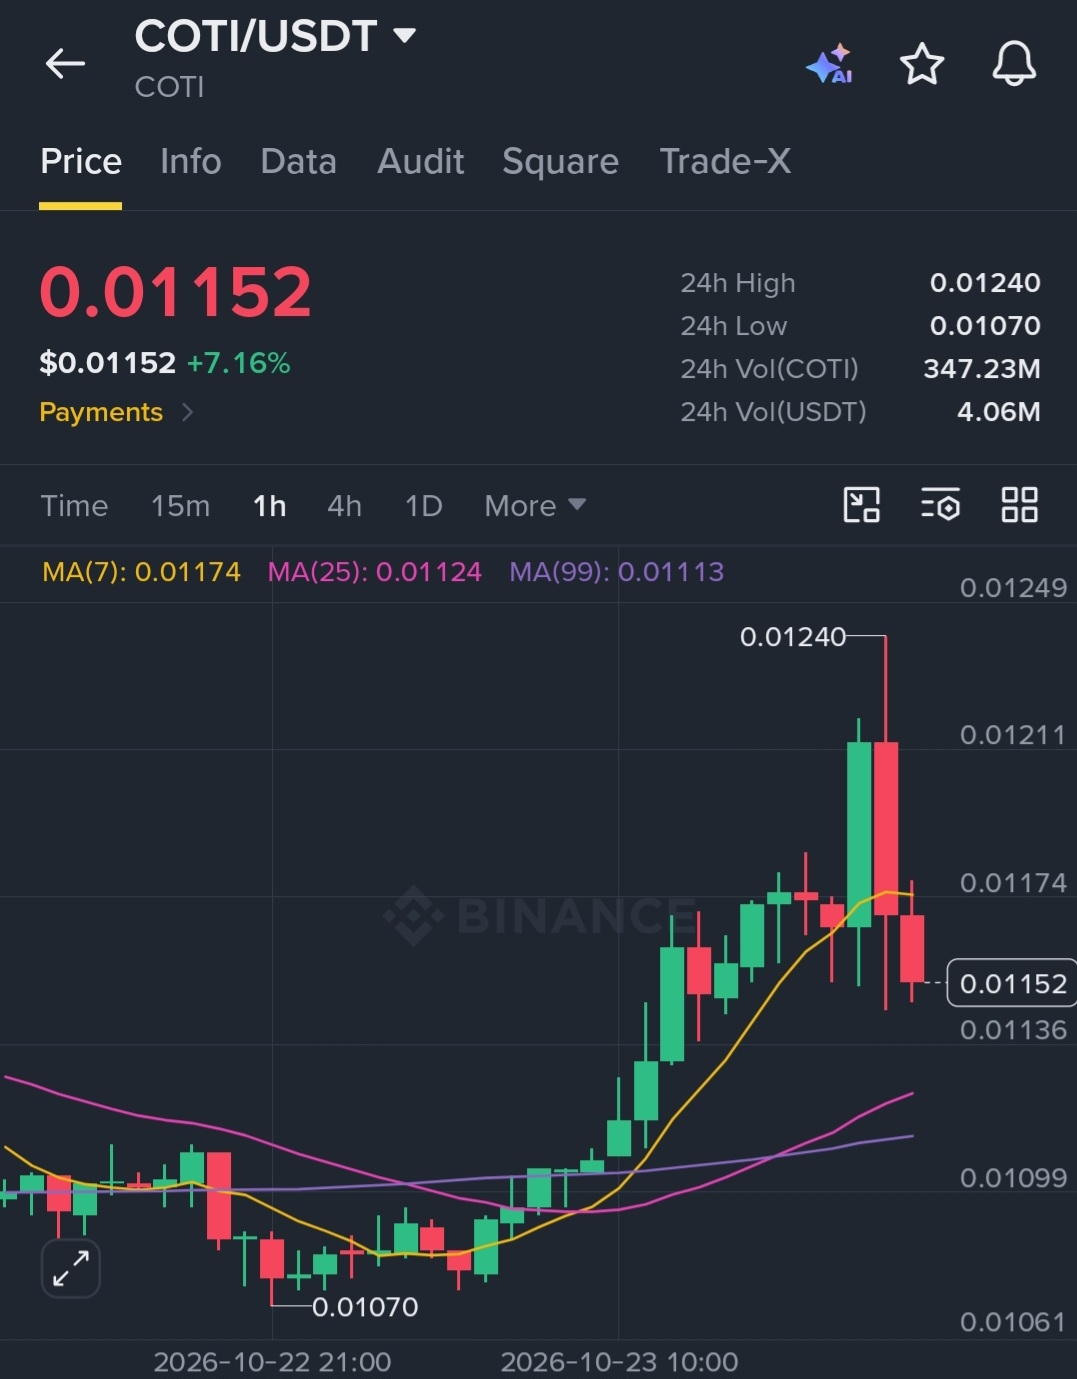
🔎 Price printed a long upper wick at 0.01240 and closed back under MA7 (0.01174); 1D bias follows 30D −24.61%, though 1H is above MA25.
🧠 $COTI : Payments-focused chain with a privacy layer using garbled circuits; 1Y is −65.44%.
💬 COTI is +58% over 90D but −25% over 30D: bounce in a downtrend or a base?
#COTI #Payment #GarbledCircuits #cotiwhitepaper #COTI/USDT.
{future}(COTIUSDT)
🔐 $COTI /USDT — 🔴 SHORT · Conf 72%
━━━━━━━━━━━━━━
📍 Entry: 0.0114854 – 0.0115546
🛑 SL: 0.0122700
🎯 TP1: 0.0109440
✅ TP2: 0.0104832
🏆 TP3: 0.0097920
━━━━━━━━━━━━━━
🔎 Price printed a long upper wick at 0.01240 and closed back under MA7 (0.01174); 1D bias follows 30D −24.61%, though 1H is above MA25.
🧠 $COTI : Payments-focused chain with a privacy layer using garbled circuits; 1Y is −65.44%.
💬 COTI is +58% over 90D but −25% over 30D: bounce in a downtrend or a base?
#COTI #Payment #GarbledCircuits #cotiwhitepaper #COTI/USDT.
━━━━━━━━━━━━━━
📍 Entry: 0.0114854 – 0.0115546
🛑 SL: 0.0122700
🎯 TP1: 0.0109440
✅ TP2: 0.0104832
🏆 TP3: 0.0097920
━━━━━━━━━━━━━━
🔎 Price printed a long upper wick at 0.01240 and closed back under MA7 (0.01174); 1D bias follows 30D −24.61%, though 1H is above MA25.
🧠 $COTI : Payments-focused chain with a privacy layer using garbled circuits; 1Y is −65.44%.
💬 COTI is +58% over 90D but −25% over 30D: bounce in a downtrend or a base?
#COTI #Payment #GarbledCircuits #cotiwhitepaper #COTI/USDT.

2
506
💧 $XRP /USDT — 🟢 LONG · Conf 63%
━━━━━━━━━━━━━━
📍 Entry: 1.3549 – 1.3631
🛑 SL: 1.3363
🎯 TP1: 1.4270
✅ TP2: 1.4813
🏆 TP3: 1.5629
━━━━━━━━━━━━━━
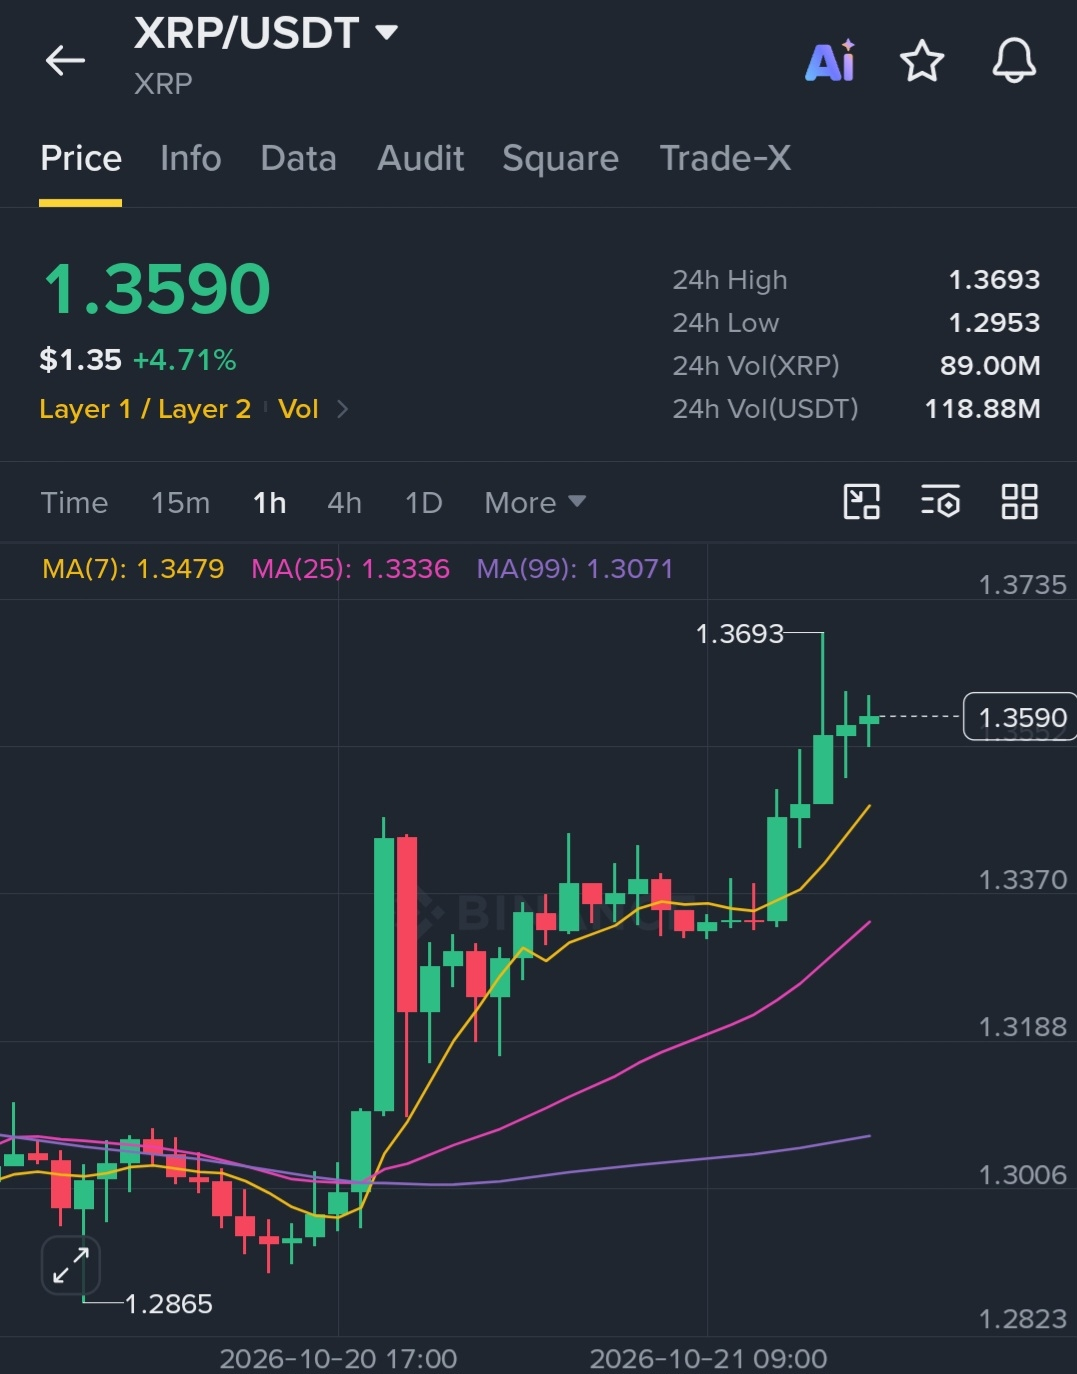
🔎 1H holds MA(7) 1.3479 over MA(25) 1.3336 with bids at 61.98% of the book; 1.3693 is the level to reclaim.
🧠 $XRP : XRP runs on the XRP Ledger, where validators agree on transactions without mining and each one burns a tiny XRP fee; the risk is that Ripple still holds a large escrowed supply.
💬 Does XRP's payments use case need the token, or can banks use the ledger and skip it?
#XRP #Ripple #Ledger #Validation #Payment
{future}(XRPUSDT)
💧 $XRP /USDT — 🟢 LONG · Conf 63%
━━━━━━━━━━━━━━
📍 Entry: 1.3549 – 1.3631
🛑 SL: 1.3363
🎯 TP1: 1.4270
✅ TP2: 1.4813
🏆 TP3: 1.5629
━━━━━━━━━━━━━━
🔎 1H holds MA(7) 1.3479 over MA(25) 1.3336 with bids at 61.98% of the book; 1.3693 is the level to reclaim.
🧠 $XRP : XRP runs on the XRP Ledger, where validators agree on transactions without mining and each one burns a tiny XRP fee; the risk is that Ripple still holds a large escrowed supply.
💬 Does XRP's payments use case need the token, or can banks use the ledger and skip it?
#XRP #Ripple #Ledger #Validation #Payment
━━━━━━━━━━━━━━
📍 Entry: 1.3549 – 1.3631
🛑 SL: 1.3363
🎯 TP1: 1.4270
✅ TP2: 1.4813
🏆 TP3: 1.5629
━━━━━━━━━━━━━━
🔎 1H holds MA(7) 1.3479 over MA(25) 1.3336 with bids at 61.98% of the book; 1.3693 is the level to reclaim.
🧠 $XRP : XRP runs on the XRP Ledger, where validators agree on transactions without mining and each one burns a tiny XRP fee; the risk is that Ripple still holds a large escrowed supply.
💬 Does XRP's payments use case need the token, or can banks use the ledger and skip it?
#XRP #Ripple #Ledger #Validation #Payment

1
199

·
--
Bullish
I want to see if $XNO is commission-free and as fast as they say. Bye $PEOPLE , see you soon. From #meme_coin to #Payment ...
I want to see if $XNO is commission-free and as fast as they say. Bye $PEOPLE , see you soon. From #meme_coin to #Payment ...
307
Log in to explore more content
Join global crypto users on Binance Square
⚡️ Get latest and useful information about crypto.
💬 Trusted by the world’s largest crypto exchange.
👍 Discover real insights from verified creators.
Email / Phone number
Trending Topics
1
#BinancePick
2.6M views
141,293 Discussing
2
#EarningsSeason
5M views
24,313 Discussing
3
#FranklinTempletonFilesForTwoDividendToBitcoinETFs
1,200 views
80 Discussing
4
#StrategyMSTRSurpassesNasdaqInMarketCap
1,522 views
82 Discussing
5
#CanadaProposesStablecoinRedemptionWithin3BusinessDays
90 views
12 Discussing
6
#ElectrumWalletBugLetRogueServersStealFunds
8,012 views
229 Discussing
7
#ArgentineCourtDismissesLIBRACaseAgainstMilei
17,858 views
309 Discussing
8
#SKHynixReportedlyPlansSpecialDividendFromKioxiaStakeSale
3,094 views
48 Discussing
9
#KeystoneWebsiteBreachExposesBuyersShippingAddresses
1,655 views
40 Discussing
10
#USQ3GDPAndSeptemberPCEDueNextWeek
95,039 views
1,126 Discussing