

#options
options
130,855 views
822 Discussing
Hot
Latest

·
--
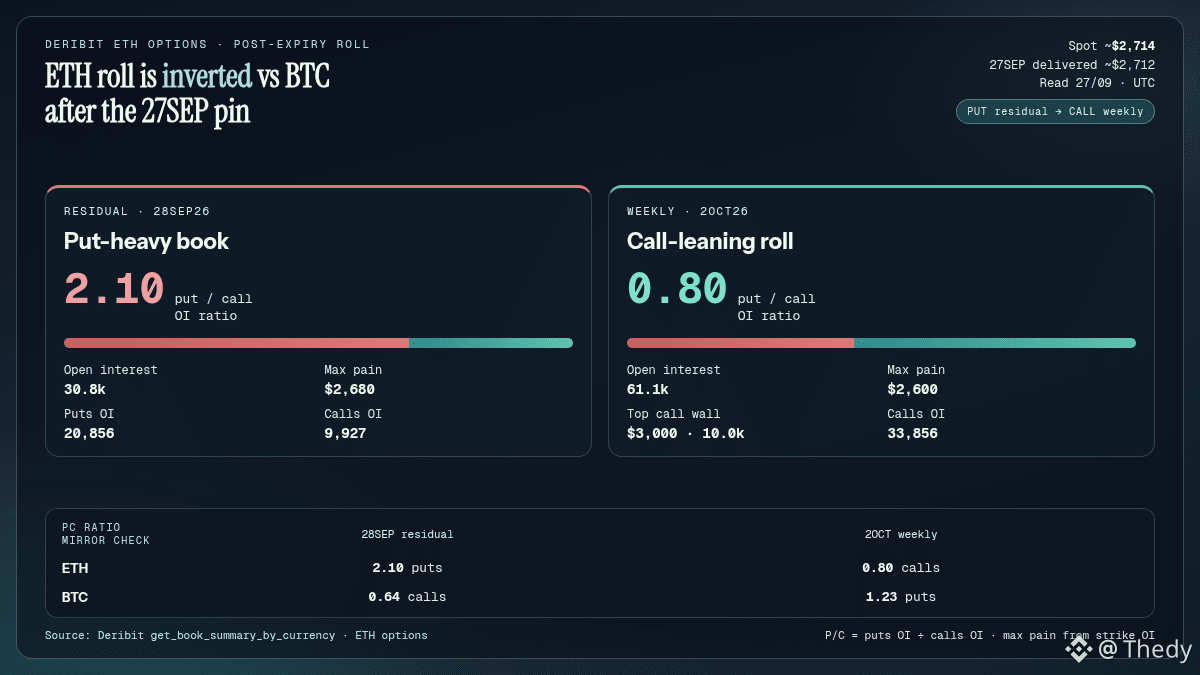
The roll $ETH on Deribit does not look like the $BTC roll. After the 27SEP pin, the residual and the weekly point in opposite directions.
FACTS (Deribit get_book_summary_by_currency, ETH options, read 27/09 UTC):
• 27SEP26: expired / delivered ≈ 2,712 (more in the active book)
• Residual 28SEP26: puts ≈ 20,856 / calls ≈ 9,927, put/call ≈ 2.10, OI ≈ 30.8k, max pain ≈ 2,680. Clearly put-heavy in the book vs spot (~2,714 Kraken)
• Weekly 2OCT26: calls ≈ 33,856 / puts ≈ 27,250, put/call ≈ 0.80, OI ≈ 61.1k, max pain ≈ 2,600. Visible call wall at 3,000 (≈ 10.0k OI)
BTC MIRROR (same window, previous post):
• BTC 28SEP put/call ≈ 0.64 (call-leaning) · BTC 2OCT put/call ≈ 1.23 (put-heavy)
• On ETH, it’s the opposite: residual puts, then the weekly flips back to calls
INTERPRETATION:
The ETH options market keeps short-dated coverage (28SEP) while rolling gamma/calls toward 2OCT. This is not a single directional signal. It’s a positioning structure: near-term hedge, upside further out, with weekly max pain still below spot.
SCENARIOS:
• Holding above ~2,680–2,700: the residual put loses value, focus shifts to the 2OCT 3k wall
• Rejection below ~2,680: the 28SEP put book becomes the short-term magnet again
• “Mirror” reading invalidation: if the 2OCT put/call ratio rises clearly above 1.0 before the weekly
$ETH $BTC
Does the ETH structure look more like a defensive hedge to you, or like a roll already toward the 3k upside?
#Ethereum #Options #Deribit
The roll $ETH on Deribit does not look like the $BTC roll. After the 27SEP pin, the residual and the weekly point in opposite directions.
FACTS (Deribit get_book_summary_by_currency, ETH options, read 27/09 UTC):
• 27SEP26: expired / delivered ≈ 2,712 (more in the active book)
• Residual 28SEP26: puts ≈ 20,856 / calls ≈ 9,927, put/call ≈ 2.10, OI ≈ 30.8k, max pain ≈ 2,680. Clearly put-heavy in the book vs spot (~2,714 Kraken)
• Weekly 2OCT26: calls ≈ 33,856 / puts ≈ 27,250, put/call ≈ 0.80, OI ≈ 61.1k, max pain ≈ 2,600. Visible call wall at 3,000 (≈ 10.0k OI)
BTC MIRROR (same window, previous post):
• BTC 28SEP put/call ≈ 0.64 (call-leaning) · BTC 2OCT put/call ≈ 1.23 (put-heavy)
• On ETH, it’s the opposite: residual puts, then the weekly flips back to calls
INTERPRETATION:
The ETH options market keeps short-dated coverage (28SEP) while rolling gamma/calls toward 2OCT. This is not a single directional signal. It’s a positioning structure: near-term hedge, upside further out, with weekly max pain still below spot.
SCENARIOS:
• Holding above ~2,680–2,700: the residual put loses value, focus shifts to the 2OCT 3k wall
• Rejection below ~2,680: the 28SEP put book becomes the short-term magnet again
• “Mirror” reading invalidation: if the 2OCT put/call ratio rises clearly above 1.0 before the weekly
$ETH $BTC
Does the ETH structure look more like a defensive hedge to you, or like a roll already toward the 3k upside?
#Ethereum #Options #Deribit
FACTS (Deribit get_book_summary_by_currency, ETH options, read 27/09 UTC):
• 27SEP26: expired / delivered ≈ 2,712 (more in the active book)
• Residual 28SEP26: puts ≈ 20,856 / calls ≈ 9,927, put/call ≈ 2.10, OI ≈ 30.8k, max pain ≈ 2,680. Clearly put-heavy in the book vs spot (~2,714 Kraken)
• Weekly 2OCT26: calls ≈ 33,856 / puts ≈ 27,250, put/call ≈ 0.80, OI ≈ 61.1k, max pain ≈ 2,600. Visible call wall at 3,000 (≈ 10.0k OI)
BTC MIRROR (same window, previous post):
• BTC 28SEP put/call ≈ 0.64 (call-leaning) · BTC 2OCT put/call ≈ 1.23 (put-heavy)
• On ETH, it’s the opposite: residual puts, then the weekly flips back to calls
INTERPRETATION:
The ETH options market keeps short-dated coverage (28SEP) while rolling gamma/calls toward 2OCT. This is not a single directional signal. It’s a positioning structure: near-term hedge, upside further out, with weekly max pain still below spot.
SCENARIOS:
• Holding above ~2,680–2,700: the residual put loses value, focus shifts to the 2OCT 3k wall
• Rejection below ~2,680: the 28SEP put book becomes the short-term magnet again
• “Mirror” reading invalidation: if the 2OCT put/call ratio rises clearly above 1.0 before the weekly
$ETH $BTC
Does the ETH structure look more like a defensive hedge to you, or like a roll already toward the 3k upside?
#Ethereum #Options #Deribit
56
·
--
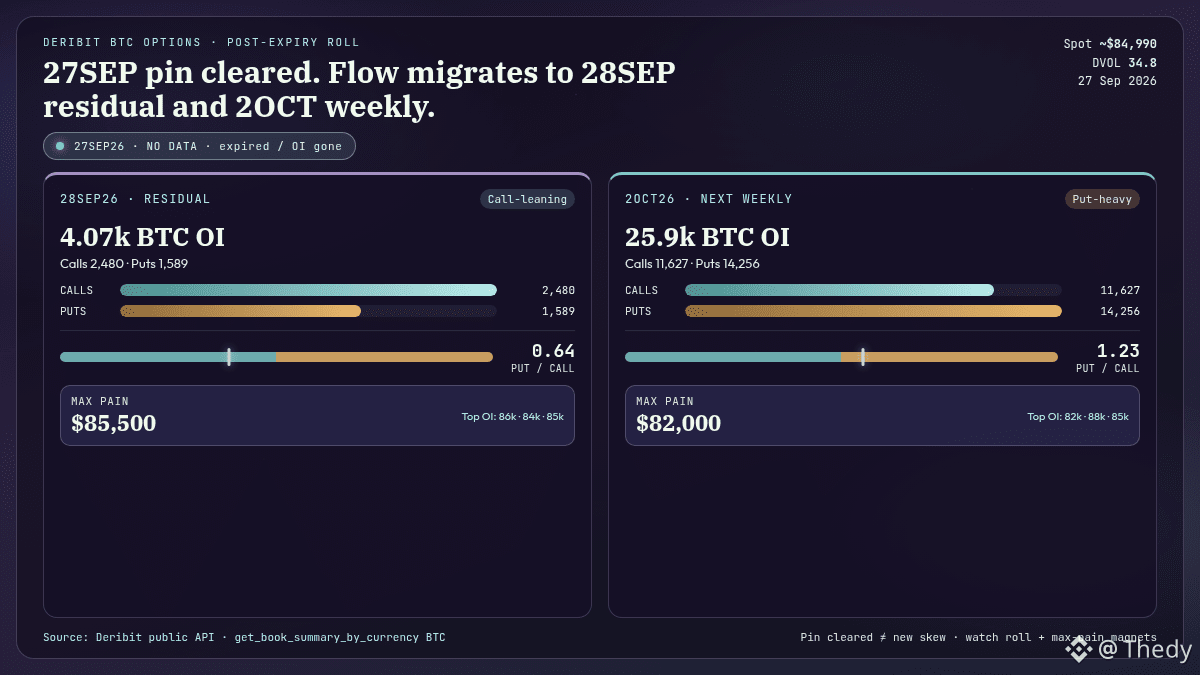
The 27SEP pin on Deribit has disappeared from the book. The roll $BTC is now reading on the 28SEP residual and the 2OCT weekly.
FACTS (Deribit get_book_summary_by_currency, BTC options, live read 27/09):
• 27SEP26: no more data (expired, OI cleared). Even the day before: OI ≈ 4,462, put/call ≈ 0.49, max pain ≈ 84,500
• 28SEP26 residual: calls ≈ 2,480 / puts ≈ 1,589, put/call ≈ 0.64 (call-leaning), max pain ≈ 85,500. Top OI: 86k / 84k / 85k
• Weekly 2OCT26: calls ≈ 11,627 / puts ≈ 14,256, put/call ≈ 1.23 (put-heavy), OI ≈ 25.9k BTC, max pain ≈ 82,000. Top OI: 82k / 88k / 85k
• Spot ≈ 84,990 (+0.7% 24h), DVOL ≈ 34.8. Calm perp funding
INTERPRETATION:
This is no longer the pre-expiry skew. It’s the post-roll: today’s pin has been cleaned out; the 28SEP residual remains light and call-leaning, while the real OI stock has shifted onto 2OCT, which is more put-heavy, with a lower max pain (~82k) under spot.
SCENARIOS:
• Consolidation / soft pin: spot stays near 84.5k–86k as long as the 28SEP residual digests
• Weekly magnet: if the flow continues on 2OCT, the 82k zone (max pain) + 85k/88k clusters becomes the week’s framework
• Not a pure directional signal: OI put-heavy ≠ forced short spot, especially with neutral funding
Do you trade the 28SEP residual or the 2OCT weekly on $BTC ?
#Bitcoin #Options #Crypto
The 27SEP pin on Deribit has disappeared from the book. The roll $BTC is now reading on the 28SEP residual and the 2OCT weekly.
FACTS (Deribit get_book_summary_by_currency, BTC options, live read 27/09):
• 27SEP26: no more data (expired, OI cleared). Even the day before: OI ≈ 4,462, put/call ≈ 0.49, max pain ≈ 84,500
• 28SEP26 residual: calls ≈ 2,480 / puts ≈ 1,589, put/call ≈ 0.64 (call-leaning), max pain ≈ 85,500. Top OI: 86k / 84k / 85k
• Weekly 2OCT26: calls ≈ 11,627 / puts ≈ 14,256, put/call ≈ 1.23 (put-heavy), OI ≈ 25.9k BTC, max pain ≈ 82,000. Top OI: 82k / 88k / 85k
• Spot ≈ 84,990 (+0.7% 24h), DVOL ≈ 34.8. Calm perp funding
INTERPRETATION:
This is no longer the pre-expiry skew. It’s the post-roll: today’s pin has been cleaned out; the 28SEP residual remains light and call-leaning, while the real OI stock has shifted onto 2OCT, which is more put-heavy, with a lower max pain (~82k) under spot.
SCENARIOS:
• Consolidation / soft pin: spot stays near 84.5k–86k as long as the 28SEP residual digests
• Weekly magnet: if the flow continues on 2OCT, the 82k zone (max pain) + 85k/88k clusters becomes the week’s framework
• Not a pure directional signal: OI put-heavy ≠ forced short spot, especially with neutral funding
Do you trade the 28SEP residual or the 2OCT weekly on $BTC ?
#Bitcoin #Options #Crypto
FACTS (Deribit get_book_summary_by_currency, BTC options, live read 27/09):
• 27SEP26: no more data (expired, OI cleared). Even the day before: OI ≈ 4,462, put/call ≈ 0.49, max pain ≈ 84,500
• 28SEP26 residual: calls ≈ 2,480 / puts ≈ 1,589, put/call ≈ 0.64 (call-leaning), max pain ≈ 85,500. Top OI: 86k / 84k / 85k
• Weekly 2OCT26: calls ≈ 11,627 / puts ≈ 14,256, put/call ≈ 1.23 (put-heavy), OI ≈ 25.9k BTC, max pain ≈ 82,000. Top OI: 82k / 88k / 85k
• Spot ≈ 84,990 (+0.7% 24h), DVOL ≈ 34.8. Calm perp funding
INTERPRETATION:
This is no longer the pre-expiry skew. It’s the post-roll: today’s pin has been cleaned out; the 28SEP residual remains light and call-leaning, while the real OI stock has shifted onto 2OCT, which is more put-heavy, with a lower max pain (~82k) under spot.
SCENARIOS:
• Consolidation / soft pin: spot stays near 84.5k–86k as long as the 28SEP residual digests
• Weekly magnet: if the flow continues on 2OCT, the 82k zone (max pain) + 85k/88k clusters becomes the week’s framework
• Not a pure directional signal: OI put-heavy ≠ forced short spot, especially with neutral funding
Do you trade the 28SEP residual or the 2OCT weekly on $BTC ?
#Bitcoin #Options #Crypto
49
·
--
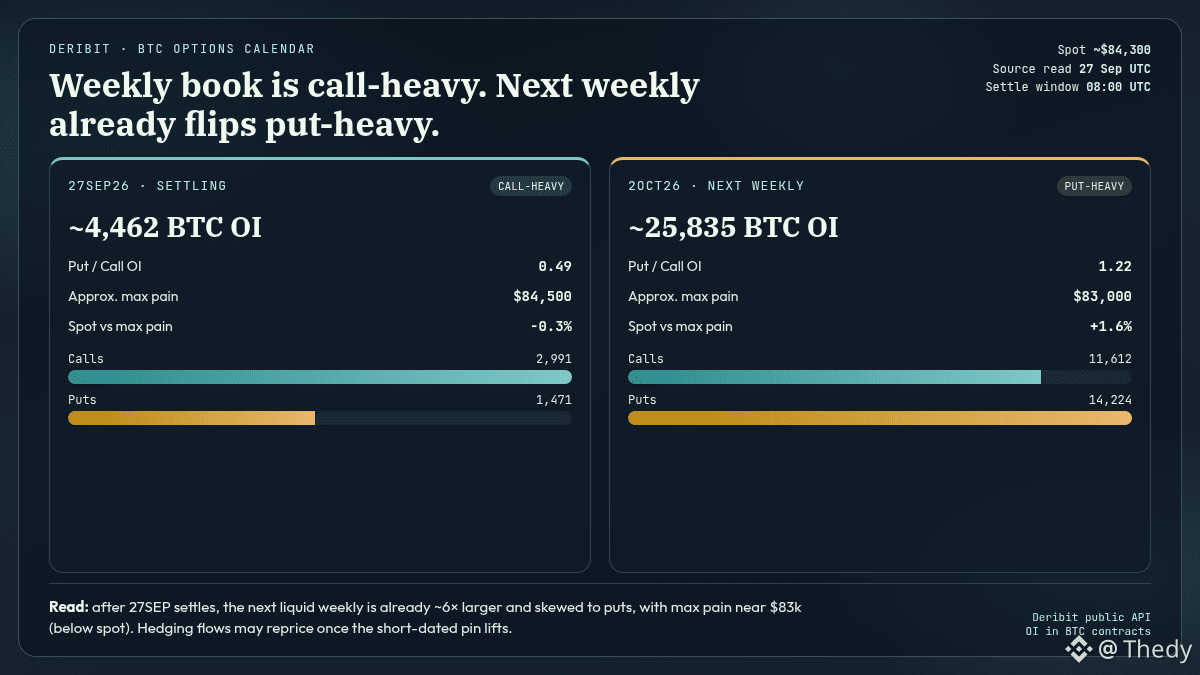
The short pin of $BTC on Deribit already changes face.
Facts (public Deribit API, read on 27/09 UTC):
• Expiry 27SEP26 (settlement ~08:00 UTC): OI ≈ 4,462 BTC, call-heavy skew (put/call ≈ 0.49), max pain approx. ≈ $84,500. Spot ≈ $84,300, i.e. −0.3% below this level.
• Next weekly 2OCT26: OI already ≈ 25,835 BTC (≈ 6× larger), put-heavy skew (put/call ≈ 1.22), max pain approx. ≈ $83,000 (≈ +1.6% below spot).
Interpretation (not advice): as long as the short-dated holds the price near 84.5k, the pin masks the true imbalance. Once 27SEP is settled, the next liquid book is already biased puts with a lower max pain. Dealer hedging flows can then re-anchor the useful zone around ~83k, unless spot breaks clearly above the big call strikes (88k on 2OCT).
Scenarios:
1) Spot holds 84k–84.5k after settlement → calm digestion; the 2OCT skew remains more of a restraint than an immediate magnet
2) Pullback to 83k–83.5k → alignment with 2OCT max pain and the big puts (78k–82k)
3) Clean break above 85k–86k → the put-heavy bias hurts and forces a catch-up of hedges
Are you looking more at the pin up to 08:00 UTC, or already the 2OCT book?
$BTC $ETH
#Bitcoin #Options #Crypto
The short pin of $BTC on Deribit already changes face.
Facts (public Deribit API, read on 27/09 UTC):
• Expiry 27SEP26 (settlement ~08:00 UTC): OI ≈ 4,462 BTC, call-heavy skew (put/call ≈ 0.49), max pain approx. ≈ $84,500. Spot ≈ $84,300, i.e. −0.3% below this level.
• Next weekly 2OCT26: OI already ≈ 25,835 BTC (≈ 6× larger), put-heavy skew (put/call ≈ 1.22), max pain approx. ≈ $83,000 (≈ +1.6% below spot).
Interpretation (not advice): as long as the short-dated holds the price near 84.5k, the pin masks the true imbalance. Once 27SEP is settled, the next liquid book is already biased puts with a lower max pain. Dealer hedging flows can then re-anchor the useful zone around ~83k, unless spot breaks clearly above the big call strikes (88k on 2OCT).
Scenarios:
1) Spot holds 84k–84.5k after settlement → calm digestion; the 2OCT skew remains more of a restraint than an immediate magnet
2) Pullback to 83k–83.5k → alignment with 2OCT max pain and the big puts (78k–82k)
3) Clean break above 85k–86k → the put-heavy bias hurts and forces a catch-up of hedges
Are you looking more at the pin up to 08:00 UTC, or already the 2OCT book?
$BTC $ETH
#Bitcoin #Options #Crypto
Facts (public Deribit API, read on 27/09 UTC):
• Expiry 27SEP26 (settlement ~08:00 UTC): OI ≈ 4,462 BTC, call-heavy skew (put/call ≈ 0.49), max pain approx. ≈ $84,500. Spot ≈ $84,300, i.e. −0.3% below this level.
• Next weekly 2OCT26: OI already ≈ 25,835 BTC (≈ 6× larger), put-heavy skew (put/call ≈ 1.22), max pain approx. ≈ $83,000 (≈ +1.6% below spot).
Interpretation (not advice): as long as the short-dated holds the price near 84.5k, the pin masks the true imbalance. Once 27SEP is settled, the next liquid book is already biased puts with a lower max pain. Dealer hedging flows can then re-anchor the useful zone around ~83k, unless spot breaks clearly above the big call strikes (88k on 2OCT).
Scenarios:
1) Spot holds 84k–84.5k after settlement → calm digestion; the 2OCT skew remains more of a restraint than an immediate magnet
2) Pullback to 83k–83.5k → alignment with 2OCT max pain and the big puts (78k–82k)
3) Clean break above 85k–86k → the put-heavy bias hurts and forces a catch-up of hedges
Are you looking more at the pin up to 08:00 UTC, or already the 2OCT book?
$BTC $ETH
#Bitcoin #Options #Crypto
168
·
--
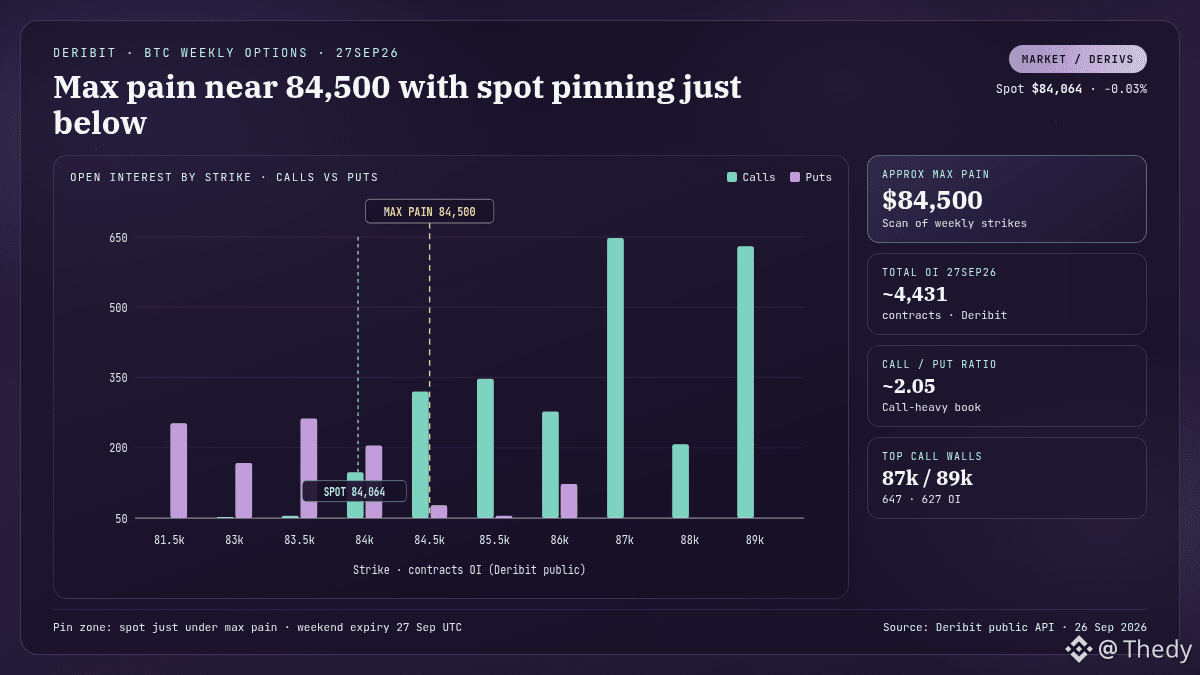
Tomorrow, weekly expiry options $BTC sur Deribit (27SEP26). The spot pins just below max pain.
Facts (Deribit public API, read on 26/09):
• Total OI on 27SEP26 ≈ 4,431 contracts
• Max pain approx. ≈ $84,500 (strike scan)
• Call-heavy skew: call/put ratio ≈ 2.05; visible walls at 87k (647 OI) and 89k (627)
• Kraken spot ≈ $84,064 (−0.03%); OKX BTC funding ≈ −0.0025% (calm)
• 24h liquidations CoinGlass ≈ $93M (soft weekend), far from weekly peaks
Interpretation (not financial advice): during an expiry weekend, price tends to gravitate toward the zone of maximum pain for the writers. Here the pin is tight, between ~84k and ~84.5k. Calls above have a lot of open interest, which can cap short squeezes if spot doesn’t break out.
Scenarios:
1) Hold above ~84k / flirt with 84.5k → classic pin into expiry
2) Break below ~83–83.5k (where puts thicken) → the pin shifts and the call-heavy bias weighs less
And you, are you trading the pin toward 84.5k or a breakdown below 83.5k before expiry?
$BTC $ETH
#Bitcoin #Options #Crypto
Tomorrow, weekly expiry options $BTC sur Deribit (27SEP26). The spot pins just below max pain.
Facts (Deribit public API, read on 26/09):
• Total OI on 27SEP26 ≈ 4,431 contracts
• Max pain approx. ≈ $84,500 (strike scan)
• Call-heavy skew: call/put ratio ≈ 2.05; visible walls at 87k (647 OI) and 89k (627)
• Kraken spot ≈ $84,064 (−0.03%); OKX BTC funding ≈ −0.0025% (calm)
• 24h liquidations CoinGlass ≈ $93M (soft weekend), far from weekly peaks
Interpretation (not financial advice): during an expiry weekend, price tends to gravitate toward the zone of maximum pain for the writers. Here the pin is tight, between ~84k and ~84.5k. Calls above have a lot of open interest, which can cap short squeezes if spot doesn’t break out.
Scenarios:
1) Hold above ~84k / flirt with 84.5k → classic pin into expiry
2) Break below ~83–83.5k (where puts thicken) → the pin shifts and the call-heavy bias weighs less
And you, are you trading the pin toward 84.5k or a breakdown below 83.5k before expiry?
$BTC $ETH
#Bitcoin #Options #Crypto
Facts (Deribit public API, read on 26/09):
• Total OI on 27SEP26 ≈ 4,431 contracts
• Max pain approx. ≈ $84,500 (strike scan)
• Call-heavy skew: call/put ratio ≈ 2.05; visible walls at 87k (647 OI) and 89k (627)
• Kraken spot ≈ $84,064 (−0.03%); OKX BTC funding ≈ −0.0025% (calm)
• 24h liquidations CoinGlass ≈ $93M (soft weekend), far from weekly peaks
Interpretation (not financial advice): during an expiry weekend, price tends to gravitate toward the zone of maximum pain for the writers. Here the pin is tight, between ~84k and ~84.5k. Calls above have a lot of open interest, which can cap short squeezes if spot doesn’t break out.
Scenarios:
1) Hold above ~84k / flirt with 84.5k → classic pin into expiry
2) Break below ~83–83.5k (where puts thicken) → the pin shifts and the call-heavy bias weighs less
And you, are you trading the pin toward 84.5k or a breakdown below 83.5k before expiry?
$BTC $ETH
#Bitcoin #Options #Crypto
55

·
--
The perp market tells you what the crowd is doing. The options market tells you what institutions are afraid of.
Funding rates and open interest show positioning. Options show priced fear. Three numbers matter:
Implied volatility is the price of insurance. When IV runs hot relative to realized volatility, someone is paying up for protection — and insurance buyers often know something positioning data hasn't shown yet.
Skew shows which tail they fear. Puts rich relative to calls = institutional demand for downside protection. Calls rich = speculative upside chase, usually late-cycle, usually retail-flavored.
Term structure shows when. Short-dated IV spiking while long-dated stays calm = event anxiety. A flat curve that quietly inverts is where the market reprices risk before the headline arrives.
$BTC and $ETH now have options markets deep enough to read as sentiment instruments, not curiosities. $SOL options remain thin — which is itself information: thin options markets make hedging expensive, so forced flows spill directly into spot.
Options don't predict direction. They reveal where hedging demand concentrates — and hedging demand is the most honest signal in crypto, because it's the only one paid for with premium rather than narrative.
#Bitcoin #Ethereum #Crypto #Options #MarketStructure
The perp market tells you what the crowd is doing. The options market tells you what institutions are afraid of.
Funding rates and open interest show positioning. Options show priced fear. Three numbers matter:
Implied volatility is the price of insurance. When IV runs hot relative to realized volatility, someone is paying up for protection — and insurance buyers often know something positioning data hasn't shown yet.
Skew shows which tail they fear. Puts rich relative to calls = institutional demand for downside protection. Calls rich = speculative upside chase, usually late-cycle, usually retail-flavored.
Term structure shows when. Short-dated IV spiking while long-dated stays calm = event anxiety. A flat curve that quietly inverts is where the market reprices risk before the headline arrives.
$BTC and $ETH now have options markets deep enough to read as sentiment instruments, not curiosities. $SOL options remain thin — which is itself information: thin options markets make hedging expensive, so forced flows spill directly into spot.
Options don't predict direction. They reveal where hedging demand concentrates — and hedging demand is the most honest signal in crypto, because it's the only one paid for with premium rather than narrative.
#Bitcoin #Ethereum #Crypto #Options #MarketStructure
Funding rates and open interest show positioning. Options show priced fear. Three numbers matter:
Implied volatility is the price of insurance. When IV runs hot relative to realized volatility, someone is paying up for protection — and insurance buyers often know something positioning data hasn't shown yet.
Skew shows which tail they fear. Puts rich relative to calls = institutional demand for downside protection. Calls rich = speculative upside chase, usually late-cycle, usually retail-flavored.
Term structure shows when. Short-dated IV spiking while long-dated stays calm = event anxiety. A flat curve that quietly inverts is where the market reprices risk before the headline arrives.
$BTC and $ETH now have options markets deep enough to read as sentiment instruments, not curiosities. $SOL options remain thin — which is itself information: thin options markets make hedging expensive, so forced flows spill directly into spot.
Options don't predict direction. They reveal where hedging demand concentrates — and hedging demand is the most honest signal in crypto, because it's the only one paid for with premium rather than narrative.
#Bitcoin #Ethereum #Crypto #Options #MarketStructure
122

·
--
A $90K,$100K call wall with $BTC sitting in the mid-$80Ks looks like the market is already positioning for a big move higher, but that is usually a misread.
Traders keep treating these walls as guaranteed magnets and jump in too early. That is how they get stuck in underwater longs when the expected squeeze never shows up.
A call wall is simply a large cluster of call open interest at those strikes. Dealers who sold the calls would have to buy $BTC to hedge if price got close, which can accelerate a rally. We are still $5K to $15K below $90K, so none of that forced buying is happening yet. The market has not priced in a move to those levels because the options remain too far out of the money. Similar distant walls have failed before when $ETH options stayed quiet and $SOL flows never confirmed, turning the cluster into overhead supply instead of fuel.
What's your take on whether this $BTC wall actually pulls price or just sits there unused?
#Bitcoin #Options #Crypto
A $90K,$100K call wall with $BTC sitting in the mid-$80Ks looks like the market is already positioning for a big move higher, but that is usually a misread.
Traders keep treating these walls as guaranteed magnets and jump in too early. That is how they get stuck in underwater longs when the expected squeeze never shows up.
A call wall is simply a large cluster of call open interest at those strikes. Dealers who sold the calls would have to buy $BTC to hedge if price got close, which can accelerate a rally. We are still $5K to $15K below $90K, so none of that forced buying is happening yet. The market has not priced in a move to those levels because the options remain too far out of the money. Similar distant walls have failed before when $ETH options stayed quiet and $SOL flows never confirmed, turning the cluster into overhead supply instead of fuel.
What's your take on whether this $BTC wall actually pulls price or just sits there unused?
#Bitcoin #Options #Crypto
Traders keep treating these walls as guaranteed magnets and jump in too early. That is how they get stuck in underwater longs when the expected squeeze never shows up.
A call wall is simply a large cluster of call open interest at those strikes. Dealers who sold the calls would have to buy $BTC to hedge if price got close, which can accelerate a rally. We are still $5K to $15K below $90K, so none of that forced buying is happening yet. The market has not priced in a move to those levels because the options remain too far out of the money. Similar distant walls have failed before when $ETH options stayed quiet and $SOL flows never confirmed, turning the cluster into overhead supply instead of fuel.
What's your take on whether this $BTC wall actually pulls price or just sits there unused?
#Bitcoin #Options #Crypto
25

#options
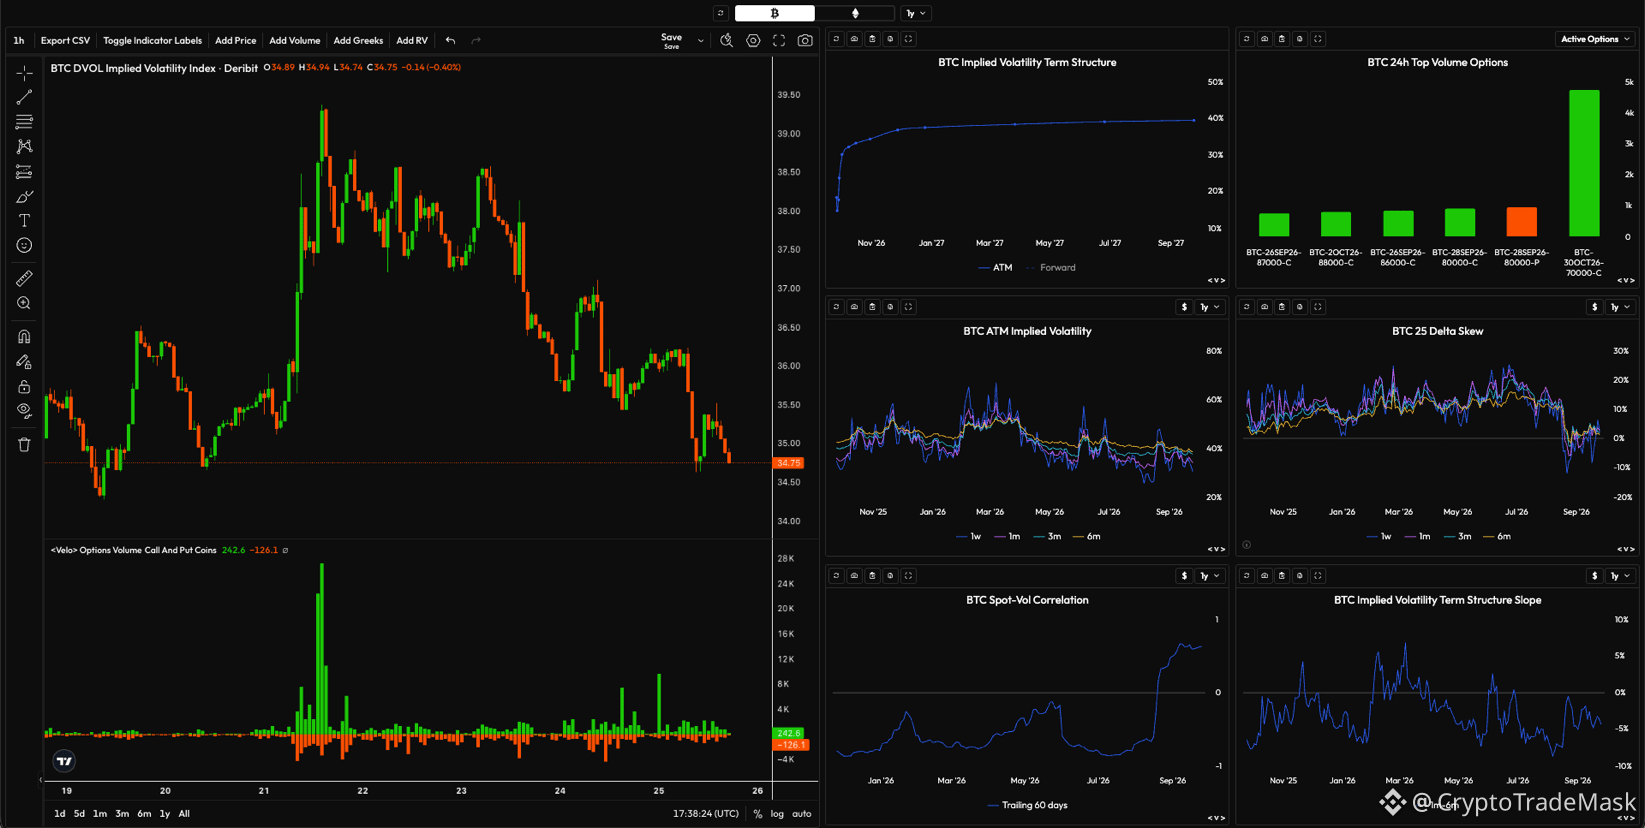
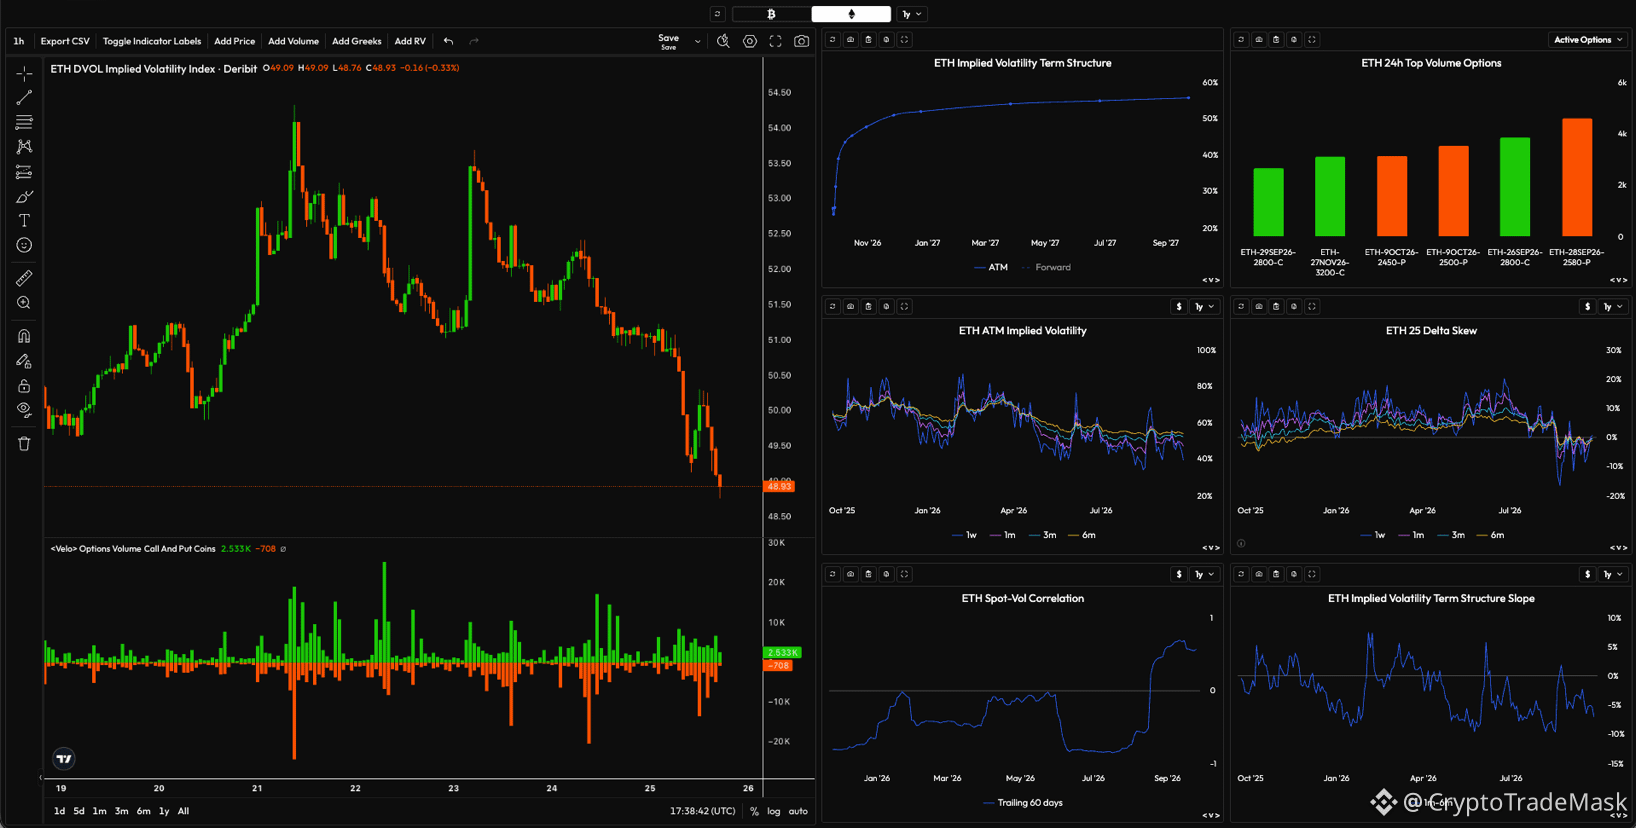
🚀 #ETH vs. #BTC : What do the options and volatility markets say?
A fascinating divergence in sentiment between the two major assets is currently taking shape in the crypto options market. Let’s break down the key metrics from the Deribit and Velo dashboards:
{future}(ETHUSDT)
📊 #Ethereum ($ETH ) — Downside protection and caution
Volatility Index (DVOL): Currently at 48.98 after dropping from local peaks. The decline in DVOL during the correction indicates a local easing of panic, though the market remains tense.
Option Volumes (24h Top Volume): A distinct skew toward Put options—the highest volumes are concentrated at the 2500-P and 2400-P strikes. Major players have ramped up risk hedging or are preparing for a retest of the $2,400–$2,500 support levels.
Delta Skew & Spot-Vol Correlation: Negative skew and high positive correlation (~0.8) confirm a premium for downside protection.
{future}(BTCUSDT)
⚡ #bitcoin ($BTC ) — Quietly gearing up for a bullish reversal
Volatility Index (DVOL): Remains low—around 34.75—indicating consolidation and a buildup of strength.
Option Volumes (24h Top Volume): Call options dominate! A notable surge in volume is evident at strikes of $70,000 and above (reaching as high as $80,000–$87,000). Term Structure: Distinct contango (rising from 35% to over 40%) signals expectations of strong momentum over a longer time horizon.
🎯 Conclusion and Summary:
1. ETH is showing signs of local weakness, and the market is bracing for a potential dip to the $2,400–$2,500 range before a bottom is established.
2. BTC is in a much stronger position: institutional players are actively buying call options, anticipating an upward breakout from the current sideways range.
3. Overall Outlook: A lull in volatility (DVOL) for both assets typically precedes a powerful trending move.
#options
🚀 #ETH vs. #BTC : What do the options and volatility markets say?
A fascinating divergence in sentiment between the two major assets is currently taking shape in the crypto options market. Let’s break down the key metrics from the Deribit and Velo dashboards:
📊 #Ethereum ($ETH ) — Downside protection and caution
Volatility Index (DVOL): Currently at 48.98 after dropping from local peaks. The decline in DVOL during the correction indicates a local easing of panic, though the market remains tense.
Option Volumes (24h Top Volume): A distinct skew toward Put options—the highest volumes are concentrated at the 2500-P and 2400-P strikes. Major players have ramped up risk hedging or are preparing for a retest of the $2,400–$2,500 support levels.
Delta Skew & Spot-Vol Correlation: Negative skew and high positive correlation (~0.8) confirm a premium for downside protection.
⚡ #bitcoin ($BTC ) — Quietly gearing up for a bullish reversal
Volatility Index (DVOL): Remains low—around 34.75—indicating consolidation and a buildup of strength.
Option Volumes (24h Top Volume): Call options dominate! A notable surge in volume is evident at strikes of $70,000 and above (reaching as high as $80,000–$87,000). Term Structure: Distinct contango (rising from 35% to over 40%) signals expectations of strong momentum over a longer time horizon.
🎯 Conclusion and Summary:
1. ETH is showing signs of local weakness, and the market is bracing for a potential dip to the $2,400–$2,500 range before a bottom is established.
2. BTC is in a much stronger position: institutional players are actively buying call options, anticipating an upward breakout from the current sideways range.
3. Overall Outlook: A lull in volatility (DVOL) for both assets typically precedes a powerful trending move.
🚀 #ETH vs. #BTC : What do the options and volatility markets say?
A fascinating divergence in sentiment between the two major assets is currently taking shape in the crypto options market. Let’s break down the key metrics from the Deribit and Velo dashboards:
📊 #Ethereum ($ETH ) — Downside protection and caution
Volatility Index (DVOL): Currently at 48.98 after dropping from local peaks. The decline in DVOL during the correction indicates a local easing of panic, though the market remains tense.
Option Volumes (24h Top Volume): A distinct skew toward Put options—the highest volumes are concentrated at the 2500-P and 2400-P strikes. Major players have ramped up risk hedging or are preparing for a retest of the $2,400–$2,500 support levels.
Delta Skew & Spot-Vol Correlation: Negative skew and high positive correlation (~0.8) confirm a premium for downside protection.
⚡ #bitcoin ($BTC ) — Quietly gearing up for a bullish reversal
Volatility Index (DVOL): Remains low—around 34.75—indicating consolidation and a buildup of strength.
Option Volumes (24h Top Volume): Call options dominate! A notable surge in volume is evident at strikes of $70,000 and above (reaching as high as $80,000–$87,000). Term Structure: Distinct contango (rising from 35% to over 40%) signals expectations of strong momentum over a longer time horizon.
🎯 Conclusion and Summary:
1. ETH is showing signs of local weakness, and the market is bracing for a potential dip to the $2,400–$2,500 range before a bottom is established.
2. BTC is in a much stronger position: institutional players are actively buying call options, anticipating an upward breakout from the current sideways range.
3. Overall Outlook: A lull in volatility (DVOL) for both assets typically precedes a powerful trending move.
2
86

·
--
Bearish
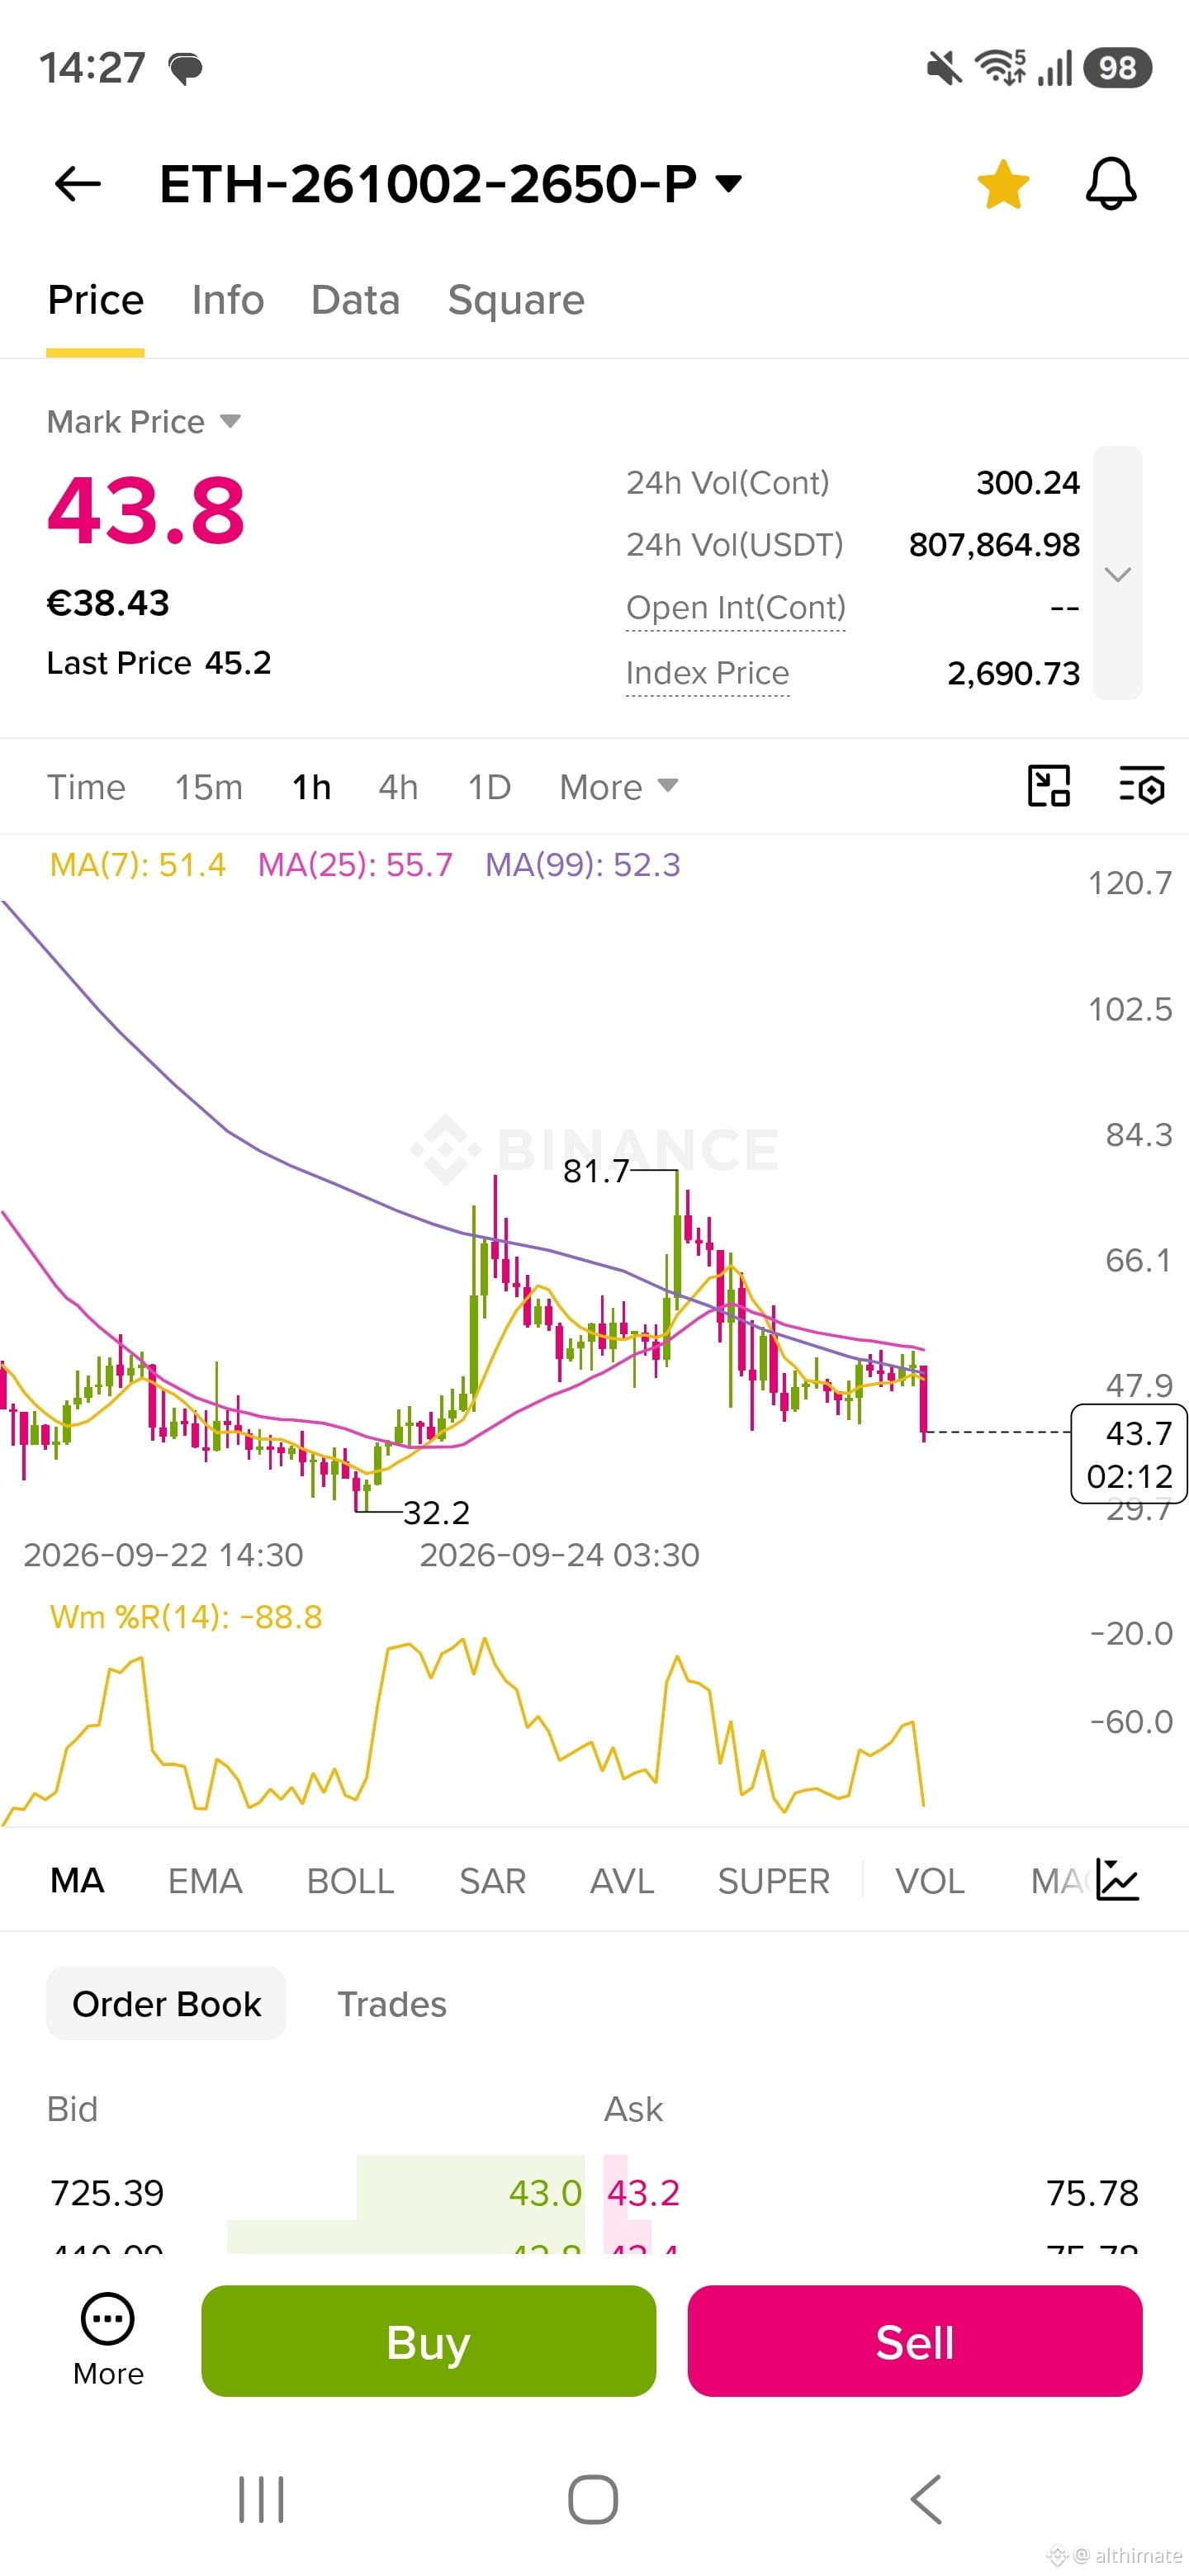
🚀 ETH 26.10.02 $2,650 PUT OPTION
🟢 Buy Zone: 35 – 40
🛑 Stop-Loss: 10
🎯 Targets:
T1: 75
T2: 100
T3: 150
the cmp is 43 #options $ETH
🚀 ETH 26.10.02 $2,650 PUT OPTION
🟢 Buy Zone: 35 – 40
🛑 Stop-Loss: 10
🎯 Targets:
T1: 75
T2: 100
T3: 150
the cmp is 43 #options $ETH
🟢 Buy Zone: 35 – 40
🛑 Stop-Loss: 10
🎯 Targets:
T1: 75
T2: 100
T3: 150
the cmp is 43 #options $ETH
1
70

·
--
⏳ Options nearing expiry worth $15.6 billion, $BTC stalls
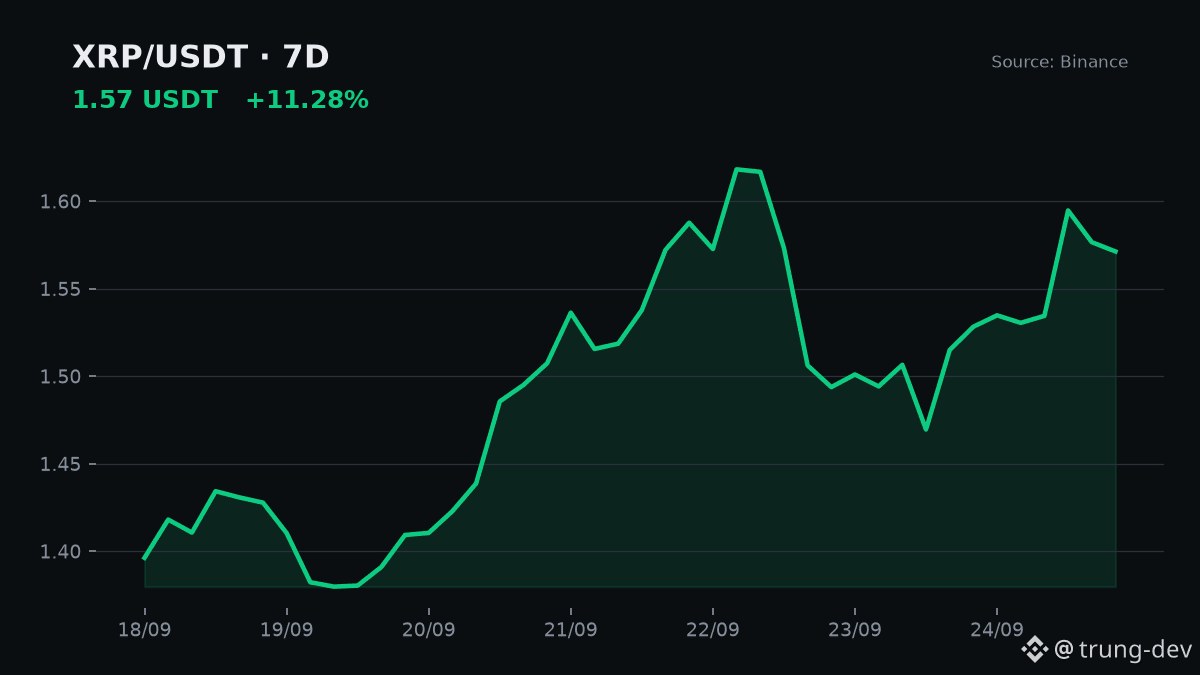
According to Decrypt, the uptrend of $BTC slowed down right around the time approximately $15.6 billion worth of expiring options contracts were due. On Binance, $BTC is hovering around 83.922 USDT, down 0.89% over 24 hours. In contrast, $XRP is up 2.81% to 1.5713 USDT, and $SOL is up 3.42% to 121.45 USDT.
Why should traders pay attention? Large expiry sessions often cause prices to swing sharply around strike levels with many open contracts. A pause during the expiry day is not enough to conclude that the trend has reversed. Usually, you need to wait for a few more sessions, when hedged positions are unwound, before the price shows its true direction.
Another notable point is that capital appears to be rotating into altcoins. $XRP has gained 11.28% over the past 7 days, trading in the range of 1.368 to 1.6581 USDT. The Fear & Greed Index is at 71, in the Greed zone (alternative.me). When sentiment tilts toward greed, the risk of chasing green candles is higher.
My takeaway: option expiry day is a day to reduce leverage and observe more than act. The volatility right now is largely driven by derivatives positions, not necessarily by genuine demand.
Source: Decrypt
Do you think this stall in $BTC is just a breather or a sign of reversal? 🤔
#Bitcoin #Options #Altcoin
⏳ Options nearing expiry worth $15.6 billion, $BTC stalls
According to Decrypt, the uptrend of $BTC slowed down right around the time approximately $15.6 billion worth of expiring options contracts were due. On Binance, $BTC is hovering around 83.922 USDT, down 0.89% over 24 hours. In contrast, $XRP is up 2.81% to 1.5713 USDT, and $SOL is up 3.42% to 121.45 USDT.
Why should traders pay attention? Large expiry sessions often cause prices to swing sharply around strike levels with many open contracts. A pause during the expiry day is not enough to conclude that the trend has reversed. Usually, you need to wait for a few more sessions, when hedged positions are unwound, before the price shows its true direction.
Another notable point is that capital appears to be rotating into altcoins. $XRP has gained 11.28% over the past 7 days, trading in the range of 1.368 to 1.6581 USDT. The Fear & Greed Index is at 71, in the Greed zone (alternative.me). When sentiment tilts toward greed, the risk of chasing green candles is higher.
My takeaway: option expiry day is a day to reduce leverage and observe more than act. The volatility right now is largely driven by derivatives positions, not necessarily by genuine demand.
Source: Decrypt
Do you think this stall in $BTC is just a breather or a sign of reversal? 🤔
#Bitcoin #Options #Altcoin
According to Decrypt, the uptrend of $BTC slowed down right around the time approximately $15.6 billion worth of expiring options contracts were due. On Binance, $BTC is hovering around 83.922 USDT, down 0.89% over 24 hours. In contrast, $XRP is up 2.81% to 1.5713 USDT, and $SOL is up 3.42% to 121.45 USDT.
Why should traders pay attention? Large expiry sessions often cause prices to swing sharply around strike levels with many open contracts. A pause during the expiry day is not enough to conclude that the trend has reversed. Usually, you need to wait for a few more sessions, when hedged positions are unwound, before the price shows its true direction.
Another notable point is that capital appears to be rotating into altcoins. $XRP has gained 11.28% over the past 7 days, trading in the range of 1.368 to 1.6581 USDT. The Fear & Greed Index is at 71, in the Greed zone (alternative.me). When sentiment tilts toward greed, the risk of chasing green candles is higher.
My takeaway: option expiry day is a day to reduce leverage and observe more than act. The volatility right now is largely driven by derivatives positions, not necessarily by genuine demand.
Source: Decrypt
Do you think this stall in $BTC is just a breather or a sign of reversal? 🤔
#Bitcoin #Options #Altcoin
459

·
--
If you are panic-selling every time derivatives data looks scary, stop now.
Most retail investors get chopped up and dump their bags right before major market rebounds because they misread open interest. They see massive numbers, expect an immediate crash, and end up selling at the exact local bottom.
This Friday brings a massive 18 billion dollar options expiry across major exchanges. Bearish traders are screaming that $BTC is bound to drop 10k to hit max pain levels. The sheer scale of expiring contracts makes people nervous, and when fear takes over, panic selling usually follows.
However, historical expiry events tell a completely different story. Max pain levels rarely trigger a straight plunge, especially with strong spot demand absorbing sell pressure while institutions hedge through $ETH contracts. The market has already absorbed most of this hedging volatility over the past two weeks, making a sharp post-settlement rebound far more likely than a collapse.
Do you think Friday triggers a real dump, or is the market setting up to squeeze the bears?
#Bitcoin #CryptoTrading #Options
If you are panic-selling every time derivatives data looks scary, stop now.
Most retail investors get chopped up and dump their bags right before major market rebounds because they misread open interest. They see massive numbers, expect an immediate crash, and end up selling at the exact local bottom.
This Friday brings a massive 18 billion dollar options expiry across major exchanges. Bearish traders are screaming that $BTC is bound to drop 10k to hit max pain levels. The sheer scale of expiring contracts makes people nervous, and when fear takes over, panic selling usually follows.
However, historical expiry events tell a completely different story. Max pain levels rarely trigger a straight plunge, especially with strong spot demand absorbing sell pressure while institutions hedge through $ETH contracts. The market has already absorbed most of this hedging volatility over the past two weeks, making a sharp post-settlement rebound far more likely than a collapse.
Do you think Friday triggers a real dump, or is the market setting up to squeeze the bears?
#Bitcoin #CryptoTrading #Options
Most retail investors get chopped up and dump their bags right before major market rebounds because they misread open interest. They see massive numbers, expect an immediate crash, and end up selling at the exact local bottom.
This Friday brings a massive 18 billion dollar options expiry across major exchanges. Bearish traders are screaming that $BTC is bound to drop 10k to hit max pain levels. The sheer scale of expiring contracts makes people nervous, and when fear takes over, panic selling usually follows.
However, historical expiry events tell a completely different story. Max pain levels rarely trigger a straight plunge, especially with strong spot demand absorbing sell pressure while institutions hedge through $ETH contracts. The market has already absorbed most of this hedging volatility over the past two weeks, making a sharp post-settlement rebound far more likely than a collapse.
Do you think Friday triggers a real dump, or is the market setting up to squeeze the bears?
#Bitcoin #CryptoTrading #Options
29

·
--
one thing i wish i understood earlier about options is that they’re not just about guessing whether price goes up or down.
there are a few things that actually shape the trade:
the strike price.
the expiry.
the premium.
those details matter because an option isn’t simply “buy and wait.”
there’s a defined setup and a defined outcome.
learning these basics has honestly made options feel less complicated to me.
and now when i look at protocols like Ithaca, i’m not just seeing “another DeFi product.”
i’m starting to understand the financial mechanics behind what’s being built.
still learning, one concept at a time.
#Ithaca #defi #options #Web3
one thing i wish i understood earlier about options is that they’re not just about guessing whether price goes up or down.
there are a few things that actually shape the trade:
the strike price.
the expiry.
the premium.
those details matter because an option isn’t simply “buy and wait.”
there’s a defined setup and a defined outcome.
learning these basics has honestly made options feel less complicated to me.
and now when i look at protocols like Ithaca, i’m not just seeing “another DeFi product.”
i’m starting to understand the financial mechanics behind what’s being built.
still learning, one concept at a time.
#Ithaca #defi #options #Web3
there are a few things that actually shape the trade:
the strike price.
the expiry.
the premium.
those details matter because an option isn’t simply “buy and wait.”
there’s a defined setup and a defined outcome.
learning these basics has honestly made options feel less complicated to me.
and now when i look at protocols like Ithaca, i’m not just seeing “another DeFi product.”
i’m starting to understand the financial mechanics behind what’s being built.
still learning, one concept at a time.
#Ithaca #defi #options #Web3

83

·
--
🚨 $BTC HAS A BIG DATE AHEAD AND IT’S NOT JUST ANOTHER PRICE LEVEL
Bitcoin is holding around the $86K area while traders head into Friday’s quarterly options expiry.
Coinbase Markets puts the BTC + ETH options notional scheduled for Sept. 25 at roughly $18.1B.
Here’s the part I’m watching:
BTC options have a 0.66 open-interest put/call ratio, while recent 24-hour volume is even more call-heavy at 0.37.
Call open interest is concentrated around $90K and $100K.
But don’t confuse positioning with a prediction.
Large call interest does NOT mean BTC has to reach those strikes.
It simply means the expiry could become an important volatility and hedging event as traders adjust positions.
📊 MY WATCH ZONES
🟢 $85K → first area I want bulls to defend
🟡 $86K–$87K → current decision zone
🔴 $90K → major options-interest area
The setup is straightforward:
Hold the recent breakout structure → momentum stays constructive.
Lose the $85K area → the market may need to reset before another attempt higher.
Friday’s expiry is the catalyst.
Price action decides the reaction.
Are you watching the $90K calls or the $85K level underneath spot? 👀
Follow QuantVanta for daily crypto market intelligence.
$BTC
{future}(BTCUSDT)
#bitcoin #BTC #crypto #options #CryptoMarketAlert
🚨 $BTC HAS A BIG DATE AHEAD AND IT’S NOT JUST ANOTHER PRICE LEVEL
Bitcoin is holding around the $86K area while traders head into Friday’s quarterly options expiry.
Coinbase Markets puts the BTC + ETH options notional scheduled for Sept. 25 at roughly $18.1B.
Here’s the part I’m watching:
BTC options have a 0.66 open-interest put/call ratio, while recent 24-hour volume is even more call-heavy at 0.37.
Call open interest is concentrated around $90K and $100K.
But don’t confuse positioning with a prediction.
Large call interest does NOT mean BTC has to reach those strikes.
It simply means the expiry could become an important volatility and hedging event as traders adjust positions.
📊 MY WATCH ZONES
🟢 $85K → first area I want bulls to defend
🟡 $86K–$87K → current decision zone
🔴 $90K → major options-interest area
The setup is straightforward:
Hold the recent breakout structure → momentum stays constructive.
Lose the $85K area → the market may need to reset before another attempt higher.
Friday’s expiry is the catalyst.
Price action decides the reaction.
Are you watching the $90K calls or the $85K level underneath spot? 👀
Follow QuantVanta for daily crypto market intelligence.
$BTC
#bitcoin #BTC #crypto #options #CryptoMarketAlert
Bitcoin is holding around the $86K area while traders head into Friday’s quarterly options expiry.
Coinbase Markets puts the BTC + ETH options notional scheduled for Sept. 25 at roughly $18.1B.
Here’s the part I’m watching:
BTC options have a 0.66 open-interest put/call ratio, while recent 24-hour volume is even more call-heavy at 0.37.
Call open interest is concentrated around $90K and $100K.
But don’t confuse positioning with a prediction.
Large call interest does NOT mean BTC has to reach those strikes.
It simply means the expiry could become an important volatility and hedging event as traders adjust positions.
📊 MY WATCH ZONES
🟢 $85K → first area I want bulls to defend
🟡 $86K–$87K → current decision zone
🔴 $90K → major options-interest area
The setup is straightforward:
Hold the recent breakout structure → momentum stays constructive.
Lose the $85K area → the market may need to reset before another attempt higher.
Friday’s expiry is the catalyst.
Price action decides the reaction.
Are you watching the $90K calls or the $85K level underneath spot? 👀
Follow QuantVanta for daily crypto market intelligence.
$BTC
#bitcoin #BTC #crypto #options #CryptoMarketAlert

62

A hefty $3.2M options trade just targeted a bold $95K Bitcoin price by the end of October. Using a butterfly spread shows the trader expects a specific, controlled rally rather than wild volatility. While daring, it highlights growing institutional confidence in Q4 momentum. Are whales positioning for an early autumn breakout, or is this just an expensive gamble? Keep a close eye on the order books as September wraps up. $BTC #Bitcoin #CryptoTrading #Options
A hefty $3.2M options trade just targeted a bold $95K Bitcoin price by the end of October. Using a butterfly spread shows the trader expects a specific, controlled rally rather than wild volatility. While daring, it highlights growing institutional confidence in Q4 momentum. Are whales positioning for an early autumn breakout, or is this just an expensive gamble? Keep a close eye on the order books as September wraps up. $BTC #Bitcoin #CryptoTrading #Options
15

Why is Bitcoin rising? The answer is in the options market.Why is Bitcoin rising? The answer is in the options market.
In my last analysis, I said there'd be no resistance up to 85k if 82k was broken.
82k was broken, and the price climbed all the way to 85,300 dollars.
Bitcoin is now at 85,000 dollars, right at the 85k wall.
There were no chasers for the rise, but the price jumped 3,000 dollars.
Why?
The options market paved the way, and the shorts opened below 82k provided the speed.
Why is the price stuck between 84 and 85? That's also written on the same chart.
Now, look at who's driving the rise.
82k couldn't be broken over the weekend, but it was broken this morning.
Liquidated shorts have exceeded 500 million dollars.
Small accounts had opened shorts against the rise, and the rally forced those shorts to close.
Most of this rise came from those closed shorts.
Today's chart has changed.
Up top: 85,000 dollars.
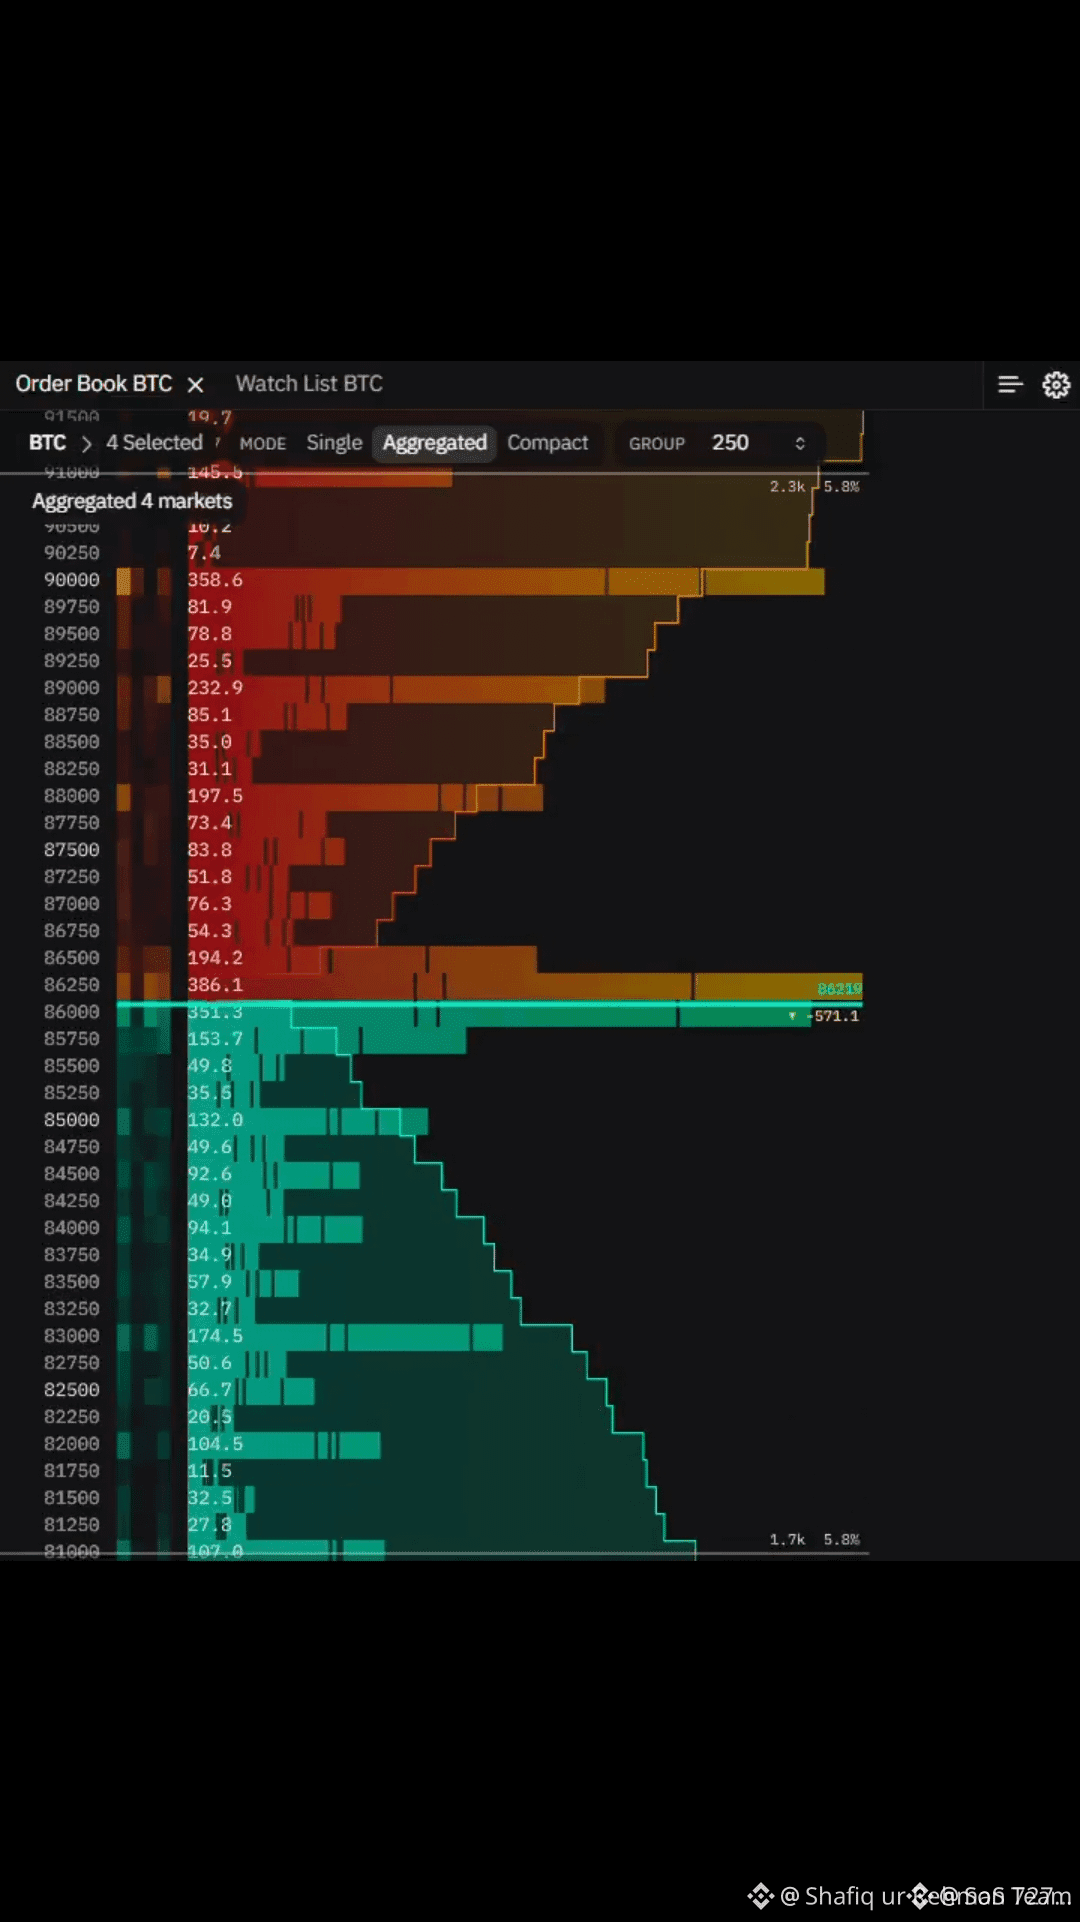
Every 1% rise brings 122 million dollars in sells, around 1,450 Bitcoin.
In the previous chart, this seller was second with 100 million; when price arrived, it became first.
The price turned back from here.
Down below: 84,000 dollars.
Every 1% drop brings about 120 million dollars in buys, around 1,420 Bitcoin.
There was a seller here this morning.
Once price broke through, the level flipped to the buy side, and buys nearly doubled.
The two walls are almost the same size.
Seller up top, buyer down below.
That's why price is stuck between 84 and 85.
The distance between them is 1,000 dollars.
Behind 84, there's 67 million in buys at 83, and 78 million at 82.
82k was a 135 million sell wall in the previous chart; that flipped to the buy side too.
The real base is at 80k.
Every drop above 80 is met with buys.
Below 80, those buys aren't there; nothing to slow the drop.
Net dealer position is plus 710 million dollars, previously 634 million.
Dealers are softening every move.
Look above 85.
At 86, sells drop to 51 million, less than half of the sells at 85.
At 88, there's a 73 million seller; at 90, 61 million.
87 and 89 are nearly empty.
No big sellers above 90.
So the threshold is still 85.
September 25 is Friday's expiration day.
Over 16 billion dollars in contracts expire that day.
This expiration's biggest contracts are at 85k and 90k levels.
On Friday, both the walls and the base thin out.
So what could happen now?
If 85 is broken, the first seller halves.
Small accounts are still short; closed shorts will accelerate the move.
Up above, there are two levels: 88 and 90.
If price drops, the first buy is at 84, with 83 and 82 behind it.
If 82 breaks, the next level is 80.
Just like 85 if broken like 82, the next wall is 88.
This analysis is my opinion, not investment advice.
Data changes in real time. I'll keep updating.
#Bitcoin #BTC #Options
Why is Bitcoin rising? The answer is in the options market.
Why is Bitcoin rising? The answer is in the options market.
In my last analysis, I said there'd be no resistance up to 85k if 82k was broken.
82k was broken, and the price climbed all the way to 85,300 dollars.
Bitcoin is now at 85,000 dollars, right at the 85k wall.
There were no chasers for the rise, but the price jumped 3,000 dollars.
Why?
The options market paved the way, and the shorts opened below 82k provided the speed.
Why is the price stuck between 84 and 85? That's also written on the same chart.
Now, look at who's driving the rise.
82k couldn't be broken over the weekend, but it was broken this morning.
Liquidated shorts have exceeded 500 million dollars.
Small accounts had opened shorts against the rise, and the rally forced those shorts to close.
Most of this rise came from those closed shorts.
Today's chart has changed.
Up top: 85,000 dollars.
Every 1% rise brings 122 million dollars in sells, around 1,450 Bitcoin.
In the previous chart, this seller was second with 100 million; when price arrived, it became first.
The price turned back from here.
Down below: 84,000 dollars.
Every 1% drop brings about 120 million dollars in buys, around 1,420 Bitcoin.
There was a seller here this morning.
Once price broke through, the level flipped to the buy side, and buys nearly doubled.
The two walls are almost the same size.
Seller up top, buyer down below.
That's why price is stuck between 84 and 85.
The distance between them is 1,000 dollars.
Behind 84, there's 67 million in buys at 83, and 78 million at 82.
82k was a 135 million sell wall in the previous chart; that flipped to the buy side too.
The real base is at 80k.
Every drop above 80 is met with buys.
Below 80, those buys aren't there; nothing to slow the drop.
Net dealer position is plus 710 million dollars, previously 634 million.
Dealers are softening every move.
Look above 85.
At 86, sells drop to 51 million, less than half of the sells at 85.
At 88, there's a 73 million seller; at 90, 61 million.
87 and 89 are nearly empty.
No big sellers above 90.
So the threshold is still 85.
September 25 is Friday's expiration day.
Over 16 billion dollars in contracts expire that day.
This expiration's biggest contracts are at 85k and 90k levels.
On Friday, both the walls and the base thin out.
So what could happen now?
If 85 is broken, the first seller halves.
Small accounts are still short; closed shorts will accelerate the move.
Up above, there are two levels: 88 and 90.
If price drops, the first buy is at 84, with 83 and 82 behind it.
If 82 breaks, the next level is 80.
Just like 85 if broken like 82, the next wall is 88.
This analysis is my opinion, not investment advice.
Data changes in real time. I'll keep updating.
#Bitcoin #BTC #Options
In my last analysis, I said there'd be no resistance up to 85k if 82k was broken.
82k was broken, and the price climbed all the way to 85,300 dollars.
Bitcoin is now at 85,000 dollars, right at the 85k wall.
There were no chasers for the rise, but the price jumped 3,000 dollars.
Why?
The options market paved the way, and the shorts opened below 82k provided the speed.
Why is the price stuck between 84 and 85? That's also written on the same chart.
Now, look at who's driving the rise.
82k couldn't be broken over the weekend, but it was broken this morning.
Liquidated shorts have exceeded 500 million dollars.
Small accounts had opened shorts against the rise, and the rally forced those shorts to close.
Most of this rise came from those closed shorts.
Today's chart has changed.
Up top: 85,000 dollars.
Every 1% rise brings 122 million dollars in sells, around 1,450 Bitcoin.
In the previous chart, this seller was second with 100 million; when price arrived, it became first.
The price turned back from here.
Down below: 84,000 dollars.
Every 1% drop brings about 120 million dollars in buys, around 1,420 Bitcoin.
There was a seller here this morning.
Once price broke through, the level flipped to the buy side, and buys nearly doubled.
The two walls are almost the same size.
Seller up top, buyer down below.
That's why price is stuck between 84 and 85.
The distance between them is 1,000 dollars.
Behind 84, there's 67 million in buys at 83, and 78 million at 82.
82k was a 135 million sell wall in the previous chart; that flipped to the buy side too.
The real base is at 80k.
Every drop above 80 is met with buys.
Below 80, those buys aren't there; nothing to slow the drop.
Net dealer position is plus 710 million dollars, previously 634 million.
Dealers are softening every move.
Look above 85.
At 86, sells drop to 51 million, less than half of the sells at 85.
At 88, there's a 73 million seller; at 90, 61 million.
87 and 89 are nearly empty.
No big sellers above 90.
So the threshold is still 85.
September 25 is Friday's expiration day.
Over 16 billion dollars in contracts expire that day.
This expiration's biggest contracts are at 85k and 90k levels.
On Friday, both the walls and the base thin out.
So what could happen now?
If 85 is broken, the first seller halves.
Small accounts are still short; closed shorts will accelerate the move.
Up above, there are two levels: 88 and 90.
If price drops, the first buy is at 84, with 83 and 82 behind it.
If 82 breaks, the next level is 80.
Just like 85 if broken like 82, the next wall is 88.
This analysis is my opinion, not investment advice.
Data changes in real time. I'll keep updating.
#Bitcoin #BTC #Options
26
·
--
One thing i’ve realized while learning about options is that the hardest part isn’t always the product itself.
sometimes, it’s understanding why you would use it.
an option can give you another way to approach a market without simply buying or selling the underlying asset.
that changes the way you think about a position.
instead of only asking:
“where is price going?”
you start asking:
“what outcome am i preparing for?”
that shift in thinking is what makes options interesting to me.
and seeing that kind of financial primitive being built onchain through Ithaca makes the rabbit hole even deeper.
i’m still learning, but i like when a protocol makes me rethink how i understand a familiar financial product.
#Ithaca #defi #options #Web3
One thing i’ve realized while learning about options is that the hardest part isn’t always the product itself.
sometimes, it’s understanding why you would use it.
an option can give you another way to approach a market without simply buying or selling the underlying asset.
that changes the way you think about a position.
instead of only asking:
“where is price going?”
you start asking:
“what outcome am i preparing for?”
that shift in thinking is what makes options interesting to me.
and seeing that kind of financial primitive being built onchain through Ithaca makes the rabbit hole even deeper.
i’m still learning, but i like when a protocol makes me rethink how i understand a familiar financial product.
#Ithaca #defi #options #Web3
sometimes, it’s understanding why you would use it.
an option can give you another way to approach a market without simply buying or selling the underlying asset.
that changes the way you think about a position.
instead of only asking:
“where is price going?”
you start asking:
“what outcome am i preparing for?”
that shift in thinking is what makes options interesting to me.
and seeing that kind of financial primitive being built onchain through Ithaca makes the rabbit hole even deeper.
i’m still learning, but i like when a protocol makes me rethink how i understand a familiar financial product.
#Ithaca #defi #options #Web3

62

·
--
🚨 SMART MONEY LOCKS IN $BTC RANGE BOUNDS WHILE BUILDING MULTI-MILLION SHORT HEDGE 🦈
Institutional order flow reveals high-conviction delta hedging as top-tier smart money plays the $70,000 to $95,000 range parameters for September. 📊 By stacking high-probability options betting against extreme volatility spikes while scaling perpetual short exposure to $26M, this participant creates a tight structural fence.
🔍 Historical execution data shows a 90% win-rate methodology leveraging structural compression rather than chasing directional momentum. 💡 While holding underwater paper shorts, the overarching strategy extracts premium from high-odds range limits, reinforcing an institutional bias toward macro consolidation before the next major expansion phase.
💬 Do you see $BTC respecting this $70K-$95K range through month-end, or will structural liquidity force a breakout? 👇
⚠️ Not financial advice. Always manage your risk. 🛡️
🏷️ #BTC #Options #SmartMoney #MarketStructure
🎯 🦈
🚨 SMART MONEY LOCKS IN $BTC RANGE BOUNDS WHILE BUILDING MULTI-MILLION SHORT HEDGE 🦈
Institutional order flow reveals high-conviction delta hedging as top-tier smart money plays the $70,000 to $95,000 range parameters for September. 📊 By stacking high-probability options betting against extreme volatility spikes while scaling perpetual short exposure to $26M, this participant creates a tight structural fence.
🔍 Historical execution data shows a 90% win-rate methodology leveraging structural compression rather than chasing directional momentum. 💡 While holding underwater paper shorts, the overarching strategy extracts premium from high-odds range limits, reinforcing an institutional bias toward macro consolidation before the next major expansion phase.
💬 Do you see $BTC respecting this $70K-$95K range through month-end, or will structural liquidity force a breakout? 👇
⚠️ Not financial advice. Always manage your risk. 🛡️
🏷️ #BTC #Options #SmartMoney #MarketStructure
🎯 🦈
Institutional order flow reveals high-conviction delta hedging as top-tier smart money plays the $70,000 to $95,000 range parameters for September. 📊 By stacking high-probability options betting against extreme volatility spikes while scaling perpetual short exposure to $26M, this participant creates a tight structural fence.
🔍 Historical execution data shows a 90% win-rate methodology leveraging structural compression rather than chasing directional momentum. 💡 While holding underwater paper shorts, the overarching strategy extracts premium from high-odds range limits, reinforcing an institutional bias toward macro consolidation before the next major expansion phase.
💬 Do you see $BTC respecting this $70K-$95K range through month-end, or will structural liquidity force a breakout? 👇
⚠️ Not financial advice. Always manage your risk. 🛡️
🏷️ #BTC #Options #SmartMoney #MarketStructure
🎯 🦈
24

·
--
EP.10 — STOCK OPTIONS IN 60 SECONDS
Stock Options can sound complicated.
The basic idea:
A Call gives the buyer the right to buy the underlying asset at a predetermined strike price before or at the specified expiration, depending on the contract.
A Put gives the buyer the right to sell it.
Binance launched Stock Options on U.S.-listed stocks and ETFs in September 2026, with physically settled contracts.
For option buyers, the maximum loss is limited to the premium paid.
But options are complex products, and their value can be affected by factors including the underlying price, strike price, time to expiration, and volatility.
They are not simply “another way to buy stocks.”
Availability varies by jurisdiction and eligibility.
Educational content only. Not financial advice.
#options
EP.10 — STOCK OPTIONS IN 60 SECONDS
Stock Options can sound complicated.
The basic idea:
A Call gives the buyer the right to buy the underlying asset at a predetermined strike price before or at the specified expiration, depending on the contract.
A Put gives the buyer the right to sell it.
Binance launched Stock Options on U.S.-listed stocks and ETFs in September 2026, with physically settled contracts.
For option buyers, the maximum loss is limited to the premium paid.
But options are complex products, and their value can be affected by factors including the underlying price, strike price, time to expiration, and volatility.
They are not simply “another way to buy stocks.”
Availability varies by jurisdiction and eligibility.
Educational content only. Not financial advice.
#options
Stock Options can sound complicated.
The basic idea:
A Call gives the buyer the right to buy the underlying asset at a predetermined strike price before or at the specified expiration, depending on the contract.
A Put gives the buyer the right to sell it.
Binance launched Stock Options on U.S.-listed stocks and ETFs in September 2026, with physically settled contracts.
For option buyers, the maximum loss is limited to the premium paid.
But options are complex products, and their value can be affected by factors including the underlying price, strike price, time to expiration, and volatility.
They are not simply “another way to buy stocks.”
Availability varies by jurisdiction and eligibility.
Educational content only. Not financial advice.
#options

2
17
·
--
for me, one of the interesting things about options is that you don’t always have to be right about the exact price.
sometimes the bigger question is:
what happens if the market moves the other way?
that’s where options start to make more sense to me.
instead of only thinking:
“price goes up, i win.”
you can start thinking about different scenarios and how you want to position around them.
that flexibility is a big reason i’ve been digging deeper into what Ithaca is building.
options onchain, with self-custody and composability at the core.
still learning the mechanics, but the idea itself is becoming clearer to me.
#Ithaca #defi #options #Web3
for me, one of the interesting things about options is that you don’t always have to be right about the exact price.
sometimes the bigger question is:
what happens if the market moves the other way?
that’s where options start to make more sense to me.
instead of only thinking:
“price goes up, i win.”
you can start thinking about different scenarios and how you want to position around them.
that flexibility is a big reason i’ve been digging deeper into what Ithaca is building.
options onchain, with self-custody and composability at the core.
still learning the mechanics, but the idea itself is becoming clearer to me.
#Ithaca #defi #options #Web3
sometimes the bigger question is:
what happens if the market moves the other way?
that’s where options start to make more sense to me.
instead of only thinking:
“price goes up, i win.”
you can start thinking about different scenarios and how you want to position around them.
that flexibility is a big reason i’ve been digging deeper into what Ithaca is building.
options onchain, with self-custody and composability at the core.
still learning the mechanics, but the idea itself is becoming clearer to me.
#Ithaca #defi #options #Web3

65
Log in to explore more content
Join global crypto users on Binance Square
⚡️ Get latest and useful information about crypto.
💬 Trusted by the world’s largest crypto exchange.
👍 Discover real insights from verified creators.
Email / Phone number
Trending Topics
1
#BitMineETHHoldingsTop6Million
13 views
15 Discussing
2
#StrategyAdds1666BTCHoldingsReach847666
65 views
15 Discussing
3
#NvidiaApproves$150BBuyback
1,662 views
41 Discussing
4
#OpenAIDelaysGPT6.1OverSafetyIssues
9,247 views
370 Discussing
5
#AMDToAcquireWorldLabsFor$8.2B
956 views
38 Discussing
6
#AnthropicIPOProspectusCouldValueItOver$2T
3,396 views
67 Discussing
7
#HackersDrainOver12.4MXRPFromDCENTWallets
22,681 views
499 Discussing
8
#SECSaysDecentralizedTokenBuybacksNotInvestmentContracts
1,961 views
36 Discussing
9
#UKFCAWinsCourtOrderToRecover851400Pounds
78,722 views
1,361 Discussing
10
#ChainlinkLaunchesCCIP2WithEnterpriseVerification
84,531 views
1,474 Discussing