
#nok
nok
71,072 views
386 Discussing
Hot
Latest


·
--
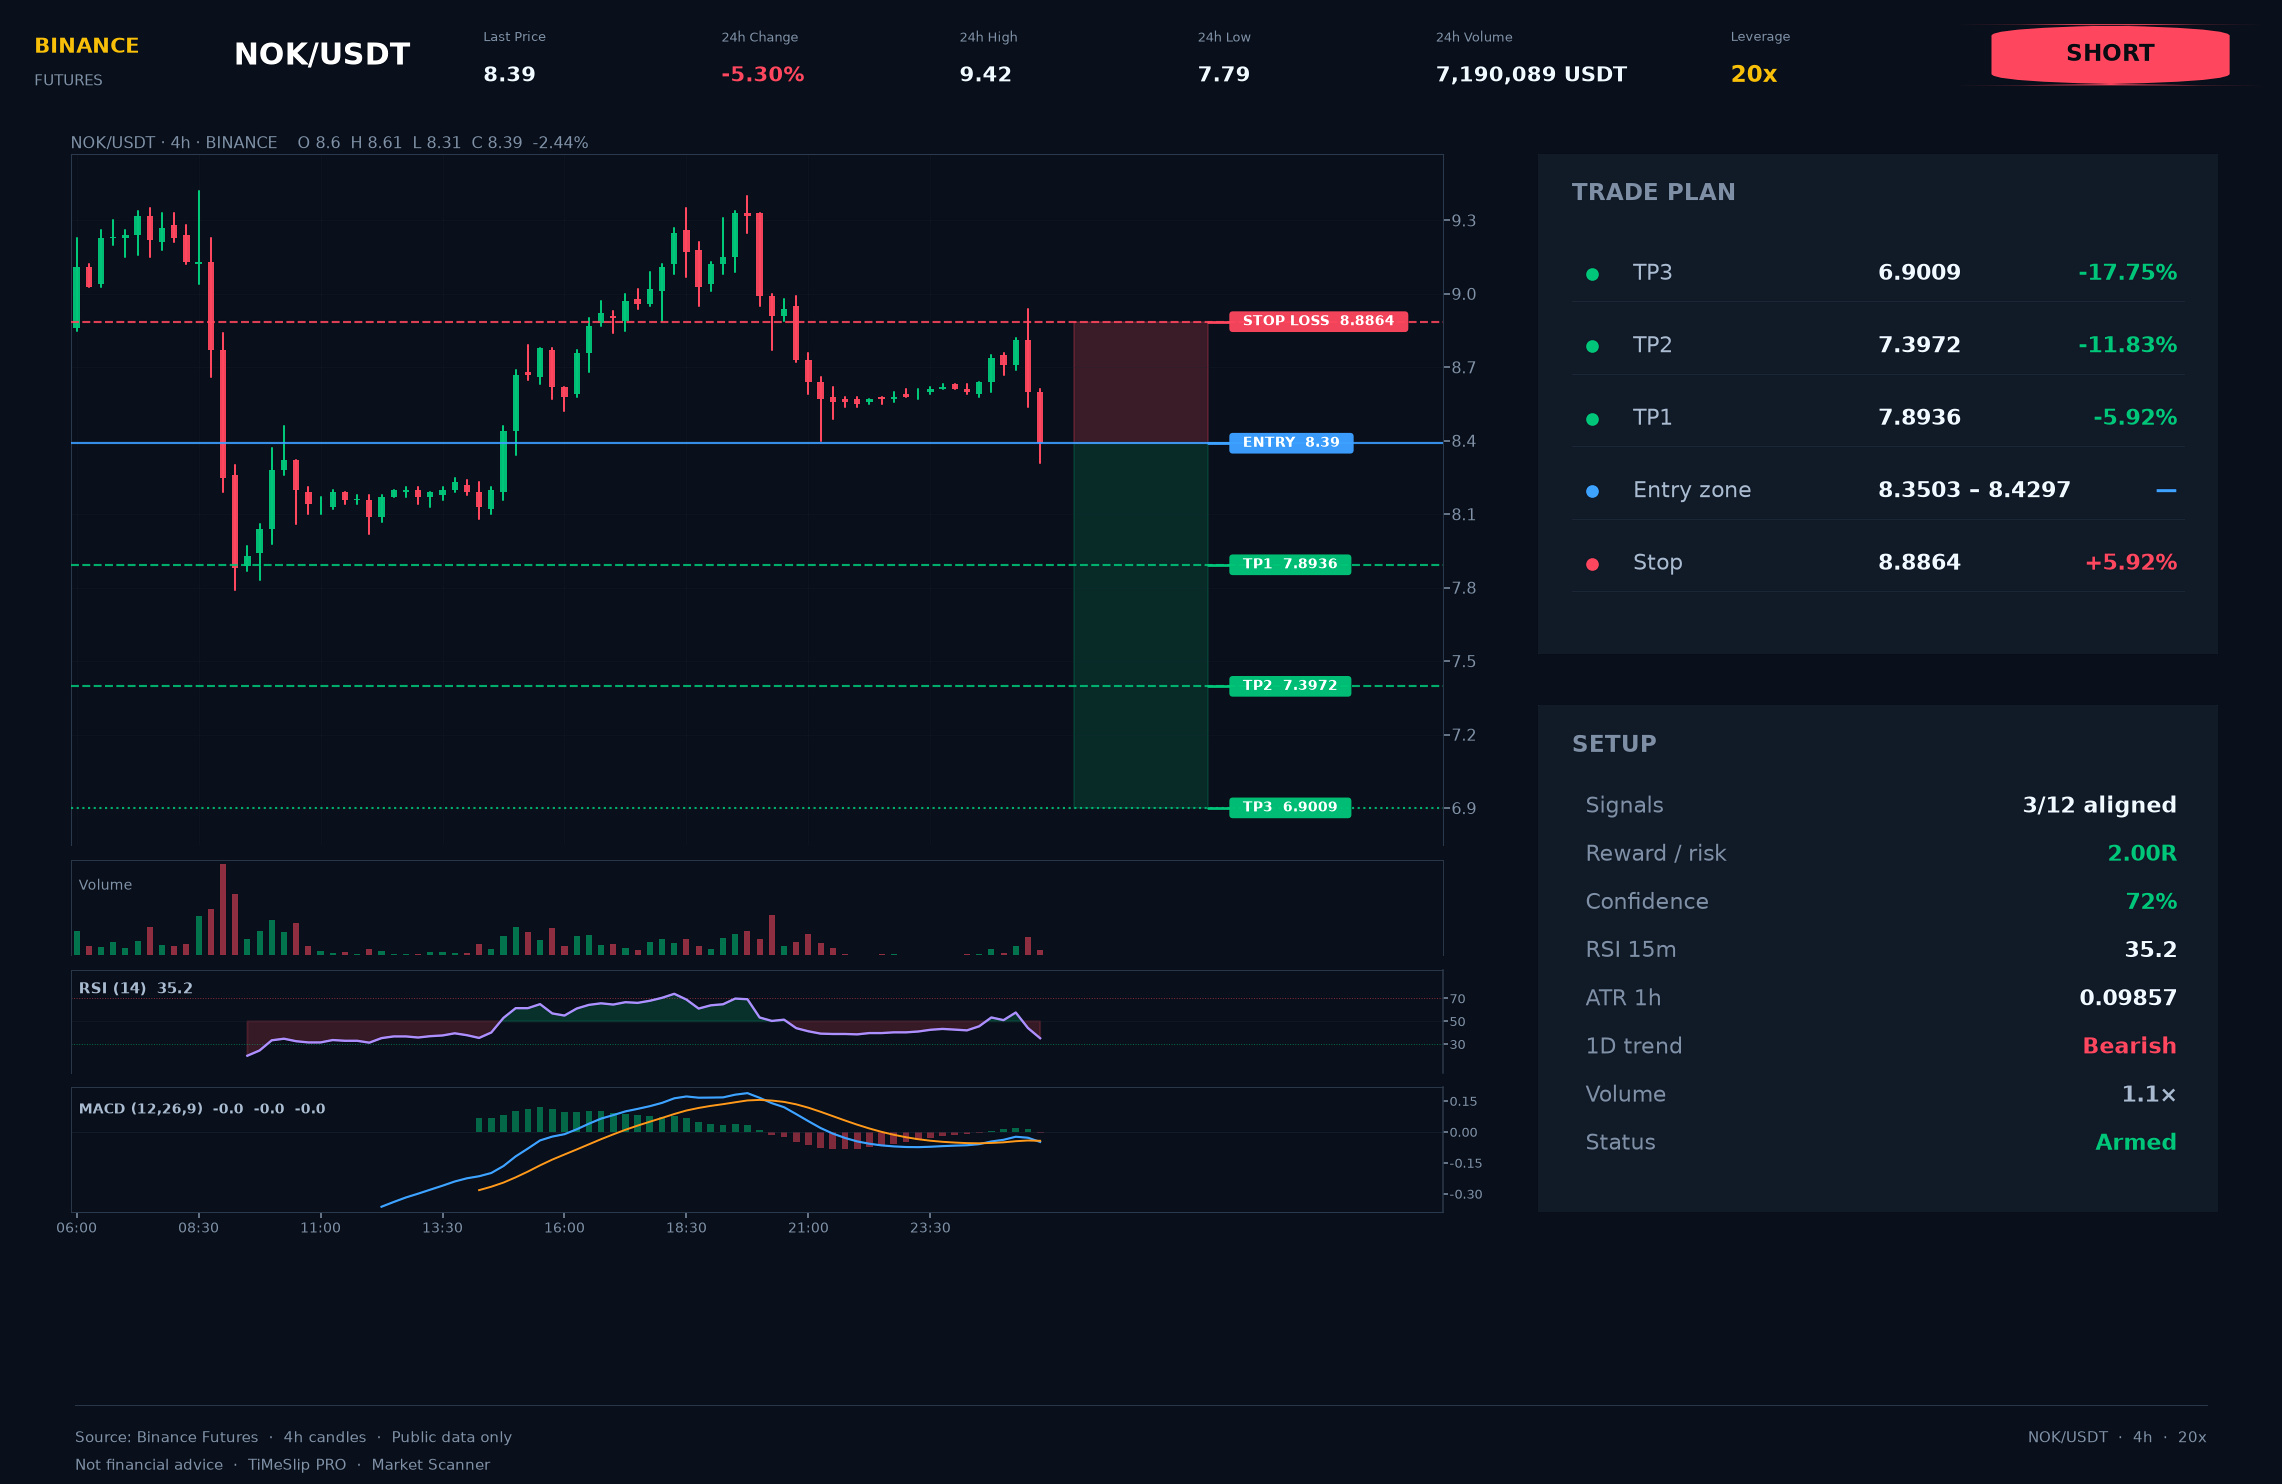
$NOK 🔴 (SELL)
ENTRY: 8.3900
STOP: 8.8864
• TP1: 7.8936
• TP2: 7.3972
• TP3: 6.9009
💡 Tip: after TP1 is hit, move stop-loss to break-even.
On NOK (4h) I see a cautious short: retest confirmed; price should stay below the level.
Pattern quality: 72/100. Stay disciplined on position sizing. ⚠️ Risk to stop is high (5.92%): reduce position size.
Clean break of 8.6050 with a bounce from former support acting as resistance. Risk: 5.92%. TFs: 8h, 1d, 1w. ATR(14): 0.09857.
Volume within normal range (1.1×).
📈 Subscribe so you do not miss key entry levels and scenarios!
Material is for educational purposes. Author is not responsible for your trading results.
#NOK #NOKNews $NOK 👈 Tap to trade
$NOK 🔴 (SELL)
ENTRY: 8.3900
STOP: 8.8864
• TP1: 7.8936
• TP2: 7.3972
• TP3: 6.9009
💡 Tip: after TP1 is hit, move stop-loss to break-even.
On NOK (4h) I see a cautious short: retest confirmed; price should stay below the level.
Pattern quality: 72/100. Stay disciplined on position sizing. ⚠️ Risk to stop is high (5.92%): reduce position size.
Clean break of 8.6050 with a bounce from former support acting as resistance. Risk: 5.92%. TFs: 8h, 1d, 1w. ATR(14): 0.09857.
Volume within normal range (1.1×).
📈 Subscribe so you do not miss key entry levels and scenarios!
Material is for educational purposes. Author is not responsible for your trading results.
#NOK #NOKNews $NOK 👈 Tap to trade
ENTRY: 8.3900
STOP: 8.8864
• TP1: 7.8936
• TP2: 7.3972
• TP3: 6.9009
💡 Tip: after TP1 is hit, move stop-loss to break-even.
On NOK (4h) I see a cautious short: retest confirmed; price should stay below the level.
Pattern quality: 72/100. Stay disciplined on position sizing. ⚠️ Risk to stop is high (5.92%): reduce position size.
Clean break of 8.6050 with a bounce from former support acting as resistance. Risk: 5.92%. TFs: 8h, 1d, 1w. ATR(14): 0.09857.
Volume within normal range (1.1×).
📈 Subscribe so you do not miss key entry levels and scenarios!
Material is for educational purposes. Author is not responsible for your trading results.
#NOK #NOKNews $NOK 👈 Tap to trade
53

$NOK 4-hour technicals are turning bullish—are short-term opportunities here?
📈 $NOK | 4-hour bullish signal
━━━━━━━━━━━━━━━━━━
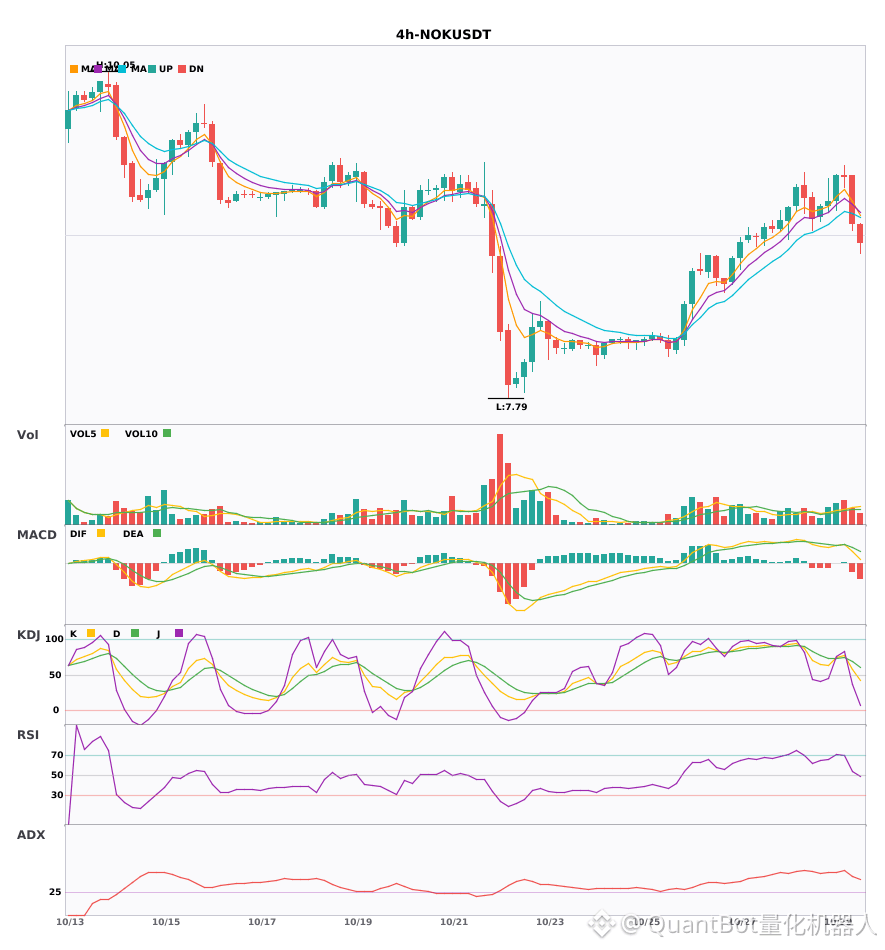
Technical analysis: ADX(50) indicates a very strong trend (watch for an overheated pullback) | MACD golden cross above zero, releasing bullish momentum | EMA5 > EMA8 > EMA13, bullish alignment | KDJ is running strong, with bulls in control (K: 77.6, D: 74.7) | Volume increased (1.7x)
Price change: -0.1100%
📌 Market update: Binance Will Support the ASML Holding N.V. (ASML) and Nokia Corporation (NOK) Cash Dividend Distribution via bStocks
━━━━━━━━━━━━━━━━━━
#技术分析 #NOK
📌 The above content is for reference only and does not constitute investment advice.
$NOK 4-hour technicals are turning bullish—are short-term opportunities here?
📈 $NOK | 4-hour bullish signal
━━━━━━━━━━━━━━━━━━
Technical analysis: ADX(50) indicates a very strong trend (watch for an overheated pullback) | MACD golden cross above zero, releasing bullish momentum | EMA5 > EMA8 > EMA13, bullish alignment | KDJ is running strong, with bulls in control (K: 77.6, D: 74.7) | Volume increased (1.7x)
Price change: -0.1100%
📌 Market update: Binance Will Support the ASML Holding N.V. (ASML) and Nokia Corporation (NOK) Cash Dividend Distribution via bStocks
━━━━━━━━━━━━━━━━━━
#技术分析 #NOK
📌 The above content is for reference only and does not constitute investment advice.
📈 $NOK | 4-hour bullish signal
━━━━━━━━━━━━━━━━━━
Technical analysis: ADX(50) indicates a very strong trend (watch for an overheated pullback) | MACD golden cross above zero, releasing bullish momentum | EMA5 > EMA8 > EMA13, bullish alignment | KDJ is running strong, with bulls in control (K: 77.6, D: 74.7) | Volume increased (1.7x)
Price change: -0.1100%
📌 Market update: Binance Will Support the ASML Holding N.V. (ASML) and Nokia Corporation (NOK) Cash Dividend Distribution via bStocks
━━━━━━━━━━━━━━━━━━
#技术分析 #NOK
📌 The above content is for reference only and does not constitute investment advice.
13

·
--
$NOK 4-hour bullish signal appears🔥
════════════════════
🔴 $NOK 4-hour bullish signal
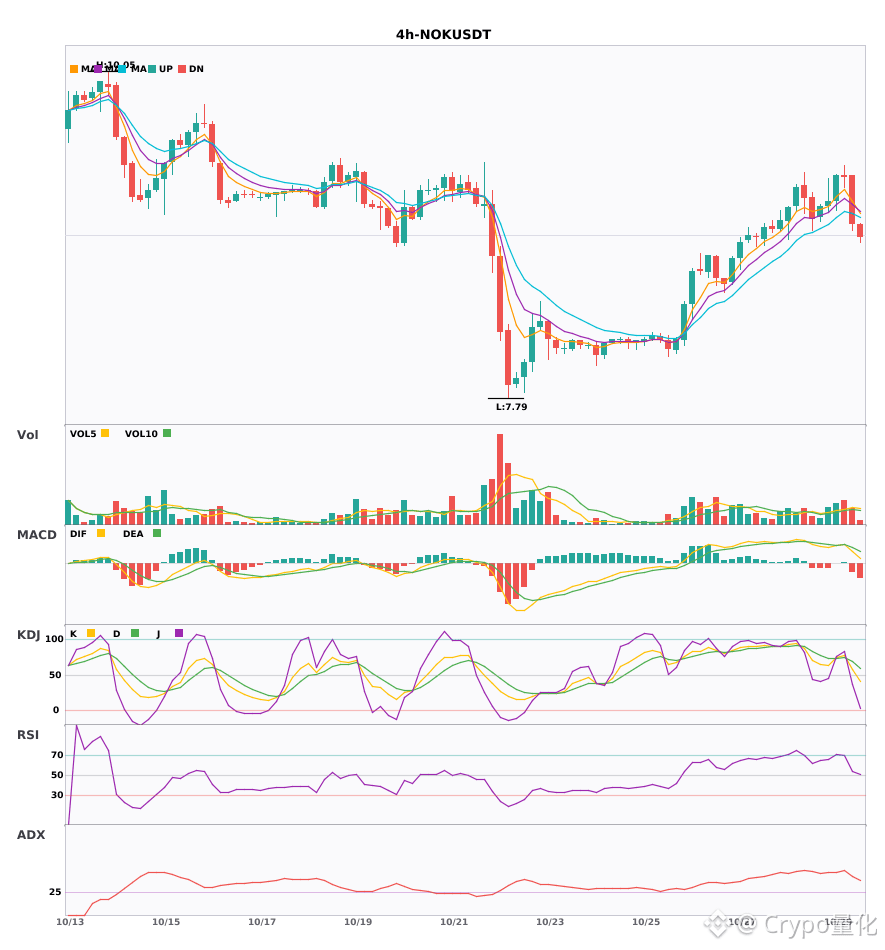
⚠️Technical analysis: ADX(50) indicates a very strong trend (beware of an overbought pullback) | MACD golden cross above zero, bullish momentum released | EMA5 > EMA8 > EMA13, bullish alignment | KDJ running strong, bulls in control (K at 77.6, D at 74.7) | Volume increased (1.7x)
📢Market update: Binance Will Support the ASML Holding N.V. (ASML) and Nokia Corporation (NOK) Cash Dividend Distribution via bStocks
════════════════════
🔔 Follow for first-hand market alerts 🔔
#技术分析 #NOK
📌 When trading, pay attention to whether the candlestick pattern confirms the setup
$NOK 4-hour bullish signal appears🔥
════════════════════
🔴 $NOK 4-hour bullish signal
⚠️Technical analysis: ADX(50) indicates a very strong trend (beware of an overbought pullback) | MACD golden cross above zero, bullish momentum released | EMA5 > EMA8 > EMA13, bullish alignment | KDJ running strong, bulls in control (K at 77.6, D at 74.7) | Volume increased (1.7x)
📢Market update: Binance Will Support the ASML Holding N.V. (ASML) and Nokia Corporation (NOK) Cash Dividend Distribution via bStocks
════════════════════
🔔 Follow for first-hand market alerts 🔔
#技术分析 #NOK
📌 When trading, pay attention to whether the candlestick pattern confirms the setup
════════════════════
🔴 $NOK 4-hour bullish signal
⚠️Technical analysis: ADX(50) indicates a very strong trend (beware of an overbought pullback) | MACD golden cross above zero, bullish momentum released | EMA5 > EMA8 > EMA13, bullish alignment | KDJ running strong, bulls in control (K at 77.6, D at 74.7) | Volume increased (1.7x)
📢Market update: Binance Will Support the ASML Holding N.V. (ASML) and Nokia Corporation (NOK) Cash Dividend Distribution via bStocks
════════════════════
🔔 Follow for first-hand market alerts 🔔
#技术分析 #NOK
📌 When trading, pay attention to whether the candlestick pattern confirms the setup
11
·
--
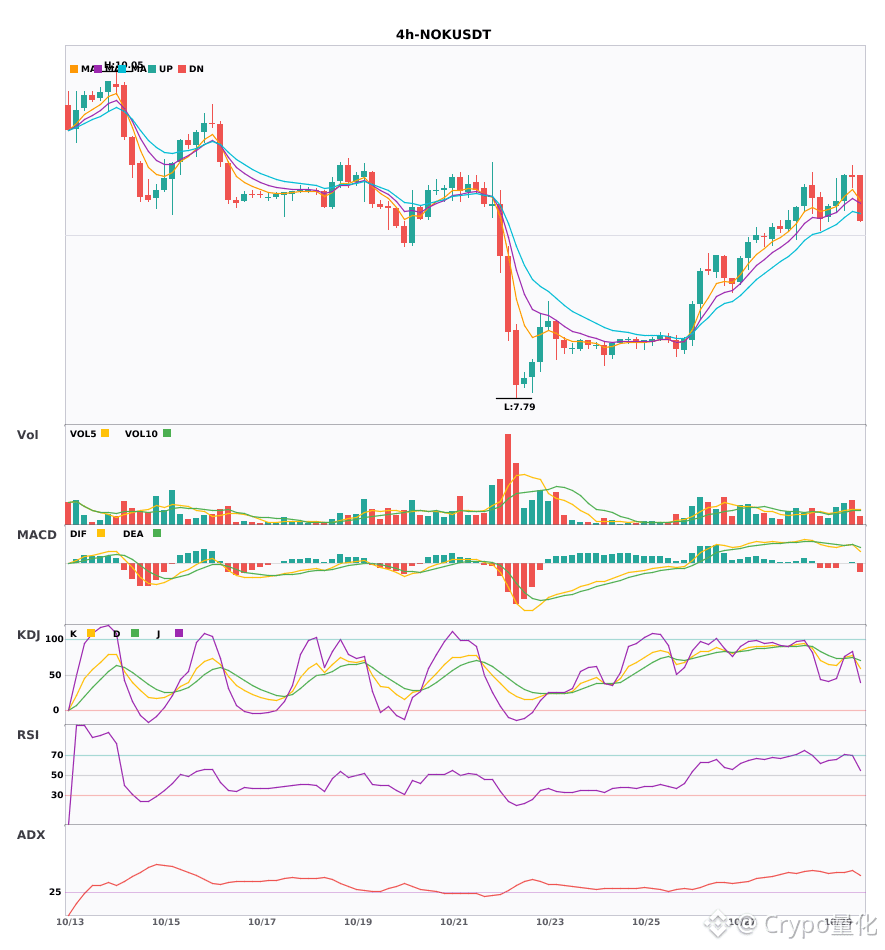
Two 4-hour bullish signals appeared simultaneously: $PARTI / $NOK🔥
════════════════════
🔴 $PARTI 4-hour bullish signal
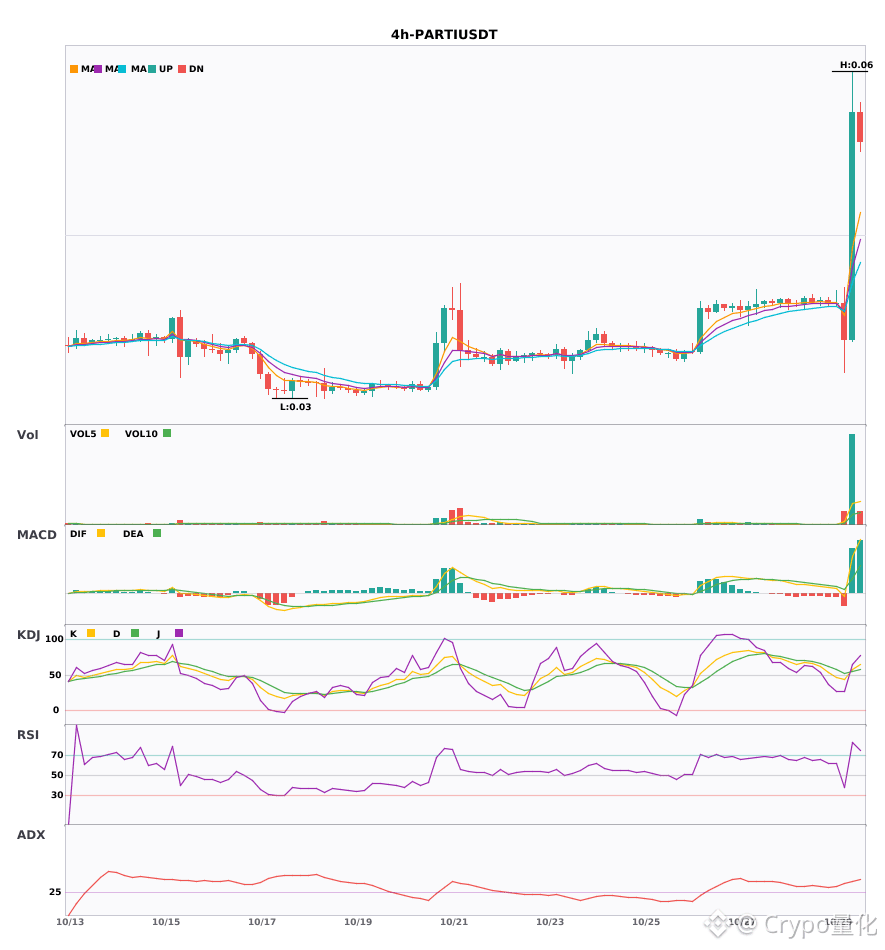
⚠️Technical analysis: ADX(39): clear trend | MACD golden cross above zero, bullish momentum released | EMA5 crossed above EMA8, short-term outlook turns bullish | KDJ golden cross, short-term bullish (K: 58.1, D: 54.5) | Volume surge (8.3x)
════════════════════
🔴 $NOK 4-hour bullish signal
⚠️Technical analysis: ADX(51): very strong trend (watch for an overheated pullback) | MACD golden cross above zero, bullish momentum released | EMA5 > EMA8 > EMA13, bullish alignment | KDJ in strong territory, bulls in control (K: 77.6, D: 74.7) | Increased volume (1.7x)
📢Market update: Binance Will Support the ASML Holding N.V. (ASML) and Nokia Corporation (NOK) Cash Dividend Distribution via bStocks
════════════════════
🔔 Follow to get the latest market movements 🔔
#技术分析 #PARTI #NOK
📌 When trading, pay attention to whether the candlestick pattern confirms the signal
Two 4-hour bullish signals appeared simultaneously: $PARTI / $NOK 🔥
════════════════════
🔴 $PARTI 4-hour bullish signal
⚠️Technical analysis: ADX(39): clear trend | MACD golden cross above zero, bullish momentum released | EMA5 crossed above EMA8, short-term outlook turns bullish | KDJ golden cross, short-term bullish (K: 58.1, D: 54.5) | Volume surge (8.3x)
════════════════════
🔴 $NOK 4-hour bullish signal
⚠️Technical analysis: ADX(51): very strong trend (watch for an overheated pullback) | MACD golden cross above zero, bullish momentum released | EMA5 > EMA8 > EMA13, bullish alignment | KDJ in strong territory, bulls in control (K: 77.6, D: 74.7) | Increased volume (1.7x)
📢Market update: Binance Will Support the ASML Holding N.V. (ASML) and Nokia Corporation (NOK) Cash Dividend Distribution via bStocks
════════════════════
🔔 Follow to get the latest market movements 🔔
#技术分析 #PARTI #NOK
📌 When trading, pay attention to whether the candlestick pattern confirms the signal
════════════════════
🔴 $PARTI 4-hour bullish signal
⚠️Technical analysis: ADX(39): clear trend | MACD golden cross above zero, bullish momentum released | EMA5 crossed above EMA8, short-term outlook turns bullish | KDJ golden cross, short-term bullish (K: 58.1, D: 54.5) | Volume surge (8.3x)
════════════════════
🔴 $NOK 4-hour bullish signal
⚠️Technical analysis: ADX(51): very strong trend (watch for an overheated pullback) | MACD golden cross above zero, bullish momentum released | EMA5 > EMA8 > EMA13, bullish alignment | KDJ in strong territory, bulls in control (K: 77.6, D: 74.7) | Increased volume (1.7x)
📢Market update: Binance Will Support the ASML Holding N.V. (ASML) and Nokia Corporation (NOK) Cash Dividend Distribution via bStocks
════════════════════
🔔 Follow to get the latest market movements 🔔
#技术分析 #PARTI #NOK
📌 When trading, pay attention to whether the candlestick pattern confirms the signal
7
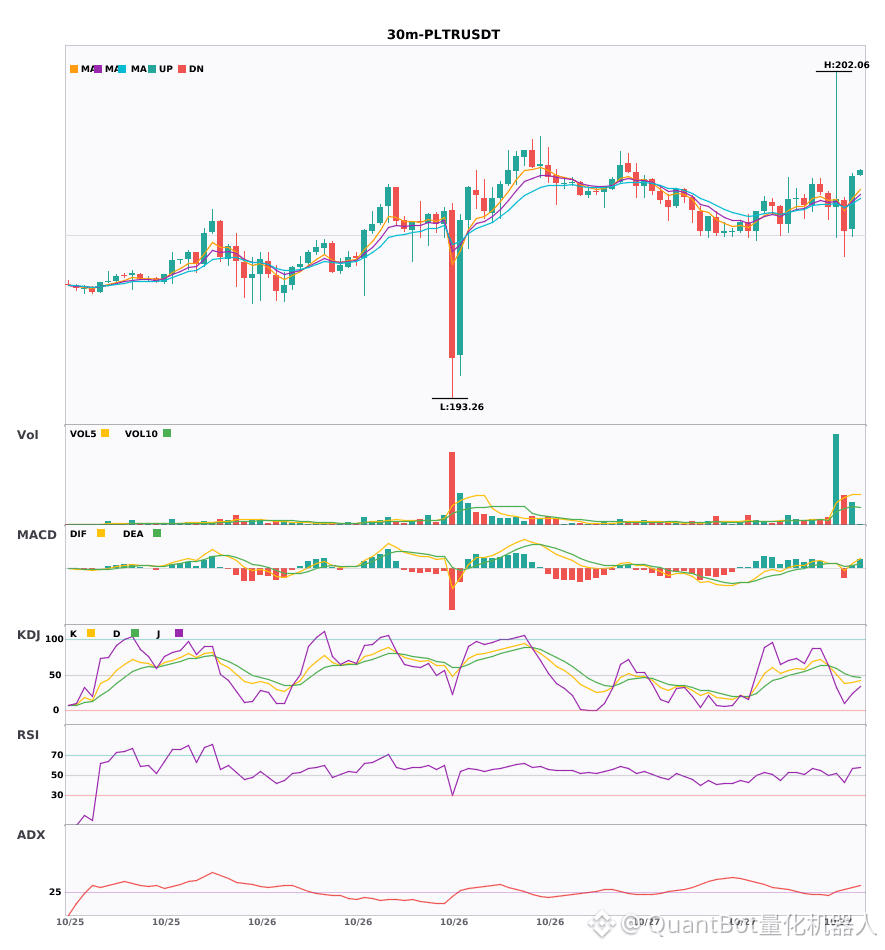
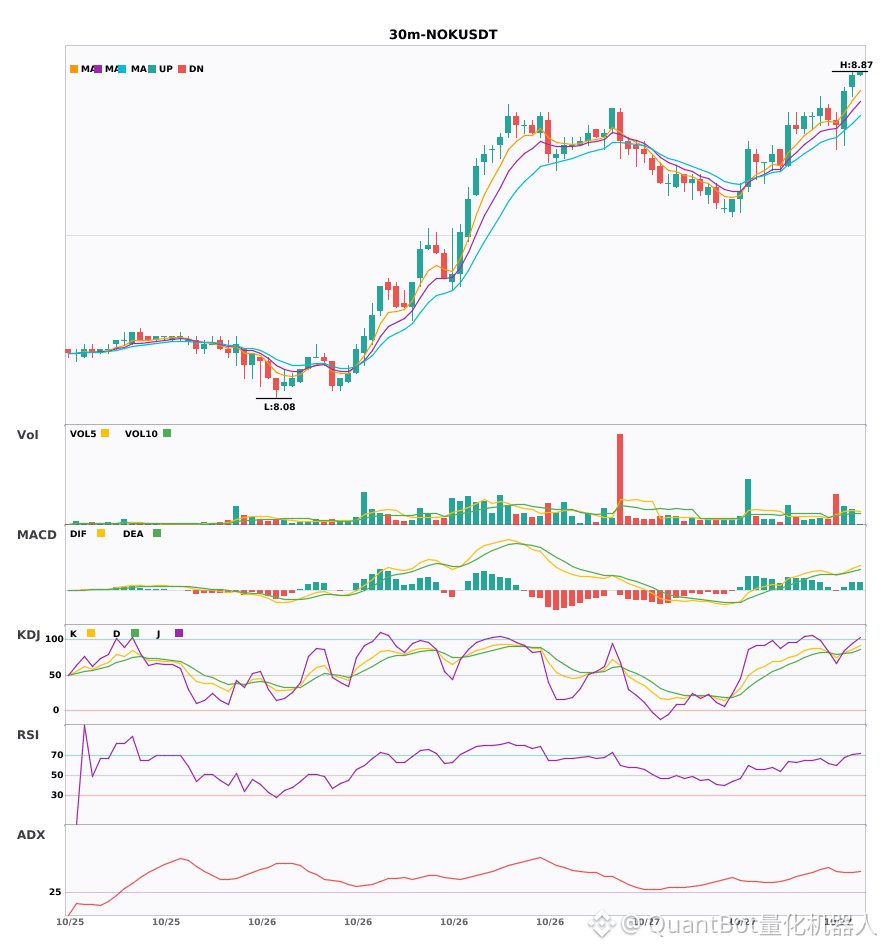
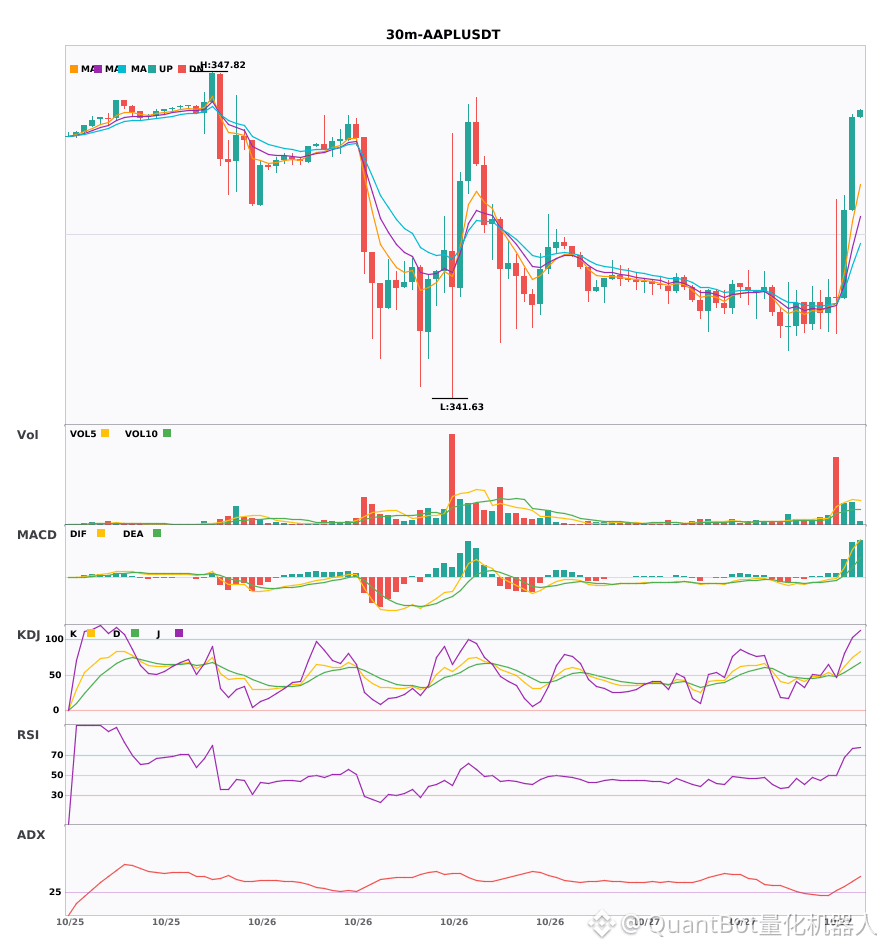
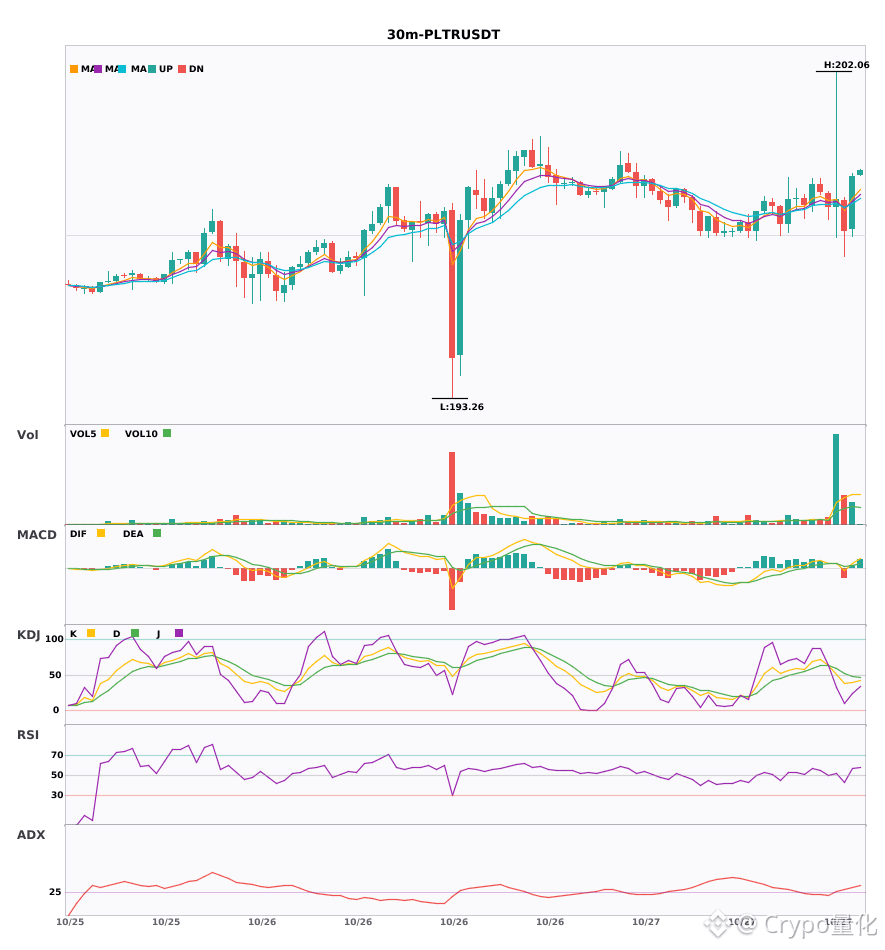
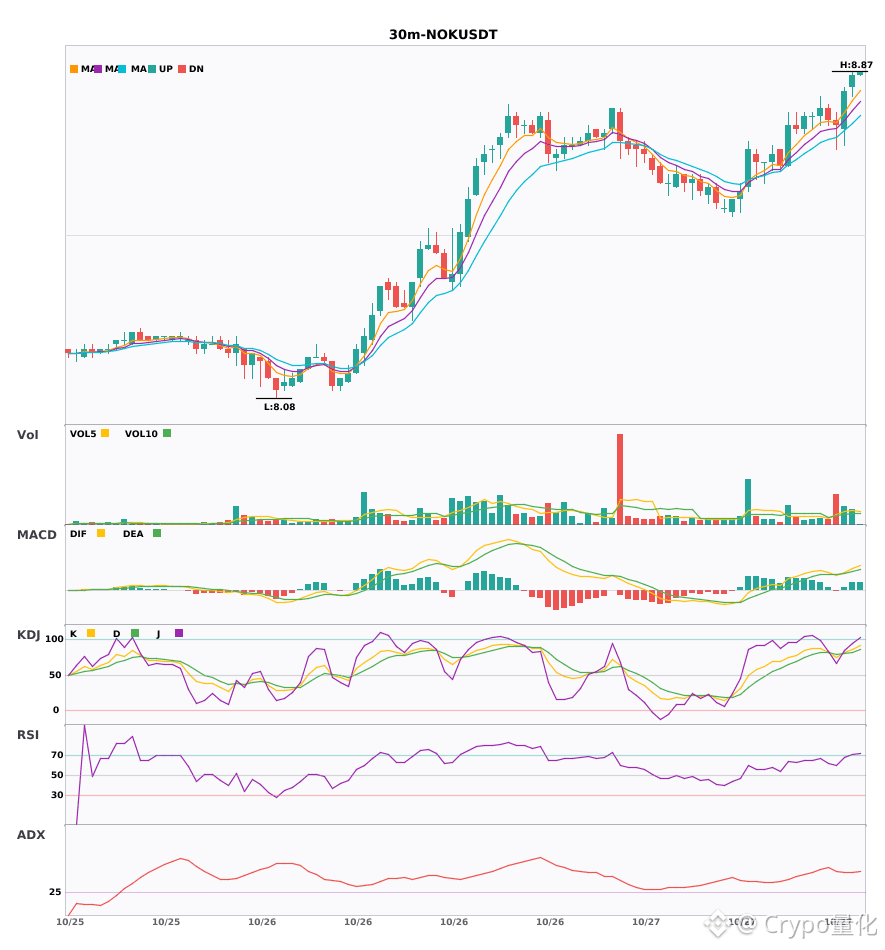
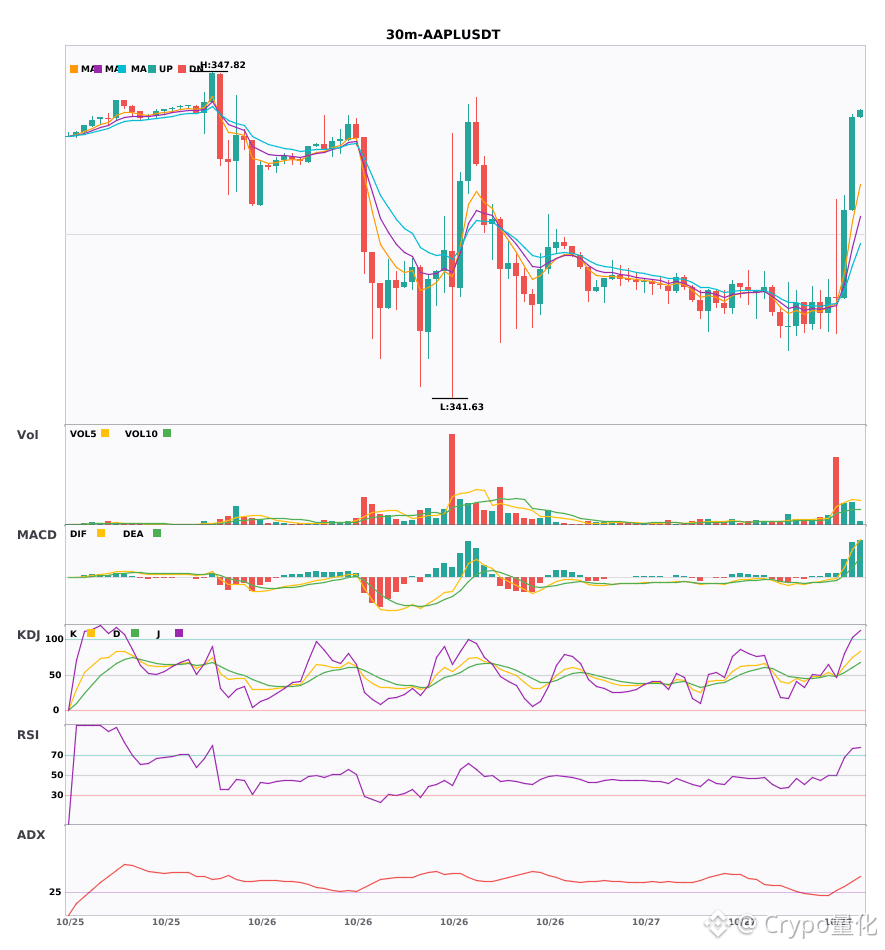
$PLTR / $NOK / $AAPL 30-minute technical indicators are strengthening simultaneously—which has more explosive potential?
📈 $PLTR | 30-minute bullish signal
━━━━━━━━━━━━━━━━━━
Technical analysis: ADX(33) Clear trending market | MACD golden cross above zero, bullish momentum emerging | EMA5 crosses above EMA8, short-term trend turns bullish | KDJ moving weakly, bears have the upper hand (K: 39.8, D: 47.9) | Volume increases (1.8x)
Price change: 0.7500%
📈 $NOK | 30-minute bullish signal
━━━━━━━━━━━━━━━━━━
Technical analysis: ADX(51) Very strong trend (beware of a potentially overheated pullback) | MACD golden cross above zero, bullish momentum emerging | EMA5 > EMA8 > EMA13, bullish alignment | KDJ golden cross, bullish short-term outlook (K: 81.6, D: 80.0) | Volume surges (3.3x)
Price change: 0.9200%
📌 Market update: Binance Will Support the ASML Holding N.V. (ASML) and Nokia Corporation (NOK) Cash Dividend Distribution via bStocks
📈 $AAPL | 30-minute bullish signal
━━━━━━━━━━━━━━━━━━
Technical analysis: ADX(34) Clear trending market | MACD DIF breaks above the zero line, trend turns bullish | EMA5 > EMA8 > EMA13, bullish alignment | KDJ golden cross, bullish short-term outlook (K: 61.7, D: 52.8) | Volume surges (5.7x)
Price change: 0.4800%
━━━━━━━━━━━━━━━━━━
#技术分析 #PLTR #NOK #AAPL
📌 The above content is for reference only and does not constitute investment advice
$PLTR / $NOK / $AAPL 30-minute technical indicators are strengthening simultaneously—which has more explosive potential?
📈 $PLTR | 30-minute bullish signal
━━━━━━━━━━━━━━━━━━
Technical analysis: ADX(33) Clear trending market | MACD golden cross above zero, bullish momentum emerging | EMA5 crosses above EMA8, short-term trend turns bullish | KDJ moving weakly, bears have the upper hand (K: 39.8, D: 47.9) | Volume increases (1.8x)
Price change: 0.7500%
📈 $NOK | 30-minute bullish signal
━━━━━━━━━━━━━━━━━━
Technical analysis: ADX(51) Very strong trend (beware of a potentially overheated pullback) | MACD golden cross above zero, bullish momentum emerging | EMA5 > EMA8 > EMA13, bullish alignment | KDJ golden cross, bullish short-term outlook (K: 81.6, D: 80.0) | Volume surges (3.3x)
Price change: 0.9200%
📌 Market update: Binance Will Support the ASML Holding N.V. (ASML) and Nokia Corporation (NOK) Cash Dividend Distribution via bStocks
📈 $AAPL | 30-minute bullish signal
━━━━━━━━━━━━━━━━━━
Technical analysis: ADX(34) Clear trending market | MACD DIF breaks above the zero line, trend turns bullish | EMA5 > EMA8 > EMA13, bullish alignment | KDJ golden cross, bullish short-term outlook (K: 61.7, D: 52.8) | Volume surges (5.7x)
Price change: 0.4800%
━━━━━━━━━━━━━━━━━━
#技术分析 #PLTR #NOK #AAPL
📌 The above content is for reference only and does not constitute investment advice
📈 $PLTR | 30-minute bullish signal
━━━━━━━━━━━━━━━━━━
Technical analysis: ADX(33) Clear trending market | MACD golden cross above zero, bullish momentum emerging | EMA5 crosses above EMA8, short-term trend turns bullish | KDJ moving weakly, bears have the upper hand (K: 39.8, D: 47.9) | Volume increases (1.8x)
Price change: 0.7500%
📈 $NOK | 30-minute bullish signal
━━━━━━━━━━━━━━━━━━
Technical analysis: ADX(51) Very strong trend (beware of a potentially overheated pullback) | MACD golden cross above zero, bullish momentum emerging | EMA5 > EMA8 > EMA13, bullish alignment | KDJ golden cross, bullish short-term outlook (K: 81.6, D: 80.0) | Volume surges (3.3x)
Price change: 0.9200%
📌 Market update: Binance Will Support the ASML Holding N.V. (ASML) and Nokia Corporation (NOK) Cash Dividend Distribution via bStocks
📈 $AAPL | 30-minute bullish signal
━━━━━━━━━━━━━━━━━━
Technical analysis: ADX(34) Clear trending market | MACD DIF breaks above the zero line, trend turns bullish | EMA5 > EMA8 > EMA13, bullish alignment | KDJ golden cross, bullish short-term outlook (K: 61.7, D: 52.8) | Volume surges (5.7x)
Price change: 0.4800%
━━━━━━━━━━━━━━━━━━
#技术分析 #PLTR #NOK #AAPL
📌 The above content is for reference only and does not constitute investment advice
24
·
--
$PLTR / $NOK / $AAPL 30-minute signals align and turn bullish, with bullish signals appearing simultaneously 🔥
════════════════════
🔴 $PLTR 30-minute bullish signal
⚠️ Technicals: ADX (33) indicates a clear trend | MACD golden cross above zero, releasing bullish momentum | EMA5 crosses above EMA8, turning bullish in the short term | KDJ is weak, with bears in control (K: 39.8, D: 47.9) | Volume increases (1.8x)
════════════════════
🔴 $NOK 30-minute bullish signal
⚠️ Technicals: ADX (51) indicates a very strong trend (watch for an overheated pullback) | MACD golden cross above zero, releasing bullish momentum | EMA5 > EMA8 > EMA13, bullish alignment | KDJ golden cross, bullish short-term outlook (K: 81.6, D: 80.0) | Volume surges (3.3x)
📢 Market update: Binance Will Support the ASML Holding N.V. (ASML) and Nokia Corporation (NOK) Cash Dividend Distribution via bStocks
════════════════════
🔴 $AAPL 30-minute bullish signal
⚠️ Technicals: ADX (34) indicates a clear trend | MACD DIF breaks above the zero line, indicating a bullish trend shift | EMA5 > EMA8 > EMA13, bullish alignment | KDJ golden cross, bullish short-term outlook (K: 61.7, D: 52.8) | Volume surges (5.7x)
════════════════════
🔔 Follow for first-hand market updates 🔔
#技术分析 #PLTR #NOK #AAPL
📌 When trading, check whether the candlestick patterns confirm the setup
$PLTR / $NOK / $AAPL 30-minute signals align and turn bullish, with bullish signals appearing simultaneously 🔥
════════════════════
🔴 $PLTR 30-minute bullish signal
⚠️ Technicals: ADX (33) indicates a clear trend | MACD golden cross above zero, releasing bullish momentum | EMA5 crosses above EMA8, turning bullish in the short term | KDJ is weak, with bears in control (K: 39.8, D: 47.9) | Volume increases (1.8x)
════════════════════
🔴 $NOK 30-minute bullish signal
⚠️ Technicals: ADX (51) indicates a very strong trend (watch for an overheated pullback) | MACD golden cross above zero, releasing bullish momentum | EMA5 > EMA8 > EMA13, bullish alignment | KDJ golden cross, bullish short-term outlook (K: 81.6, D: 80.0) | Volume surges (3.3x)
📢 Market update: Binance Will Support the ASML Holding N.V. (ASML) and Nokia Corporation (NOK) Cash Dividend Distribution via bStocks
════════════════════
🔴 $AAPL 30-minute bullish signal
⚠️ Technicals: ADX (34) indicates a clear trend | MACD DIF breaks above the zero line, indicating a bullish trend shift | EMA5 > EMA8 > EMA13, bullish alignment | KDJ golden cross, bullish short-term outlook (K: 61.7, D: 52.8) | Volume surges (5.7x)
════════════════════
🔔 Follow for first-hand market updates 🔔
#技术分析 #PLTR #NOK #AAPL
📌 When trading, check whether the candlestick patterns confirm the setup
════════════════════
🔴 $PLTR 30-minute bullish signal
⚠️ Technicals: ADX (33) indicates a clear trend | MACD golden cross above zero, releasing bullish momentum | EMA5 crosses above EMA8, turning bullish in the short term | KDJ is weak, with bears in control (K: 39.8, D: 47.9) | Volume increases (1.8x)
════════════════════
🔴 $NOK 30-minute bullish signal
⚠️ Technicals: ADX (51) indicates a very strong trend (watch for an overheated pullback) | MACD golden cross above zero, releasing bullish momentum | EMA5 > EMA8 > EMA13, bullish alignment | KDJ golden cross, bullish short-term outlook (K: 81.6, D: 80.0) | Volume surges (3.3x)
📢 Market update: Binance Will Support the ASML Holding N.V. (ASML) and Nokia Corporation (NOK) Cash Dividend Distribution via bStocks
════════════════════
🔴 $AAPL 30-minute bullish signal
⚠️ Technicals: ADX (34) indicates a clear trend | MACD DIF breaks above the zero line, indicating a bullish trend shift | EMA5 > EMA8 > EMA13, bullish alignment | KDJ golden cross, bullish short-term outlook (K: 61.7, D: 52.8) | Volume surges (5.7x)
════════════════════
🔔 Follow for first-hand market updates 🔔
#技术分析 #PLTR #NOK #AAPL
📌 When trading, check whether the candlestick patterns confirm the setup
5

·
--
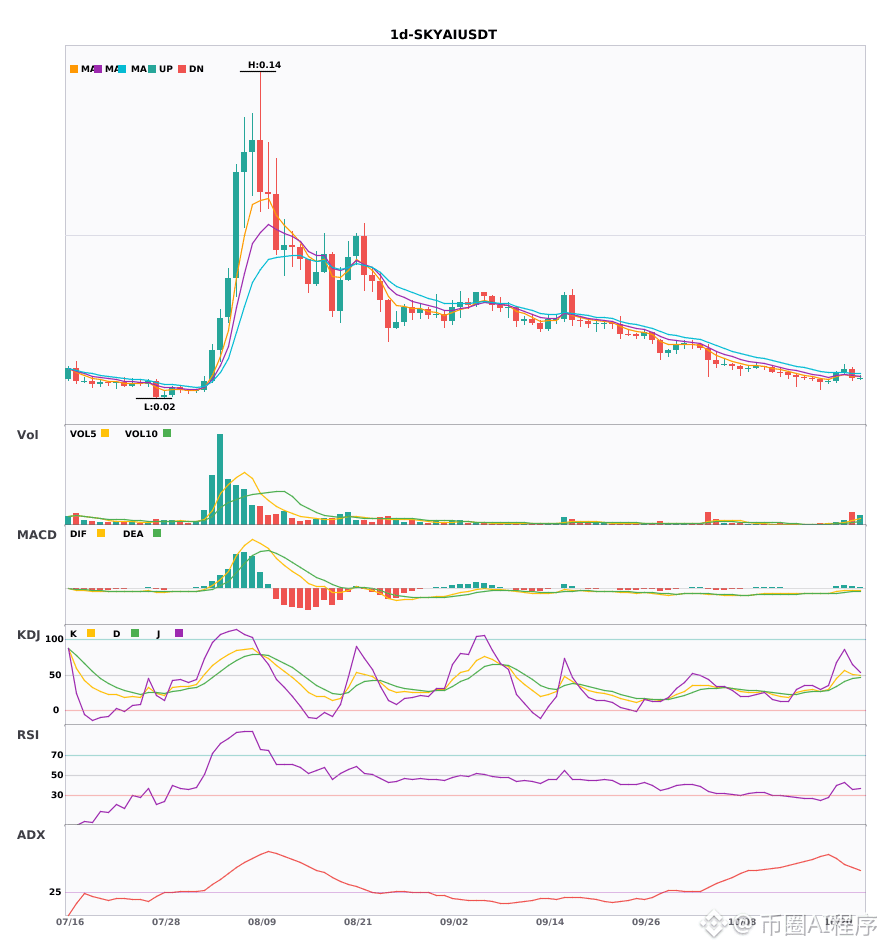
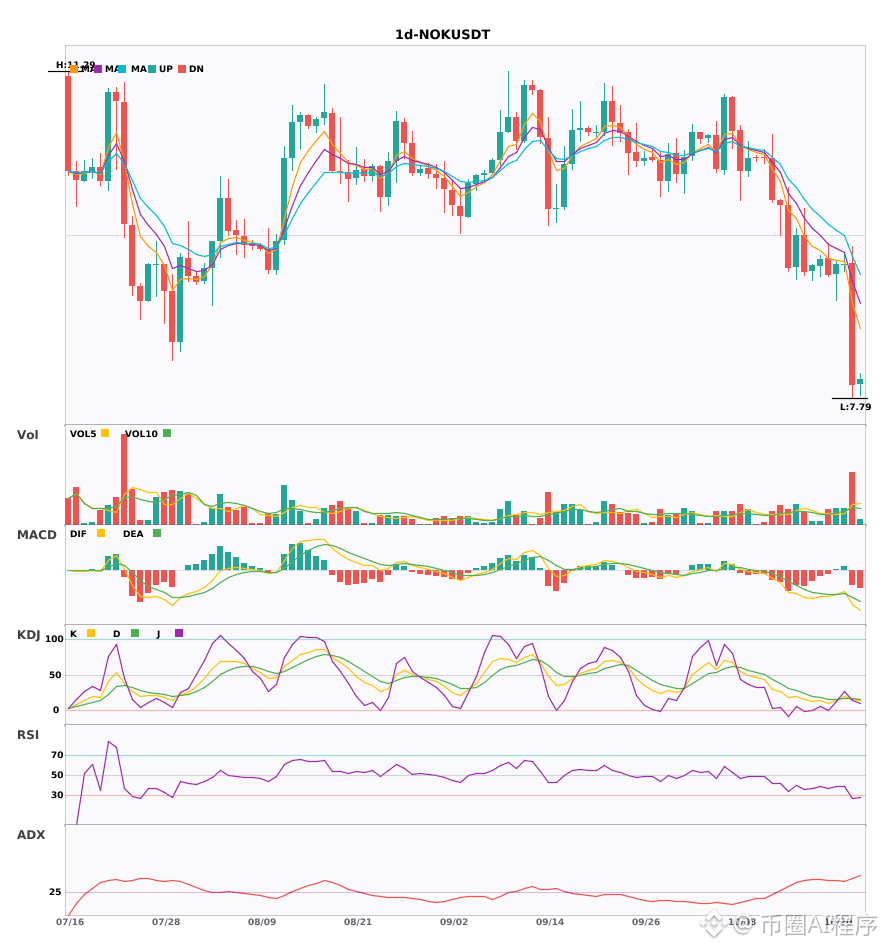
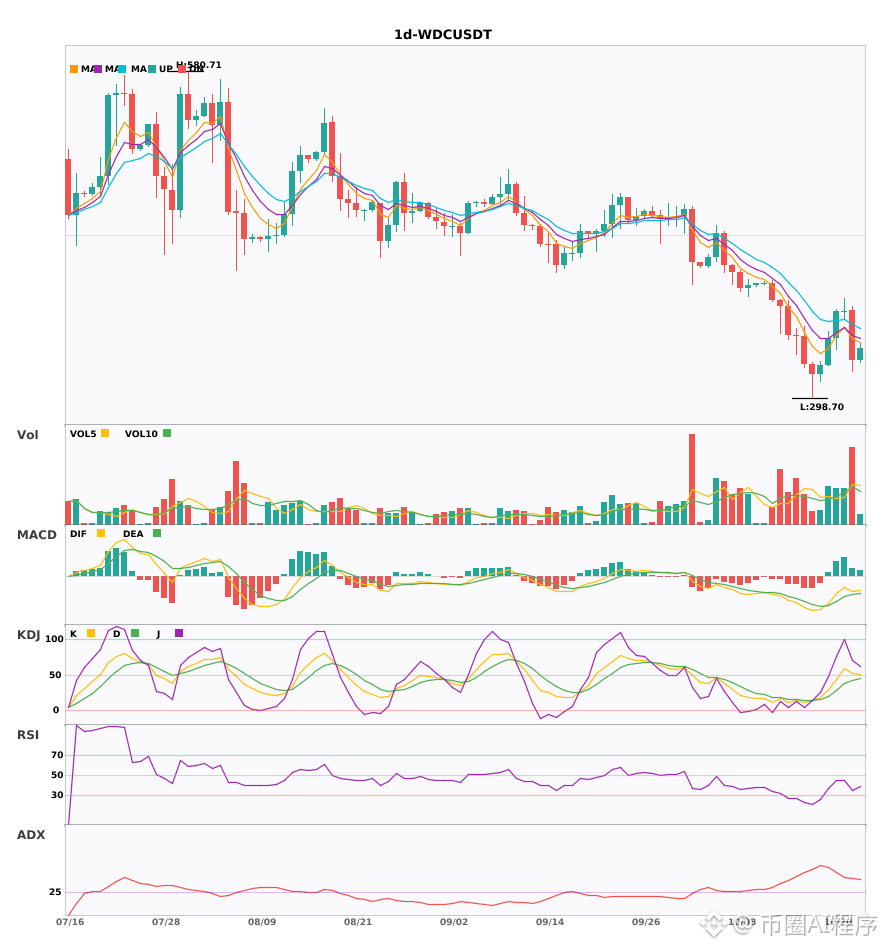
2026-10-23_Daily Multi-Timeframe Resonance: Potential Bearish Coins 1/5
The ranking does not indicate priority or constitute trading advice. Please recheck the trend before trading and watch for divergences.
════════════════════
🟢 $SKYAI Bearish Resonance
════════════════════
🟢 $NOK Bearish Resonance
════════════════════
🟢 $WDC Bearish Resonance
════════════════════
📊 Indicator Notes:
This series covers daily + weekly multi-timeframe resonance:
① Daily (signal layer): triggered when any one of the following conditions is met:
• MACD bearish cross below zero (DIF crosses below DEA and DIF < 0)
• First formation of a bearish EMA alignment (EMA5<EMA8<EMA13, not true on the previous candle)
• Additional conditions: ADX(7) > 25 to confirm the trend + increased volume (volume ratio > 1.2)
② Weekly (confirmation layer): EMA5<EMA8<EMA13 and DIF < 0
A signal is considered resonant only when both layers point in the same direction (bearish on both the daily and weekly timeframes).
Resonance signals are more reliable than single-timeframe signals—alignment across multiple timeframes indicates a consensus in the trend.
#多周期共振 #SKYAI #NOK #WDC
📌 The above is for reference only and does not constitute investment advice.
🔔 Follow for first-hand updates on market movements 🔔
2026-10-23_Daily Multi-Timeframe Resonance: Potential Bearish Coins 1/5
The ranking does not indicate priority or constitute trading advice. Please recheck the trend before trading and watch for divergences.
════════════════════
🟢 $SKYAI Bearish Resonance
════════════════════
🟢 $NOK Bearish Resonance
════════════════════
🟢 $WDC Bearish Resonance
════════════════════
📊 Indicator Notes:
This series covers daily + weekly multi-timeframe resonance:
① Daily (signal layer): triggered when any one of the following conditions is met:
• MACD bearish cross below zero (DIF crosses below DEA and DIF < 0)
• First formation of a bearish EMA alignment (EMA5<EMA8<EMA13, not true on the previous candle)
• Additional conditions: ADX(7) > 25 to confirm the trend + increased volume (volume ratio > 1.2)
② Weekly (confirmation layer): EMA5<EMA8<EMA13 and DIF < 0
A signal is considered resonant only when both layers point in the same direction (bearish on both the daily and weekly timeframes).
Resonance signals are more reliable than single-timeframe signals—alignment across multiple timeframes indicates a consensus in the trend.
#多周期共振 #SKYAI #NOK #WDC
📌 The above is for reference only and does not constitute investment advice.
🔔 Follow for first-hand updates on market movements 🔔
The ranking does not indicate priority or constitute trading advice. Please recheck the trend before trading and watch for divergences.
════════════════════
🟢 $SKYAI Bearish Resonance
════════════════════
🟢 $NOK Bearish Resonance
════════════════════
🟢 $WDC Bearish Resonance
════════════════════
📊 Indicator Notes:
This series covers daily + weekly multi-timeframe resonance:
① Daily (signal layer): triggered when any one of the following conditions is met:
• MACD bearish cross below zero (DIF crosses below DEA and DIF < 0)
• First formation of a bearish EMA alignment (EMA5<EMA8<EMA13, not true on the previous candle)
• Additional conditions: ADX(7) > 25 to confirm the trend + increased volume (volume ratio > 1.2)
② Weekly (confirmation layer): EMA5<EMA8<EMA13 and DIF < 0
A signal is considered resonant only when both layers point in the same direction (bearish on both the daily and weekly timeframes).
Resonance signals are more reliable than single-timeframe signals—alignment across multiple timeframes indicates a consensus in the trend.
#多周期共振 #SKYAI #NOK #WDC
📌 The above is for reference only and does not constitute investment advice.
🔔 Follow for first-hand updates on market movements 🔔
12
·
--
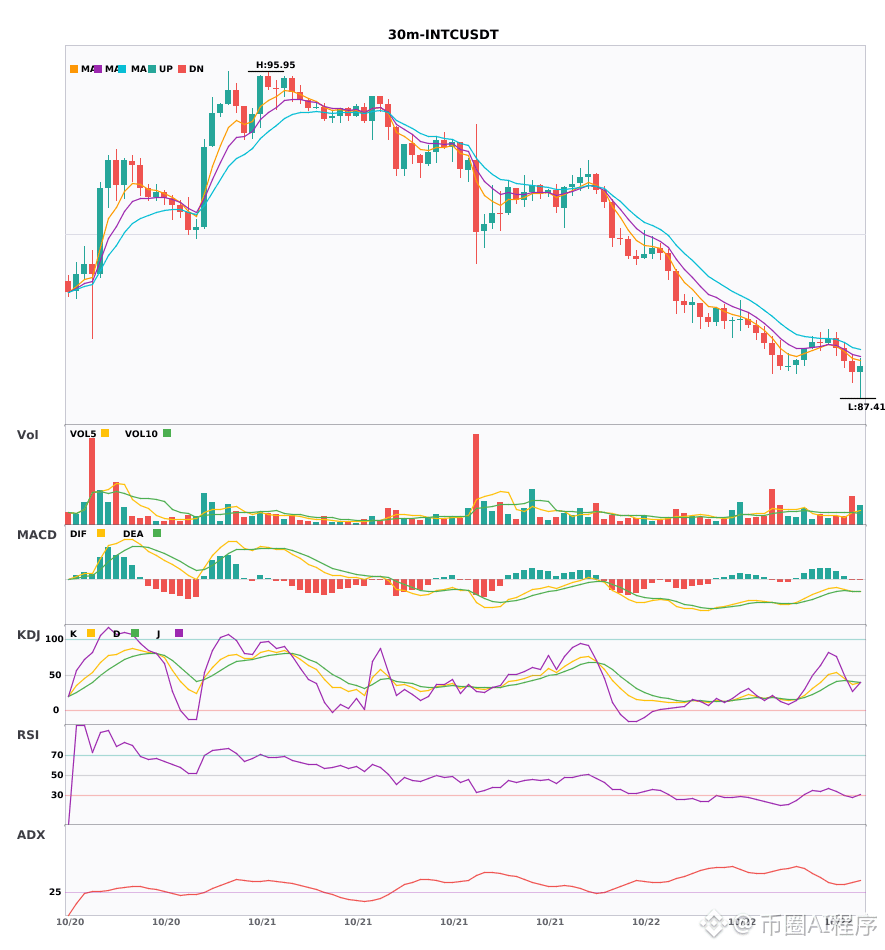
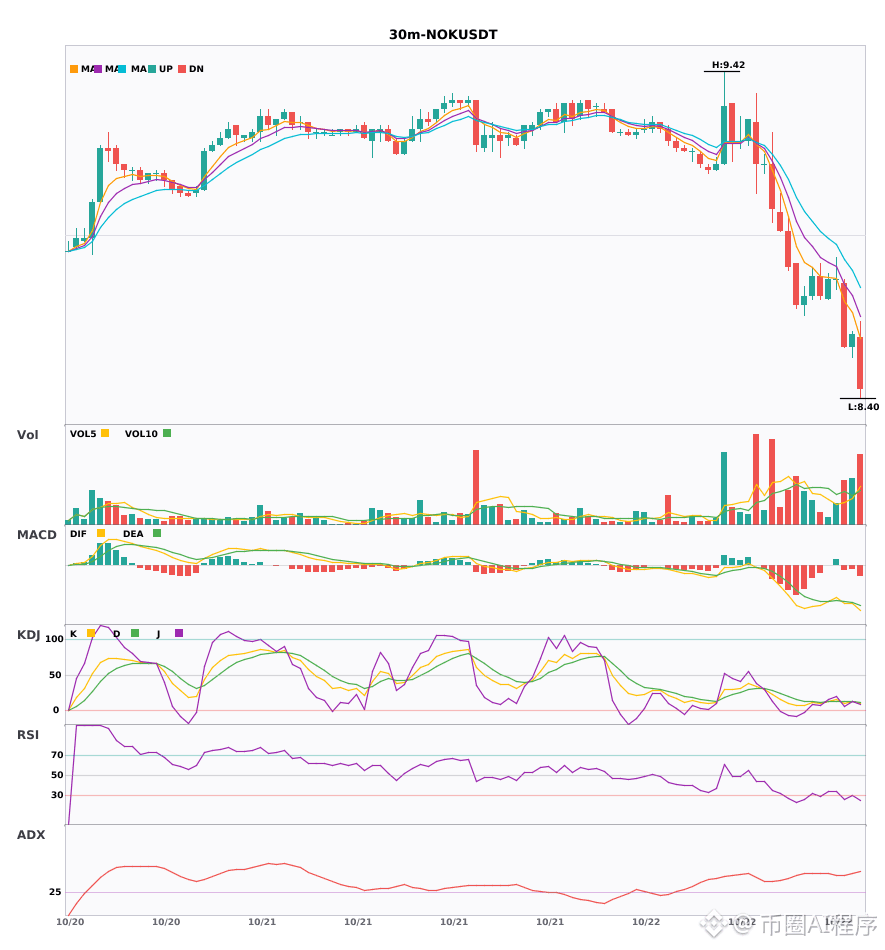
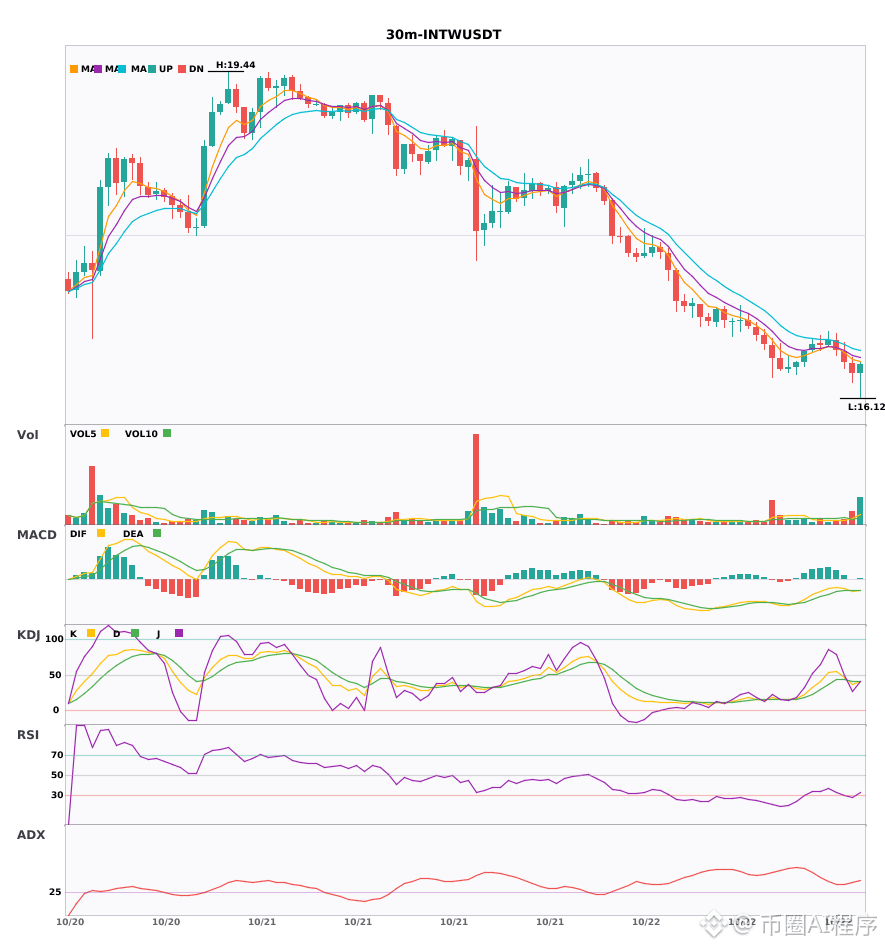
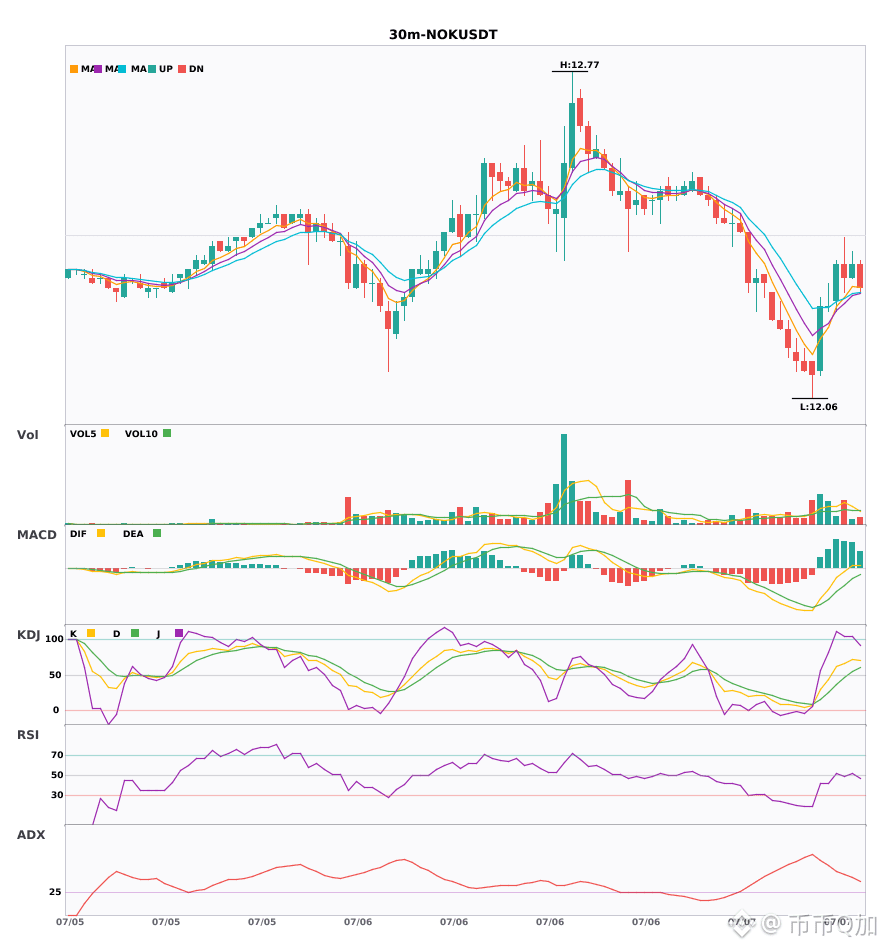
$INTC / $NOK / $INTW 30-minute bearish signals, 4-hour bearish trend confirmed 🔥
════════════════════
🟢 $INTC 30-minute bearish signal
⚠️Technical analysis: 4-hour bearish confluence confirmed | 30-minute entry: MACD bearish crossover below zero, bearish momentum accelerating | EMA5 < EMA8 < EMA13, bearish alignment | KDJ bearish crossover, short-term outlook bearish (K: 36.0, D: 40.3) | Volume increased (2.4x)
════════════════════
🟢 $NOK 30-minute bearish signal
⚠️Technical analysis: 4-hour bearish confluence confirmed | 30-minute entry: MACD bearish crossover below zero, bearish momentum accelerating | EMA5 < EMA8 < EMA13, bearish alignment | KDJ bearish crossover, short-term outlook bearish (K: 10.2, D: 12.2) | Volume normal (1.3x)
════════════════════
🟢 $INTW 30-minute bearish signal
⚠️Technical analysis: 4-hour bearish confluence confirmed | 30-minute entry: MACD bearish crossover below zero, bearish momentum accelerating | EMA5 < EMA8 < EMA13, bearish alignment | KDJ bearish crossover, short-term outlook bearish (K: 36.5, D: 41.5) | Volume increased (2.3x)
════════════════════
🔔 Follow for real-time market updates 🔔
#多周期共振 #INTC #NOK #INTW
📌 When trading, check whether the candlestick pattern meets the criteria
$INTC / $NOK / $INTW 30-minute bearish signals, 4-hour bearish trend confirmed 🔥
════════════════════
🟢 $INTC 30-minute bearish signal
⚠️Technical analysis: 4-hour bearish confluence confirmed | 30-minute entry: MACD bearish crossover below zero, bearish momentum accelerating | EMA5 < EMA8 < EMA13, bearish alignment | KDJ bearish crossover, short-term outlook bearish (K: 36.0, D: 40.3) | Volume increased (2.4x)
════════════════════
🟢 $NOK 30-minute bearish signal
⚠️Technical analysis: 4-hour bearish confluence confirmed | 30-minute entry: MACD bearish crossover below zero, bearish momentum accelerating | EMA5 < EMA8 < EMA13, bearish alignment | KDJ bearish crossover, short-term outlook bearish (K: 10.2, D: 12.2) | Volume normal (1.3x)
════════════════════
🟢 $INTW 30-minute bearish signal
⚠️Technical analysis: 4-hour bearish confluence confirmed | 30-minute entry: MACD bearish crossover below zero, bearish momentum accelerating | EMA5 < EMA8 < EMA13, bearish alignment | KDJ bearish crossover, short-term outlook bearish (K: 36.5, D: 41.5) | Volume increased (2.3x)
════════════════════
🔔 Follow for real-time market updates 🔔
#多周期共振 #INTC #NOK #INTW
📌 When trading, check whether the candlestick pattern meets the criteria
════════════════════
🟢 $INTC 30-minute bearish signal
⚠️Technical analysis: 4-hour bearish confluence confirmed | 30-minute entry: MACD bearish crossover below zero, bearish momentum accelerating | EMA5 < EMA8 < EMA13, bearish alignment | KDJ bearish crossover, short-term outlook bearish (K: 36.0, D: 40.3) | Volume increased (2.4x)
════════════════════
🟢 $NOK 30-minute bearish signal
⚠️Technical analysis: 4-hour bearish confluence confirmed | 30-minute entry: MACD bearish crossover below zero, bearish momentum accelerating | EMA5 < EMA8 < EMA13, bearish alignment | KDJ bearish crossover, short-term outlook bearish (K: 10.2, D: 12.2) | Volume normal (1.3x)
════════════════════
🟢 $INTW 30-minute bearish signal
⚠️Technical analysis: 4-hour bearish confluence confirmed | 30-minute entry: MACD bearish crossover below zero, bearish momentum accelerating | EMA5 < EMA8 < EMA13, bearish alignment | KDJ bearish crossover, short-term outlook bearish (K: 36.5, D: 41.5) | Volume increased (2.3x)
════════════════════
🔔 Follow for real-time market updates 🔔
#多周期共振 #INTC #NOK #INTW
📌 When trading, check whether the candlestick pattern meets the criteria
16
Verified
#EarningsSeason
🚨 $NOK NOKIA BEATS Q3 2026 EARNINGS ESTIMATES! 🔥
Nokia is pushing deeper into the AI infrastructure race! 🤖📈
🟢 Revenue: €5.15B vs. €5.04B expected
🟢 Adjusted EPS: €0.09 vs. €0.06 expected
🟢 Operating Profit: €605M vs. €442M expected
🟢 AI & Cloud Sales: +123% YoY
🟢 AI & Cloud Orders: €1.5B
🚀 The bigger story? Optical networks, IP networking and AI infrastructure are driving growth as Nokia expands its position in the AI boom.
📊 FY2026 operating profit outlook: €2.1B–€2.6B.
👀 Can $NOK become a major AI infrastructure winner, or is the growth already priced in?
Follow for more earnings and market updates.
#NOK #EarningsSeason #StockAnalysis #AI
$NOK
{future}(NOKUSDT)
#EarningsSeason
🚨 $NOK NOKIA BEATS Q3 2026 EARNINGS ESTIMATES! 🔥
Nokia is pushing deeper into the AI infrastructure race! 🤖📈
🟢 Revenue: €5.15B vs. €5.04B expected
🟢 Adjusted EPS: €0.09 vs. €0.06 expected
🟢 Operating Profit: €605M vs. €442M expected
🟢 AI & Cloud Sales: +123% YoY
🟢 AI & Cloud Orders: €1.5B
🚀 The bigger story? Optical networks, IP networking and AI infrastructure are driving growth as Nokia expands its position in the AI boom.
📊 FY2026 operating profit outlook: €2.1B–€2.6B.
👀 Can $NOK become a major AI infrastructure winner, or is the growth already priced in?
Follow for more earnings and market updates.
#NOK #EarningsSeason #StockAnalysis #AI
$NOK
🚨 $NOK NOKIA BEATS Q3 2026 EARNINGS ESTIMATES! 🔥
Nokia is pushing deeper into the AI infrastructure race! 🤖📈
🟢 Revenue: €5.15B vs. €5.04B expected
🟢 Adjusted EPS: €0.09 vs. €0.06 expected
🟢 Operating Profit: €605M vs. €442M expected
🟢 AI & Cloud Sales: +123% YoY
🟢 AI & Cloud Orders: €1.5B
🚀 The bigger story? Optical networks, IP networking and AI infrastructure are driving growth as Nokia expands its position in the AI boom.
📊 FY2026 operating profit outlook: €2.1B–€2.6B.
👀 Can $NOK become a major AI infrastructure winner, or is the growth already priced in?
Follow for more earnings and market updates.
#NOK #EarningsSeason #StockAnalysis #AI
$NOK
2
826
·
--
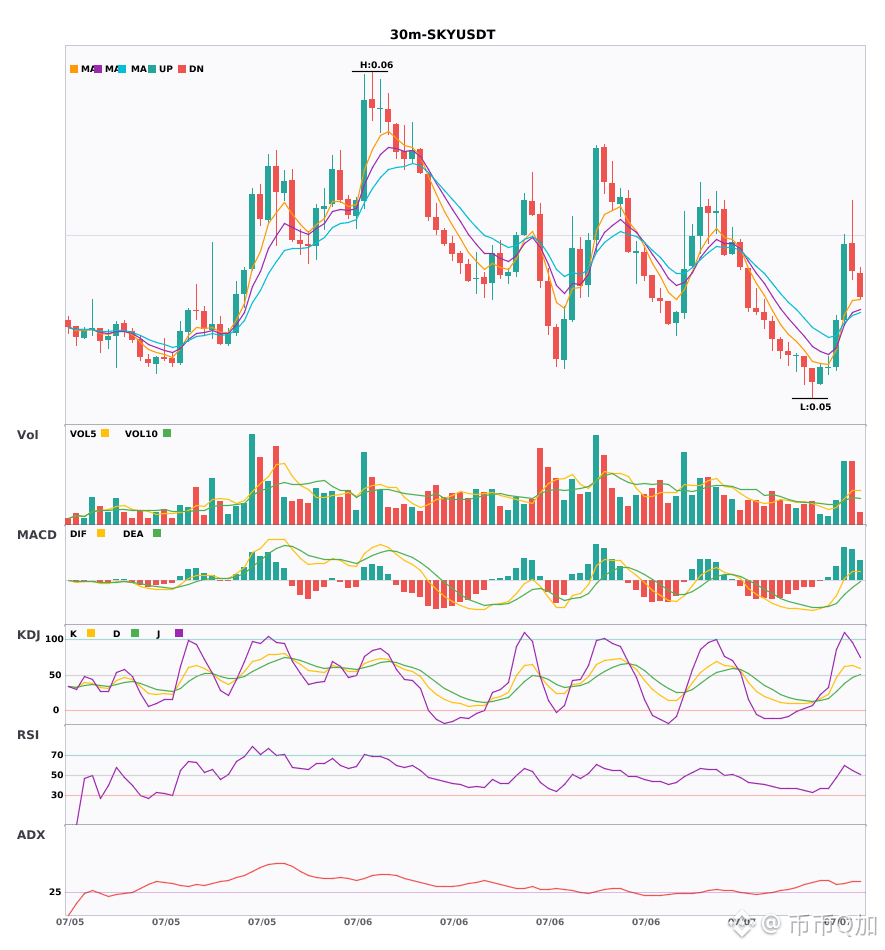
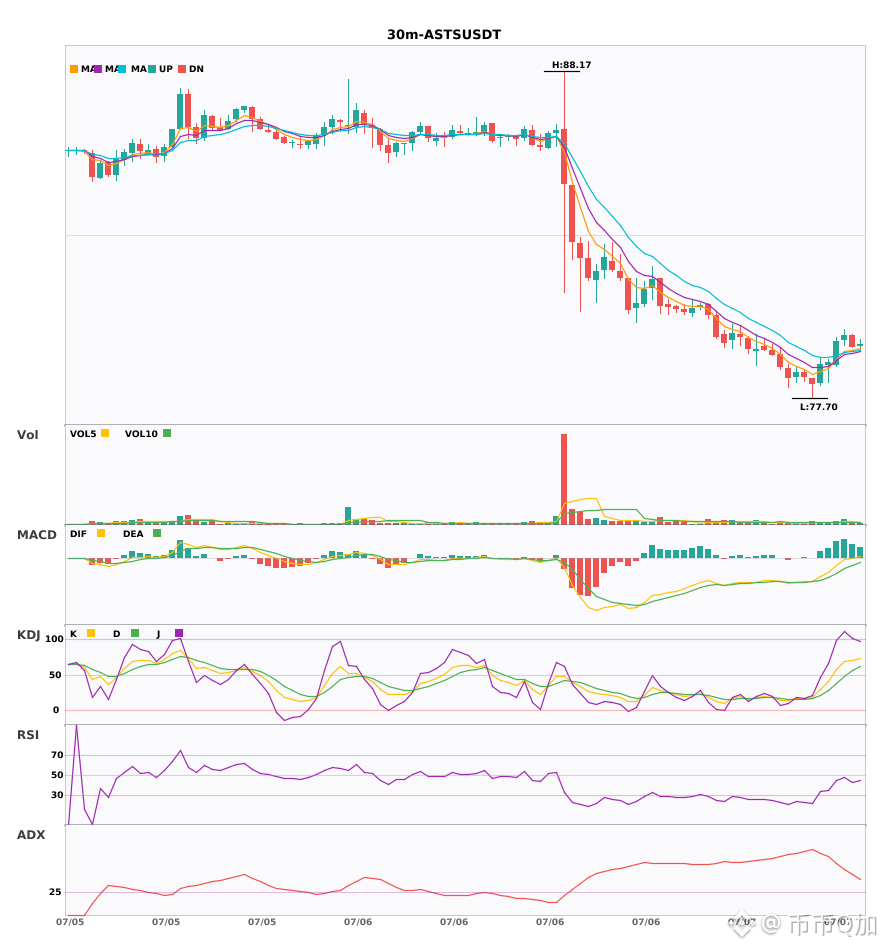
$NOK / $SKY / $ASTS 30 minutes resonance turned to more (bullish), and bullish signals appear at the same time
📖 Interpretation of $NOK
🟢 Bullish signal
▸ Strategy: 30-minute bullish signal
▸ Analysis: ADX shows the trend is strong, and MACD has turned bullish. Moving averages are sticking together, awaiting a breakout. KDJ has a bullish advantage, and volume is expanding—so the outlook is mainly bullish.
▸ Price change: 0.2400% (Note: price change is for reference only and does not constitute investment advice)
💡 Tip: Multi-timeframe analysis compares price movements across different time dimensions to help identify more reliable trading signals.
📖 Interpretation of $SKY
🟢 Bullish signal
▸ Strategy: 30-minute bullish signal
▸ Analysis: The ADX value is 41, indicating a clear trend. MACD breaks above the zero line to turn bullish. A golden cross forms on the moving averages. Trading volume expands by 2.6x—bullish signals are strong.
▸ Price change: 1.4600% (Note: price change is for reference only and does not constitute investment advice)
💡 Tip: Multi-timeframe analysis compares price movements across different time dimensions to help identify more reliable trading signals.
📖 Interpretation of $ASTS
🟢 Bullish signal
▸ Strategy: 30-minute bullish signal
▸ Analysis: ADX (44) shows a clearly trending market | MACD DIF breaks above the zero line, trend turns bullish | Moving averages are closely clustered, building momentum and about to choose a direction | KDJ is running strongly, with bulls in control (K=70.8, D=55.8) | Volume expands (2.1x)
▸ Price change: -0.5000% (Note: price change is for reference only and does not constitute investment advice)
💡 Tip: Multi-timeframe analysis compares price movements across different time dimensions to help identify more reliable trading signals.
⚠️ The above is only for technical analysis learning and communication, and does not constitute any investment advice
#技术分析 #NOK #SKY #ASTS
📌 The above content is for reference only and does not constitute investment advice
$NOK / $SKY / $ASTS 30 minutes resonance turned to more (bullish), and bullish signals appear at the same time
📖 Interpretation of $NOK
🟢 Bullish signal
▸ Strategy: 30-minute bullish signal
▸ Analysis: ADX shows the trend is strong, and MACD has turned bullish. Moving averages are sticking together, awaiting a breakout. KDJ has a bullish advantage, and volume is expanding—so the outlook is mainly bullish.
▸ Price change: 0.2400% (Note: price change is for reference only and does not constitute investment advice)
💡 Tip: Multi-timeframe analysis compares price movements across different time dimensions to help identify more reliable trading signals.
📖 Interpretation of $SKY
🟢 Bullish signal
▸ Strategy: 30-minute bullish signal
▸ Analysis: The ADX value is 41, indicating a clear trend. MACD breaks above the zero line to turn bullish. A golden cross forms on the moving averages. Trading volume expands by 2.6x—bullish signals are strong.
▸ Price change: 1.4600% (Note: price change is for reference only and does not constitute investment advice)
💡 Tip: Multi-timeframe analysis compares price movements across different time dimensions to help identify more reliable trading signals.
📖 Interpretation of $ASTS
🟢 Bullish signal
▸ Strategy: 30-minute bullish signal
▸ Analysis: ADX (44) shows a clearly trending market | MACD DIF breaks above the zero line, trend turns bullish | Moving averages are closely clustered, building momentum and about to choose a direction | KDJ is running strongly, with bulls in control (K=70.8, D=55.8) | Volume expands (2.1x)
▸ Price change: -0.5000% (Note: price change is for reference only and does not constitute investment advice)
💡 Tip: Multi-timeframe analysis compares price movements across different time dimensions to help identify more reliable trading signals.
⚠️ The above is only for technical analysis learning and communication, and does not constitute any investment advice
#技术分析 #NOK #SKY #ASTS
📌 The above content is for reference only and does not constitute investment advice
📖 Interpretation of $NOK
🟢 Bullish signal
▸ Strategy: 30-minute bullish signal
▸ Analysis: ADX shows the trend is strong, and MACD has turned bullish. Moving averages are sticking together, awaiting a breakout. KDJ has a bullish advantage, and volume is expanding—so the outlook is mainly bullish.
▸ Price change: 0.2400% (Note: price change is for reference only and does not constitute investment advice)
💡 Tip: Multi-timeframe analysis compares price movements across different time dimensions to help identify more reliable trading signals.
📖 Interpretation of $SKY
🟢 Bullish signal
▸ Strategy: 30-minute bullish signal
▸ Analysis: The ADX value is 41, indicating a clear trend. MACD breaks above the zero line to turn bullish. A golden cross forms on the moving averages. Trading volume expands by 2.6x—bullish signals are strong.
▸ Price change: 1.4600% (Note: price change is for reference only and does not constitute investment advice)
💡 Tip: Multi-timeframe analysis compares price movements across different time dimensions to help identify more reliable trading signals.
📖 Interpretation of $ASTS
🟢 Bullish signal
▸ Strategy: 30-minute bullish signal
▸ Analysis: ADX (44) shows a clearly trending market | MACD DIF breaks above the zero line, trend turns bullish | Moving averages are closely clustered, building momentum and about to choose a direction | KDJ is running strongly, with bulls in control (K=70.8, D=55.8) | Volume expands (2.1x)
▸ Price change: -0.5000% (Note: price change is for reference only and does not constitute investment advice)
💡 Tip: Multi-timeframe analysis compares price movements across different time dimensions to help identify more reliable trading signals.
⚠️ The above is only for technical analysis learning and communication, and does not constitute any investment advice
#技术分析 #NOK #SKY #ASTS
📌 The above content is for reference only and does not constitute investment advice
492

·
--
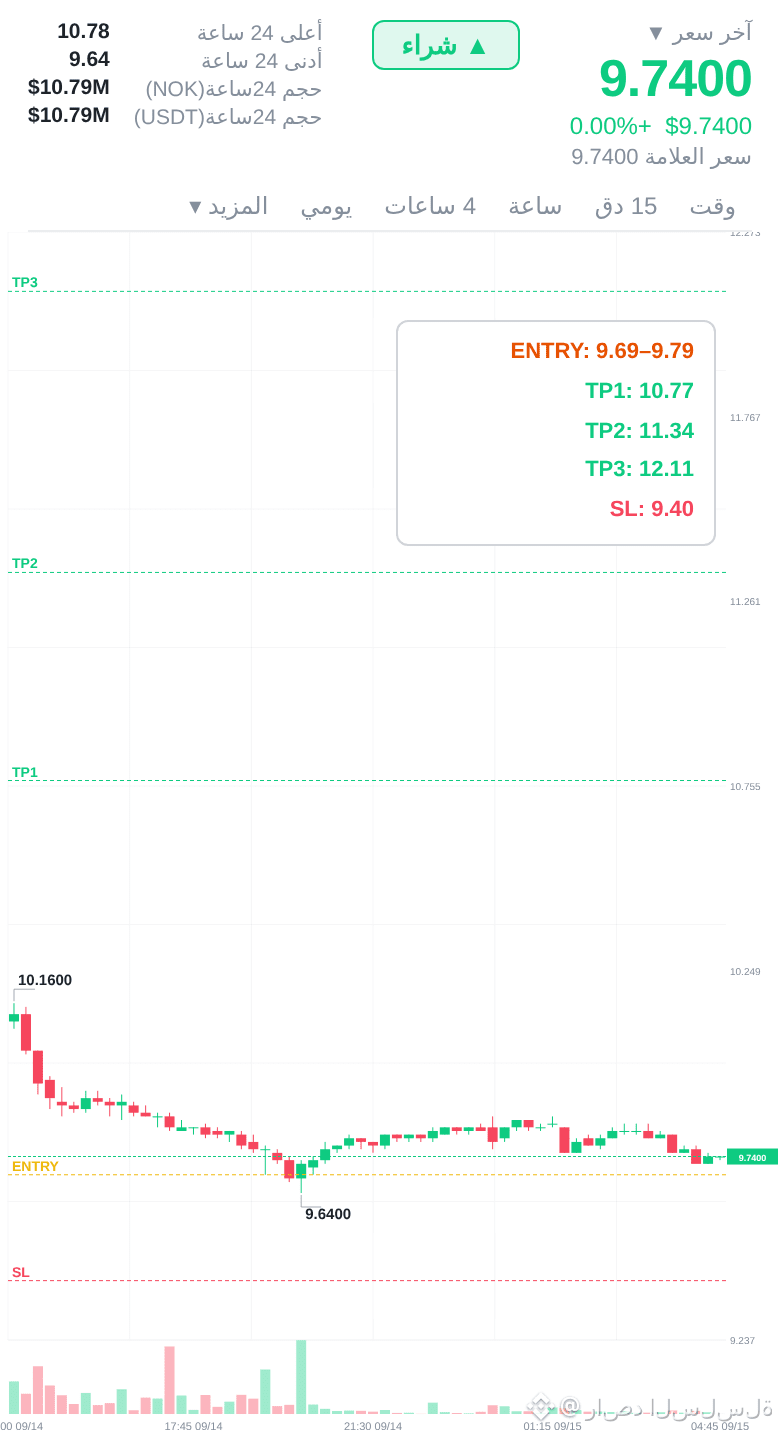
NO continuation is clear... The long position is still active and not going away
Either trading the setup or trading the story. The setup is what matters.
Continuation — 📈 Buy
Here’s what the data says:
📈 If yes, here’s the plan:
📈 Entry: 9.69 – 9.79
🛑 Stop loss: 9.40
🎯 Target 1: 10.77
🎯 Target 2: 11.34
🎯 Target 3: 12.11
📊 Confidence: 78%
Risk management is everything in crypto. Set your stop before entering.
Small size, let the trade breathe, let it run.
Risk is defined. Opportunity is clear. Execute with discipline.
Opportunity is for the bold 👈 $NOK 👉 Now
#NOK $SOL $BTC
NO continuation is clear... The long position is still active and not going away
Either trading the setup or trading the story. The setup is what matters.
Continuation — 📈 Buy
Here’s what the data says:
📈 If yes, here’s the plan:
📈 Entry: 9.69 – 9.79
🛑 Stop loss: 9.40
🎯 Target 1: 10.77
🎯 Target 2: 11.34
🎯 Target 3: 12.11
📊 Confidence: 78%
Risk management is everything in crypto. Set your stop before entering.
Small size, let the trade breathe, let it run.
Risk is defined. Opportunity is clear. Execute with discipline.
Opportunity is for the bold 👈 $NOK 👉 Now
#NOK $SOL $BTC
Either trading the setup or trading the story. The setup is what matters.
Continuation — 📈 Buy
Here’s what the data says:
📈 If yes, here’s the plan:
📈 Entry: 9.69 – 9.79
🛑 Stop loss: 9.40
🎯 Target 1: 10.77
🎯 Target 2: 11.34
🎯 Target 3: 12.11
📊 Confidence: 78%
Risk management is everything in crypto. Set your stop before entering.
Small size, let the trade breathe, let it run.
Risk is defined. Opportunity is clear. Execute with discipline.
Opportunity is for the bold 👈 $NOK 👉 Now
#NOK $SOL $BTC
10

·
--
Old Dog took a quick look at NOK's 5.26% gain, and to be honest, my first reaction wasn’t joy but a frown. At a price of 17.21 with a positive funding rate of 0.00556947, the bulls are paying the bears a hefty interest of 1.5% daily. This structure was seen once back in December last year, where it rallied for three days then crashed back to the starting point on the fourth day. With over 60 million in volume over 24 hours, it’s not huge; OI is just over 800,000. If it were another coin, I might feel okay, but on a semiconductor chain, this concentration of positions makes Old Dog a bit uneasy.
In the communications infrastructure side hustle, NOK's position in this AI narrative is actually quite awkward. The market talks about computing power and GPUs focusing on Nvidia, and for storage, they look to Micron for HBM. When it comes to Nokia, the slice of the pie in communication equipment is at the tail end of the AI chain. The money goes into chip design first, then into manufacturing, followed by packaging and testing, and only then does communication infrastructure come into play. So this rise is less about narrative driving and more about funds rotating internally within the semiconductor space. Old Dog has been watching this sector for two weeks and noticed a detail: similar communication equipment targets have basically remained stagnant this week, while NOK has pulled ahead by itself. This kind of independent movement without sector resonance usually indicates a short-term funds behavior, not a trend funds entry.
The positive funding rate needs to be clarified. A funding rate greater than zero means the bulls are paying the bears, indicating that long positions are crowded. As the price rises, if the funding rate increases, it means the bulls are profiting while bleeding out. I calculated that at this funding rate level, if held for three days without an increase, the funding cost alone would eat up half a point. Institutions doing quant would have already run these numbers. Back in 2021, when DOGE shot up to 0.7, the funding rate spiked above 0.01, and we all know what happened next. It's not about saying it will drop; it's about how this price level offers very low cost-effectiveness for opening new long positions—you’re just lifting the previous holders while paying their toll.
Old Dog's take is that if NOK breaks 18.5, I’ll chase it but only with a light position. If it drops below 16.3, I’m out completely; I’ll just watch the space in between. The market is singing that the AI chain can keep rising, but I actually think differentiation is about to start. Only chip manufacturers with actual performance backing can still run, while the lagging targets that jumped on the concept might get drained at any moment. Old Dog has learned this lesson the hard way with MU, where I was watching it rise happily but then got stuck after chasing in, only to realize that wave was the tail end of a sector rotation.
Trading Tags: #BinanceFutures #TradFi #USDⓈM #NOK #NOKUSDT $NOK
Old Dog took a quick look at NOK's 5.26% gain, and to be honest, my first reaction wasn’t joy but a frown. At a price of 17.21 with a positive funding rate of 0.00556947, the bulls are paying the bears a hefty interest of 1.5% daily. This structure was seen once back in December last year, where it rallied for three days then crashed back to the starting point on the fourth day. With over 60 million in volume over 24 hours, it’s not huge; OI is just over 800,000. If it were another coin, I might feel okay, but on a semiconductor chain, this concentration of positions makes Old Dog a bit uneasy.
In the communications infrastructure side hustle, NOK's position in this AI narrative is actually quite awkward. The market talks about computing power and GPUs focusing on Nvidia, and for storage, they look to Micron for HBM. When it comes to Nokia, the slice of the pie in communication equipment is at the tail end of the AI chain. The money goes into chip design first, then into manufacturing, followed by packaging and testing, and only then does communication infrastructure come into play. So this rise is less about narrative driving and more about funds rotating internally within the semiconductor space. Old Dog has been watching this sector for two weeks and noticed a detail: similar communication equipment targets have basically remained stagnant this week, while NOK has pulled ahead by itself. This kind of independent movement without sector resonance usually indicates a short-term funds behavior, not a trend funds entry.
The positive funding rate needs to be clarified. A funding rate greater than zero means the bulls are paying the bears, indicating that long positions are crowded. As the price rises, if the funding rate increases, it means the bulls are profiting while bleeding out. I calculated that at this funding rate level, if held for three days without an increase, the funding cost alone would eat up half a point. Institutions doing quant would have already run these numbers. Back in 2021, when DOGE shot up to 0.7, the funding rate spiked above 0.01, and we all know what happened next. It's not about saying it will drop; it's about how this price level offers very low cost-effectiveness for opening new long positions—you’re just lifting the previous holders while paying their toll.
Old Dog's take is that if NOK breaks 18.5, I’ll chase it but only with a light position. If it drops below 16.3, I’m out completely; I’ll just watch the space in between. The market is singing that the AI chain can keep rising, but I actually think differentiation is about to start. Only chip manufacturers with actual performance backing can still run, while the lagging targets that jumped on the concept might get drained at any moment. Old Dog has learned this lesson the hard way with MU, where I was watching it rise happily but then got stuck after chasing in, only to realize that wave was the tail end of a sector rotation.
Trading Tags: #BinanceFutures #TradFi #USDⓈM #NOK #NOKUSDT $NOK
In the communications infrastructure side hustle, NOK's position in this AI narrative is actually quite awkward. The market talks about computing power and GPUs focusing on Nvidia, and for storage, they look to Micron for HBM. When it comes to Nokia, the slice of the pie in communication equipment is at the tail end of the AI chain. The money goes into chip design first, then into manufacturing, followed by packaging and testing, and only then does communication infrastructure come into play. So this rise is less about narrative driving and more about funds rotating internally within the semiconductor space. Old Dog has been watching this sector for two weeks and noticed a detail: similar communication equipment targets have basically remained stagnant this week, while NOK has pulled ahead by itself. This kind of independent movement without sector resonance usually indicates a short-term funds behavior, not a trend funds entry.
The positive funding rate needs to be clarified. A funding rate greater than zero means the bulls are paying the bears, indicating that long positions are crowded. As the price rises, if the funding rate increases, it means the bulls are profiting while bleeding out. I calculated that at this funding rate level, if held for three days without an increase, the funding cost alone would eat up half a point. Institutions doing quant would have already run these numbers. Back in 2021, when DOGE shot up to 0.7, the funding rate spiked above 0.01, and we all know what happened next. It's not about saying it will drop; it's about how this price level offers very low cost-effectiveness for opening new long positions—you’re just lifting the previous holders while paying their toll.
Old Dog's take is that if NOK breaks 18.5, I’ll chase it but only with a light position. If it drops below 16.3, I’m out completely; I’ll just watch the space in between. The market is singing that the AI chain can keep rising, but I actually think differentiation is about to start. Only chip manufacturers with actual performance backing can still run, while the lagging targets that jumped on the concept might get drained at any moment. Old Dog has learned this lesson the hard way with MU, where I was watching it rise happily but then got stuck after chasing in, only to realize that wave was the tail end of a sector rotation.
Trading Tags: #BinanceFutures #TradFi #USDⓈM #NOK #NOKUSDT $NOK
44

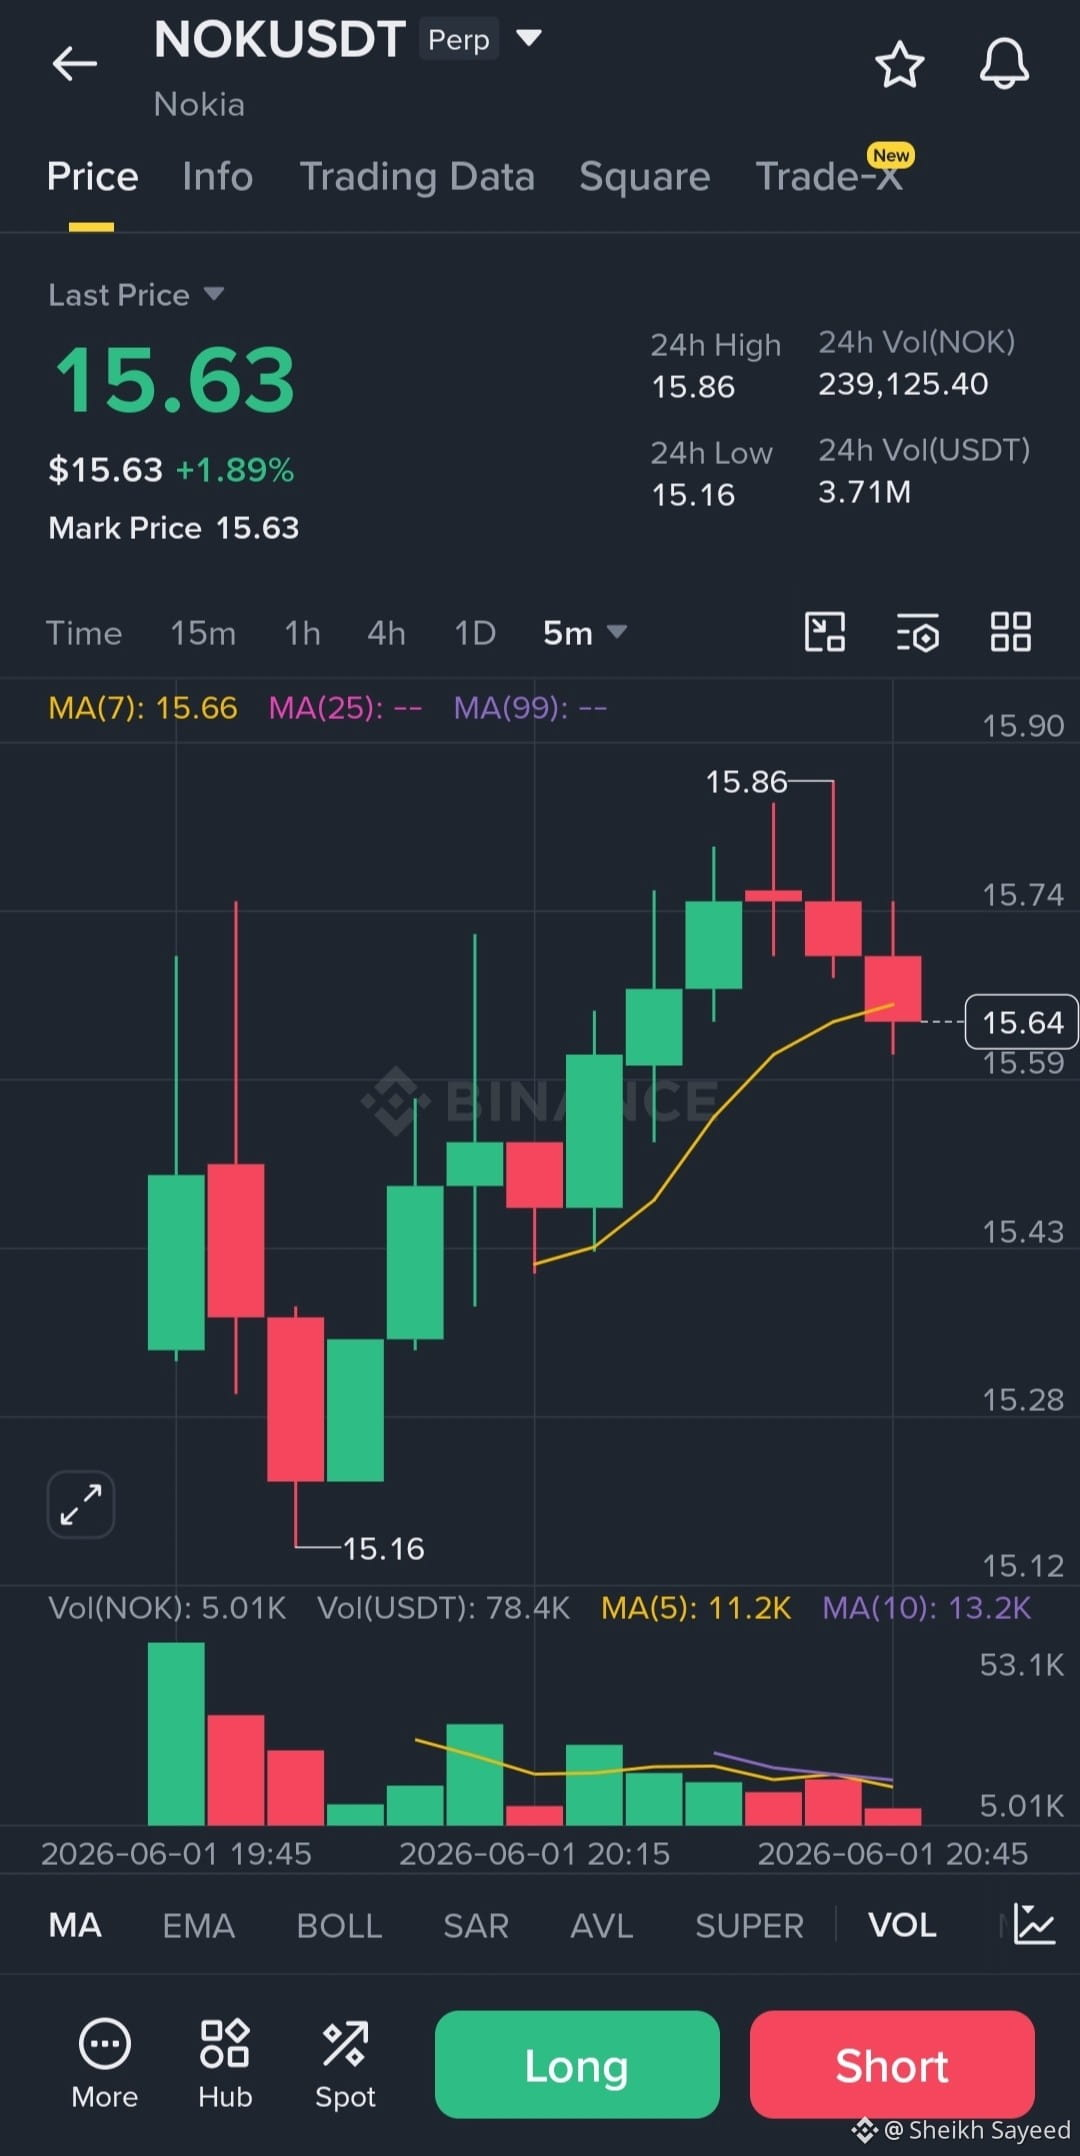
🚨 $NOK USDT Update
After an explosive launch, NOK pushed to 15.86 before facing resistance. The market is now cooling as early traders take profits.
📈 Bulls need to defend 15.55 to keep momentum alive.
📉 A break below support could trigger a deeper pullback.
Smart traders are watching for confirmation, not chasing candles. In new listings, patience often beats FOMO.
#NOK #NOKUSDT #BinanceFutures #Crypto #BinanceSquare
🚨 $NOK USDT Update
After an explosive launch, NOK pushed to 15.86 before facing resistance. The market is now cooling as early traders take profits.
📈 Bulls need to defend 15.55 to keep momentum alive.
📉 A break below support could trigger a deeper pullback.
Smart traders are watching for confirmation, not chasing candles. In new listings, patience often beats FOMO.
#NOK #NOKUSDT #BinanceFutures #Crypto #BinanceSquare
After an explosive launch, NOK pushed to 15.86 before facing resistance. The market is now cooling as early traders take profits.
📈 Bulls need to defend 15.55 to keep momentum alive.
📉 A break below support could trigger a deeper pullback.
Smart traders are watching for confirmation, not chasing candles. In new listings, patience often beats FOMO.
#NOK #NOKUSDT #BinanceFutures #Crypto #BinanceSquare
575

·
--
Bullish
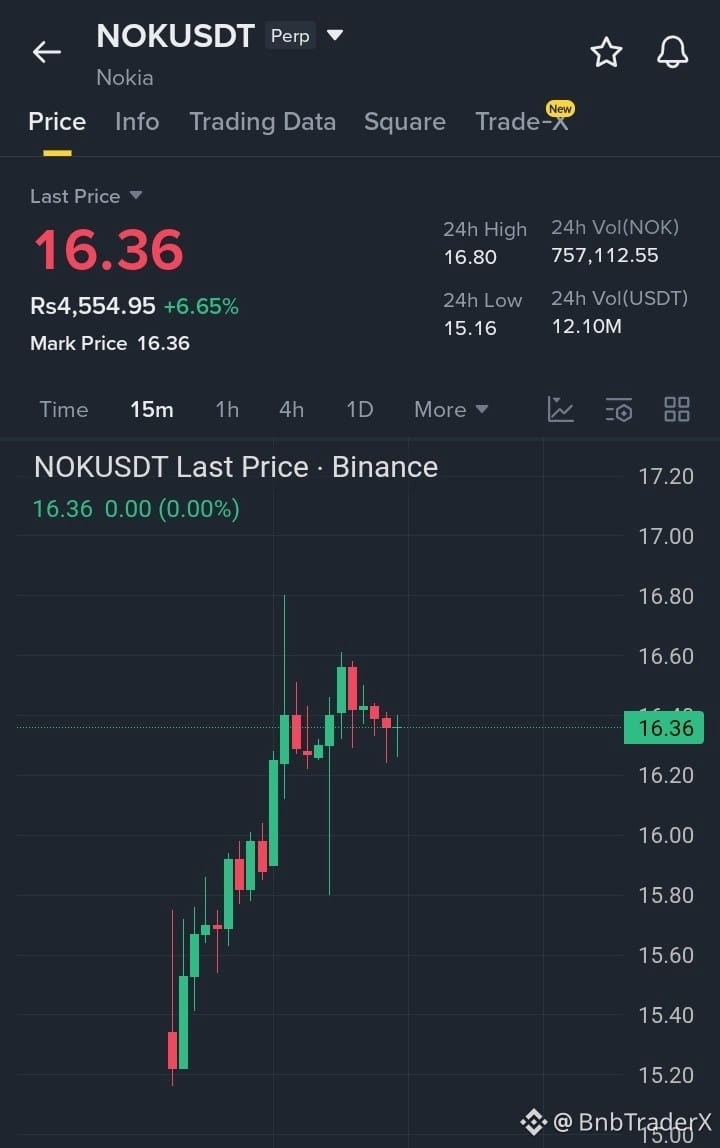
$NOK is shifting into a short-term consolidation phase on the 15-minute chart, currently trading around 16.36 with a solid +6.65% daily gain. After a strong, steady upward trend from its 24-hour low of 15.16, the price peaked with a sharp wick up to 16.80. Following that rejection, the asset has entered a tight sideways range, printing smaller candles as it stabilizes. This cooling-off period shows the market is catching its breath, holding onto the majority of its daily gains while building a structure for its next directional impulse.
16.80
17.20
17.65
#NOK #Nokia #DePIN
{future}(NOKUSDT)
$NOK is shifting into a short-term consolidation phase on the 15-minute chart, currently trading around 16.36 with a solid +6.65% daily gain. After a strong, steady upward trend from its 24-hour low of 15.16, the price peaked with a sharp wick up to 16.80. Following that rejection, the asset has entered a tight sideways range, printing smaller candles as it stabilizes. This cooling-off period shows the market is catching its breath, holding onto the majority of its daily gains while building a structure for its next directional impulse.
16.80
17.20
17.65
#NOK #Nokia #DePIN
16.80
17.20
17.65
#NOK #Nokia #DePIN
2
570

·
--
Bearish
NOK again showing weak long clusters wiped
No recovery strength visible yet
$NOK
{future}(NOKUSDT)
🔴 LIQUIDITY ZONE HIT 🔴
Long liquidation spotted 🧨
$1.0681K cleared at $16.82
Downside liquidity swept — watch reaction 👀
🎯 TP Targets:
TP1: ~$16.70
TP2: ~$16.56
TP3: ~$16.40
#nok
NOK again showing weak long clusters wiped
No recovery strength visible yet
$NOK
🔴 LIQUIDITY ZONE HIT 🔴
Long liquidation spotted 🧨
$1.0681K cleared at $16.82
Downside liquidity swept — watch reaction 👀
🎯 TP Targets:
TP1: ~$16.70
TP2: ~$16.56
TP3: ~$16.40
#nok
No recovery strength visible yet
$NOK
🔴 LIQUIDITY ZONE HIT 🔴
Long liquidation spotted 🧨
$1.0681K cleared at $16.82
Downside liquidity swept — watch reaction 👀
🎯 TP Targets:
TP1: ~$16.70
TP2: ~$16.56
TP3: ~$16.40
#nok
1
542

·
--
Bearish
The market remains highly reactive as traders adjust to aggressive volatility 💥
Liquidity events continue to trigger sharp directional moves!
$NOK
{future}(NOKUSDT)
🔴 LIQUIDITY ZONE HIT 🔴
Long liquidation spotted 🧨
$1.9247K cleared at $15.63
Downside liquidity swept — react NOW or watch the market shift 👀
🎯 TP Targets:
TP1: ~$15.40
TP2: ~$15.20
TP3: ~$15.00
#nok
The market remains highly reactive as traders adjust to aggressive volatility 💥
Liquidity events continue to trigger sharp directional moves!
$NOK
🔴 LIQUIDITY ZONE HIT 🔴
Long liquidation spotted 🧨
$1.9247K cleared at $15.63
Downside liquidity swept — react NOW or watch the market shift 👀
🎯 TP Targets:
TP1: ~$15.40
TP2: ~$15.20
TP3: ~$15.00
#nok
Liquidity events continue to trigger sharp directional moves!
$NOK
🔴 LIQUIDITY ZONE HIT 🔴
Long liquidation spotted 🧨
$1.9247K cleared at $15.63
Downside liquidity swept — react NOW or watch the market shift 👀
🎯 TP Targets:
TP1: ~$15.40
TP2: ~$15.20
TP3: ~$15.00
#nok
9

·
--
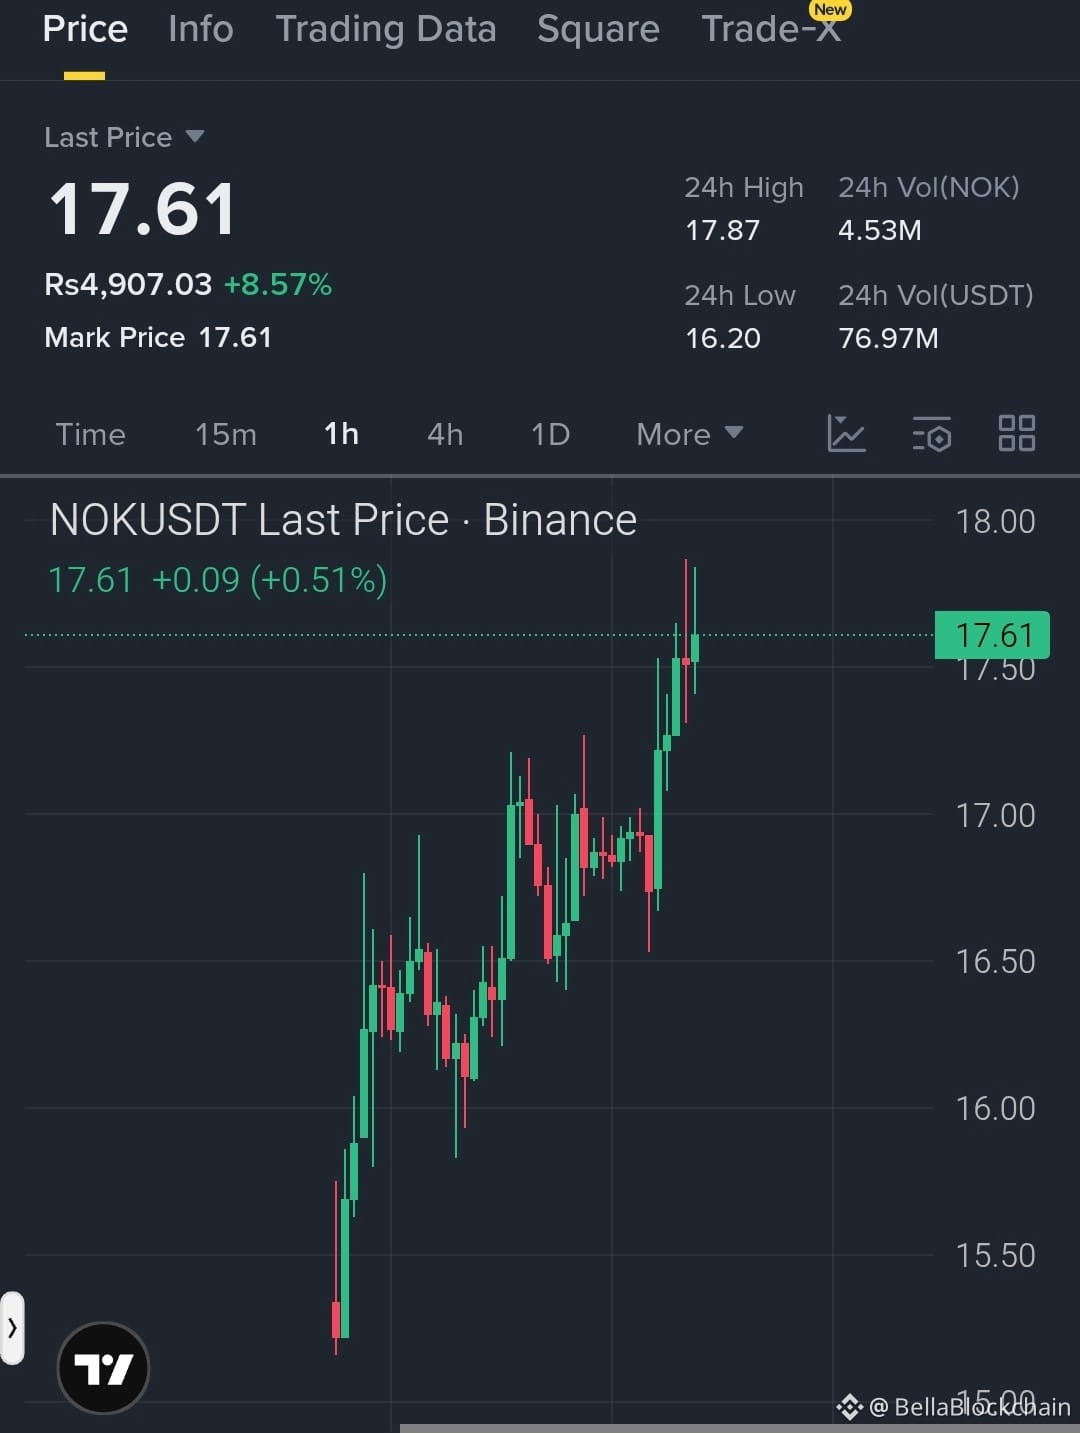
$NOK is demonstrating an aggressive bullish trend as buyers firmly control the price action. The asset has booked an impressive 8.57% gain over the past 24 hours, currently holding strong at a last price of 17.61. After creating a stable floor near the daily low of 16.20, it surged consistently to challenge its 24-hour high of 17.87. With strong volume sustaining this upward momentum and a clear pattern of higher lows, the market structure looks highly favorable for a continued breakout into higher key levels.
* Target 1: 18.50
* Target 2: 19.20
* Target 3: 20.00
#NOK #Crypto #Trading
$NOK is demonstrating an aggressive bullish trend as buyers firmly control the price action. The asset has booked an impressive 8.57% gain over the past 24 hours, currently holding strong at a last price of 17.61. After creating a stable floor near the daily low of 16.20, it surged consistently to challenge its 24-hour high of 17.87. With strong volume sustaining this upward momentum and a clear pattern of higher lows, the market structure looks highly favorable for a continued breakout into higher key levels.
* Target 1: 18.50
* Target 2: 19.20
* Target 3: 20.00
#NOK #Crypto #Trading
* Target 1: 18.50
* Target 2: 19.20
* Target 3: 20.00
#NOK #Crypto #Trading
1
334
$NOK took a hit of 8.74% in one day, current price is 13.57, purely a tariff sentiment play. With Trump's policies doing the cha-cha, and trade frictions heating up, these traditional industrial equity contracts are taking the brunt. Funding rate is at 0.00006352, bulls are still holding on and paying up, with a position of 795,000 not dropping significantly, indicating a bunch of folks are stuck.
With political instability, don’t get all lovey-dovey with stories about these on-chain industrial stock contracts. I’m going for a short, putting in 5% of my position, and setting a stop-loss above 14.2. If the bears can push it below the 13 level, I’ll consider adding to my position.
Trading Tag: #TradFi #链上美股 #NOK
How much impact will policy changes have on NOK?
$NOK took a hit of 8.74% in one day, current price is 13.57, purely a tariff sentiment play. With Trump's policies doing the cha-cha, and trade frictions heating up, these traditional industrial equity contracts are taking the brunt. Funding rate is at 0.00006352, bulls are still holding on and paying up, with a position of 795,000 not dropping significantly, indicating a bunch of folks are stuck.
With political instability, don’t get all lovey-dovey with stories about these on-chain industrial stock contracts. I’m going for a short, putting in 5% of my position, and setting a stop-loss above 14.2. If the bears can push it below the 13 level, I’ll consider adding to my position.
Trading Tag: #TradFi #链上美股 #NOK
How much impact will policy changes have on NOK?
With political instability, don’t get all lovey-dovey with stories about these on-chain industrial stock contracts. I’m going for a short, putting in 5% of my position, and setting a stop-loss above 14.2. If the bears can push it below the 13 level, I’ll consider adding to my position.
Trading Tag: #TradFi #链上美股 #NOK
How much impact will policy changes have on NOK?
450

·
--
$NOK Latest Market Update 🚀
Long/Short: Consolidation
Entry: 13.4837–13.6363
Stop Loss: 13.4000
Targets: 13.7189/13.8461/14.0050
Analysis: Man, I'm really feeling this, NOK at 13.56, the EMA lines are sticking together like bubblegum, just 0.02 between 13.54 and 13.52, and what, a lonely cross? RSI's sitting at 52.1, if you say it's strong, it’s soft; if you say it’s weak, it just won't drop, classic high-level consolidation dragging its feet. I'm banging my head here, yesterday I saw 13.55 and thought about jumping in, but then I saw that moving average all jumbled up, so I held back; today it looks the same. Stop loss set at 13.40, just a few points of wiggle room, opening a position feels like a prison sentence, one little fake-out and you’re out. You talk about a breakout? Breakout of what, the range isn’t even clear yet, just waiting to see if it breaks through 13.60 or drops below 13.40, otherwise, getting in is just handing over fees to the exchange, it’s exhausting.
Risk Warning: Suggested stop loss level: 13.400000, please adjust your position size according to your risk tolerance.
#NOK
$NOK Latest Market Update 🚀
Long/Short: Consolidation
Entry: 13.4837–13.6363
Stop Loss: 13.4000
Targets: 13.7189/13.8461/14.0050
Analysis: Man, I'm really feeling this, NOK at 13.56, the EMA lines are sticking together like bubblegum, just 0.02 between 13.54 and 13.52, and what, a lonely cross? RSI's sitting at 52.1, if you say it's strong, it’s soft; if you say it’s weak, it just won't drop, classic high-level consolidation dragging its feet. I'm banging my head here, yesterday I saw 13.55 and thought about jumping in, but then I saw that moving average all jumbled up, so I held back; today it looks the same. Stop loss set at 13.40, just a few points of wiggle room, opening a position feels like a prison sentence, one little fake-out and you’re out. You talk about a breakout? Breakout of what, the range isn’t even clear yet, just waiting to see if it breaks through 13.60 or drops below 13.40, otherwise, getting in is just handing over fees to the exchange, it’s exhausting.
Risk Warning: Suggested stop loss level: 13.400000, please adjust your position size according to your risk tolerance.
#NOK
Long/Short: Consolidation
Entry: 13.4837–13.6363
Stop Loss: 13.4000
Targets: 13.7189/13.8461/14.0050
Analysis: Man, I'm really feeling this, NOK at 13.56, the EMA lines are sticking together like bubblegum, just 0.02 between 13.54 and 13.52, and what, a lonely cross? RSI's sitting at 52.1, if you say it's strong, it’s soft; if you say it’s weak, it just won't drop, classic high-level consolidation dragging its feet. I'm banging my head here, yesterday I saw 13.55 and thought about jumping in, but then I saw that moving average all jumbled up, so I held back; today it looks the same. Stop loss set at 13.40, just a few points of wiggle room, opening a position feels like a prison sentence, one little fake-out and you’re out. You talk about a breakout? Breakout of what, the range isn’t even clear yet, just waiting to see if it breaks through 13.60 or drops below 13.40, otherwise, getting in is just handing over fees to the exchange, it’s exhausting.
Risk Warning: Suggested stop loss level: 13.400000, please adjust your position size according to your risk tolerance.
#NOK
397
Log in to explore more content
Join global crypto users on Binance Square
⚡️ Get latest and useful information about crypto.
💬 Trusted by the world’s largest crypto exchange.
👍 Discover real insights from verified creators.
Email / Phone number
Trending Topics
1
#CanBTCReboundAfterFallingBelow60K?
157,514 views
707 Discussing
2
#GlobalStocksFaceLongestLosingStreakSince2023
64,311 views
613 Discussing
3
#AnthropicPlungesTowardIPOPriceonDay2
25,416 views
277 Discussing
4
#BNBDropsBelow540USDTWith8.46%DailyDecline
1,897 views
49 Discussing
5
#BitMineFaces$10.1BUnrealizedETHLoss
0 views
1 Discussing
6
#StrategyReports$35BNetReserves
2 views
1 Discussing
7
#MorganStanleyEndsAnthropicStockSupportAfterOneDay
973 views
35 Discussing
8
#CryptoBilisAttackerMoves25000ETHToTornadoCash
1,384 views
39 Discussing
9
#FirstRealTimeDividendPaidInDigitalDollars
156 views
9 Discussing
10
#GaoTengBitcoinETFListsOnHKEX
40,658 views
413 Discussing