

#bitcointops
bitcointops
1,573 views
39 Discussing
Hot
Latest

·
--
Bullish
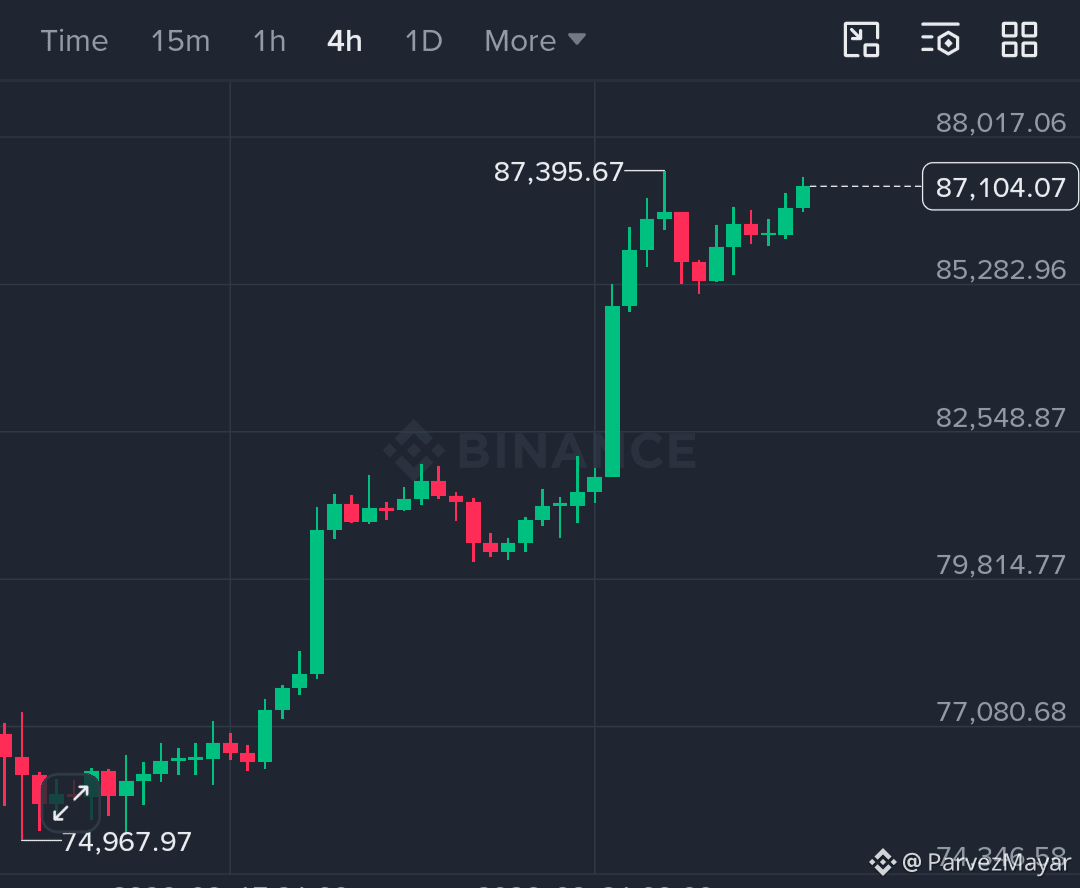
$BTC you just touched $87,395... highest level in about 8 months 🔥
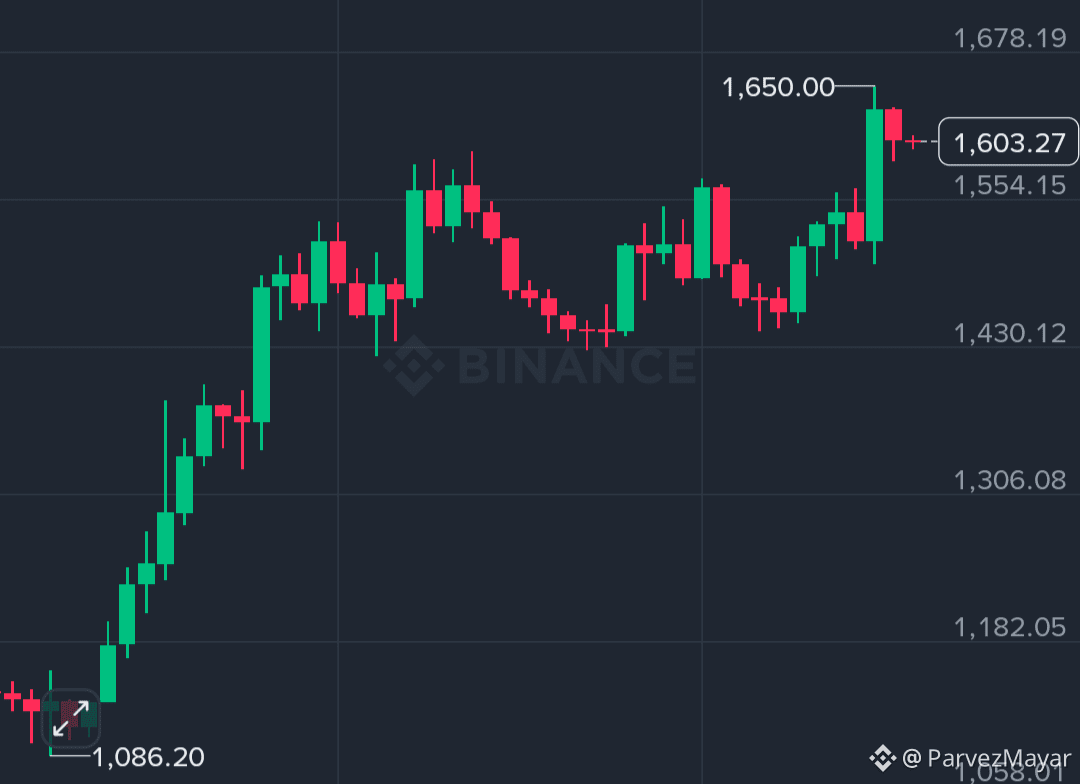
And at the SAME time $ZEC decided that $1,600 wasn’t enough and pushed it up to $1,650 😁
This is exactly the momentum we were waiting for...
Bitcoin went from $75K to $87K+ while ZEC went from around $1,086 to $1,650 on these charts.
And the shorts have paid dearly for fighting against this move 👀
During Bitcoin’s breakout above $87K, approximately $919M in CRYPTO SHORT positions were liquidated, with more than $557M coming just from BTC shorts.
ZEC has been doing the same thing on its own smaller battleground... recorded ZEC futures showed around $1.35M in shorts versus $520K in longs liquidated on September 22, after several liquidation sessions of much larger short size earlier during the run-up.
Now the levels I’m watching are simple...
$BTC: $87.4K → $88K next resistance
$ZEC: $1,650 → $1,680 area next
I’ve been bullish on both... but especially on ZEC while people kept waiting for that magical pullback below $500 😂
The momentum is strong, shorts are being squeezed, and BTC finally broke that $82K resistance it had been holding for a long time...
Just don’t turn this bullish momentum into an excuse for a dumb leverage play now 😁
#BitcoinTops $87KAtEightMonthHigh
#ZECBreaksAbove$1600AtRecordHigh
$BTC you just touched $87,395... highest level in about 8 months 🔥
And at the SAME time $ZEC decided that $1,600 wasn’t enough and pushed it up to $1,650 😁
This is exactly the momentum we were waiting for...
Bitcoin went from $75K to $87K+ while ZEC went from around $1,086 to $1,650 on these charts.
And the shorts have paid dearly for fighting against this move 👀
During Bitcoin’s breakout above $87K, approximately $919M in CRYPTO SHORT positions were liquidated, with more than $557M coming just from BTC shorts.
ZEC has been doing the same thing on its own smaller battleground... recorded ZEC futures showed around $1.35M in shorts versus $520K in longs liquidated on September 22, after several liquidation sessions of much larger short size earlier during the run-up.
Now the levels I’m watching are simple...
$BTC: $87.4K → $88K next resistance
$ZEC : $1,650 → $1,680 area next
I’ve been bullish on both... but especially on ZEC while people kept waiting for that magical pullback below $500 😂
The momentum is strong, shorts are being squeezed, and BTC finally broke that $82K resistance it had been holding for a long time...
Just don’t turn this bullish momentum into an excuse for a dumb leverage play now 😁
#BitcoinTops $87KAtEightMonthHigh
#ZECBreaksAbove$1600AtRecordHigh
And at the SAME time $ZEC decided that $1,600 wasn’t enough and pushed it up to $1,650 😁
This is exactly the momentum we were waiting for...
Bitcoin went from $75K to $87K+ while ZEC went from around $1,086 to $1,650 on these charts.
And the shorts have paid dearly for fighting against this move 👀
During Bitcoin’s breakout above $87K, approximately $919M in CRYPTO SHORT positions were liquidated, with more than $557M coming just from BTC shorts.
ZEC has been doing the same thing on its own smaller battleground... recorded ZEC futures showed around $1.35M in shorts versus $520K in longs liquidated on September 22, after several liquidation sessions of much larger short size earlier during the run-up.
Now the levels I’m watching are simple...
$BTC: $87.4K → $88K next resistance
$ZEC : $1,650 → $1,680 area next
I’ve been bullish on both... but especially on ZEC while people kept waiting for that magical pullback below $500 😂
The momentum is strong, shorts are being squeezed, and BTC finally broke that $82K resistance it had been holding for a long time...
Just don’t turn this bullish momentum into an excuse for a dumb leverage play now 😁
#BitcoinTops $87KAtEightMonthHigh
#ZECBreaksAbove$1600AtRecordHigh
493

·
--
📰 Why are miners suddenly turning against the tide? Bitcoin indicators reappear with signals from the start of the 2019/2023 bull markets
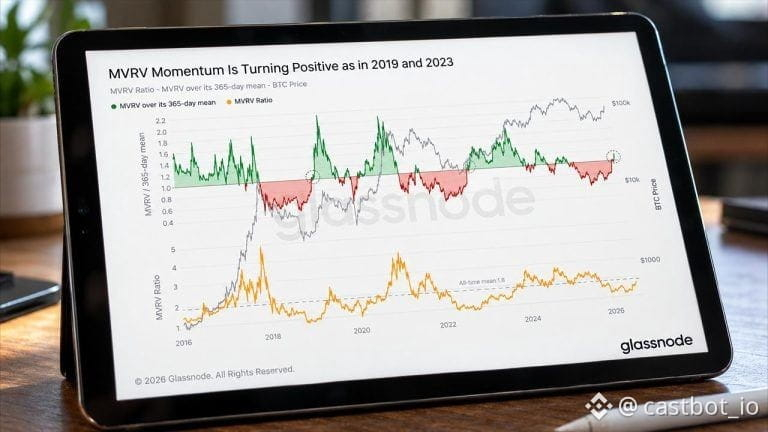
A key momentum indicator for Bitcoin has just crossed a critical threshold. This same signal also appeared when the bull markets began in 2019 and 2023. While historical similarities offer hope for a Bitcoin recovery, it doesn’t mean a bull market is coming immediately— the market still needs demand to be confirmed. According to Bitcoin.com, this indicator measures the degree of divergence between activity on the Bitcoin on-chain network and price. When the two become significantly misaligned, it often signals that the price is about to reverse.
Why is this news important?
In technical analysis, this indicator is known as a “momentum reversal signal.” In essence, it reflects the extreme positioning of market sentiment—when prices keep rising and trigger panic buying, or when prices fall and trigger panic selling, the market loses rationality and conditions form for a reversal. The 2019 and 2023 cases show that this signal appeared in at least the past three bull markets. That suggests it may be a reliable early warning. But the key is that the indicator itself is only a probabilistic event, not a certainty—it must be assessed together with the macro environment.
Market impact
For Bitcoin, this signal has appeared near the current price of $84,451.24, which does strengthen bullish expectations. Historical data shows that after the signal appears, Bitcoin typically experiences a rebound of about 10%-20% within a month. But the most important thing to watch is whether demand holds up—if Bitcoin rebounds to $90K but fails to attract new buying, this indicator could stop working. That means that if, over the next two weeks, ETH is unable to stay above $2,700, the reliability of this bullish signal will be greatly reduced.
Trading outlook
💡 This indicator suggests Bitcoin may see a corrective rebound in the short term, but only if market sentiment doesn’t continue to deteriorate. If ETH price keeps hovering below $2,700, this bullish signal will quickly become invalid. It is recommended to watch Bitcoin’s $80K–$82K support zone. If it breaks below, bullish expectations for the bull market should be reassessed.
This article has no project sponsorship, and the author does not hold the assets mentioned in the text
$BTC $ETH #BTC #ETH
⚠️ Not investment advice; forecasts are for reference only
#BitcoinTops$87KAtEightMonthHigh
📰 Why are miners suddenly turning against the tide? Bitcoin indicators reappear with signals from the start of the 2019/2023 bull markets
A key momentum indicator for Bitcoin has just crossed a critical threshold. This same signal also appeared when the bull markets began in 2019 and 2023. While historical similarities offer hope for a Bitcoin recovery, it doesn’t mean a bull market is coming immediately— the market still needs demand to be confirmed. According to Bitcoin.com, this indicator measures the degree of divergence between activity on the Bitcoin on-chain network and price. When the two become significantly misaligned, it often signals that the price is about to reverse.
Why is this news important?
In technical analysis, this indicator is known as a “momentum reversal signal.” In essence, it reflects the extreme positioning of market sentiment—when prices keep rising and trigger panic buying, or when prices fall and trigger panic selling, the market loses rationality and conditions form for a reversal. The 2019 and 2023 cases show that this signal appeared in at least the past three bull markets. That suggests it may be a reliable early warning. But the key is that the indicator itself is only a probabilistic event, not a certainty—it must be assessed together with the macro environment.
Market impact
For Bitcoin, this signal has appeared near the current price of $84,451.24, which does strengthen bullish expectations. Historical data shows that after the signal appears, Bitcoin typically experiences a rebound of about 10%-20% within a month. But the most important thing to watch is whether demand holds up—if Bitcoin rebounds to $90K but fails to attract new buying, this indicator could stop working. That means that if, over the next two weeks, ETH is unable to stay above $2,700, the reliability of this bullish signal will be greatly reduced.
Trading outlook
💡 This indicator suggests Bitcoin may see a corrective rebound in the short term, but only if market sentiment doesn’t continue to deteriorate. If ETH price keeps hovering below $2,700, this bullish signal will quickly become invalid. It is recommended to watch Bitcoin’s $80K–$82K support zone. If it breaks below, bullish expectations for the bull market should be reassessed.
This article has no project sponsorship, and the author does not hold the assets mentioned in the text
$BTC $ETH #BTC #ETH
⚠️ Not investment advice; forecasts are for reference only
#BitcoinTops$87KAtEightMonthHigh
A key momentum indicator for Bitcoin has just crossed a critical threshold. This same signal also appeared when the bull markets began in 2019 and 2023. While historical similarities offer hope for a Bitcoin recovery, it doesn’t mean a bull market is coming immediately— the market still needs demand to be confirmed. According to Bitcoin.com, this indicator measures the degree of divergence between activity on the Bitcoin on-chain network and price. When the two become significantly misaligned, it often signals that the price is about to reverse.
Why is this news important?
In technical analysis, this indicator is known as a “momentum reversal signal.” In essence, it reflects the extreme positioning of market sentiment—when prices keep rising and trigger panic buying, or when prices fall and trigger panic selling, the market loses rationality and conditions form for a reversal. The 2019 and 2023 cases show that this signal appeared in at least the past three bull markets. That suggests it may be a reliable early warning. But the key is that the indicator itself is only a probabilistic event, not a certainty—it must be assessed together with the macro environment.
Market impact
For Bitcoin, this signal has appeared near the current price of $84,451.24, which does strengthen bullish expectations. Historical data shows that after the signal appears, Bitcoin typically experiences a rebound of about 10%-20% within a month. But the most important thing to watch is whether demand holds up—if Bitcoin rebounds to $90K but fails to attract new buying, this indicator could stop working. That means that if, over the next two weeks, ETH is unable to stay above $2,700, the reliability of this bullish signal will be greatly reduced.
Trading outlook
💡 This indicator suggests Bitcoin may see a corrective rebound in the short term, but only if market sentiment doesn’t continue to deteriorate. If ETH price keeps hovering below $2,700, this bullish signal will quickly become invalid. It is recommended to watch Bitcoin’s $80K–$82K support zone. If it breaks below, bullish expectations for the bull market should be reassessed.
This article has no project sponsorship, and the author does not hold the assets mentioned in the text
$BTC $ETH #BTC #ETH
⚠️ Not investment advice; forecasts are for reference only
#BitcoinTops$87KAtEightMonthHigh
120

·
--
870,000 yuan peak still trending|BTC price around 84.7K|I’m taking a cautious view and won’t chase old news
My stance is neutral and slightly defensive. The Binance Square trend page still shows #BitcoinTops$87KAtEightMonthHigh, but the topic title describes a prior spike—it doesn’t mean that at the moment I’m posting, BTC is still above $87.0K. Hot-trending topics keep spreading, while price changes in real time; treating an old high as a current breakout makes it easiest to buy at the wrong spot during a pullback. Another trending topic talks about being blocked twice at $87,300, which shows the focus itself has shifted from “new high” to “whether the price can hold at high levels.” These two narratives can’t both be treated as confirmed bullish signals.
When I checked the KuCoin BTC/USDT spot market, the latest price was about $84,701.6, with a 24-hour high of $84,923 and a low of $82,868. The price rebounded from the low point, but it’s still some distance away from the 87.0K high on the trending board—and it hasn’t even broken the 24-hour high yet. The market reaction here looks more like a repair at lower levels than a renewed breakout. Of course, you can’t conclude that a larger timeframe trend has already turned bearish based on just a one-day range either. Short-term capital may be attracted by the hot topic, but it still requires real money to push the price through resistance and hold it; discussion volume isn’t the same as buy-side transaction volume.
Why does this matter for trading? BTC is the main risk anchor. When the trending list uses an old high, altcoins and perpetual contracts can easily inflate positions early based on the expectation that “BTC has broken out again.” If spot doesn’t break out in sync but futures pile up leverage first, the liquidation chain during a pullback could move faster. Conversely, if BTC reclaims the intraday high, and then recaptures 86,000 and 87,300, the market would have a basis to discuss a more sustained upside. The above is conditional scenario analysis, not a claim that I’ve already seen capital inflows or institutional buying. Corporate holdings should be confirmed by official company or SEC disclosures; personal social media hints can’t count as “increased today.”
My invalidation conditions are very specific: if, for a continuous one hour, BTC holds above 86,000 and the pullback doesn’t fail, then the old-high topic can regain price support—I’ll withdraw my current cautious judgment. If it breaks below 82,868 again, the low-level rebound assumption is void; I’ll preserve cash first. Also be especially alert to situations where price briefly pierces resistance and then rapidly closes back—don’t place orders based only on momentary quotes.
If this were my own trading, I wouldn’t participate, and I wouldn’t short against the trend. I’d only attempt a long with up to 0.5% of total funds if the spot price puts together two consecutive complete 15-minute candlesticks closing above $85,000, and the pullback holds in the $84,700–$85,000 range. First target: 86,000 (half off). Second target: 87,300 (close the remaining position). After entry, if within 15 minutes price closes below $84,200, I’d take half off. A hard stop-loss is set at $83,800; if it hits, I fully exit. If 82,868 is broken before the trigger, the plan is canceled. If during an upswing momentum fades and macro risk warms up again, I will主动平仓 even if the take-profit/stop hasn’t been hit yet. If trigger conditions aren’t met, there will be no trade—so there’s nothing to “review and reflect” on as profit.
Source: Binance Square Trending Topics real-time topics page; KuCoin BTC/USDT spot live quote. #BitcoinTops$87KAtEightMonthHigh #BTC
The above is only my personal market observation and does not constitute investment advice.
870,000 yuan peak still trending|BTC price around 84.7K|I’m taking a cautious view and won’t chase old news
My stance is neutral and slightly defensive. The Binance Square trend page still shows #BitcoinTops$87KAtEightMonthHigh, but the topic title describes a prior spike—it doesn’t mean that at the moment I’m posting, BTC is still above $87.0K. Hot-trending topics keep spreading, while price changes in real time; treating an old high as a current breakout makes it easiest to buy at the wrong spot during a pullback. Another trending topic talks about being blocked twice at $87,300, which shows the focus itself has shifted from “new high” to “whether the price can hold at high levels.” These two narratives can’t both be treated as confirmed bullish signals.
When I checked the KuCoin BTC/USDT spot market, the latest price was about $84,701.6, with a 24-hour high of $84,923 and a low of $82,868. The price rebounded from the low point, but it’s still some distance away from the 87.0K high on the trending board—and it hasn’t even broken the 24-hour high yet. The market reaction here looks more like a repair at lower levels than a renewed breakout. Of course, you can’t conclude that a larger timeframe trend has already turned bearish based on just a one-day range either. Short-term capital may be attracted by the hot topic, but it still requires real money to push the price through resistance and hold it; discussion volume isn’t the same as buy-side transaction volume.
Why does this matter for trading? BTC is the main risk anchor. When the trending list uses an old high, altcoins and perpetual contracts can easily inflate positions early based on the expectation that “BTC has broken out again.” If spot doesn’t break out in sync but futures pile up leverage first, the liquidation chain during a pullback could move faster. Conversely, if BTC reclaims the intraday high, and then recaptures 86,000 and 87,300, the market would have a basis to discuss a more sustained upside. The above is conditional scenario analysis, not a claim that I’ve already seen capital inflows or institutional buying. Corporate holdings should be confirmed by official company or SEC disclosures; personal social media hints can’t count as “increased today.”
My invalidation conditions are very specific: if, for a continuous one hour, BTC holds above 86,000 and the pullback doesn’t fail, then the old-high topic can regain price support—I’ll withdraw my current cautious judgment. If it breaks below 82,868 again, the low-level rebound assumption is void; I’ll preserve cash first. Also be especially alert to situations where price briefly pierces resistance and then rapidly closes back—don’t place orders based only on momentary quotes.
If this were my own trading, I wouldn’t participate, and I wouldn’t short against the trend. I’d only attempt a long with up to 0.5% of total funds if the spot price puts together two consecutive complete 15-minute candlesticks closing above $85,000, and the pullback holds in the $84,700–$85,000 range. First target: 86,000 (half off). Second target: 87,300 (close the remaining position). After entry, if within 15 minutes price closes below $84,200, I’d take half off. A hard stop-loss is set at $83,800; if it hits, I fully exit. If 82,868 is broken before the trigger, the plan is canceled. If during an upswing momentum fades and macro risk warms up again, I will主动平仓 even if the take-profit/stop hasn’t been hit yet. If trigger conditions aren’t met, there will be no trade—so there’s nothing to “review and reflect” on as profit.
Source: Binance Square Trending Topics real-time topics page; KuCoin BTC/USDT spot live quote. #BitcoinTops$87KAtEightMonthHigh #BTC
The above is only my personal market observation and does not constitute investment advice.
My stance is neutral and slightly defensive. The Binance Square trend page still shows #BitcoinTops$87KAtEightMonthHigh, but the topic title describes a prior spike—it doesn’t mean that at the moment I’m posting, BTC is still above $87.0K. Hot-trending topics keep spreading, while price changes in real time; treating an old high as a current breakout makes it easiest to buy at the wrong spot during a pullback. Another trending topic talks about being blocked twice at $87,300, which shows the focus itself has shifted from “new high” to “whether the price can hold at high levels.” These two narratives can’t both be treated as confirmed bullish signals.
When I checked the KuCoin BTC/USDT spot market, the latest price was about $84,701.6, with a 24-hour high of $84,923 and a low of $82,868. The price rebounded from the low point, but it’s still some distance away from the 87.0K high on the trending board—and it hasn’t even broken the 24-hour high yet. The market reaction here looks more like a repair at lower levels than a renewed breakout. Of course, you can’t conclude that a larger timeframe trend has already turned bearish based on just a one-day range either. Short-term capital may be attracted by the hot topic, but it still requires real money to push the price through resistance and hold it; discussion volume isn’t the same as buy-side transaction volume.
Why does this matter for trading? BTC is the main risk anchor. When the trending list uses an old high, altcoins and perpetual contracts can easily inflate positions early based on the expectation that “BTC has broken out again.” If spot doesn’t break out in sync but futures pile up leverage first, the liquidation chain during a pullback could move faster. Conversely, if BTC reclaims the intraday high, and then recaptures 86,000 and 87,300, the market would have a basis to discuss a more sustained upside. The above is conditional scenario analysis, not a claim that I’ve already seen capital inflows or institutional buying. Corporate holdings should be confirmed by official company or SEC disclosures; personal social media hints can’t count as “increased today.”
My invalidation conditions are very specific: if, for a continuous one hour, BTC holds above 86,000 and the pullback doesn’t fail, then the old-high topic can regain price support—I’ll withdraw my current cautious judgment. If it breaks below 82,868 again, the low-level rebound assumption is void; I’ll preserve cash first. Also be especially alert to situations where price briefly pierces resistance and then rapidly closes back—don’t place orders based only on momentary quotes.
If this were my own trading, I wouldn’t participate, and I wouldn’t short against the trend. I’d only attempt a long with up to 0.5% of total funds if the spot price puts together two consecutive complete 15-minute candlesticks closing above $85,000, and the pullback holds in the $84,700–$85,000 range. First target: 86,000 (half off). Second target: 87,300 (close the remaining position). After entry, if within 15 minutes price closes below $84,200, I’d take half off. A hard stop-loss is set at $83,800; if it hits, I fully exit. If 82,868 is broken before the trigger, the plan is canceled. If during an upswing momentum fades and macro risk warms up again, I will主动平仓 even if the take-profit/stop hasn’t been hit yet. If trigger conditions aren’t met, there will be no trade—so there’s nothing to “review and reflect” on as profit.
Source: Binance Square Trending Topics real-time topics page; KuCoin BTC/USDT spot live quote. #BitcoinTops$87KAtEightMonthHigh #BTC
The above is only my personal market observation and does not constitute investment advice.

162
·
--
📰 Record Inflows into ETF Funds: Bitcoin’s Cost Basis Is Broken—Why Bulls Are Starting to Push?
Over the past two days, U.S. spot Bitcoin ETFs have pulled in more than $1.7 billion, setting a new all-time high. More importantly, Bitcoin’s price has successfully broken above the average purchase cost of early investors, meaning newcomers are now raking in serious profits. This “money-making effect” could attract even more capital into the crypto market.
Why is this news important?
This ETF inflow hitting a historical record means U.S. dollar capital is broadly bullish on Bitcoin’s long-term value. Breaking above the cost basis implies Bitcoin has entered a typical “vicious cycle”—price gains attract new capital, and that new capital continues to push prices higher, making more people feel they’ll miss out, accelerating their entry. This kind of effect is very evident early in bull markets. Now that Bitcoin has reclaimed the break-even point for early investors, it’s basically like giving the entire market a shot of adrenaline. Combined with previous CPI data coming in weaker than expected and expectations for Fed rate cuts heating up, dollar-denominated funds have started withdrawing from traditional markets to search for alternative investments. Bitcoin, as a “digital gold,” has had its safe-haven attributes rediscovered.
Impact on the market
In the short term, these inflows will directly support Bitcoin’s push higher. Bitcoin has already broken above the $84,000 level. If ETF inflows continue, it could challenge the prior resistance zone around $89,000–$92,000. The impact on ETH tends to lag, but historically, whenever BTC ETFs see strong volume, ETH typically follows with gains because capital flows from mainstream ETFs into the broader crypto space. In the long run, this suggests the regulatory framework is gradually maturing, with institutional investors starting to allocate to crypto assets through formal channels. Still, it’s important to note that after every ETF “high-volume” climax, there is usually a pullback period—so anyone entering now should be especially alert to whether inflows can keep going.
Trading ideas
💡 I think Bitcoin has the potential to surge toward $89,000 in the short term, but this view depends on ETF net inflows not stopping. If U.S. equities suddenly experience a risk event that causes capital to return, the logic would no longer hold. A break below the earlier key support at $82,000 would mean this rally may be a false breakout.
【Conditions that invalidate the thesis】If the Fed announces an earlier rate hike or severe geopolitical conflict emerges, this bullish view is invalid.
This article has no sponsorship from any project; the author does not hold the assets mentioned in the text.
$BTC $ETH #BTC #ETH
⚠️ Not investment advice; predictions are for reference only
#BitcoinTops$87KAtEightMonthHigh
📰 Record Inflows into ETF Funds: Bitcoin’s Cost Basis Is Broken—Why Bulls Are Starting to Push?
Over the past two days, U.S. spot Bitcoin ETFs have pulled in more than $1.7 billion, setting a new all-time high. More importantly, Bitcoin’s price has successfully broken above the average purchase cost of early investors, meaning newcomers are now raking in serious profits. This “money-making effect” could attract even more capital into the crypto market.
Why is this news important?
This ETF inflow hitting a historical record means U.S. dollar capital is broadly bullish on Bitcoin’s long-term value. Breaking above the cost basis implies Bitcoin has entered a typical “vicious cycle”—price gains attract new capital, and that new capital continues to push prices higher, making more people feel they’ll miss out, accelerating their entry. This kind of effect is very evident early in bull markets. Now that Bitcoin has reclaimed the break-even point for early investors, it’s basically like giving the entire market a shot of adrenaline. Combined with previous CPI data coming in weaker than expected and expectations for Fed rate cuts heating up, dollar-denominated funds have started withdrawing from traditional markets to search for alternative investments. Bitcoin, as a “digital gold,” has had its safe-haven attributes rediscovered.
Impact on the market
In the short term, these inflows will directly support Bitcoin’s push higher. Bitcoin has already broken above the $84,000 level. If ETF inflows continue, it could challenge the prior resistance zone around $89,000–$92,000. The impact on ETH tends to lag, but historically, whenever BTC ETFs see strong volume, ETH typically follows with gains because capital flows from mainstream ETFs into the broader crypto space. In the long run, this suggests the regulatory framework is gradually maturing, with institutional investors starting to allocate to crypto assets through formal channels. Still, it’s important to note that after every ETF “high-volume” climax, there is usually a pullback period—so anyone entering now should be especially alert to whether inflows can keep going.
Trading ideas
💡 I think Bitcoin has the potential to surge toward $89,000 in the short term, but this view depends on ETF net inflows not stopping. If U.S. equities suddenly experience a risk event that causes capital to return, the logic would no longer hold. A break below the earlier key support at $82,000 would mean this rally may be a false breakout.
【Conditions that invalidate the thesis】If the Fed announces an earlier rate hike or severe geopolitical conflict emerges, this bullish view is invalid.
This article has no sponsorship from any project; the author does not hold the assets mentioned in the text.
$BTC $ETH #BTC #ETH
⚠️ Not investment advice; predictions are for reference only
#BitcoinTops$87KAtEightMonthHigh
Over the past two days, U.S. spot Bitcoin ETFs have pulled in more than $1.7 billion, setting a new all-time high. More importantly, Bitcoin’s price has successfully broken above the average purchase cost of early investors, meaning newcomers are now raking in serious profits. This “money-making effect” could attract even more capital into the crypto market.
Why is this news important?
This ETF inflow hitting a historical record means U.S. dollar capital is broadly bullish on Bitcoin’s long-term value. Breaking above the cost basis implies Bitcoin has entered a typical “vicious cycle”—price gains attract new capital, and that new capital continues to push prices higher, making more people feel they’ll miss out, accelerating their entry. This kind of effect is very evident early in bull markets. Now that Bitcoin has reclaimed the break-even point for early investors, it’s basically like giving the entire market a shot of adrenaline. Combined with previous CPI data coming in weaker than expected and expectations for Fed rate cuts heating up, dollar-denominated funds have started withdrawing from traditional markets to search for alternative investments. Bitcoin, as a “digital gold,” has had its safe-haven attributes rediscovered.
Impact on the market
In the short term, these inflows will directly support Bitcoin’s push higher. Bitcoin has already broken above the $84,000 level. If ETF inflows continue, it could challenge the prior resistance zone around $89,000–$92,000. The impact on ETH tends to lag, but historically, whenever BTC ETFs see strong volume, ETH typically follows with gains because capital flows from mainstream ETFs into the broader crypto space. In the long run, this suggests the regulatory framework is gradually maturing, with institutional investors starting to allocate to crypto assets through formal channels. Still, it’s important to note that after every ETF “high-volume” climax, there is usually a pullback period—so anyone entering now should be especially alert to whether inflows can keep going.
Trading ideas
💡 I think Bitcoin has the potential to surge toward $89,000 in the short term, but this view depends on ETF net inflows not stopping. If U.S. equities suddenly experience a risk event that causes capital to return, the logic would no longer hold. A break below the earlier key support at $82,000 would mean this rally may be a false breakout.
【Conditions that invalidate the thesis】If the Fed announces an earlier rate hike or severe geopolitical conflict emerges, this bullish view is invalid.
This article has no sponsorship from any project; the author does not hold the assets mentioned in the text.
$BTC $ETH #BTC #ETH
⚠️ Not investment advice; predictions are for reference only
#BitcoinTops$87KAtEightMonthHigh

20
·
--
As BTC surges to 87K yuan— the talk is still hot|A futures ETF is set to liquidate, not a spot fund retreat|At 85.4K, I’ll defend first
My take is to stay calm about the headline. Binance Square still lists #BitcoinTops$87KAtEightMonthHigh on the hot chart, but BTC has slipped back from its intraday high to around $85,000. Seeing “Bitcoin ETF to liquidate” at this point makes it easy to mistakenly think that US spot funds are collectively selling. The Global X filing disclosed by the SEC actually says: the Bitcoin Trend Strategy ETF, a smaller-sized fund (ticker BTRN), has its board decide on September 16 to end operations; it expects to stop trading and buying by new investors after the close on October 16, and to distribute cash based on net asset value to remaining holders around October 23. “Planned” and “completed” are two different things— it can’t be written as already liquidated today.
The key is what the product actually holds. The issuer’s website, as of September 22, shows the holdings table includes CME Bitcoin futures, a short-term treasury fund, and cash—net assets of about $840,000—so it is not a spot ETF directly holding BTC. The termination reason provided is that the asset size has been consistently small and growth expectations are insufficient, not that an industry conclusion was issued saying “Bitcoin can’t be invested.” During liquidation, the positions being closed are the product’s futures and other portfolio exposures; you can’t mechanically convert that into the equivalent amount of spot BTC sell orders. You also can’t use a $840,000 small fund to represent the direction of all US Bitcoin fund capital; but it does point to the other side: having “BTC” in the name of an institutional product doesn’t necessarily mean it can accumulate size over the long term. The strategy design, fees, and secondary-market liquidity all have to pass real tests.
How has the market reacted? KuCoin publicly shows a BTC perpetual snapshot around $85,460; over the past 24 hours, it’s high $87,245 and low $85,223, giving back part of the surge. The earlier hot-topic discussion about 87K was a real shift in attention, but it isn’t proof that the current price is still holding above 87K. I also have no evidence to attribute this pullback to BTRN’s file from a week ago. For the short term, watch support around 85,200–85,500 for holding, then see whether it can reclaim 86,000–86,400. If a 15-minute period decisively breaks below 85,200, the reasons for attempting a rebound need to be re-evaluated. Compared with the fund headline, I care more whether subsequent spot capital, trading depth, and price can confirm in sync.
If I were trading it myself: I’m not participating now. I’ll only consider spot with a light long position. I need two complete 15-minute candles to hold above 85,200, then two consecutive candles to close above 86,100. After that, if it pulls back to 85,800–86,100 without breaking and the volume doesn’t clearly fade, then I’ll use at most 0.4% of total capital for a trial entry. First target: 86,600, which would hit the halving level. Second target: 87,200, fully closing the remaining position. I set a hard stop-loss below 85,050. After entry, if another two 15-minute candles close back below 85,800, I’ll主动 close the position. If the price breaks below 85,200 first before entry and the rebound can’t get back above 85,500, the plan is canceled. No need to gamble with high leverage on a headline reversal, and don’t write untriggered plans as trading results.
#BitcoinTops$87KAtEightMonthHigh #BTC
The above is only my personal market observation and does not constitute investment advice.
As BTC surges to 87K yuan— the talk is still hot|A futures ETF is set to liquidate, not a spot fund retreat|At 85.4K, I’ll defend first
My take is to stay calm about the headline. Binance Square still lists #BitcoinTops$87KAtEightMonthHigh on the hot chart, but BTC has slipped back from its intraday high to around $85,000. Seeing “Bitcoin ETF to liquidate” at this point makes it easy to mistakenly think that US spot funds are collectively selling. The Global X filing disclosed by the SEC actually says: the Bitcoin Trend Strategy ETF, a smaller-sized fund (ticker BTRN), has its board decide on September 16 to end operations; it expects to stop trading and buying by new investors after the close on October 16, and to distribute cash based on net asset value to remaining holders around October 23. “Planned” and “completed” are two different things— it can’t be written as already liquidated today.
The key is what the product actually holds. The issuer’s website, as of September 22, shows the holdings table includes CME Bitcoin futures, a short-term treasury fund, and cash—net assets of about $840,000—so it is not a spot ETF directly holding BTC. The termination reason provided is that the asset size has been consistently small and growth expectations are insufficient, not that an industry conclusion was issued saying “Bitcoin can’t be invested.” During liquidation, the positions being closed are the product’s futures and other portfolio exposures; you can’t mechanically convert that into the equivalent amount of spot BTC sell orders. You also can’t use a $840,000 small fund to represent the direction of all US Bitcoin fund capital; but it does point to the other side: having “BTC” in the name of an institutional product doesn’t necessarily mean it can accumulate size over the long term. The strategy design, fees, and secondary-market liquidity all have to pass real tests.
How has the market reacted? KuCoin publicly shows a BTC perpetual snapshot around $85,460; over the past 24 hours, it’s high $87,245 and low $85,223, giving back part of the surge. The earlier hot-topic discussion about 87K was a real shift in attention, but it isn’t proof that the current price is still holding above 87K. I also have no evidence to attribute this pullback to BTRN’s file from a week ago. For the short term, watch support around 85,200–85,500 for holding, then see whether it can reclaim 86,000–86,400. If a 15-minute period decisively breaks below 85,200, the reasons for attempting a rebound need to be re-evaluated. Compared with the fund headline, I care more whether subsequent spot capital, trading depth, and price can confirm in sync.
If I were trading it myself: I’m not participating now. I’ll only consider spot with a light long position. I need two complete 15-minute candles to hold above 85,200, then two consecutive candles to close above 86,100. After that, if it pulls back to 85,800–86,100 without breaking and the volume doesn’t clearly fade, then I’ll use at most 0.4% of total capital for a trial entry. First target: 86,600, which would hit the halving level. Second target: 87,200, fully closing the remaining position. I set a hard stop-loss below 85,050. After entry, if another two 15-minute candles close back below 85,800, I’ll主动 close the position. If the price breaks below 85,200 first before entry and the rebound can’t get back above 85,500, the plan is canceled. No need to gamble with high leverage on a headline reversal, and don’t write untriggered plans as trading results.
#BitcoinTops$87KAtEightMonthHigh #BTC
The above is only my personal market observation and does not constitute investment advice.
My take is to stay calm about the headline. Binance Square still lists #BitcoinTops$87KAtEightMonthHigh on the hot chart, but BTC has slipped back from its intraday high to around $85,000. Seeing “Bitcoin ETF to liquidate” at this point makes it easy to mistakenly think that US spot funds are collectively selling. The Global X filing disclosed by the SEC actually says: the Bitcoin Trend Strategy ETF, a smaller-sized fund (ticker BTRN), has its board decide on September 16 to end operations; it expects to stop trading and buying by new investors after the close on October 16, and to distribute cash based on net asset value to remaining holders around October 23. “Planned” and “completed” are two different things— it can’t be written as already liquidated today.
The key is what the product actually holds. The issuer’s website, as of September 22, shows the holdings table includes CME Bitcoin futures, a short-term treasury fund, and cash—net assets of about $840,000—so it is not a spot ETF directly holding BTC. The termination reason provided is that the asset size has been consistently small and growth expectations are insufficient, not that an industry conclusion was issued saying “Bitcoin can’t be invested.” During liquidation, the positions being closed are the product’s futures and other portfolio exposures; you can’t mechanically convert that into the equivalent amount of spot BTC sell orders. You also can’t use a $840,000 small fund to represent the direction of all US Bitcoin fund capital; but it does point to the other side: having “BTC” in the name of an institutional product doesn’t necessarily mean it can accumulate size over the long term. The strategy design, fees, and secondary-market liquidity all have to pass real tests.
How has the market reacted? KuCoin publicly shows a BTC perpetual snapshot around $85,460; over the past 24 hours, it’s high $87,245 and low $85,223, giving back part of the surge. The earlier hot-topic discussion about 87K was a real shift in attention, but it isn’t proof that the current price is still holding above 87K. I also have no evidence to attribute this pullback to BTRN’s file from a week ago. For the short term, watch support around 85,200–85,500 for holding, then see whether it can reclaim 86,000–86,400. If a 15-minute period decisively breaks below 85,200, the reasons for attempting a rebound need to be re-evaluated. Compared with the fund headline, I care more whether subsequent spot capital, trading depth, and price can confirm in sync.
If I were trading it myself: I’m not participating now. I’ll only consider spot with a light long position. I need two complete 15-minute candles to hold above 85,200, then two consecutive candles to close above 86,100. After that, if it pulls back to 85,800–86,100 without breaking and the volume doesn’t clearly fade, then I’ll use at most 0.4% of total capital for a trial entry. First target: 86,600, which would hit the halving level. Second target: 87,200, fully closing the remaining position. I set a hard stop-loss below 85,050. After entry, if another two 15-minute candles close back below 85,800, I’ll主动 close the position. If the price breaks below 85,200 first before entry and the rebound can’t get back above 85,500, the plan is canceled. No need to gamble with high leverage on a headline reversal, and don’t write untriggered plans as trading results.
#BitcoinTops$87KAtEightMonthHigh #BTC
The above is only my personal market observation and does not constitute investment advice.

67
·
--
BTC surges to 87K—topic heats up|Fund inflows are yesterday’s data, not a “bottom support” right now|Back down to 85.6K, I’ll be on the defensive first
My stance is fairly cautious: the hot-list headline says “an eight-month high,” but you can’t base your trade entry on the headline wording. The current accurate hot topic on Binance Square is #BitcoinTops$87KAtEightMonthHigh. KuCoin’s published BTC perpetual 24-hour high is around $87,245, which is enough to verify the part about “briefly exceeding 87K.” I haven’t independently confirmed the full historical definition behind “eight-month high,” so I’m not treating that comparison as a new, certain fact. During observation, the price has already retreated to roughly $85,646—about $1,599 off the peak. This isn’t “holding after a breakout”; it’s a follow-through test after a spike.
There’s one funding-related piece of background that I’ve cross-checked: Farside’s U.S. spot Bitcoin fund table shows that on September 22 the total net inflow was about $714.7 million, with IBIT about $350.3 million, FBTC about $257.4 million, and MSBT about $99.0 million. That explains why the market is willing to discuss institutional demand, but it can’t be written as “buying at the same pace right now.” The fund share subscription/redemption statistics reflect the previous trading day’s result and don’t line up with today’s order-book timing. Even single-day inflows can be offset by futures deleveraging, profit-taking, or macro rate repricing.
The Fed’s official statement last week still shows a 25 bps hike to 3.75%–4%, so I won’t interpret the move to 87K as a confirmed easing cycle.
What the market truly needs to answer is the volume-and-price structure after the pullback. Around 85,400 is the low of this set of 24-hour quotes; 85,600–85,800 is the current rebound/repair zone. If it regains 86,200, then we look again at the 86,600 and 87,200 area. Conversely, if it breaks below 85,400 and the retest can’t reclaim it, that would suggest chase-buying capital may get trapped when the hot list is at its hottest—and my short-term rebound assumption would fail.
A single exchange’s perpetual price can’t represent the entire spot market. I’ll treat it only as an execution reference, not infer the whole market’s liquidation size, and not turn yesterday’s report into today’s profit guarantee.
If I were trading this myself: I wouldn’t enter now. I’d only consider spot trying-long (no high leverage chasing). I’ll first wait for two complete 15-minute candlesticks to close back above 86,200. Then, after a pullback that holds 85,900–86,200 and the成交量 doesn’t clearly shrink, I’d enter in batches using at most 0.4% of total funds. Target 1: 86,600—sell half when/if it hits. Target 2: 87,200—close the remainder entirely. My initial hard stop-loss is below 85,380. After entry, if there are two consecutive 15-minute closes back below 85,900, I would actively reduce and exit completely.
If before that it drops below 85,400, the entire plan is canceled. If it directly rallies to 87,200 without a pullback, I’d rather miss the trade. All those price levels are conditions, and they don’t mean I’ve already filled.
#BitcoinTops$87KAtEightMonthHigh #BTC
The above is only my personal market observation and does not constitute investment advice.
BTC surges to 87K—topic heats up|Fund inflows are yesterday’s data, not a “bottom support” right now|Back down to 85.6K, I’ll be on the defensive first
My stance is fairly cautious: the hot-list headline says “an eight-month high,” but you can’t base your trade entry on the headline wording. The current accurate hot topic on Binance Square is #BitcoinTops$87KAtEightMonthHigh. KuCoin’s published BTC perpetual 24-hour high is around $87,245, which is enough to verify the part about “briefly exceeding 87K.” I haven’t independently confirmed the full historical definition behind “eight-month high,” so I’m not treating that comparison as a new, certain fact. During observation, the price has already retreated to roughly $85,646—about $1,599 off the peak. This isn’t “holding after a breakout”; it’s a follow-through test after a spike.
There’s one funding-related piece of background that I’ve cross-checked: Farside’s U.S. spot Bitcoin fund table shows that on September 22 the total net inflow was about $714.7 million, with IBIT about $350.3 million, FBTC about $257.4 million, and MSBT about $99.0 million. That explains why the market is willing to discuss institutional demand, but it can’t be written as “buying at the same pace right now.” The fund share subscription/redemption statistics reflect the previous trading day’s result and don’t line up with today’s order-book timing. Even single-day inflows can be offset by futures deleveraging, profit-taking, or macro rate repricing.
The Fed’s official statement last week still shows a 25 bps hike to 3.75%–4%, so I won’t interpret the move to 87K as a confirmed easing cycle.
What the market truly needs to answer is the volume-and-price structure after the pullback. Around 85,400 is the low of this set of 24-hour quotes; 85,600–85,800 is the current rebound/repair zone. If it regains 86,200, then we look again at the 86,600 and 87,200 area. Conversely, if it breaks below 85,400 and the retest can’t reclaim it, that would suggest chase-buying capital may get trapped when the hot list is at its hottest—and my short-term rebound assumption would fail.
A single exchange’s perpetual price can’t represent the entire spot market. I’ll treat it only as an execution reference, not infer the whole market’s liquidation size, and not turn yesterday’s report into today’s profit guarantee.
If I were trading this myself: I wouldn’t enter now. I’d only consider spot trying-long (no high leverage chasing). I’ll first wait for two complete 15-minute candlesticks to close back above 86,200. Then, after a pullback that holds 85,900–86,200 and the成交量 doesn’t clearly shrink, I’d enter in batches using at most 0.4% of total funds. Target 1: 86,600—sell half when/if it hits. Target 2: 87,200—close the remainder entirely. My initial hard stop-loss is below 85,380. After entry, if there are two consecutive 15-minute closes back below 85,900, I would actively reduce and exit completely.
If before that it drops below 85,400, the entire plan is canceled. If it directly rallies to 87,200 without a pullback, I’d rather miss the trade. All those price levels are conditions, and they don’t mean I’ve already filled.
#BitcoinTops$87KAtEightMonthHigh #BTC
The above is only my personal market observation and does not constitute investment advice.
My stance is fairly cautious: the hot-list headline says “an eight-month high,” but you can’t base your trade entry on the headline wording. The current accurate hot topic on Binance Square is #BitcoinTops$87KAtEightMonthHigh. KuCoin’s published BTC perpetual 24-hour high is around $87,245, which is enough to verify the part about “briefly exceeding 87K.” I haven’t independently confirmed the full historical definition behind “eight-month high,” so I’m not treating that comparison as a new, certain fact. During observation, the price has already retreated to roughly $85,646—about $1,599 off the peak. This isn’t “holding after a breakout”; it’s a follow-through test after a spike.
There’s one funding-related piece of background that I’ve cross-checked: Farside’s U.S. spot Bitcoin fund table shows that on September 22 the total net inflow was about $714.7 million, with IBIT about $350.3 million, FBTC about $257.4 million, and MSBT about $99.0 million. That explains why the market is willing to discuss institutional demand, but it can’t be written as “buying at the same pace right now.” The fund share subscription/redemption statistics reflect the previous trading day’s result and don’t line up with today’s order-book timing. Even single-day inflows can be offset by futures deleveraging, profit-taking, or macro rate repricing.
The Fed’s official statement last week still shows a 25 bps hike to 3.75%–4%, so I won’t interpret the move to 87K as a confirmed easing cycle.
What the market truly needs to answer is the volume-and-price structure after the pullback. Around 85,400 is the low of this set of 24-hour quotes; 85,600–85,800 is the current rebound/repair zone. If it regains 86,200, then we look again at the 86,600 and 87,200 area. Conversely, if it breaks below 85,400 and the retest can’t reclaim it, that would suggest chase-buying capital may get trapped when the hot list is at its hottest—and my short-term rebound assumption would fail.
A single exchange’s perpetual price can’t represent the entire spot market. I’ll treat it only as an execution reference, not infer the whole market’s liquidation size, and not turn yesterday’s report into today’s profit guarantee.
If I were trading this myself: I wouldn’t enter now. I’d only consider spot trying-long (no high leverage chasing). I’ll first wait for two complete 15-minute candlesticks to close back above 86,200. Then, after a pullback that holds 85,900–86,200 and the成交量 doesn’t clearly shrink, I’d enter in batches using at most 0.4% of total funds. Target 1: 86,600—sell half when/if it hits. Target 2: 87,200—close the remainder entirely. My initial hard stop-loss is below 85,380. After entry, if there are two consecutive 15-minute closes back below 85,900, I would actively reduce and exit completely.
If before that it drops below 85,400, the entire plan is canceled. If it directly rallies to 87,200 without a pullback, I’d rather miss the trade. All those price levels are conditions, and they don’t mean I’ve already filled.
#BitcoinTops$87KAtEightMonthHigh #BTC
The above is only my personal market observation and does not constitute investment advice.

6

·
--
Bullish
$BTC
{spot}(BTCUSDT)
C
The targeted Bitcoin weekend is expected to begin around $90k after a break of $87,400.
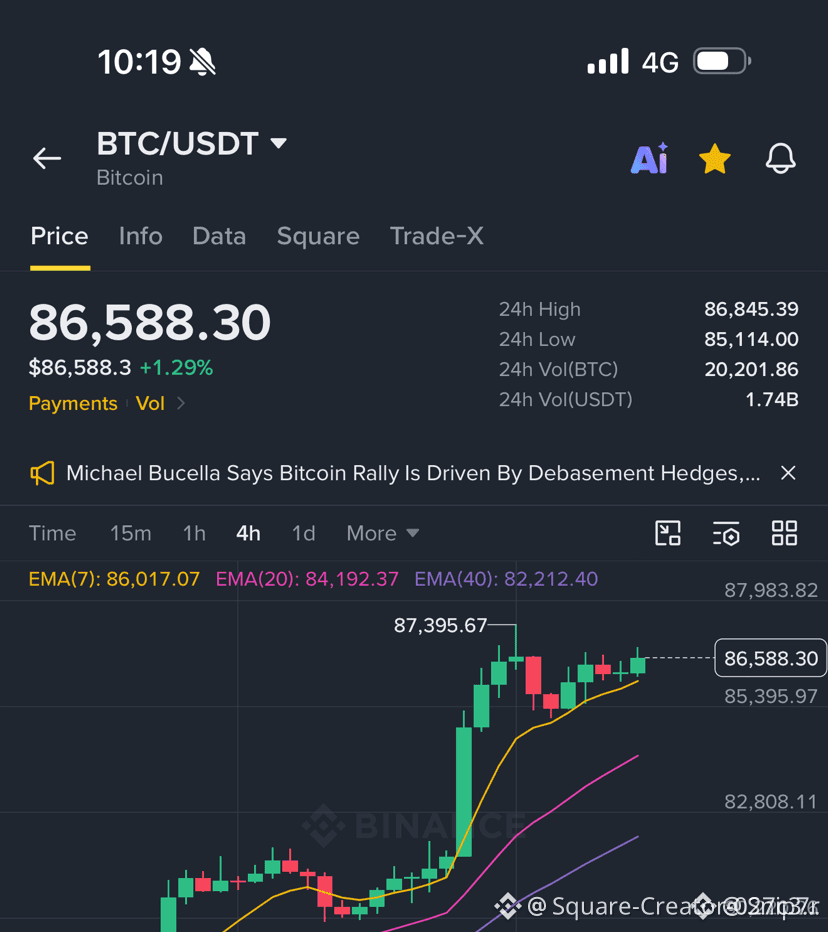
At about $86,588, the price of Bitcoin continues to trade steadily above $85,100 after a strong bullish wave. A four-hour close above $87,400, followed by a successful retest, would strengthen the $90k scenario. Losing $85,100 weakens the outlook.
Canada is exploring tokenized deposits with BMO, CIBC, National Bank, RBC, Scotiabank, and TD. The initiative is still under exploration, with no confirmed link to Bitcoin trading volume. stories.td.com
The RSI indicator near 76 points to extended momentum. Wait for confirmation before chasing. #BitcoinTops $87KAtEightMonthHigh
$BTC
C
The targeted Bitcoin weekend is expected to begin around $90k after a break of $87,400.
At about $86,588, the price of Bitcoin continues to trade steadily above $85,100 after a strong bullish wave. A four-hour close above $87,400, followed by a successful retest, would strengthen the $90k scenario. Losing $85,100 weakens the outlook.
Canada is exploring tokenized deposits with BMO, CIBC, National Bank, RBC, Scotiabank, and TD. The initiative is still under exploration, with no confirmed link to Bitcoin trading volume. stories.td.com
The RSI indicator near 76 points to extended momentum. Wait for confirmation before chasing. #BitcoinTops $87KAtEightMonthHigh
C
The targeted Bitcoin weekend is expected to begin around $90k after a break of $87,400.
At about $86,588, the price of Bitcoin continues to trade steadily above $85,100 after a strong bullish wave. A four-hour close above $87,400, followed by a successful retest, would strengthen the $90k scenario. Losing $85,100 weakens the outlook.
Canada is exploring tokenized deposits with BMO, CIBC, National Bank, RBC, Scotiabank, and TD. The initiative is still under exploration, with no confirmed link to Bitcoin trading volume. stories.td.com
The RSI indicator near 76 points to extended momentum. Wait for confirmation before chasing. #BitcoinTops $87KAtEightMonthHigh
1
277

·
--
Bitcoin has broken through the $87,000 mark, achieving a significant milestone with its highest price point in eight months. This surge indicates strong bullish momentum in the market, reflecting increased investor confidence and potentially driven by recent positive developments or broader market sentiment shifts. The asset's ability to reach such highs suggests a potential upward trend continuation, though traders should remain vigilant for potential pullbacks or consolidations as the market digests this rapid ascent. Market participants will be closely watching for sustained price action above this key level.
Disclaimer: This content is for informational purposes only and does not constitute investment advice.
#BitcoinTops$87KAtEightMonthHigh $BTC
Bitcoin has broken through the $87,000 mark, achieving a significant milestone with its highest price point in eight months. This surge indicates strong bullish momentum in the market, reflecting increased investor confidence and potentially driven by recent positive developments or broader market sentiment shifts. The asset's ability to reach such highs suggests a potential upward trend continuation, though traders should remain vigilant for potential pullbacks or consolidations as the market digests this rapid ascent. Market participants will be closely watching for sustained price action above this key level.
Disclaimer: This content is for informational purposes only and does not constitute investment advice.
#BitcoinTops$87KAtEightMonthHigh $BTC
Disclaimer: This content is for informational purposes only and does not constitute investment advice.
#BitcoinTops$87KAtEightMonthHigh $BTC
27
A Fed rate hike sparks a global market shock, and Bitcoin breaks through the $87,000 mark against the odds to set an eight-month high
1. The Fed delivers a 25-basis-point hike in September, with hawkish signals exceeding expectations
In the early hours of September 22 Beijing time, the Federal Reserve unanimously approved the outcome of its September policy meeting by a vote of 12-0. It announced that the federal funds rate would be raised by 25 basis points to a range of 3.75% to 4.00%. This is another hawkish move in the current tightening cycle. The dot plot shows that 16 officials expect at least one more rate hike this year, and that the timeline for inflation to return to the 2% target has been pushed back to 2029.
At a press conference, Powell stressed that the labor market remains tight and that the pace of core inflation decline has been slower than expected; the Fed needs to keep a restrictive stance for longer. Markets had previously entertained some hopes of a pause, but this decision has fully dashed expectations of a dovish shift. Wall Street traders quickly adjusted their models. Current futures pricing indicates that as of June 2027 there will still be three rounds of 25-basis-point hikes.
2. Crypto market surges against the trend, as institutional funds flood in
What surprised the market was that after the rate-hike decision was announced, crypto prices did not fall—they rose instead. Within four hours of the decision, Bitcoin broke above the 53-week moving average. It climbed as high as $87,300, the highest level since January 2026. For the entire month of September, Bitcoin’s cumulative gain was about 10%, and it is poised to post the best monthly performance in 14 years.
Even more striking is the speed at which institutional funds are pouring in. Over the past three trading days, spot Bitcoin ETFs saw cumulative net inflows of $1.7 billion. In a single day, inflows reached $0.999 billion, setting the largest one-day record since October 2025. The next day also recorded $0.75 billion in inflows. With daily inflows exceeding $0.4 billion for three straight days, it signals extremely strong institutional allocation demand.
3. Binance makes a major investment in Circle, reshaping the stablecoin competition landscape
Alongside the volatility in macro markets, there were also major industry headlines. Binance announced an investment of $100 million in Circle, purchasing about 1.24 million shares at a price of $80.84 per share. At the same time, the two sides signed a five-year commercial agreement to promote the use of USDC worldwide. The deal marks a deeper tie between the world’s largest exchange and a dollar stablecoin issuer, which could further intensify competition with Tether’s USDT.
Analysts believe USDC’s advantages in compliance and transparency will help it expand further, especially in emerging markets, where USDC is expected to be adopted in more payment and cross-border remittance scenarios.
4. Tokenized U.S. stocks and derivatives markets continue to expand
The integration of traditional finance and crypto markets is also accelerating. CME announced that on October 19 it will launch Bitcoin Cash and Uniswap futures contracts, including both standard and micro contracts. After the news was released, BCH surged by about 27% within 24 hours, and UNI rose by about 12%. Meanwhile, the Canary staked TRX ETF has already been listed on E*TRADE and Interactive Brokers under Charles Schwab, further widening the path for retail and institutional investors to invest in crypto assets through traditional brokerage channels.
In the tokenized U.S. stocks space, trading activity for on-chain U.S. stock tokens continues to rise. NIL’s single-day gain exceeded 53%, with trading volume of $176 million. TAKE rose by 45.7%, and BCH gained 35.7%. Tokenized U.S.-stock products such as Moderna and Linear are also expanding on-chain, offering investors a new way to trade U.S. stock assets around the clock.
5. Outlook and risk warnings
Overall, the market is currently in a window where multiple positives overlap. Persistent large ETF inflows provide solid buy-side support for Bitcoin, and the expansion of CME derivatives as well as the development of tokenized U.S. stocks are attracting more traditional capital. However, it’s important to note that the Fed’s hawkish stance means liquidity conditions remain relatively tight, and the duration of high interest rates may run longer than the market expects. In addition, the U.S. Senate’s CLARITY bill did not receive enough votes for passage, and uncertainty remains regarding the crypto regulatory framework.
Investors should watch both the near-term rally and the risks of pullbacks driven by shifts in macro policy and regulatory changes. They should manage position sizes appropriately and avoid chasing prices blindly.
#AIStocksWhatNext #BitcoinTops$87KAtEightMonthHigh #US Stock Tokenization
A Fed rate hike sparks a global market shock, and Bitcoin breaks through the $87,000 mark against the odds to set an eight-month high
1. The Fed delivers a 25-basis-point hike in September, with hawkish signals exceeding expectations
In the early hours of September 22 Beijing time, the Federal Reserve unanimously approved the outcome of its September policy meeting by a vote of 12-0. It announced that the federal funds rate would be raised by 25 basis points to a range of 3.75% to 4.00%. This is another hawkish move in the current tightening cycle. The dot plot shows that 16 officials expect at least one more rate hike this year, and that the timeline for inflation to return to the 2% target has been pushed back to 2029.
At a press conference, Powell stressed that the labor market remains tight and that the pace of core inflation decline has been slower than expected; the Fed needs to keep a restrictive stance for longer. Markets had previously entertained some hopes of a pause, but this decision has fully dashed expectations of a dovish shift. Wall Street traders quickly adjusted their models. Current futures pricing indicates that as of June 2027 there will still be three rounds of 25-basis-point hikes.
2. Crypto market surges against the trend, as institutional funds flood in
What surprised the market was that after the rate-hike decision was announced, crypto prices did not fall—they rose instead. Within four hours of the decision, Bitcoin broke above the 53-week moving average. It climbed as high as $87,300, the highest level since January 2026. For the entire month of September, Bitcoin’s cumulative gain was about 10%, and it is poised to post the best monthly performance in 14 years.
Even more striking is the speed at which institutional funds are pouring in. Over the past three trading days, spot Bitcoin ETFs saw cumulative net inflows of $1.7 billion. In a single day, inflows reached $0.999 billion, setting the largest one-day record since October 2025. The next day also recorded $0.75 billion in inflows. With daily inflows exceeding $0.4 billion for three straight days, it signals extremely strong institutional allocation demand.
3. Binance makes a major investment in Circle, reshaping the stablecoin competition landscape
Alongside the volatility in macro markets, there were also major industry headlines. Binance announced an investment of $100 million in Circle, purchasing about 1.24 million shares at a price of $80.84 per share. At the same time, the two sides signed a five-year commercial agreement to promote the use of USDC worldwide. The deal marks a deeper tie between the world’s largest exchange and a dollar stablecoin issuer, which could further intensify competition with Tether’s USDT.
Analysts believe USDC’s advantages in compliance and transparency will help it expand further, especially in emerging markets, where USDC is expected to be adopted in more payment and cross-border remittance scenarios.
4. Tokenized U.S. stocks and derivatives markets continue to expand
The integration of traditional finance and crypto markets is also accelerating. CME announced that on October 19 it will launch Bitcoin Cash and Uniswap futures contracts, including both standard and micro contracts. After the news was released, BCH surged by about 27% within 24 hours, and UNI rose by about 12%. Meanwhile, the Canary staked TRX ETF has already been listed on E*TRADE and Interactive Brokers under Charles Schwab, further widening the path for retail and institutional investors to invest in crypto assets through traditional brokerage channels.
In the tokenized U.S. stocks space, trading activity for on-chain U.S. stock tokens continues to rise. NIL’s single-day gain exceeded 53%, with trading volume of $176 million. TAKE rose by 45.7%, and BCH gained 35.7%. Tokenized U.S.-stock products such as Moderna and Linear are also expanding on-chain, offering investors a new way to trade U.S. stock assets around the clock.
5. Outlook and risk warnings
Overall, the market is currently in a window where multiple positives overlap. Persistent large ETF inflows provide solid buy-side support for Bitcoin, and the expansion of CME derivatives as well as the development of tokenized U.S. stocks are attracting more traditional capital. However, it’s important to note that the Fed’s hawkish stance means liquidity conditions remain relatively tight, and the duration of high interest rates may run longer than the market expects. In addition, the U.S. Senate’s CLARITY bill did not receive enough votes for passage, and uncertainty remains regarding the crypto regulatory framework.
Investors should watch both the near-term rally and the risks of pullbacks driven by shifts in macro policy and regulatory changes. They should manage position sizes appropriately and avoid chasing prices blindly.
#AIStocksWhatNext #BitcoinTops$87KAtEightMonthHigh #US Stock Tokenization
1. The Fed delivers a 25-basis-point hike in September, with hawkish signals exceeding expectations
In the early hours of September 22 Beijing time, the Federal Reserve unanimously approved the outcome of its September policy meeting by a vote of 12-0. It announced that the federal funds rate would be raised by 25 basis points to a range of 3.75% to 4.00%. This is another hawkish move in the current tightening cycle. The dot plot shows that 16 officials expect at least one more rate hike this year, and that the timeline for inflation to return to the 2% target has been pushed back to 2029.
At a press conference, Powell stressed that the labor market remains tight and that the pace of core inflation decline has been slower than expected; the Fed needs to keep a restrictive stance for longer. Markets had previously entertained some hopes of a pause, but this decision has fully dashed expectations of a dovish shift. Wall Street traders quickly adjusted their models. Current futures pricing indicates that as of June 2027 there will still be three rounds of 25-basis-point hikes.
2. Crypto market surges against the trend, as institutional funds flood in
What surprised the market was that after the rate-hike decision was announced, crypto prices did not fall—they rose instead. Within four hours of the decision, Bitcoin broke above the 53-week moving average. It climbed as high as $87,300, the highest level since January 2026. For the entire month of September, Bitcoin’s cumulative gain was about 10%, and it is poised to post the best monthly performance in 14 years.
Even more striking is the speed at which institutional funds are pouring in. Over the past three trading days, spot Bitcoin ETFs saw cumulative net inflows of $1.7 billion. In a single day, inflows reached $0.999 billion, setting the largest one-day record since October 2025. The next day also recorded $0.75 billion in inflows. With daily inflows exceeding $0.4 billion for three straight days, it signals extremely strong institutional allocation demand.
3. Binance makes a major investment in Circle, reshaping the stablecoin competition landscape
Alongside the volatility in macro markets, there were also major industry headlines. Binance announced an investment of $100 million in Circle, purchasing about 1.24 million shares at a price of $80.84 per share. At the same time, the two sides signed a five-year commercial agreement to promote the use of USDC worldwide. The deal marks a deeper tie between the world’s largest exchange and a dollar stablecoin issuer, which could further intensify competition with Tether’s USDT.
Analysts believe USDC’s advantages in compliance and transparency will help it expand further, especially in emerging markets, where USDC is expected to be adopted in more payment and cross-border remittance scenarios.
4. Tokenized U.S. stocks and derivatives markets continue to expand
The integration of traditional finance and crypto markets is also accelerating. CME announced that on October 19 it will launch Bitcoin Cash and Uniswap futures contracts, including both standard and micro contracts. After the news was released, BCH surged by about 27% within 24 hours, and UNI rose by about 12%. Meanwhile, the Canary staked TRX ETF has already been listed on E*TRADE and Interactive Brokers under Charles Schwab, further widening the path for retail and institutional investors to invest in crypto assets through traditional brokerage channels.
In the tokenized U.S. stocks space, trading activity for on-chain U.S. stock tokens continues to rise. NIL’s single-day gain exceeded 53%, with trading volume of $176 million. TAKE rose by 45.7%, and BCH gained 35.7%. Tokenized U.S.-stock products such as Moderna and Linear are also expanding on-chain, offering investors a new way to trade U.S. stock assets around the clock.
5. Outlook and risk warnings
Overall, the market is currently in a window where multiple positives overlap. Persistent large ETF inflows provide solid buy-side support for Bitcoin, and the expansion of CME derivatives as well as the development of tokenized U.S. stocks are attracting more traditional capital. However, it’s important to note that the Fed’s hawkish stance means liquidity conditions remain relatively tight, and the duration of high interest rates may run longer than the market expects. In addition, the U.S. Senate’s CLARITY bill did not receive enough votes for passage, and uncertainty remains regarding the crypto regulatory framework.
Investors should watch both the near-term rally and the risks of pullbacks driven by shifts in macro policy and regulatory changes. They should manage position sizes appropriately and avoid chasing prices blindly.
#AIStocksWhatNext #BitcoinTops$87KAtEightMonthHigh #US Stock Tokenization
14
·
--
BTC’s push to $87,000 topic heats up | ETF daily figures not all in yet | I’ll wait to see it holds before acting
My stance is cautiously bullish, but I won’t chase just because it’s near an integer level. The Binance Plaza trending topic shows “#BitcoinTops$87KAtEightMonthHigh,” which suggests attention is shifting toward BTC. However, the topic text itself isn’t proof of trades when I place orders. At 11:45 Beijing time, I checked KuCoin’s publicly available BTC perpetual quotes: around $86,801; the prior 24h high was about $86,925—still below $87,000. Different exchanges and different timestamps can have different highs, so writing that the market has firmly stood above $87k doesn’t apply to this particular snapshot. The intraday low is about $85,067. The bounce from the low is real, but whether sell pressure can be absorbed near this level still needs verification.
You also need to prevent confusing “half the table” for a conclusion. Farside’s US spot BTC ETF table shows that on September 21, the full row net inflow was about $999 million. On September 22, as of my check, the IBIT column still shows a dash; the automatic total of the other listed funds is about $364 million. This can only be called the “aggregate of currently disclosed parts,” not the final, full-market net inflow for September 22—and it certainly can’t be used to infer that today’s price increase is entirely driven by ETF buying. Earlier, on September 16, the Fed already raised the policy rate by 25 bps to 3.75%–4.00%, meaning liquidity conditions are not one-way easy. Only when heat, capital, and price move in the same direction will the trend be sturdier. If any link falls behind, even a breakout that briefly pushes through an integer level could quickly give back.
For me, $87,000 is first a validation level—not a reason to buy just because there’s a headline. If the price keeps thrusting upward but can’t hold, I’ll first watch whether $86,500–$86,450 can hold. If it breaks below $86,100, my short-term bullish view for today is basically overturned. Conversely, if it holds above $87,000 and then pulls back without breaking, and the complete ETF data shows no obvious reversal, I’ll consider this rally as a continuation-type breakout. Especially, I won’t pre-fill yet-unpublished fund numbers as “certainly positive.”
If I were trading it myself, I wouldn’t enter now. I would only consider a small spot long position, with no high leverage. The entry trigger is two consecutive full 15-minute candlesticks closing above $87,050; then, after a pullback, as long as the price can still hold the $86,900–$87,050 range. After it’s met, I’d use at most 0.5% of total assets for a trial position. First target: $87,400—once reached, cut half. Second target: $87,900—then reduce again or close the remainder. Initial stop-loss is at $86,550; if triggered, I’ll close directly without trying to lower the average cost. If I haven’t entered yet and it loses $86,450 first, the plan is void. If after entering the price keeps failing to reclaim $87,000, I’ll主动 close it as well—I won’t let a short-term plan turn into a long-term hold.
Source notes: Binance Plaza trending topics page, KuCoin’s publicly available contract quotes, Farside fund flow table, and the Fed’s September 16 statement. #BitcoinTops$87KAtEightMonthHigh #BTC
The above is only my personal market observation and does not constitute investment advice.
BTC’s push to $87,000 topic heats up | ETF daily figures not all in yet | I’ll wait to see it holds before acting
My stance is cautiously bullish, but I won’t chase just because it’s near an integer level. The Binance Plaza trending topic shows “#BitcoinTops$87KAtEightMonthHigh,” which suggests attention is shifting toward BTC. However, the topic text itself isn’t proof of trades when I place orders. At 11:45 Beijing time, I checked KuCoin’s publicly available BTC perpetual quotes: around $86,801; the prior 24h high was about $86,925—still below $87,000. Different exchanges and different timestamps can have different highs, so writing that the market has firmly stood above $87k doesn’t apply to this particular snapshot. The intraday low is about $85,067. The bounce from the low is real, but whether sell pressure can be absorbed near this level still needs verification.
You also need to prevent confusing “half the table” for a conclusion. Farside’s US spot BTC ETF table shows that on September 21, the full row net inflow was about $999 million. On September 22, as of my check, the IBIT column still shows a dash; the automatic total of the other listed funds is about $364 million. This can only be called the “aggregate of currently disclosed parts,” not the final, full-market net inflow for September 22—and it certainly can’t be used to infer that today’s price increase is entirely driven by ETF buying. Earlier, on September 16, the Fed already raised the policy rate by 25 bps to 3.75%–4.00%, meaning liquidity conditions are not one-way easy. Only when heat, capital, and price move in the same direction will the trend be sturdier. If any link falls behind, even a breakout that briefly pushes through an integer level could quickly give back.
For me, $87,000 is first a validation level—not a reason to buy just because there’s a headline. If the price keeps thrusting upward but can’t hold, I’ll first watch whether $86,500–$86,450 can hold. If it breaks below $86,100, my short-term bullish view for today is basically overturned. Conversely, if it holds above $87,000 and then pulls back without breaking, and the complete ETF data shows no obvious reversal, I’ll consider this rally as a continuation-type breakout. Especially, I won’t pre-fill yet-unpublished fund numbers as “certainly positive.”
If I were trading it myself, I wouldn’t enter now. I would only consider a small spot long position, with no high leverage. The entry trigger is two consecutive full 15-minute candlesticks closing above $87,050; then, after a pullback, as long as the price can still hold the $86,900–$87,050 range. After it’s met, I’d use at most 0.5% of total assets for a trial position. First target: $87,400—once reached, cut half. Second target: $87,900—then reduce again or close the remainder. Initial stop-loss is at $86,550; if triggered, I’ll close directly without trying to lower the average cost. If I haven’t entered yet and it loses $86,450 first, the plan is void. If after entering the price keeps failing to reclaim $87,000, I’ll主动 close it as well—I won’t let a short-term plan turn into a long-term hold.
Source notes: Binance Plaza trending topics page, KuCoin’s publicly available contract quotes, Farside fund flow table, and the Fed’s September 16 statement. #BitcoinTops$87KAtEightMonthHigh #BTC
The above is only my personal market observation and does not constitute investment advice.
My stance is cautiously bullish, but I won’t chase just because it’s near an integer level. The Binance Plaza trending topic shows “#BitcoinTops$87KAtEightMonthHigh,” which suggests attention is shifting toward BTC. However, the topic text itself isn’t proof of trades when I place orders. At 11:45 Beijing time, I checked KuCoin’s publicly available BTC perpetual quotes: around $86,801; the prior 24h high was about $86,925—still below $87,000. Different exchanges and different timestamps can have different highs, so writing that the market has firmly stood above $87k doesn’t apply to this particular snapshot. The intraday low is about $85,067. The bounce from the low is real, but whether sell pressure can be absorbed near this level still needs verification.
You also need to prevent confusing “half the table” for a conclusion. Farside’s US spot BTC ETF table shows that on September 21, the full row net inflow was about $999 million. On September 22, as of my check, the IBIT column still shows a dash; the automatic total of the other listed funds is about $364 million. This can only be called the “aggregate of currently disclosed parts,” not the final, full-market net inflow for September 22—and it certainly can’t be used to infer that today’s price increase is entirely driven by ETF buying. Earlier, on September 16, the Fed already raised the policy rate by 25 bps to 3.75%–4.00%, meaning liquidity conditions are not one-way easy. Only when heat, capital, and price move in the same direction will the trend be sturdier. If any link falls behind, even a breakout that briefly pushes through an integer level could quickly give back.
For me, $87,000 is first a validation level—not a reason to buy just because there’s a headline. If the price keeps thrusting upward but can’t hold, I’ll first watch whether $86,500–$86,450 can hold. If it breaks below $86,100, my short-term bullish view for today is basically overturned. Conversely, if it holds above $87,000 and then pulls back without breaking, and the complete ETF data shows no obvious reversal, I’ll consider this rally as a continuation-type breakout. Especially, I won’t pre-fill yet-unpublished fund numbers as “certainly positive.”
If I were trading it myself, I wouldn’t enter now. I would only consider a small spot long position, with no high leverage. The entry trigger is two consecutive full 15-minute candlesticks closing above $87,050; then, after a pullback, as long as the price can still hold the $86,900–$87,050 range. After it’s met, I’d use at most 0.5% of total assets for a trial position. First target: $87,400—once reached, cut half. Second target: $87,900—then reduce again or close the remainder. Initial stop-loss is at $86,550; if triggered, I’ll close directly without trying to lower the average cost. If I haven’t entered yet and it loses $86,450 first, the plan is void. If after entering the price keeps failing to reclaim $87,000, I’ll主动 close it as well—I won’t let a short-term plan turn into a long-term hold.
Source notes: Binance Plaza trending topics page, KuCoin’s publicly available contract quotes, Farside fund flow table, and the Fed’s September 16 statement. #BitcoinTops$87KAtEightMonthHigh #BTC
The above is only my personal market observation and does not constitute investment advice.

87
·
--
Bitcoin’s recent rise has broken through its highest level in eight months, reaching $87,000, reflecting strong confidence in digital currencies. I believe this rally is mainly due to the gradual entry of institutional investors and Bitcoin’s role as a safe-haven asset amid rising global economic uncertainty. In addition, expectations for the Bitcoin halving continue to boost market sentiment. However, volatility risk at these high levels remains, and investors should be cautious. #BitcoinTops$87KAtEightMonthHigh
Bitcoin’s recent rise has broken through its highest level in eight months, reaching $87,000, reflecting strong confidence in digital currencies. I believe this rally is mainly due to the gradual entry of institutional investors and Bitcoin’s role as a safe-haven asset amid rising global economic uncertainty. In addition, expectations for the Bitcoin halving continue to boost market sentiment. However, volatility risk at these high levels remains, and investors should be cautious. #BitcoinTops$87KAtEightMonthHigh
18

🚀 Great news in the crypto world! $BTC has crossed the $70K mark for the first time in two months, rising 9.34% to $76,295.99! This surge can be attributed to increased institutional interest and positive market sentiment. 💹 As you can see below, the momentum is strong!
What are your thoughts on this rally? Will it sustain? #BitcoinTops$70KFirstTimeInTwoMonths #cryptocurrency
💬 Join and follow us—we’ll keep analyzing the market for you.
🚀 Great news in the crypto world! $BTC has crossed the $70K mark for the first time in two months, rising 9.34% to $76,295.99! This surge can be attributed to increased institutional interest and positive market sentiment. 💹 As you can see below, the momentum is strong!
What are your thoughts on this rally? Will it sustain? #BitcoinTops$70KFirstTimeInTwoMonths #cryptocurrency
💬 Join and follow us—we’ll keep analyzing the market for you.
What are your thoughts on this rally? Will it sustain? #BitcoinTops$70KFirstTimeInTwoMonths #cryptocurrency
💬 Join and follow us—we’ll keep analyzing the market for you.
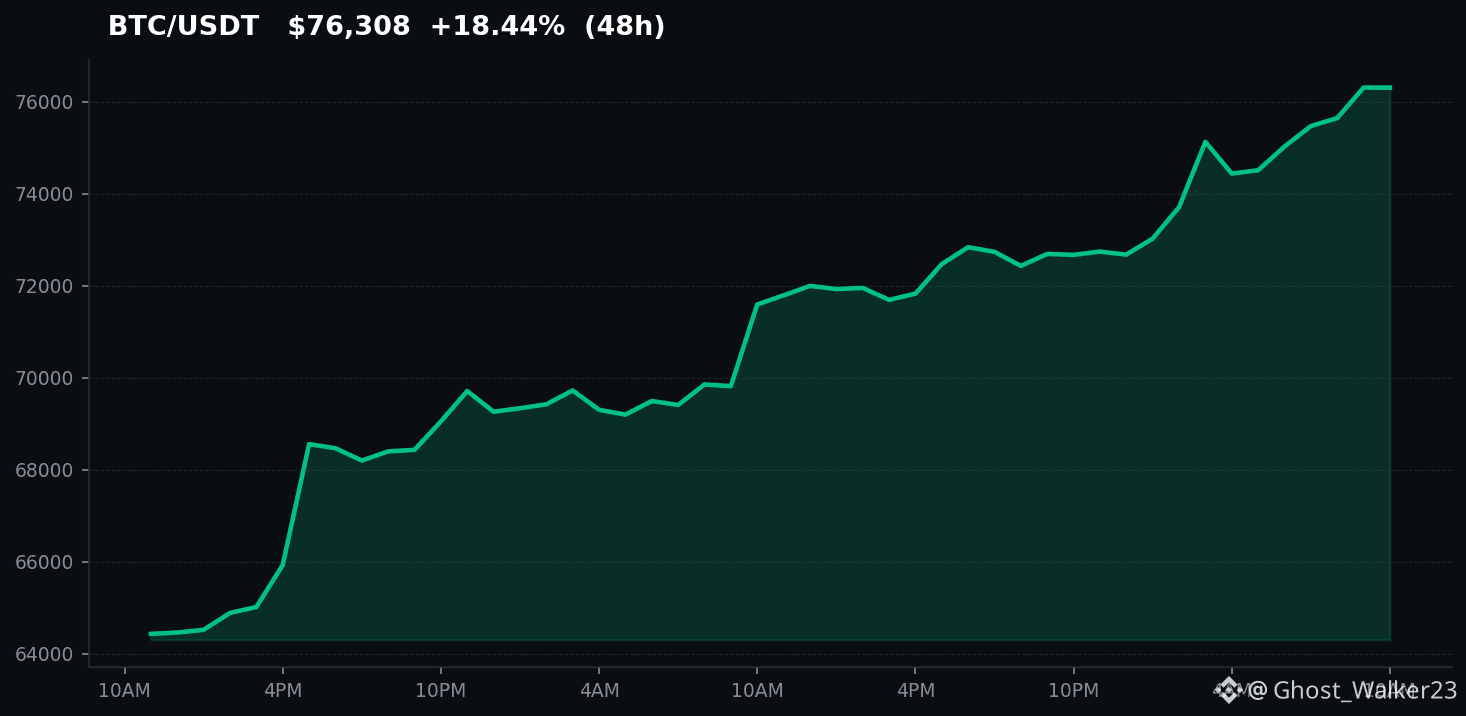
22

#BitcoinTops $80KThreeMonthHigh
#BitcoinTops $80KThreeMonthHigh
Bitcoin has climbed above the $80,000 mark, reaching a three-month high as bullish momentum returns to the cryptocurrency market.
The move reflects renewed buying interest and growing optimism among investors, with traders closely watching whether Bitcoin can maintain its gains and push toward higher levels.
The latest rally highlights Bitcoin’s continued strength and could attract further attention from both retail and institutional market participants.
#BitcoinTops $80KThreeMonthHigh
#BitcoinTops $80KThreeMonthHigh
#BitcoinTops $80KThreeMonthHigh
Bitcoin has climbed above the $80,000 mark, reaching a three-month high as bullish momentum returns to the cryptocurrency market.
The move reflects renewed buying interest and growing optimism among investors, with traders closely watching whether Bitcoin can maintain its gains and push toward higher levels.
The latest rally highlights Bitcoin’s continued strength and could attract further attention from both retail and institutional market participants.
#BitcoinTops $80KThreeMonthHigh
#BitcoinTops $80KThreeMonthHigh
Bitcoin has climbed above the $80,000 mark, reaching a three-month high as bullish momentum returns to the cryptocurrency market.
The move reflects renewed buying interest and growing optimism among investors, with traders closely watching whether Bitcoin can maintain its gains and push toward higher levels.
The latest rally highlights Bitcoin’s continued strength and could attract further attention from both retail and institutional market participants.
#BitcoinTops $80KThreeMonthHigh

73

·
--
$BTC above $80K: the Asia-session acceptance checklist$BTC is above $80,000, but a level is not support until price proves it. My Asia-session checklist is built around acceptance, not the headline.
1. Hold: does BTC stay above $80,000 after the first pullback?
2. Range: is the overnight low near $78,546 protected, or does price start closing below it?
3. Confirmation: does ETH keep trading above its 24h open while SOL's +8.418% lead survives?
4. Catalyst: the Fed chair's Jackson Hole speech can reset the macro tape, so I would not treat a pre-speech push as durable by default.
Trigger: a sustained hold above $80,000 and a retest that respects it. Invalidation: a 1h close below $78,546. The next upside reference is $80,849, today's Binance 24h high, within this session's window.
Rule: acceptance is a close-and-retest process, not a single wick.
#BitcoinHoldsNear$79400 #BitcoinTops$80KThreeMonthHigh #KospiClosesAtRecordHigh
$BTC above $80K: the Asia-session acceptance checklist
$BTC is above $80,000, but a level is not support until price proves it. My Asia-session checklist is built around acceptance, not the headline.
1. Hold: does BTC stay above $80,000 after the first pullback?
2. Range: is the overnight low near $78,546 protected, or does price start closing below it?
3. Confirmation: does ETH keep trading above its 24h open while SOL's +8.418% lead survives?
4. Catalyst: the Fed chair's Jackson Hole speech can reset the macro tape, so I would not treat a pre-speech push as durable by default.
Trigger: a sustained hold above $80,000 and a retest that respects it. Invalidation: a 1h close below $78,546. The next upside reference is $80,849, today's Binance 24h high, within this session's window.
Rule: acceptance is a close-and-retest process, not a single wick.
#BitcoinHoldsNear$79400 #BitcoinTops$80KThreeMonthHigh #KospiClosesAtRecordHigh
1. Hold: does BTC stay above $80,000 after the first pullback?
2. Range: is the overnight low near $78,546 protected, or does price start closing below it?
3. Confirmation: does ETH keep trading above its 24h open while SOL's +8.418% lead survives?
4. Catalyst: the Fed chair's Jackson Hole speech can reset the macro tape, so I would not treat a pre-speech push as durable by default.
Trigger: a sustained hold above $80,000 and a retest that respects it. Invalidation: a 1h close below $78,546. The next upside reference is $80,849, today's Binance 24h high, within this session's window.
Rule: acceptance is a close-and-retest process, not a single wick.
#BitcoinHoldsNear$79400 #BitcoinTops$80KThreeMonthHigh #KospiClosesAtRecordHigh
77

#BitcoinTops $66K 🥠
$BTC once called a "bubble" at $1K is now fighting for territory above $66K.
Many investors once thought $1K, $10K, and $20K were impossible. Bitcoin has repeatedly redefined what the market considers "expensive."
The interesting part isn't the number itself - it's that BTC continues to recover after every major pullback, showing why long-term holders focus on years, not days. #Mahanadi
#BitcoinTops $66K 🥠
$BTC once called a "bubble" at $1K is now fighting for territory above $66K.
Many investors once thought $1K, $10K, and $20K were impossible. Bitcoin has repeatedly redefined what the market considers "expensive."
The interesting part isn't the number itself - it's that BTC continues to recover after every major pullback, showing why long-term holders focus on years, not days. #Mahanadi
$BTC once called a "bubble" at $1K is now fighting for territory above $66K.
Many investors once thought $1K, $10K, and $20K were impossible. Bitcoin has repeatedly redefined what the market considers "expensive."
The interesting part isn't the number itself - it's that BTC continues to recover after every major pullback, showing why long-term holders focus on years, not days. #Mahanadi

Scarcity Matters 🤷
From Digital Mahanadi
1
133
·
--
$BTC passed yesterday's test. HIT. The call required a completed 1H close above $79,206 before 05:00 UTC; BTC printed multiple closes above it, including $80,204. Lesson: acceptance matters more than the first wick. Today's call: BTC will print a completed 1H close above $80,000 before 05:00 UTC on Aug 29. My invalidation is a close back below $79,206; the time window is the next 24 hours, with the $80,000 close as the gradeable target. #BitcoinHoldsNear$79400 #BitcoinTops$80KThreeMonthHigh #DollarPostsBiggestGainInNearlyFourWeeks
$BTC passed yesterday's test. HIT. The call required a completed 1H close above $79,206 before 05:00 UTC; BTC printed multiple closes above it, including $80,204. Lesson: acceptance matters more than the first wick. Today's call: BTC will print a completed 1H close above $80,000 before 05:00 UTC on Aug 29. My invalidation is a close back below $79,206; the time window is the next 24 hours, with the $80,000 close as the gradeable target. #BitcoinHoldsNear$79400 #BitcoinTops$80KThreeMonthHigh #DollarPostsBiggestGainInNearlyFourWeeks
70

·
--
Bullish
#BitcoinTops $80KThreeMonthHigh
I’m really happy to see Bitcoin back above $80K and touching a fresh three-month high. This move shows that buyers are becoming active again and market confidence is starting to return.
What I’m watching now is whether $80K can turn into strong support. If BTC continues holding above this level and the momentum stays strong, I think the next important areas to watch could be around $82K, $83K and $85K.
At the same time, after such a strong move, a short consolidation or pullback wouldn’t surprise me. For me, the key is not chasing the move, but watching how Bitcoin reacts around these important levels.
BTC is showing strength again, and the next few candles could be very important.
Do you think Bitcoin can hold above $80K and continue the rally? 📈
#BitcoinTops$80KThreeMonthHigh
#Bitcoin #Crypto #Binance
$BTC $SPCX
#BitcoinTops $80KThreeMonthHigh
I’m really happy to see Bitcoin back above $80K and touching a fresh three-month high. This move shows that buyers are becoming active again and market confidence is starting to return.
What I’m watching now is whether $80K can turn into strong support. If BTC continues holding above this level and the momentum stays strong, I think the next important areas to watch could be around $82K, $83K and $85K.
At the same time, after such a strong move, a short consolidation or pullback wouldn’t surprise me. For me, the key is not chasing the move, but watching how Bitcoin reacts around these important levels.
BTC is showing strength again, and the next few candles could be very important.
Do you think Bitcoin can hold above $80K and continue the rally? 📈
#BitcoinTops$80KThreeMonthHigh
#Bitcoin #Crypto #Binance
$BTC $SPCX
I’m really happy to see Bitcoin back above $80K and touching a fresh three-month high. This move shows that buyers are becoming active again and market confidence is starting to return.
What I’m watching now is whether $80K can turn into strong support. If BTC continues holding above this level and the momentum stays strong, I think the next important areas to watch could be around $82K, $83K and $85K.
At the same time, after such a strong move, a short consolidation or pullback wouldn’t surprise me. For me, the key is not chasing the move, but watching how Bitcoin reacts around these important levels.
BTC is showing strength again, and the next few candles could be very important.
Do you think Bitcoin can hold above $80K and continue the rally? 📈
#BitcoinTops$80KThreeMonthHigh
#Bitcoin #Crypto #Binance
$BTC $SPCX
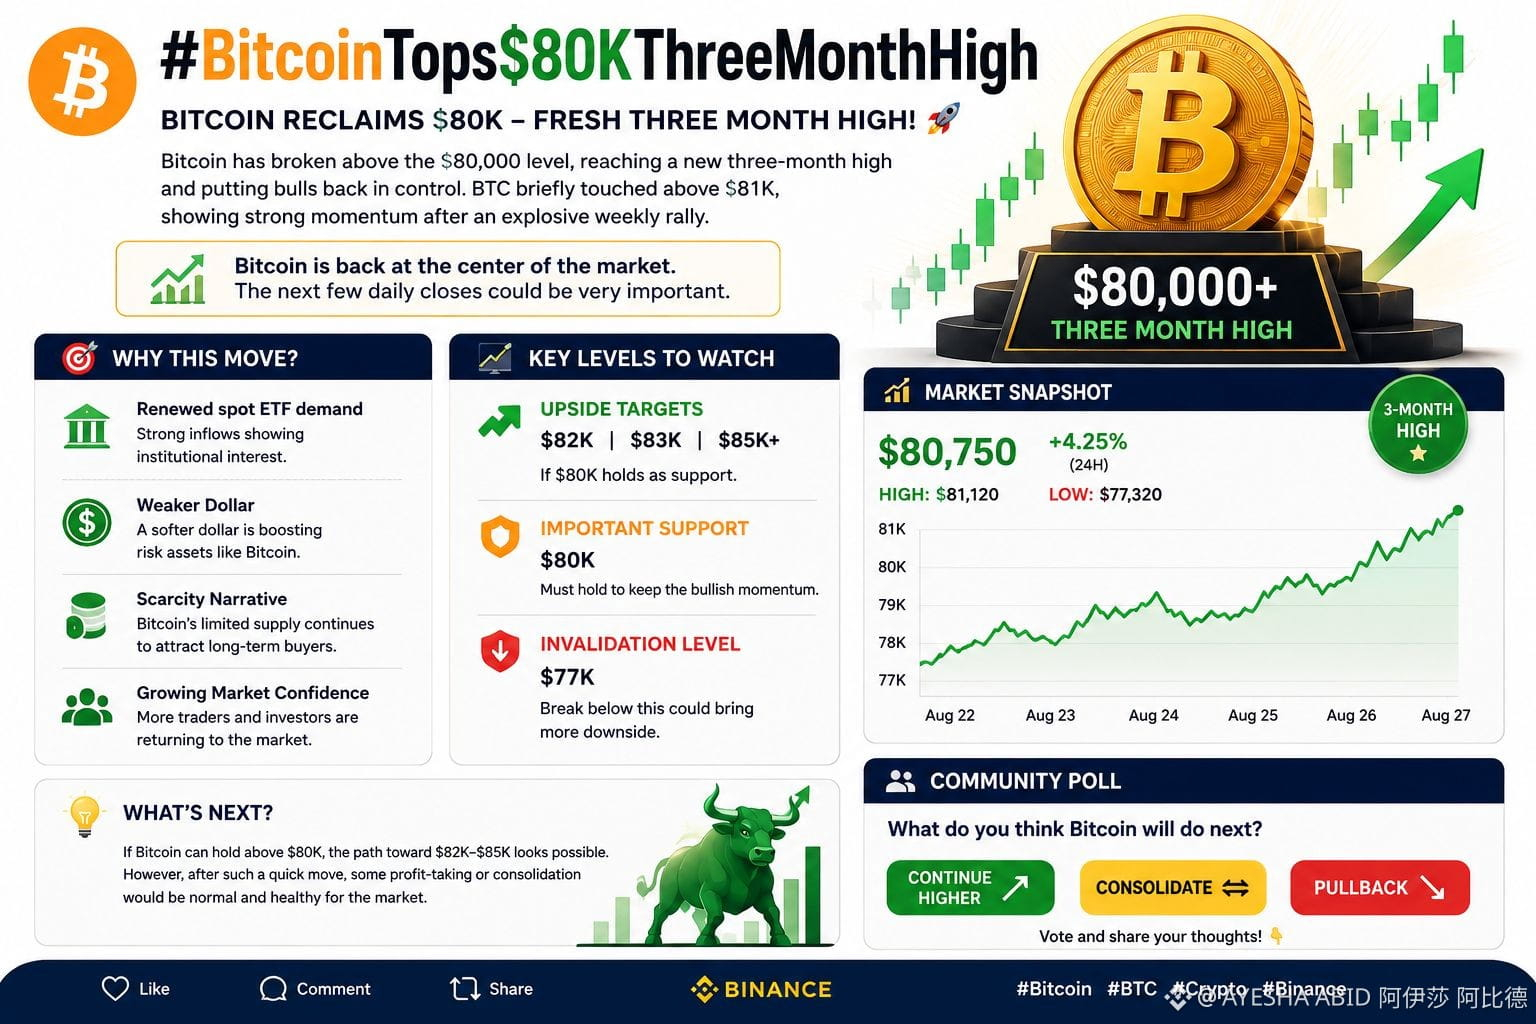
3
473

🚀 #BitcoinTops
The bulls are officially out of hibernation! 🐻❌ BTC just surpassed 80,000 USDT as if it were a cheap meme coin—driven by a massive buying streak that lasted 8 days for ETF funds.
With $2.8B flowing into ETF funds this month, we’re not just squeezing short positions anymore—this is pure, immediate institutional buying power. So what’s next? Is resistance at $83k the next stop, or are we going straight to the moon? 📈
What should traders do?
1️⃣ Stop checking your wallet every 5 seconds (just kidding, do it).
2️⃣ Keep a close eye on the wall at $83k.
3️⃣ Don’t raise your house lever; this rally is driven by spot buying, not some crazy leverage!
⚠️ Not financial advice. Always remember DYOR!
Please follow up
#BTC #BitcoinETF #BullMarket
$BTC
{future}(BTCUSDT)
🚀 #BitcoinTops
The bulls are officially out of hibernation! 🐻❌ BTC just surpassed 80,000 USDT as if it were a cheap meme coin—driven by a massive buying streak that lasted 8 days for ETF funds.
With $2.8B flowing into ETF funds this month, we’re not just squeezing short positions anymore—this is pure, immediate institutional buying power. So what’s next? Is resistance at $83k the next stop, or are we going straight to the moon? 📈
What should traders do?
1️⃣ Stop checking your wallet every 5 seconds (just kidding, do it).
2️⃣ Keep a close eye on the wall at $83k.
3️⃣ Don’t raise your house lever; this rally is driven by spot buying, not some crazy leverage!
⚠️ Not financial advice. Always remember DYOR!
Please follow up
#BTC #BitcoinETF #BullMarket
$BTC
The bulls are officially out of hibernation! 🐻❌ BTC just surpassed 80,000 USDT as if it were a cheap meme coin—driven by a massive buying streak that lasted 8 days for ETF funds.
With $2.8B flowing into ETF funds this month, we’re not just squeezing short positions anymore—this is pure, immediate institutional buying power. So what’s next? Is resistance at $83k the next stop, or are we going straight to the moon? 📈
What should traders do?
1️⃣ Stop checking your wallet every 5 seconds (just kidding, do it).
2️⃣ Keep a close eye on the wall at $83k.
3️⃣ Don’t raise your house lever; this rally is driven by spot buying, not some crazy leverage!
⚠️ Not financial advice. Always remember DYOR!
Please follow up
#BTC #BitcoinETF #BullMarket
$BTC
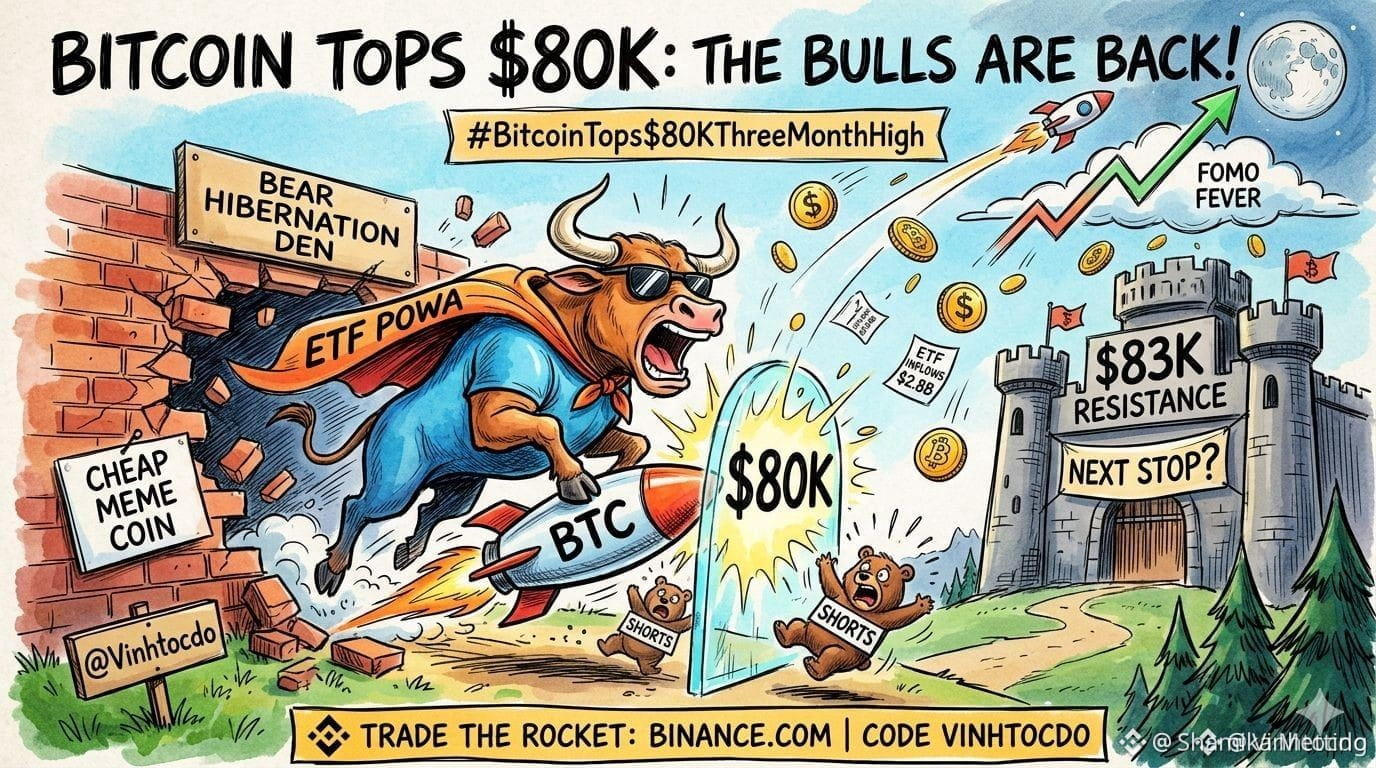
1
41
·
--
BTC above $77.5K is a positioning reset, not yet a trend verdict$BTC above $77,500 is not the whole headline. The more useful read is the combination of a 1.026% daily gain, a $78,052.85 intraday high and Square's trending $3B short-liquidation story. That is what a squeeze looks like: price rises while forced exits add fuel. ETH is stronger on the day at +1.846%, but BTC still controls 59.29% of total crypto market cap. The next test is whether spot demand can hold the move after the forced flow fades. My read changes only if BTC loses the $76,670.01 session low while ETH keeps underperforming. #BitcoinTops$70KFirstTimeInTwoMonths #BTCSurpasses$72000 #CryptoShortsLiquidated$3B
BTC above $77.5K is a positioning reset, not yet a trend verdict
$BTC above $77,500 is not the whole headline. The more useful read is the combination of a 1.026% daily gain, a $78,052.85 intraday high and Square's trending $3B short-liquidation story. That is what a squeeze looks like: price rises while forced exits add fuel. ETH is stronger on the day at +1.846%, but BTC still controls 59.29% of total crypto market cap. The next test is whether spot demand can hold the move after the forced flow fades. My read changes only if BTC loses the $76,670.01 session low while ETH keeps underperforming. #BitcoinTops$70KFirstTimeInTwoMonths #BTCSurpasses$72000 #CryptoShortsLiquidated$3B
1
130

·
--
Bullish 🟩
36%
Bearish 🟥
64%
14 votes • Voting closed
120
Log in to explore more content
Join global crypto users on Binance Square
⚡️ Get latest and useful information about crypto.
💬 Trusted by the world’s largest crypto exchange.
👍 Discover real insights from verified creators.
Email / Phone number
Trending Topics
1
#BinanceLaunchesBinanceIntelligence
65,887 views
856 Discussing
2
#StriveBuys2000BTCFor$169M
233 views
34 Discussing
3
#EvernorthXRPTreasuryCompletesSPACMerger
53,840 views
616 Discussing
4
#ADAGains10%Above$0.27
34,786 views
224 Discussing
5
#ETHUp70%InQ3ButLiquidityFalls
242,219 views
1,671 Discussing
6
#EthStakingExitQueueHits2026High
91,424 views
1,126 Discussing
7
#FedOctoberHoldOdds82.3%
95,345 views
1,073 Discussing
8
#Nikkei225Jumps2.5%ToThreeMonthHigh
100,834 views
1,317 Discussing
9
#CircleMints$2.75BUSDCOnSolanaIn7Days
2,667 views
58 Discussing
10
#DriftHackVictimsBeginClaims
210,324 views
1,976 Discussing