
#bitcoinforecast
bitcoinforecast
594,857 views
1,420 Discussing
Hot
Latest

·
--

Article
Bitcoin Falls Below $76,000 as Crypto Liquidations Cross $1 Billion Amid Tech SelloffBitcoin fell below $76,000 on November 5, 2026, as a broader technology-stock selloff pressured cryptocurrency markets. CoinGlass reported $1.03 billion in 24-hour crypto liquidations, including approximately $925 million in long positions. Bitcoin also briefly moved below its 50-week moving average at $75,733. The decline followed a post-election rebound that had taken BTC to $81,105 on Wednesday.
Bitcoin Price Drops Below $76,000 as Liquidations Surge Past $1 Billion
Bitcoin's post-election recovery reversed sharply on Thursday, November 5, as selling across technology stocks spread into cryptocurrency markets. BTC fell below $76,000, while leveraged position liquidations across the crypto market climbed above $1 billion.
The decline came after Bitcoin had recovered from $75,618 during the November 3 US midterm election count to reach $81,105 on Wednesday. That rebound quickly lost momentum as investors reassessed the outlook for technology shares, artificial intelligence spending and the wider economy.
According to CoinGlass, total crypto liquidations reached $1.03 billion over 24 hours in the latest reported reading. Ethereum also dropped below $2,300, while Coinbase and Strategy shares fell at least 9% during the session.
The simultaneous weakness in equities and digital assets points to a broader reduction in risk appetite rather than an isolated move in Bitcoin.
Technology Stocks Extend Losses as Bitcoin Reverses Its Election Rally
Bitcoin traded near $80,000 before selling pressure intensified at approximately 10 a.m. Eastern time on Thursday, according to TradingView data.
The move followed a brief recovery after Democratic victories in both chambers of Congress in the November 3 midterm elections. BTC had climbed from $75,618 during the vote count to Wednesday's intraday high of $81,105.
However, the positive momentum did not survive the next session.
The Nasdaq Composite dropped 4.2% in morning trading, reaching its lowest level since July 29. The S&P 500 declined 2.7%, with semiconductor companies among the major sources of weakness.
Qualcomm shares came under pressure after the company reported weaker-than-expected smartphone chip sales. Investors were also assessing whether greater scrutiny of new data centers could affect investment in artificial intelligence infrastructure.
Economist Mohamed El-Erian questioned whether the new Congress would slow the technology sector's expansion. He also raised concerns about how the economy might perform if technology earnings and investment stopped providing support for growth.
These developments matter for crypto because Bitcoin increasingly trades within the same broader risk environment as technology stocks. When investors reduce exposure to growth-oriented assets, leveraged positions in digital markets can become vulnerable to rapid unwinding.
Oil Rises as Middle East Supply Concerns Add to Market Uncertainty
The broader market decline unfolded alongside a rise in oil prices.
West Texas Intermediate moved back above $90 per barrel, while Brent crude gained approximately 2.5% to trade near $97.
The increase followed reports of fresh attacks on tankers in the Middle East, reviving concerns about potential disruptions to energy supplies.
Higher oil prices can complicate the inflation and interest-rate outlook, particularly if supply concerns persist. That creates another source of uncertainty for investors already assessing technology-sector valuations and economic growth.
The combination of falling equities and rising oil prices added to the unsettled market environment surrounding Thursday's Bitcoin decline.
Crypto Liquidations Cross $1 Billion as Long Positions Bear the Brunt
Leveraged trading amplified the cryptocurrency selloff.
An earlier CoinGlass reading put total 24-hour liquidations at $838.54 million. Long positions accounted for $741.04 million of that amount.
Long trades are structured to benefit when an asset's price rises. When the market moves sharply in the opposite direction, falling collateral values can push positions below exchange margin requirements, triggering automatic closures.
The pace of forced selling accelerated during the US trading session. Exchanges liquidated approximately $555 million in positions during the hour through 10:30 a.m. Eastern, including roughly $520 million in long positions.
In the latest reading, total liquidations reached $1.03 billion, with approximately $925 million in longs, representing nearly 90% of the total.
Bitcoin accounted for around $256 million in liquidations, while Ether followed with approximately $164 million.
The concentration in long positions shows how traders positioned for continued price gains were particularly exposed when the market reversed. As exchanges automatically close leveraged trades, the resulting market orders can add further selling pressure, especially when buyers are less willing to absorb supply.
Binance Accounts for Nearly Half of Liquidation Value
Binance represented nearly half of the dollar value of liquidations in the latest CoinGlass reading.
The concentration comes roughly a week after an October 29 security breach at the exchange. Binance said the incident affected approximately $6.34 billion in assets and pledged to cover the losses.
The timing places additional attention on activity at one of the largest venues for cryptocurrency trading. However, the available liquidation figures do not establish a connection between the earlier security incident and Thursday's market decline.
Liquidations reflect the forced closure of leveraged positions when margin requirements are no longer met. They can rise rapidly during volatile sessions, regardless of whether an exchange has experienced a separate security event.
Bitcoin Slips Below Its 50-Week Moving Average
Bitcoin's decline also brought an important technical level into focus.
The price briefly moved below its 50-week simple moving average at $75,733, falling approximately $270 beneath the indicator. The 50-week average calculates the mean of Bitcoin's closing prices over the previous 50 weeks.
The level has helped contain BTC declines since mid-September, making Thursday's move significant for traders monitoring longer-term market structure.
Bitcoin also slipped below the $75,600 to $76,000 range, an area where buyers had previously entered during the election-night decline. The move placed BTC near the lower end of its one-month trading range.
A brief move below a moving average does not, by itself, establish a lasting breakdown. Traders generally distinguish between an intraday breach and a weekly close, which can provide a clearer indication of whether a longer-term support level has weakened.
That distinction is especially relevant while liquidation activity remains elevated and broader financial markets are experiencing sharp moves.
Rekt Capital Draws a Comparison With Bitcoin's May Decline
Crypto analyst Rekt Capital highlighted a historical comparison with Bitcoin's market behavior in May.
At that time, BTC traded around $80,000 before breaking lower. The decline continued into late June, when Bitcoin reached approximately $57,000.
The comparison draws attention to the possibility that a period of apparent price stability can give way to a deeper correction. However, historical similarities do not establish that the current market will follow the same path.
The immediate technical levels remain important in assessing the latest move. If Bitcoin stages a recovery, the first resistance area identified in the supplied market analysis sits between $80,000 and $81,105.
The upper end of that range represents Wednesday's intraday peak on Bitstamp. It is a reference point from recent trading, not a guarantee of where the market will move next.
What the Liquidation Surge Says About Trader Positioning
The latest figures reveal how heavily the market was positioned for rising prices before Thursday's reversal.
With long positions accounting for nearly 90% of the latest liquidation total, the decline forced a substantial number of bullish leveraged traders out of their positions.
This can create a feedback loop. Falling prices trigger liquidations, forced closures add sell orders, and the additional selling can push prices lower if market demand is insufficient.
The process can make a correction more abrupt than the initial change in investor sentiment might suggest.
It also explains why liquidation totals should be read alongside spot-market activity, trading volume and open interest. A large liquidation figure reveals the scale of forced position closures, but does not independently explain whether long-term investors are changing their outlook.
The simultaneous weakness in technology stocks adds another layer. If investors continue reducing exposure to risk-sensitive assets, crypto markets may remain vulnerable to volatility. A stabilization in equities could ease some of that pressure, although it would not automatically reverse crypto-specific positioning.
Bitcoin Faces a Test After the Post-Election Reversal
Bitcoin's move below $76,000 has put both its recent trading range and its 50-week moving average under scrutiny.
The next phase will depend partly on whether the price can regain the levels lost during Thursday's selloff, whether forced liquidations begin to ease and how technology stocks respond to the broader economic and investment concerns.
A recovery toward the $80,000 to $81,105 area would bring the recent trading range back into focus. Continued weakness, particularly if accompanied by a weekly close below the 50-week average, would keep attention on the durability of longer-term support.
Neither outcome is established by the current data.
Post firts publish on CryptosNewss.com
#bitcoindominance #BitcoinForecast $BTC
{spot}(BTCUSDT)
Bitcoin Falls Below $76,000 as Crypto Liquidations Cross $1 Billion Amid Tech Selloff
Bitcoin fell below $76,000 on November 5, 2026, as a broader technology-stock selloff pressured cryptocurrency markets. CoinGlass reported $1.03 billion in 24-hour crypto liquidations, including approximately $925 million in long positions. Bitcoin also briefly moved below its 50-week moving average at $75,733. The decline followed a post-election rebound that had taken BTC to $81,105 on Wednesday.
Bitcoin Price Drops Below $76,000 as Liquidations Surge Past $1 Billion
Bitcoin's post-election recovery reversed sharply on Thursday, November 5, as selling across technology stocks spread into cryptocurrency markets. BTC fell below $76,000, while leveraged position liquidations across the crypto market climbed above $1 billion.
The decline came after Bitcoin had recovered from $75,618 during the November 3 US midterm election count to reach $81,105 on Wednesday. That rebound quickly lost momentum as investors reassessed the outlook for technology shares, artificial intelligence spending and the wider economy.
According to CoinGlass, total crypto liquidations reached $1.03 billion over 24 hours in the latest reported reading. Ethereum also dropped below $2,300, while Coinbase and Strategy shares fell at least 9% during the session.
The simultaneous weakness in equities and digital assets points to a broader reduction in risk appetite rather than an isolated move in Bitcoin.
Technology Stocks Extend Losses as Bitcoin Reverses Its Election Rally
Bitcoin traded near $80,000 before selling pressure intensified at approximately 10 a.m. Eastern time on Thursday, according to TradingView data.
The move followed a brief recovery after Democratic victories in both chambers of Congress in the November 3 midterm elections. BTC had climbed from $75,618 during the vote count to Wednesday's intraday high of $81,105.
However, the positive momentum did not survive the next session.
The Nasdaq Composite dropped 4.2% in morning trading, reaching its lowest level since July 29. The S&P 500 declined 2.7%, with semiconductor companies among the major sources of weakness.
Qualcomm shares came under pressure after the company reported weaker-than-expected smartphone chip sales. Investors were also assessing whether greater scrutiny of new data centers could affect investment in artificial intelligence infrastructure.
Economist Mohamed El-Erian questioned whether the new Congress would slow the technology sector's expansion. He also raised concerns about how the economy might perform if technology earnings and investment stopped providing support for growth.
These developments matter for crypto because Bitcoin increasingly trades within the same broader risk environment as technology stocks. When investors reduce exposure to growth-oriented assets, leveraged positions in digital markets can become vulnerable to rapid unwinding.
Oil Rises as Middle East Supply Concerns Add to Market Uncertainty
The broader market decline unfolded alongside a rise in oil prices.
West Texas Intermediate moved back above $90 per barrel, while Brent crude gained approximately 2.5% to trade near $97.
The increase followed reports of fresh attacks on tankers in the Middle East, reviving concerns about potential disruptions to energy supplies.
Higher oil prices can complicate the inflation and interest-rate outlook, particularly if supply concerns persist. That creates another source of uncertainty for investors already assessing technology-sector valuations and economic growth.
The combination of falling equities and rising oil prices added to the unsettled market environment surrounding Thursday's Bitcoin decline.
Crypto Liquidations Cross $1 Billion as Long Positions Bear the Brunt
Leveraged trading amplified the cryptocurrency selloff.
An earlier CoinGlass reading put total 24-hour liquidations at $838.54 million. Long positions accounted for $741.04 million of that amount.
Long trades are structured to benefit when an asset's price rises. When the market moves sharply in the opposite direction, falling collateral values can push positions below exchange margin requirements, triggering automatic closures.
The pace of forced selling accelerated during the US trading session. Exchanges liquidated approximately $555 million in positions during the hour through 10:30 a.m. Eastern, including roughly $520 million in long positions.
In the latest reading, total liquidations reached $1.03 billion, with approximately $925 million in longs, representing nearly 90% of the total.
Bitcoin accounted for around $256 million in liquidations, while Ether followed with approximately $164 million.
The concentration in long positions shows how traders positioned for continued price gains were particularly exposed when the market reversed. As exchanges automatically close leveraged trades, the resulting market orders can add further selling pressure, especially when buyers are less willing to absorb supply.
Binance Accounts for Nearly Half of Liquidation Value
Binance represented nearly half of the dollar value of liquidations in the latest CoinGlass reading.
The concentration comes roughly a week after an October 29 security breach at the exchange. Binance said the incident affected approximately $6.34 billion in assets and pledged to cover the losses.
The timing places additional attention on activity at one of the largest venues for cryptocurrency trading. However, the available liquidation figures do not establish a connection between the earlier security incident and Thursday's market decline.
Liquidations reflect the forced closure of leveraged positions when margin requirements are no longer met. They can rise rapidly during volatile sessions, regardless of whether an exchange has experienced a separate security event.
Bitcoin Slips Below Its 50-Week Moving Average
Bitcoin's decline also brought an important technical level into focus.
The price briefly moved below its 50-week simple moving average at $75,733, falling approximately $270 beneath the indicator. The 50-week average calculates the mean of Bitcoin's closing prices over the previous 50 weeks.
The level has helped contain BTC declines since mid-September, making Thursday's move significant for traders monitoring longer-term market structure.
Bitcoin also slipped below the $75,600 to $76,000 range, an area where buyers had previously entered during the election-night decline. The move placed BTC near the lower end of its one-month trading range.
A brief move below a moving average does not, by itself, establish a lasting breakdown. Traders generally distinguish between an intraday breach and a weekly close, which can provide a clearer indication of whether a longer-term support level has weakened.
That distinction is especially relevant while liquidation activity remains elevated and broader financial markets are experiencing sharp moves.
Rekt Capital Draws a Comparison With Bitcoin's May Decline
Crypto analyst Rekt Capital highlighted a historical comparison with Bitcoin's market behavior in May.
At that time, BTC traded around $80,000 before breaking lower. The decline continued into late June, when Bitcoin reached approximately $57,000.
The comparison draws attention to the possibility that a period of apparent price stability can give way to a deeper correction. However, historical similarities do not establish that the current market will follow the same path.
The immediate technical levels remain important in assessing the latest move. If Bitcoin stages a recovery, the first resistance area identified in the supplied market analysis sits between $80,000 and $81,105.
The upper end of that range represents Wednesday's intraday peak on Bitstamp. It is a reference point from recent trading, not a guarantee of where the market will move next.
What the Liquidation Surge Says About Trader Positioning
The latest figures reveal how heavily the market was positioned for rising prices before Thursday's reversal.
With long positions accounting for nearly 90% of the latest liquidation total, the decline forced a substantial number of bullish leveraged traders out of their positions.
This can create a feedback loop. Falling prices trigger liquidations, forced closures add sell orders, and the additional selling can push prices lower if market demand is insufficient.
The process can make a correction more abrupt than the initial change in investor sentiment might suggest.
It also explains why liquidation totals should be read alongside spot-market activity, trading volume and open interest. A large liquidation figure reveals the scale of forced position closures, but does not independently explain whether long-term investors are changing their outlook.
The simultaneous weakness in technology stocks adds another layer. If investors continue reducing exposure to risk-sensitive assets, crypto markets may remain vulnerable to volatility. A stabilization in equities could ease some of that pressure, although it would not automatically reverse crypto-specific positioning.
Bitcoin Faces a Test After the Post-Election Reversal
Bitcoin's move below $76,000 has put both its recent trading range and its 50-week moving average under scrutiny.
The next phase will depend partly on whether the price can regain the levels lost during Thursday's selloff, whether forced liquidations begin to ease and how technology stocks respond to the broader economic and investment concerns.
A recovery toward the $80,000 to $81,105 area would bring the recent trading range back into focus. Continued weakness, particularly if accompanied by a weekly close below the 50-week average, would keep attention on the durability of longer-term support.
Neither outcome is established by the current data.
Post firts publish on CryptosNewss.com
#bitcoindominance #BitcoinForecast $BTC
Bitcoin Price Drops Below $76,000 as Liquidations Surge Past $1 Billion
Bitcoin's post-election recovery reversed sharply on Thursday, November 5, as selling across technology stocks spread into cryptocurrency markets. BTC fell below $76,000, while leveraged position liquidations across the crypto market climbed above $1 billion.
The decline came after Bitcoin had recovered from $75,618 during the November 3 US midterm election count to reach $81,105 on Wednesday. That rebound quickly lost momentum as investors reassessed the outlook for technology shares, artificial intelligence spending and the wider economy.
According to CoinGlass, total crypto liquidations reached $1.03 billion over 24 hours in the latest reported reading. Ethereum also dropped below $2,300, while Coinbase and Strategy shares fell at least 9% during the session.
The simultaneous weakness in equities and digital assets points to a broader reduction in risk appetite rather than an isolated move in Bitcoin.
Technology Stocks Extend Losses as Bitcoin Reverses Its Election Rally
Bitcoin traded near $80,000 before selling pressure intensified at approximately 10 a.m. Eastern time on Thursday, according to TradingView data.
The move followed a brief recovery after Democratic victories in both chambers of Congress in the November 3 midterm elections. BTC had climbed from $75,618 during the vote count to Wednesday's intraday high of $81,105.
However, the positive momentum did not survive the next session.
The Nasdaq Composite dropped 4.2% in morning trading, reaching its lowest level since July 29. The S&P 500 declined 2.7%, with semiconductor companies among the major sources of weakness.
Qualcomm shares came under pressure after the company reported weaker-than-expected smartphone chip sales. Investors were also assessing whether greater scrutiny of new data centers could affect investment in artificial intelligence infrastructure.
Economist Mohamed El-Erian questioned whether the new Congress would slow the technology sector's expansion. He also raised concerns about how the economy might perform if technology earnings and investment stopped providing support for growth.
These developments matter for crypto because Bitcoin increasingly trades within the same broader risk environment as technology stocks. When investors reduce exposure to growth-oriented assets, leveraged positions in digital markets can become vulnerable to rapid unwinding.
Oil Rises as Middle East Supply Concerns Add to Market Uncertainty
The broader market decline unfolded alongside a rise in oil prices.
West Texas Intermediate moved back above $90 per barrel, while Brent crude gained approximately 2.5% to trade near $97.
The increase followed reports of fresh attacks on tankers in the Middle East, reviving concerns about potential disruptions to energy supplies.
Higher oil prices can complicate the inflation and interest-rate outlook, particularly if supply concerns persist. That creates another source of uncertainty for investors already assessing technology-sector valuations and economic growth.
The combination of falling equities and rising oil prices added to the unsettled market environment surrounding Thursday's Bitcoin decline.
Crypto Liquidations Cross $1 Billion as Long Positions Bear the Brunt
Leveraged trading amplified the cryptocurrency selloff.
An earlier CoinGlass reading put total 24-hour liquidations at $838.54 million. Long positions accounted for $741.04 million of that amount.
Long trades are structured to benefit when an asset's price rises. When the market moves sharply in the opposite direction, falling collateral values can push positions below exchange margin requirements, triggering automatic closures.
The pace of forced selling accelerated during the US trading session. Exchanges liquidated approximately $555 million in positions during the hour through 10:30 a.m. Eastern, including roughly $520 million in long positions.
In the latest reading, total liquidations reached $1.03 billion, with approximately $925 million in longs, representing nearly 90% of the total.
Bitcoin accounted for around $256 million in liquidations, while Ether followed with approximately $164 million.
The concentration in long positions shows how traders positioned for continued price gains were particularly exposed when the market reversed. As exchanges automatically close leveraged trades, the resulting market orders can add further selling pressure, especially when buyers are less willing to absorb supply.
Binance Accounts for Nearly Half of Liquidation Value
Binance represented nearly half of the dollar value of liquidations in the latest CoinGlass reading.
The concentration comes roughly a week after an October 29 security breach at the exchange. Binance said the incident affected approximately $6.34 billion in assets and pledged to cover the losses.
The timing places additional attention on activity at one of the largest venues for cryptocurrency trading. However, the available liquidation figures do not establish a connection between the earlier security incident and Thursday's market decline.
Liquidations reflect the forced closure of leveraged positions when margin requirements are no longer met. They can rise rapidly during volatile sessions, regardless of whether an exchange has experienced a separate security event.
Bitcoin Slips Below Its 50-Week Moving Average
Bitcoin's decline also brought an important technical level into focus.
The price briefly moved below its 50-week simple moving average at $75,733, falling approximately $270 beneath the indicator. The 50-week average calculates the mean of Bitcoin's closing prices over the previous 50 weeks.
The level has helped contain BTC declines since mid-September, making Thursday's move significant for traders monitoring longer-term market structure.
Bitcoin also slipped below the $75,600 to $76,000 range, an area where buyers had previously entered during the election-night decline. The move placed BTC near the lower end of its one-month trading range.
A brief move below a moving average does not, by itself, establish a lasting breakdown. Traders generally distinguish between an intraday breach and a weekly close, which can provide a clearer indication of whether a longer-term support level has weakened.
That distinction is especially relevant while liquidation activity remains elevated and broader financial markets are experiencing sharp moves.
Rekt Capital Draws a Comparison With Bitcoin's May Decline
Crypto analyst Rekt Capital highlighted a historical comparison with Bitcoin's market behavior in May.
At that time, BTC traded around $80,000 before breaking lower. The decline continued into late June, when Bitcoin reached approximately $57,000.
The comparison draws attention to the possibility that a period of apparent price stability can give way to a deeper correction. However, historical similarities do not establish that the current market will follow the same path.
The immediate technical levels remain important in assessing the latest move. If Bitcoin stages a recovery, the first resistance area identified in the supplied market analysis sits between $80,000 and $81,105.
The upper end of that range represents Wednesday's intraday peak on Bitstamp. It is a reference point from recent trading, not a guarantee of where the market will move next.
What the Liquidation Surge Says About Trader Positioning
The latest figures reveal how heavily the market was positioned for rising prices before Thursday's reversal.
With long positions accounting for nearly 90% of the latest liquidation total, the decline forced a substantial number of bullish leveraged traders out of their positions.
This can create a feedback loop. Falling prices trigger liquidations, forced closures add sell orders, and the additional selling can push prices lower if market demand is insufficient.
The process can make a correction more abrupt than the initial change in investor sentiment might suggest.
It also explains why liquidation totals should be read alongside spot-market activity, trading volume and open interest. A large liquidation figure reveals the scale of forced position closures, but does not independently explain whether long-term investors are changing their outlook.
The simultaneous weakness in technology stocks adds another layer. If investors continue reducing exposure to risk-sensitive assets, crypto markets may remain vulnerable to volatility. A stabilization in equities could ease some of that pressure, although it would not automatically reverse crypto-specific positioning.
Bitcoin Faces a Test After the Post-Election Reversal
Bitcoin's move below $76,000 has put both its recent trading range and its 50-week moving average under scrutiny.
The next phase will depend partly on whether the price can regain the levels lost during Thursday's selloff, whether forced liquidations begin to ease and how technology stocks respond to the broader economic and investment concerns.
A recovery toward the $80,000 to $81,105 area would bring the recent trading range back into focus. Continued weakness, particularly if accompanied by a weekly close below the 50-week average, would keep attention on the durability of longer-term support.
Neither outcome is established by the current data.
Post firts publish on CryptosNewss.com
#bitcoindominance #BitcoinForecast $BTC
151

JPMorgan Forecasts 10% Annual Bitcoin Returns, Giving BTC a Place in Its 2027 Outlook
#BTC #bitcoin #BitcoinForecast #BitcoinForecast #BTC走势分析 $BTC
{spot}(BTCUSDT)
Read Here: https://altcoinsanalysis.com/jpmorgan-forecasts-10-annual-bitcoin-returns-giving-btc-a-place-in-its-2027-outlook/
JPMorgan Forecasts 10% Annual Bitcoin Returns, Giving BTC a Place in Its 2027 Outlook
#BTC #bitcoin #BitcoinForecast #BitcoinForecast #BTC走势分析 $BTC
Read Here: https://altcoinsanalysis.com/jpmorgan-forecasts-10-annual-bitcoin-returns-giving-btc-a-place-in-its-2027-outlook/
#BTC #bitcoin #BitcoinForecast #BitcoinForecast #BTC走势分析 $BTC
Read Here: https://altcoinsanalysis.com/jpmorgan-forecasts-10-annual-bitcoin-returns-giving-btc-a-place-in-its-2027-outlook/
80

·
--
Bearish
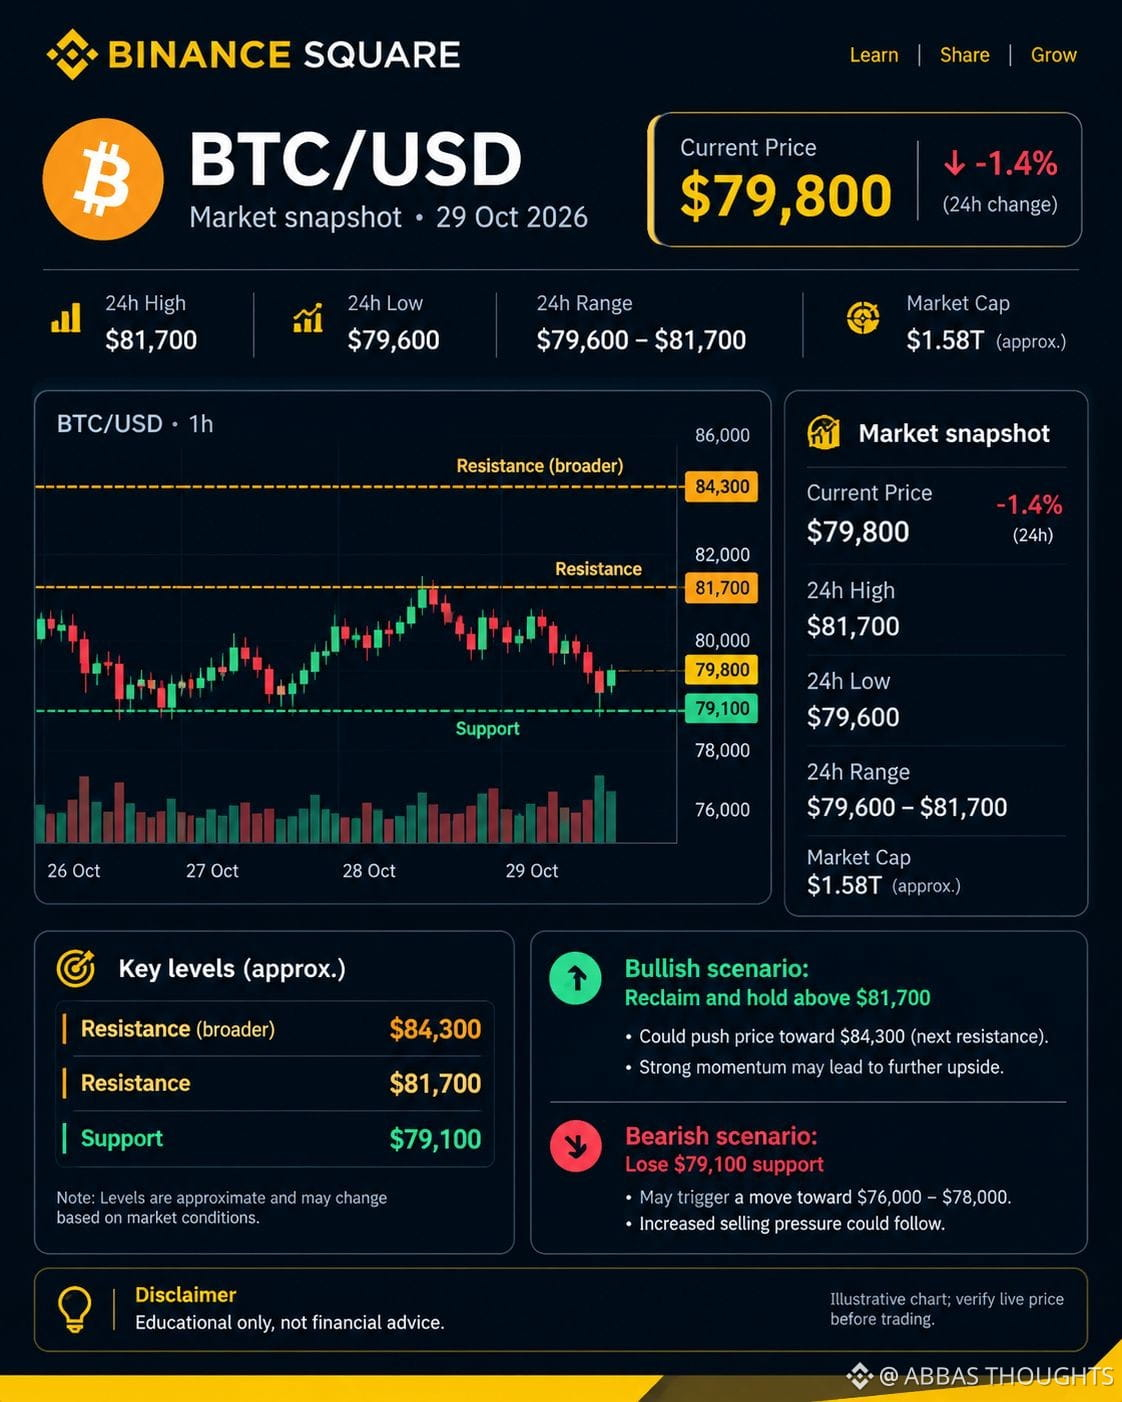
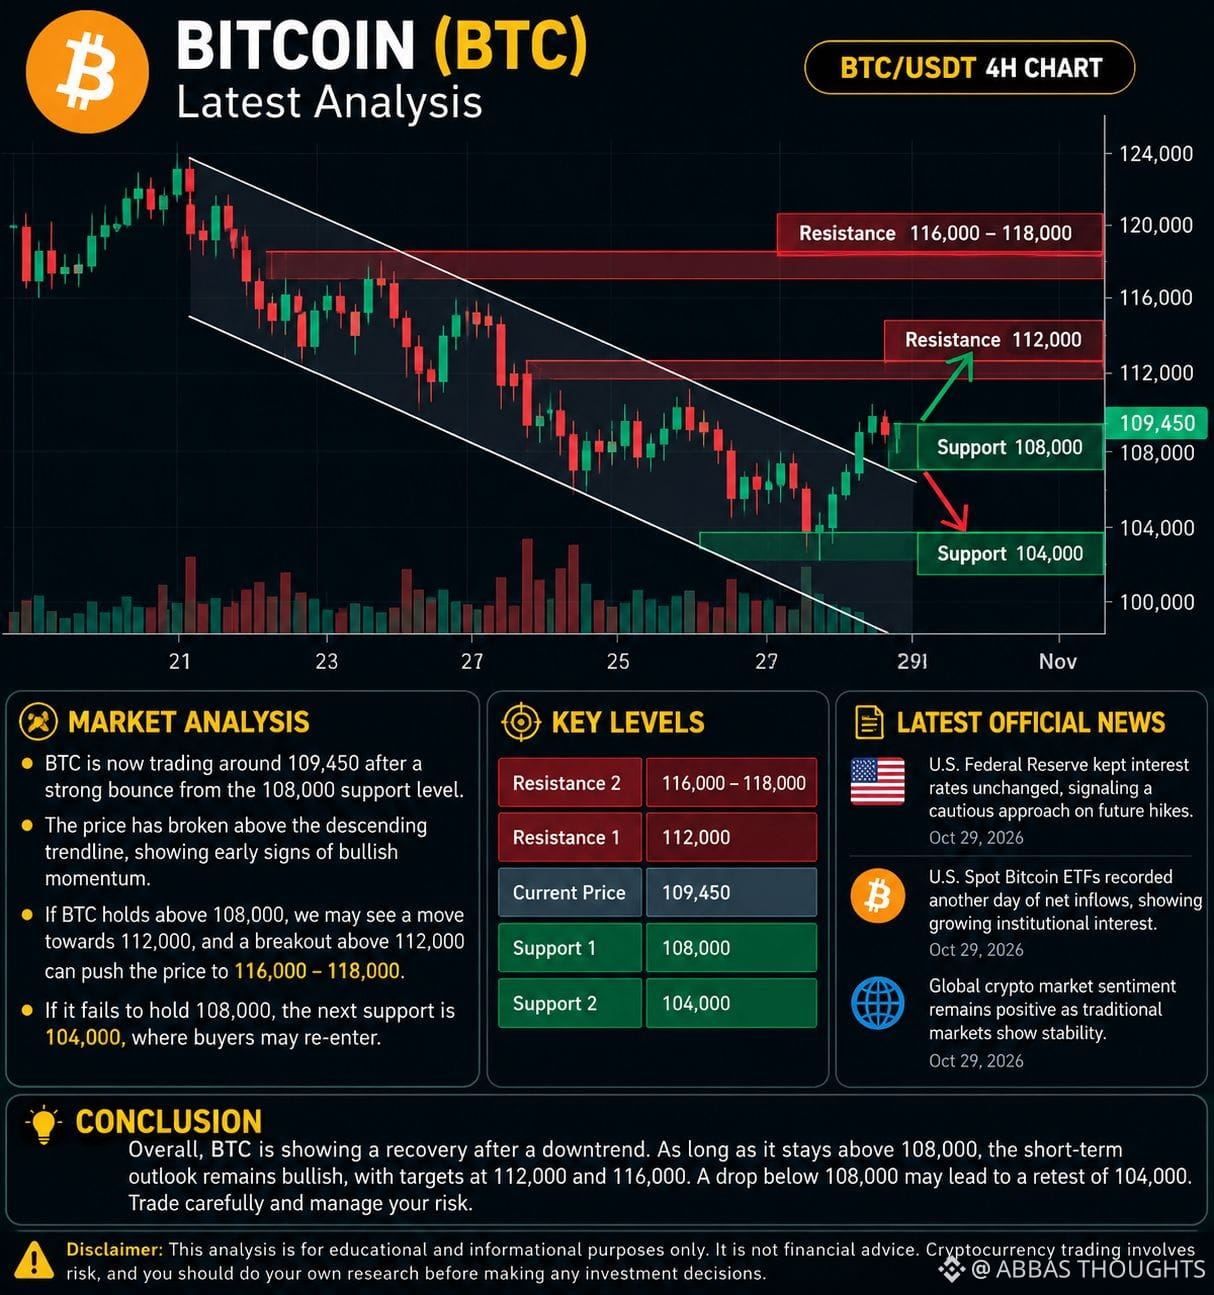
I checked Binance’s latest available $BTC Bitcoin market data for 29 October 2026.$BTC is trading around $79,800, down approximately 1.4% over 24 hours. The reported 24-hour range is roughly $79,600–$81,700. These figures change continuously, so check the live price before publishing.
Here is a ready-to-post analysis for Binance Square, with a candlestick-style visual.
Bitcoin (BTC) — Latest Market Analysis
29 October 2026 · Market data from Binance
BTC price
$79,800
−1.4% in 24h
24h range
$79,600–$81,700
Approximate
Technical analysis
Current trend: Short-term selling pressure is present after BTC failed to hold higher prices.
Support: Around $79,100–$79,600. A break below this area could open the way toward $78,000.
Resistance: $81,700. A strong move above this level could bring $84,300 into focus.
Bullish scenario: BTC recovers above $81,700 and holds that level.
Bearish scenario: BTC loses support around $79,100, increasing downside risk.
These are approximate technical reference levels, not guaranteed targets.
Official market reference
Check live $BTC prices and market statistics directly on Binance:
Binance — Official Bitcoin Price and Market Data
{spot}(BTCUSDT)
#BitcoinCore32.1RaisesPeerConnectionLimit #BitcoinWarnings #BitcoinForecast #BinanceSquareFamily
I checked Binance’s latest available $BTC Bitcoin market data for 29 October 2026.$BTC is trading around $79,800, down approximately 1.4% over 24 hours. The reported 24-hour range is roughly $79,600–$81,700. These figures change continuously, so check the live price before publishing.
Here is a ready-to-post analysis for Binance Square, with a candlestick-style visual.
Bitcoin (BTC) — Latest Market Analysis
29 October 2026 · Market data from Binance
BTC price
$79,800
−1.4% in 24h
24h range
$79,600–$81,700
Approximate
Technical analysis
Current trend: Short-term selling pressure is present after BTC failed to hold higher prices.
Support: Around $79,100–$79,600. A break below this area could open the way toward $78,000.
Resistance: $81,700. A strong move above this level could bring $84,300 into focus.
Bullish scenario: BTC recovers above $81,700 and holds that level.
Bearish scenario: BTC loses support around $79,100, increasing downside risk.
These are approximate technical reference levels, not guaranteed targets.
Official market reference
Check live $BTC prices and market statistics directly on Binance:
Binance — Official Bitcoin Price and Market Data
#BitcoinCore32.1RaisesPeerConnectionLimit #BitcoinWarnings #BitcoinForecast #BinanceSquareFamily
Here is a ready-to-post analysis for Binance Square, with a candlestick-style visual.
Bitcoin (BTC) — Latest Market Analysis
29 October 2026 · Market data from Binance
BTC price
$79,800
−1.4% in 24h
24h range
$79,600–$81,700
Approximate
Technical analysis
Current trend: Short-term selling pressure is present after BTC failed to hold higher prices.
Support: Around $79,100–$79,600. A break below this area could open the way toward $78,000.
Resistance: $81,700. A strong move above this level could bring $84,300 into focus.
Bullish scenario: BTC recovers above $81,700 and holds that level.
Bearish scenario: BTC loses support around $79,100, increasing downside risk.
These are approximate technical reference levels, not guaranteed targets.
Official market reference
Check live $BTC prices and market statistics directly on Binance:
Binance — Official Bitcoin Price and Market Data
#BitcoinCore32.1RaisesPeerConnectionLimit #BitcoinWarnings #BitcoinForecast #BinanceSquareFamily
1
7
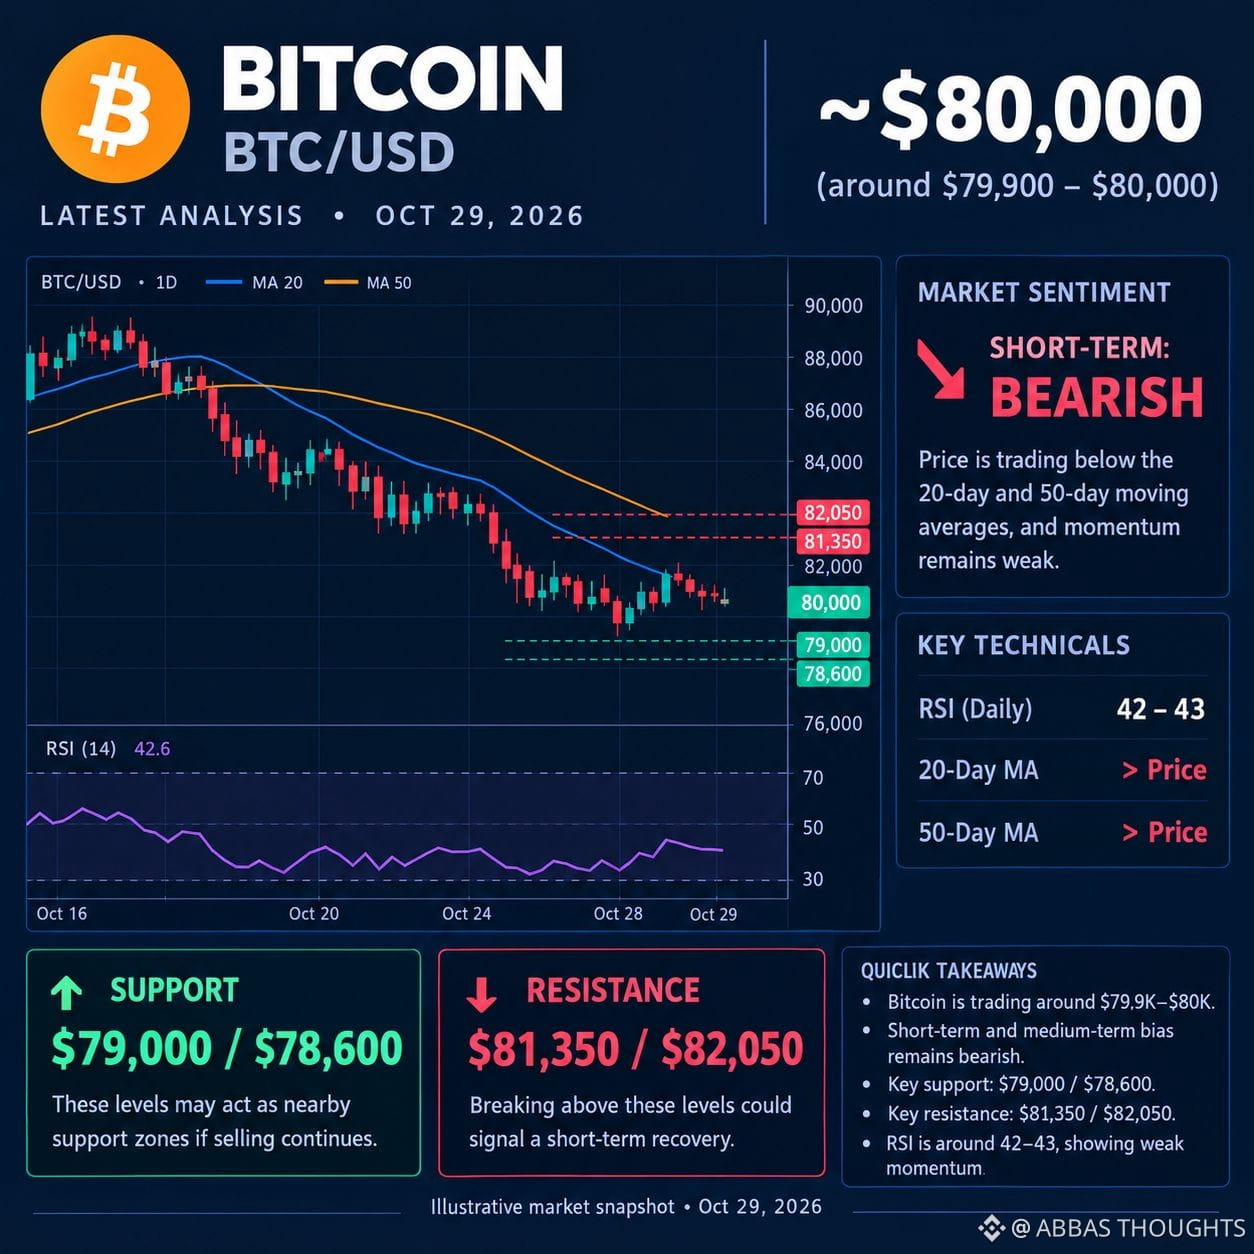
$BTC Resistance (selling pressure)
$81,350 – $82,050
Support (buying zone to watch)
$79,000 – $78,600
Technical levels reported for October 29, 2026.
Bitcoin chart picture
Illustrative technical chart — not a live exchange chart.
What could happen next?
Bullish scenario: $BTC breaks above $82,050 and holds, potentially sporting a recovery.
Bearish scenario: $BTC falls below $78,600, increasing the risk of further downside.
Current view: Cautious to bearish in the short term; wait for confirmation before entering a trade.
My suggestion: Avoid chasing sudden price movements, and use a stop-loss if trading. Crypto is highly volatile, and these levels are not guaranteed
#BitcoinForecast #BitcoinAnalysis #BitcoinThoughts #BitcoinCore32.1RaisesPeerConnectionLimit #BitcoinWarnings
WHAT ABOUT YOUR THOUGHTS TELL ME IN COMMENTS ..!
{spot}(BTCUSDT)
$BTC Resistance (selling pressure)
$81,350 – $82,050
Support (buying zone to watch)
$79,000 – $78,600
Technical levels reported for October 29, 2026.
Bitcoin chart picture
Illustrative technical chart — not a live exchange chart.
What could happen next?
Bullish scenario: $BTC breaks above $82,050 and holds, potentially sporting a recovery.
Bearish scenario: $BTC falls below $78,600, increasing the risk of further downside.
Current view: Cautious to bearish in the short term; wait for confirmation before entering a trade.
My suggestion: Avoid chasing sudden price movements, and use a stop-loss if trading. Crypto is highly volatile, and these levels are not guaranteed
#BitcoinForecast #BitcoinAnalysis #BitcoinThoughts #BitcoinCore32.1RaisesPeerConnectionLimit #BitcoinWarnings
WHAT ABOUT YOUR THOUGHTS TELL ME IN COMMENTS ..!
$81,350 – $82,050
Support (buying zone to watch)
$79,000 – $78,600
Technical levels reported for October 29, 2026.
Bitcoin chart picture
Illustrative technical chart — not a live exchange chart.
What could happen next?
Bullish scenario: $BTC breaks above $82,050 and holds, potentially sporting a recovery.
Bearish scenario: $BTC falls below $78,600, increasing the risk of further downside.
Current view: Cautious to bearish in the short term; wait for confirmation before entering a trade.
My suggestion: Avoid chasing sudden price movements, and use a stop-loss if trading. Crypto is highly volatile, and these levels are not guaranteed
#BitcoinForecast #BitcoinAnalysis #BitcoinThoughts #BitcoinCore32.1RaisesPeerConnectionLimit #BitcoinWarnings
WHAT ABOUT YOUR THOUGHTS TELL ME IN COMMENTS ..!
20

#FOMC Impact TODAY: Exact Targets For The Fed Rate Shock! 📉🚀
The Federal Reserve concludes its high-stakes #FOMC meeting TODAY. With core inflation sitting hot at 2.6% and oil surging past $115, massive market volatility is loading.
Here is your exact number-driven trading blueprint for the two possible outcomes:
🐻 SCENARIO A: Hawkish (Rate Hike/Higher For Longer)
The Reaction: Capital flees risk assets into the US Dollar.
🎯 Target Floors to Watch:
$BTC : Rapid drop to $78,200, with a liquidation wick potential down to $77,400.
$ETH : A breakdown past current support toward the $2,150 key safety block.
🐂 SCENARIO B: Dovish (Rate Pause/Soft Stance)
The Reaction: A massive relief rally triggers an aggressive short squeeze.
🎯 Target Profits (TP):
BTC: A clean breakout past $82,000, racing toward $84,000 – $85,500.
ETH: A sharp bounce to reclaim the crucial $2,500 psychological resistance.
⚠️ RISK WARNING: Volatility will explode the exact second the statement drops. Protect your leverage!
👇 CLICK TO MONITOR THE VOLATILITY LIVE:
Track the live candles on $BTC 📊
Monitor the floor on ETH 🐼
#FOMCForecast #BitcoinForecast #Ethereum
#FOMC Impact TODAY: Exact Targets For The Fed Rate Shock! 📉🚀
The Federal Reserve concludes its high-stakes #FOMC meeting TODAY. With core inflation sitting hot at 2.6% and oil surging past $115, massive market volatility is loading.
Here is your exact number-driven trading blueprint for the two possible outcomes:
🐻 SCENARIO A: Hawkish (Rate Hike/Higher For Longer)
The Reaction: Capital flees risk assets into the US Dollar.
🎯 Target Floors to Watch:
$BTC : Rapid drop to $78,200, with a liquidation wick potential down to $77,400.
$ETH : A breakdown past current support toward the $2,150 key safety block.
🐂 SCENARIO B: Dovish (Rate Pause/Soft Stance)
The Reaction: A massive relief rally triggers an aggressive short squeeze.
🎯 Target Profits (TP):
BTC: A clean breakout past $82,000, racing toward $84,000 – $85,500.
ETH: A sharp bounce to reclaim the crucial $2,500 psychological resistance.
⚠️ RISK WARNING: Volatility will explode the exact second the statement drops. Protect your leverage!
👇 CLICK TO MONITOR THE VOLATILITY LIVE:
Track the live candles on $BTC 📊
Monitor the floor on ETH 🐼
#FOMCForecast #BitcoinForecast #Ethereum
The Federal Reserve concludes its high-stakes #FOMC meeting TODAY. With core inflation sitting hot at 2.6% and oil surging past $115, massive market volatility is loading.
Here is your exact number-driven trading blueprint for the two possible outcomes:
🐻 SCENARIO A: Hawkish (Rate Hike/Higher For Longer)
The Reaction: Capital flees risk assets into the US Dollar.
🎯 Target Floors to Watch:
$BTC : Rapid drop to $78,200, with a liquidation wick potential down to $77,400.
$ETH : A breakdown past current support toward the $2,150 key safety block.
🐂 SCENARIO B: Dovish (Rate Pause/Soft Stance)
The Reaction: A massive relief rally triggers an aggressive short squeeze.
🎯 Target Profits (TP):
BTC: A clean breakout past $82,000, racing toward $84,000 – $85,500.
ETH: A sharp bounce to reclaim the crucial $2,500 psychological resistance.
⚠️ RISK WARNING: Volatility will explode the exact second the statement drops. Protect your leverage!
👇 CLICK TO MONITOR THE VOLATILITY LIVE:
Track the live candles on $BTC 📊
Monitor the floor on ETH 🐼
#FOMCForecast #BitcoinForecast #Ethereum
2
2
233

·
--
Bearish
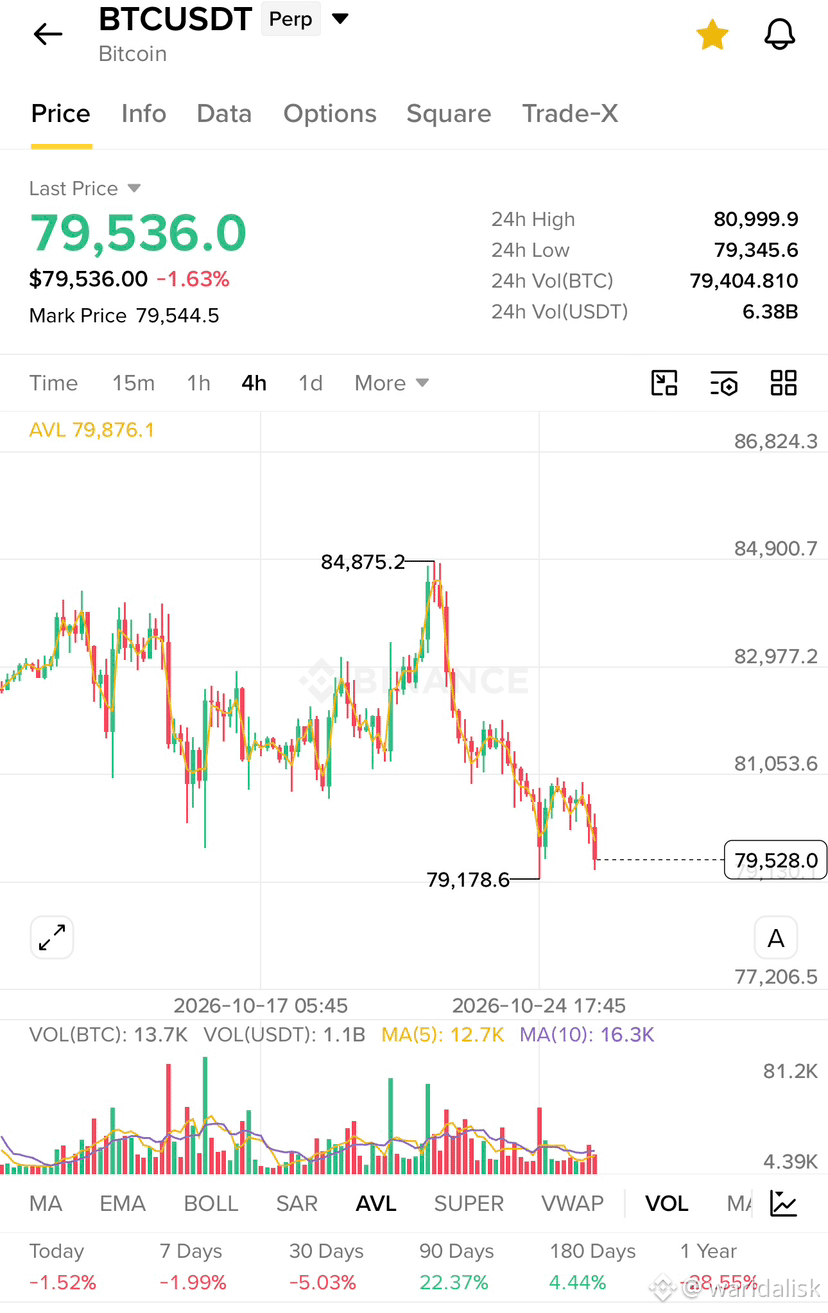
BTCUSDT 4H: Bearish trend, price is making lower highs and lower lows. Support is around $79,180–$79,350. Resistance is $80,000–$80,500.
Short entry: $79,800–$80,100 on rejection TP1: $79,350 TP2: $79,180 TP3: $78,500 SL: $80,550
Long setup: Only consider if BTC reclaims $80,500 and holds above it. Targets $81,050–$81,500, SL below $79,900.
Bias: Bearish unless resistance is reclaimed. Avoid chasing shorts at current support; wait for a pullback or a confirmed breakdown below $79,180. Use low leverage and manage risk carefully.
Tip me if you really like this post!!
Trade Bitcoin here $BTC
#BinancePick #BitcoinForecast
{future}(BTCUSDT)
BTCUSDT 4H: Bearish trend, price is making lower highs and lower lows. Support is around $79,180–$79,350. Resistance is $80,000–$80,500.
Short entry: $79,800–$80,100 on rejection TP1: $79,350 TP2: $79,180 TP3: $78,500 SL: $80,550
Long setup: Only consider if BTC reclaims $80,500 and holds above it. Targets $81,050–$81,500, SL below $79,900.
Bias: Bearish unless resistance is reclaimed. Avoid chasing shorts at current support; wait for a pullback or a confirmed breakdown below $79,180. Use low leverage and manage risk carefully.
Tip me if you really like this post!!
Trade Bitcoin here $BTC
#BinancePick #BitcoinForecast
Short entry: $79,800–$80,100 on rejection TP1: $79,350 TP2: $79,180 TP3: $78,500 SL: $80,550
Long setup: Only consider if BTC reclaims $80,500 and holds above it. Targets $81,050–$81,500, SL below $79,900.
Bias: Bearish unless resistance is reclaimed. Avoid chasing shorts at current support; wait for a pullback or a confirmed breakdown below $79,180. Use low leverage and manage risk carefully.
Tip me if you really like this post!!
Trade Bitcoin here $BTC
#BinancePick #BitcoinForecast
2
479

·
--
$BTC Market Update: Daily EMA50 in Focus
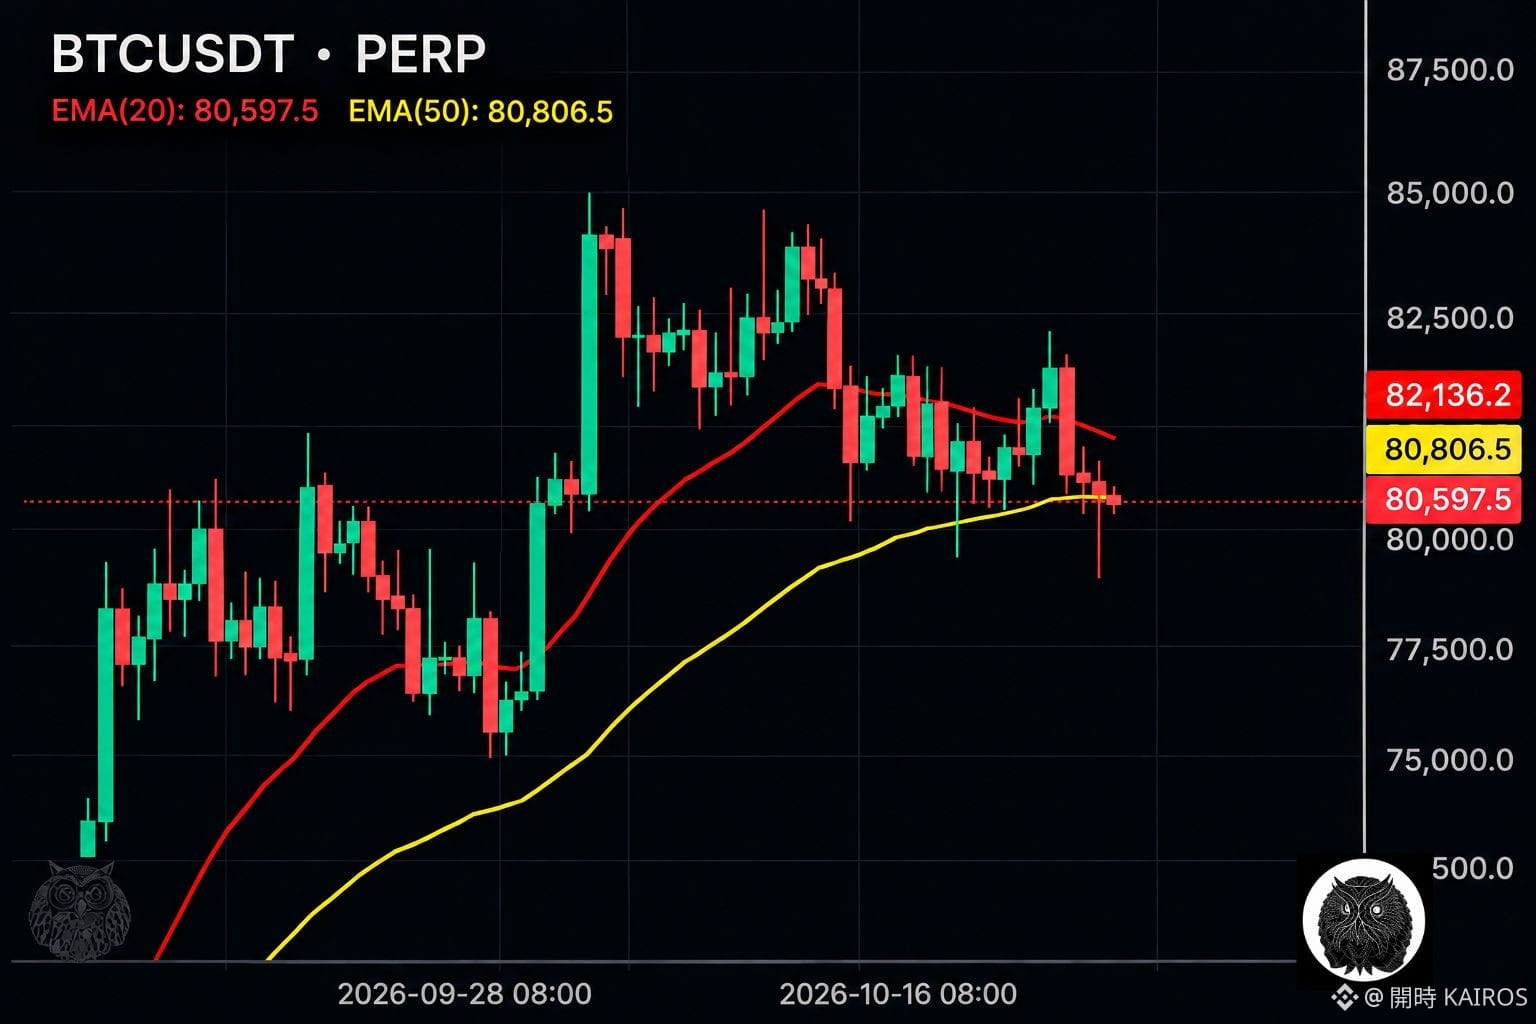
BTC is currently hovering around its Daily EMA50 support.
Last night, price briefly broke below this level, potentially sweeping liquidity from late entries. However, buyers stepped in, pushing the daily close back above the EMA50.
The key level to watch now is the Daily EMA50.
If BTC fails to hold this support and closes below it, we could see further downside toward the $76K support zone.
For now, confirmation is key. A brief bounce doesn't automatically mean the downtrend is over, and a breakdown isn't confirmed until price action supports it.
With limited capital, we need to be selective. If you're planning to buy BTC for the long term, don't rush into the market just because the price looks attractive. Wait for the trend to develop and look for confirmation before committing your capital.
You don't need to catch the exact bottom. Protecting your capital and making informed decisions matter more than entering early.
Patience first. Confirmation before commitment.
Follow to learn about my insights and progress.
#BTC #MarketImpact #BitcoinForecast
$BTC Market Update: Daily EMA50 in Focus
BTC is currently hovering around its Daily EMA50 support.
Last night, price briefly broke below this level, potentially sweeping liquidity from late entries. However, buyers stepped in, pushing the daily close back above the EMA50.
The key level to watch now is the Daily EMA50.
If BTC fails to hold this support and closes below it, we could see further downside toward the $76K support zone.
For now, confirmation is key. A brief bounce doesn't automatically mean the downtrend is over, and a breakdown isn't confirmed until price action supports it.
With limited capital, we need to be selective. If you're planning to buy BTC for the long term, don't rush into the market just because the price looks attractive. Wait for the trend to develop and look for confirmation before committing your capital.
You don't need to catch the exact bottom. Protecting your capital and making informed decisions matter more than entering early.
Patience first. Confirmation before commitment.
Follow to learn about my insights and progress.
#BTC #MarketImpact #BitcoinForecast
BTC is currently hovering around its Daily EMA50 support.
Last night, price briefly broke below this level, potentially sweeping liquidity from late entries. However, buyers stepped in, pushing the daily close back above the EMA50.
The key level to watch now is the Daily EMA50.
If BTC fails to hold this support and closes below it, we could see further downside toward the $76K support zone.
For now, confirmation is key. A brief bounce doesn't automatically mean the downtrend is over, and a breakdown isn't confirmed until price action supports it.
With limited capital, we need to be selective. If you're planning to buy BTC for the long term, don't rush into the market just because the price looks attractive. Wait for the trend to develop and look for confirmation before committing your capital.
You don't need to catch the exact bottom. Protecting your capital and making informed decisions matter more than entering early.
Patience first. Confirmation before commitment.
Follow to learn about my insights and progress.
#BTC #MarketImpact #BitcoinForecast
123
·
--
Bullish
Can Bitcoin reach $124000 this bull run? Is it possible.
I think it is very possible for BTC to reach $124000 this bull run.
Trade Bitcoin here $BTC
#BitcoinForecast #BTC🔥🔥🔥🔥🔥
{spot}(BTCUSDT)
Can Bitcoin reach $124000 this bull run? Is it possible.
I think it is very possible for BTC to reach $124000 this bull run.
Trade Bitcoin here $BTC
#BitcoinForecast #BTC🔥🔥🔥🔥🔥
I think it is very possible for BTC to reach $124000 this bull run.
Trade Bitcoin here $BTC
#BitcoinForecast #BTC🔥🔥🔥🔥🔥

1
254

·
--
BITCOIN FINAL BULL TRAP IS OVER.
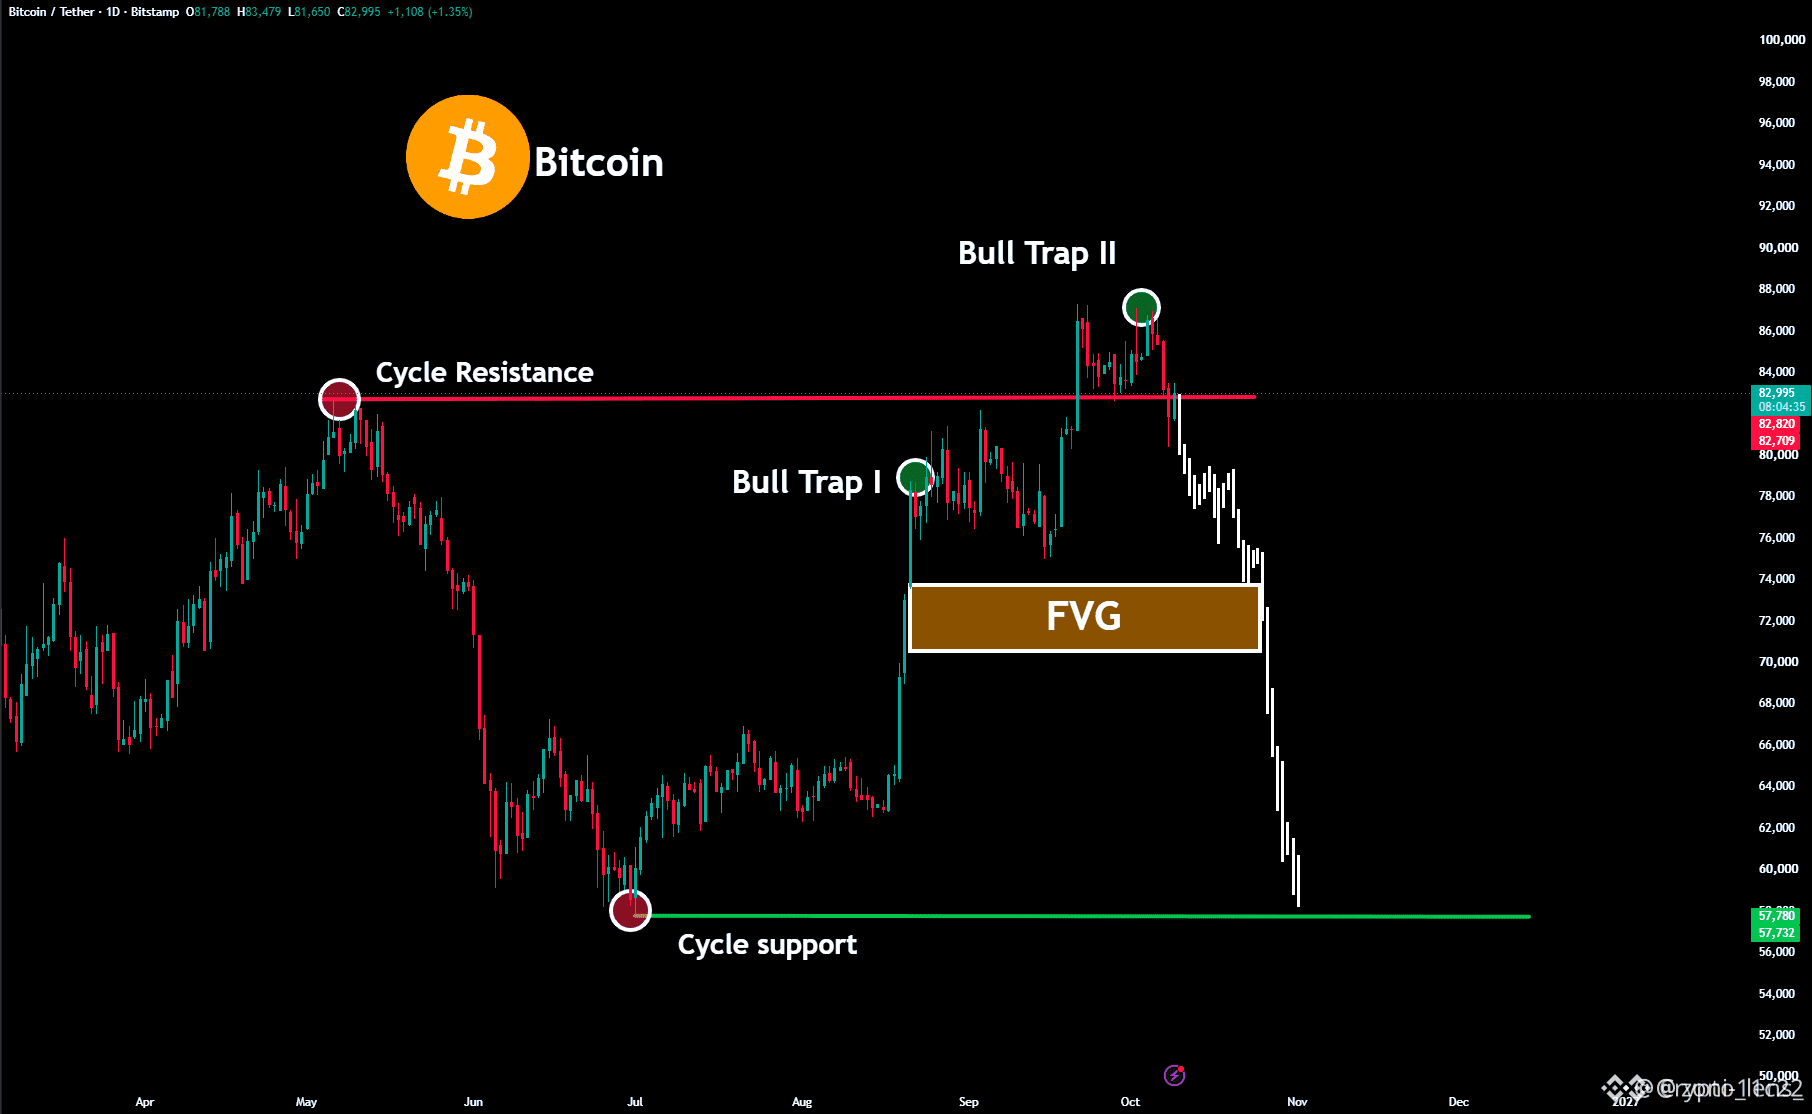
Bitcoin is currently trading near $80,780, facing a critical pivot point as bearish sentiment and geopolitical risk weigh on the market. Social media sentiment has flared with technical analysts declaring that the "final bull trap" is officially over. This follows a sharp rejection at the $85,000–$87,000 resistance ceiling, combined with recent weekend liquidations triggered by U.S. evacuations in the Middle East. [1, 2, 3, 4, 5, 6]
$AAVE
{future}(AAVEUSDT)
$AAPLB
{spot}(AAPLBUSDT)
$TRX
{future}(TRXUSDT)
#BitcoinDunyamiz
#bitcointrap
#BitcoinForecast
BITCOIN FINAL BULL TRAP IS OVER.
Bitcoin is currently trading near $80,780, facing a critical pivot point as bearish sentiment and geopolitical risk weigh on the market. Social media sentiment has flared with technical analysts declaring that the "final bull trap" is officially over. This follows a sharp rejection at the $85,000–$87,000 resistance ceiling, combined with recent weekend liquidations triggered by U.S. evacuations in the Middle East. [1, 2, 3, 4, 5, 6]
$AAVE
$AAPLB
$TRX
#BitcoinDunyamiz
#bitcointrap
#BitcoinForecast
Bitcoin is currently trading near $80,780, facing a critical pivot point as bearish sentiment and geopolitical risk weigh on the market. Social media sentiment has flared with technical analysts declaring that the "final bull trap" is officially over. This follows a sharp rejection at the $85,000–$87,000 resistance ceiling, combined with recent weekend liquidations triggered by U.S. evacuations in the Middle East. [1, 2, 3, 4, 5, 6]
$AAVE
$AAPLB
$TRX
#BitcoinDunyamiz
#bitcointrap
#BitcoinForecast

103


Article
Bitcoin Next 24 Hours: Can BTC Defend $80,000? Realistic BTC, ETH and BNB Forecast#BitcoinForecast #EstimatesNotAdviceButHope 🌍 #PositiveMindsGlobalResults | Binance Square | October 23, 2026
The next 24 hours could be decisive for Bitcoin and the wider cryptocurrency market. After failing to sustain its recent recovery toward $84,000 to $85,000, BTC has returned to a critical support area. Ethereum is struggling to regain momentum, while BNB faces resistance above its current trading zone.
These are scenario-based estimates, not guaranteed prices or financial advice.
BITCOIN BTC-USD
Reference price: approximately $81,500 based on a market report published on October 23.
24-hour estimated range: $79,800 to $84,500.
Support: $81,000, $80,000 and $79,000.
Resistance: $82,500, $84,000 and $84,800.
Bullish scenario: If BTC holds above $81,000 and reclaims $82,500 with convincing trading volume, a recovery toward $84,000 to $84,500 becomes possible.
Bearish scenario: A sustained break below $80,000 could expose Bitcoin to further selling pressure toward $79,000 to $78,000.
My assessment: Cautious to bearish until Bitcoin reclaims $84,000. The $80,000 support zone remains the most important near-term level to watch.
ETHEREUM ETH-USD
Reference price: approximately $2,390 to $2,410.
24-hour estimated range: $2,300 to $2,480.
Support: $2,350 and $2,300.
Resistance: $2,412, $2,460 and $2,510.
A recovery above $2,460 could improve short-term sentiment. However, a sustained break below $2,350 would increase the risk of a move toward $2,300.
BNB-USD
Reference price: approximately $731 to $734.
24-hour estimated range: $710 to $755.
Support: $722, $710 and $697.
Resistance: $745, $753 and $762.
BNB could recover toward $745 to $755 if buying volume improves. A decisive break below $722 would weaken the outlook and could expose the $710 to $697 area.
GLOBAL ECONOMY AND CRYPTO RISK
Rising oil prices, inflation concerns, technology-stock volatility and expectations surrounding the Federal Reserve's October 27 to 28 meeting could influence risk appetite. Recent reporting has highlighted Bitcoin's sensitivity to movements in technology shares and macroeconomic sentiment.
Even positive institutional fund flows cannot guarantee higher prices if selling pressure returns.
MY 24-HOUR CONCLUSION
BTC: Cautious, with $80,000 as the key support.
ETH: Weak until it reclaims $2,460.
BNB: Range-bound unless it breaks above $755 or below $722.
These ranges are estimates, not certainties. Weekend liquidity may amplify sudden price movements. Watch confirmed candle closes, volume and broader market conditions rather than relying on price targets alone.
Hope is valuable, but disciplined risk management matters more.
Disclaimer: This article provides an independent, scenario-based market outlook for educational purposes only. It is not financial advice. Prices may move outside these ranges, and no outcome is guaranteed. Always do your own research and manage risk responsibly.
#BitcoinForecast#BTCPricePrediction #EthereumForecast #BNBForecast #CryptoMarketOutlook #MarketSentimentToday #CryptoPriceAnalysis #PositiveMindsGlobalResults #BinanceSquare
Bitcoin Next 24 Hours: Can BTC Defend $80,000? Realistic BTC, ETH and BNB Forecast
#BitcoinForecast #EstimatesNotAdviceButHope 🌍 #PositiveMindsGlobalResults | Binance Square | October 23, 2026
The next 24 hours could be decisive for Bitcoin and the wider cryptocurrency market. After failing to sustain its recent recovery toward $84,000 to $85,000, BTC has returned to a critical support area. Ethereum is struggling to regain momentum, while BNB faces resistance above its current trading zone.
These are scenario-based estimates, not guaranteed prices or financial advice.
BITCOIN BTC-USD
Reference price: approximately $81,500 based on a market report published on October 23.
24-hour estimated range: $79,800 to $84,500.
Support: $81,000, $80,000 and $79,000.
Resistance: $82,500, $84,000 and $84,800.
Bullish scenario: If BTC holds above $81,000 and reclaims $82,500 with convincing trading volume, a recovery toward $84,000 to $84,500 becomes possible.
Bearish scenario: A sustained break below $80,000 could expose Bitcoin to further selling pressure toward $79,000 to $78,000.
My assessment: Cautious to bearish until Bitcoin reclaims $84,000. The $80,000 support zone remains the most important near-term level to watch.
ETHEREUM ETH-USD
Reference price: approximately $2,390 to $2,410.
24-hour estimated range: $2,300 to $2,480.
Support: $2,350 and $2,300.
Resistance: $2,412, $2,460 and $2,510.
A recovery above $2,460 could improve short-term sentiment. However, a sustained break below $2,350 would increase the risk of a move toward $2,300.
BNB-USD
Reference price: approximately $731 to $734.
24-hour estimated range: $710 to $755.
Support: $722, $710 and $697.
Resistance: $745, $753 and $762.
BNB could recover toward $745 to $755 if buying volume improves. A decisive break below $722 would weaken the outlook and could expose the $710 to $697 area.
GLOBAL ECONOMY AND CRYPTO RISK
Rising oil prices, inflation concerns, technology-stock volatility and expectations surrounding the Federal Reserve's October 27 to 28 meeting could influence risk appetite. Recent reporting has highlighted Bitcoin's sensitivity to movements in technology shares and macroeconomic sentiment.
Even positive institutional fund flows cannot guarantee higher prices if selling pressure returns.
MY 24-HOUR CONCLUSION
BTC: Cautious, with $80,000 as the key support.
ETH: Weak until it reclaims $2,460.
BNB: Range-bound unless it breaks above $755 or below $722.
These ranges are estimates, not certainties. Weekend liquidity may amplify sudden price movements. Watch confirmed candle closes, volume and broader market conditions rather than relying on price targets alone.
Hope is valuable, but disciplined risk management matters more.
Disclaimer: This article provides an independent, scenario-based market outlook for educational purposes only. It is not financial advice. Prices may move outside these ranges, and no outcome is guaranteed. Always do your own research and manage risk responsibly.
#BitcoinForecast#BTCPricePrediction #EthereumForecast #BNBForecast #CryptoMarketOutlook #MarketSentimentToday #CryptoPriceAnalysis #PositiveMindsGlobalResults #BinanceSquare
The next 24 hours could be decisive for Bitcoin and the wider cryptocurrency market. After failing to sustain its recent recovery toward $84,000 to $85,000, BTC has returned to a critical support area. Ethereum is struggling to regain momentum, while BNB faces resistance above its current trading zone.
These are scenario-based estimates, not guaranteed prices or financial advice.
BITCOIN BTC-USD
Reference price: approximately $81,500 based on a market report published on October 23.
24-hour estimated range: $79,800 to $84,500.
Support: $81,000, $80,000 and $79,000.
Resistance: $82,500, $84,000 and $84,800.
Bullish scenario: If BTC holds above $81,000 and reclaims $82,500 with convincing trading volume, a recovery toward $84,000 to $84,500 becomes possible.
Bearish scenario: A sustained break below $80,000 could expose Bitcoin to further selling pressure toward $79,000 to $78,000.
My assessment: Cautious to bearish until Bitcoin reclaims $84,000. The $80,000 support zone remains the most important near-term level to watch.
ETHEREUM ETH-USD
Reference price: approximately $2,390 to $2,410.
24-hour estimated range: $2,300 to $2,480.
Support: $2,350 and $2,300.
Resistance: $2,412, $2,460 and $2,510.
A recovery above $2,460 could improve short-term sentiment. However, a sustained break below $2,350 would increase the risk of a move toward $2,300.
BNB-USD
Reference price: approximately $731 to $734.
24-hour estimated range: $710 to $755.
Support: $722, $710 and $697.
Resistance: $745, $753 and $762.
BNB could recover toward $745 to $755 if buying volume improves. A decisive break below $722 would weaken the outlook and could expose the $710 to $697 area.
GLOBAL ECONOMY AND CRYPTO RISK
Rising oil prices, inflation concerns, technology-stock volatility and expectations surrounding the Federal Reserve's October 27 to 28 meeting could influence risk appetite. Recent reporting has highlighted Bitcoin's sensitivity to movements in technology shares and macroeconomic sentiment.
Even positive institutional fund flows cannot guarantee higher prices if selling pressure returns.
MY 24-HOUR CONCLUSION
BTC: Cautious, with $80,000 as the key support.
ETH: Weak until it reclaims $2,460.
BNB: Range-bound unless it breaks above $755 or below $722.
These ranges are estimates, not certainties. Weekend liquidity may amplify sudden price movements. Watch confirmed candle closes, volume and broader market conditions rather than relying on price targets alone.
Hope is valuable, but disciplined risk management matters more.
Disclaimer: This article provides an independent, scenario-based market outlook for educational purposes only. It is not financial advice. Prices may move outside these ranges, and no outcome is guaranteed. Always do your own research and manage risk responsibly.
#BitcoinForecast#BTCPricePrediction #EthereumForecast #BNBForecast #CryptoMarketOutlook #MarketSentimentToday #CryptoPriceAnalysis #PositiveMindsGlobalResults #BinanceSquare
98
·
--
#BitcoinReboundsAbove$82,000
Bitcoin (BTC) has climbed back above the $82,000 mark, trading around $82,600 in early trading on Monday, October 19, 2026. The cryptocurrency's recovery marks a resilient comeback following recent macroeconomic volatility and geopolitical tensions. [1, 2, 3]
Oil’s Retreat Lifts Risk Appetite: The primary catalyst for Monday's surge was a decline in oil prices. Brent crude fell as much as 2% on signs that Middle East supplies have held up since a U.S. conflict with Iran broke out. This retreat eased energy inflation fears, lifting broader risk assets, including S&P 500 and Nasdaq 100 futures.
$SOL
{future}(SOLUSDT)
$XRP
{future}(XRPUSDT)
$ETH
{future}(ETHUSDT)
#Bitcoinhaving
#BitcoinForecast
#BitcoinReboundsAbove$82,000
Bitcoin (BTC) has climbed back above the $82,000 mark, trading around $82,600 in early trading on Monday, October 19, 2026. The cryptocurrency's recovery marks a resilient comeback following recent macroeconomic volatility and geopolitical tensions. [1, 2, 3]
Oil’s Retreat Lifts Risk Appetite: The primary catalyst for Monday's surge was a decline in oil prices. Brent crude fell as much as 2% on signs that Middle East supplies have held up since a U.S. conflict with Iran broke out. This retreat eased energy inflation fears, lifting broader risk assets, including S&P 500 and Nasdaq 100 futures.
$SOL
$XRP
$ETH
#Bitcoinhaving
#BitcoinForecast
Bitcoin (BTC) has climbed back above the $82,000 mark, trading around $82,600 in early trading on Monday, October 19, 2026. The cryptocurrency's recovery marks a resilient comeback following recent macroeconomic volatility and geopolitical tensions. [1, 2, 3]
Oil’s Retreat Lifts Risk Appetite: The primary catalyst for Monday's surge was a decline in oil prices. Brent crude fell as much as 2% on signs that Middle East supplies have held up since a U.S. conflict with Iran broke out. This retreat eased energy inflation fears, lifting broader risk assets, including S&P 500 and Nasdaq 100 futures.
$SOL
$XRP
$ETH
#Bitcoinhaving
#BitcoinForecast


39
·
--
#BitcoinSurpasses$82K
Bitcoin has reclaimed the $82,000 price level after briefly dipping below $80,000, signaling resilient demand and rapid buyer recovery. The cryptocurrency is currently consolidating around this key psychological threshold, keeping the overall market sentiment leaning heavily bullish.
$ADA
{future}(ADAUSDT)
$ARK
{future}(ARKUSDT)
$U
{spot}(UUSDT)
#BitcoinForecast
#Bitcoinhaving
#BitcoinWarnings
#BitcoinSurpasses$82K
Bitcoin has reclaimed the $82,000 price level after briefly dipping below $80,000, signaling resilient demand and rapid buyer recovery. The cryptocurrency is currently consolidating around this key psychological threshold, keeping the overall market sentiment leaning heavily bullish.
$ADA
$ARK
$U
#BitcoinForecast
#Bitcoinhaving
#BitcoinWarnings
Bitcoin has reclaimed the $82,000 price level after briefly dipping below $80,000, signaling resilient demand and rapid buyer recovery. The cryptocurrency is currently consolidating around this key psychological threshold, keeping the overall market sentiment leaning heavily bullish.
$ADA
$ARK
$U
#BitcoinForecast
#Bitcoinhaving
#BitcoinWarnings

7

Holding $BTC 1.6K USDT
Bitcoin ($BTC ) — ~$81,724, up about 0.6% in the last 24h, holding above $80k after bouncing off Thursday's four-week low near $79,770.
The bounce followed a soft Fed signal — Chair Warsh avoided pointing to another rate hike, easing pressure on risk assets.
Fresh driver: Charles Schwab has launched direct spot Bitcoin trading for its 40m+ retail clients, a major mainstream-adoption signal.
To watch: whether BTC can keep hold of $80k. MSCI has finalised rules that could strip bitcoin-heavy firms like Strategy from its indexes, risking around $2.8bn in passive selling, and hot US inflation data keeps Fed-hike bets alive.
#BitcoinForecast
Bitcoin ($BTC ) — ~$81,724, up about 0.6% in the last 24h, holding above $80k after bouncing off Thursday's four-week low near $79,770.
The bounce followed a soft Fed signal — Chair Warsh avoided pointing to another rate hike, easing pressure on risk assets.
Fresh driver: Charles Schwab has launched direct spot Bitcoin trading for its 40m+ retail clients, a major mainstream-adoption signal.
To watch: whether BTC can keep hold of $80k. MSCI has finalised rules that could strip bitcoin-heavy firms like Strategy from its indexes, risking around $2.8bn in passive selling, and hot US inflation data keeps Fed-hike bets alive.
#BitcoinForecast
The bounce followed a soft Fed signal — Chair Warsh avoided pointing to another rate hike, easing pressure on risk assets.
Fresh driver: Charles Schwab has launched direct spot Bitcoin trading for its 40m+ retail clients, a major mainstream-adoption signal.
To watch: whether BTC can keep hold of $80k. MSCI has finalised rules that could strip bitcoin-heavy firms like Strategy from its indexes, risking around $2.8bn in passive selling, and hot US inflation data keeps Fed-hike bets alive.
#BitcoinForecast
80
·
--
#BitcoinRecoversTo$82K
Bitcoin has successfully reclaimed the $82,000 threshold, currently trading at approximately $83,100. This price movement comes after a period of intense macro volatility, where hot U.S. inflation data initially dragged the cryptocurrency down into an $80,000 demand floor. [1, 2]
The recent recovery represents a crucial structural defense, returning near the $82,225 average cost basis for U.S. spot $ETFT.ETF
{etf_us}(ETFT.ETF)
holders and keeping short-term market participants from falling underwater. [1, 2]
$BTC
{future}(BTCUSDT)
$FLOKI
{spot}(FLOKIUSDT)
#btc70k
#BitcoinWarnings
#BitcoinForecast
#BitcoinRecoversTo$82K
Bitcoin has successfully reclaimed the $82,000 threshold, currently trading at approximately $83,100. This price movement comes after a period of intense macro volatility, where hot U.S. inflation data initially dragged the cryptocurrency down into an $80,000 demand floor. [1, 2]
The recent recovery represents a crucial structural defense, returning near the $82,225 average cost basis for U.S. spot $ETFT.ETF
holders and keeping short-term market participants from falling underwater. [1, 2]
$BTC
$FLOKI
#btc70k
#BitcoinWarnings
#BitcoinForecast
Bitcoin has successfully reclaimed the $82,000 threshold, currently trading at approximately $83,100. This price movement comes after a period of intense macro volatility, where hot U.S. inflation data initially dragged the cryptocurrency down into an $80,000 demand floor. [1, 2]
The recent recovery represents a crucial structural defense, returning near the $82,225 average cost basis for U.S. spot $ETFT.ETF
holders and keeping short-term market participants from falling underwater. [1, 2]
$BTC
$FLOKI
#btc70k
#BitcoinWarnings
#BitcoinForecast

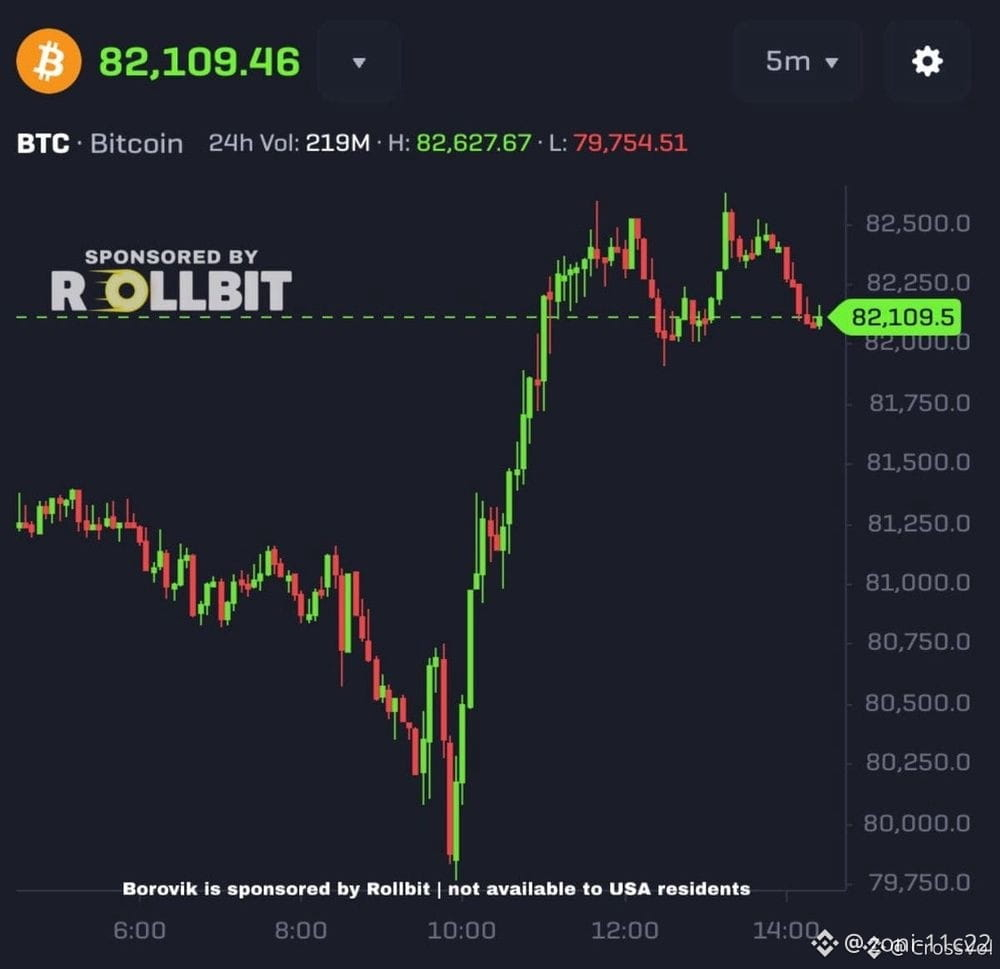
14

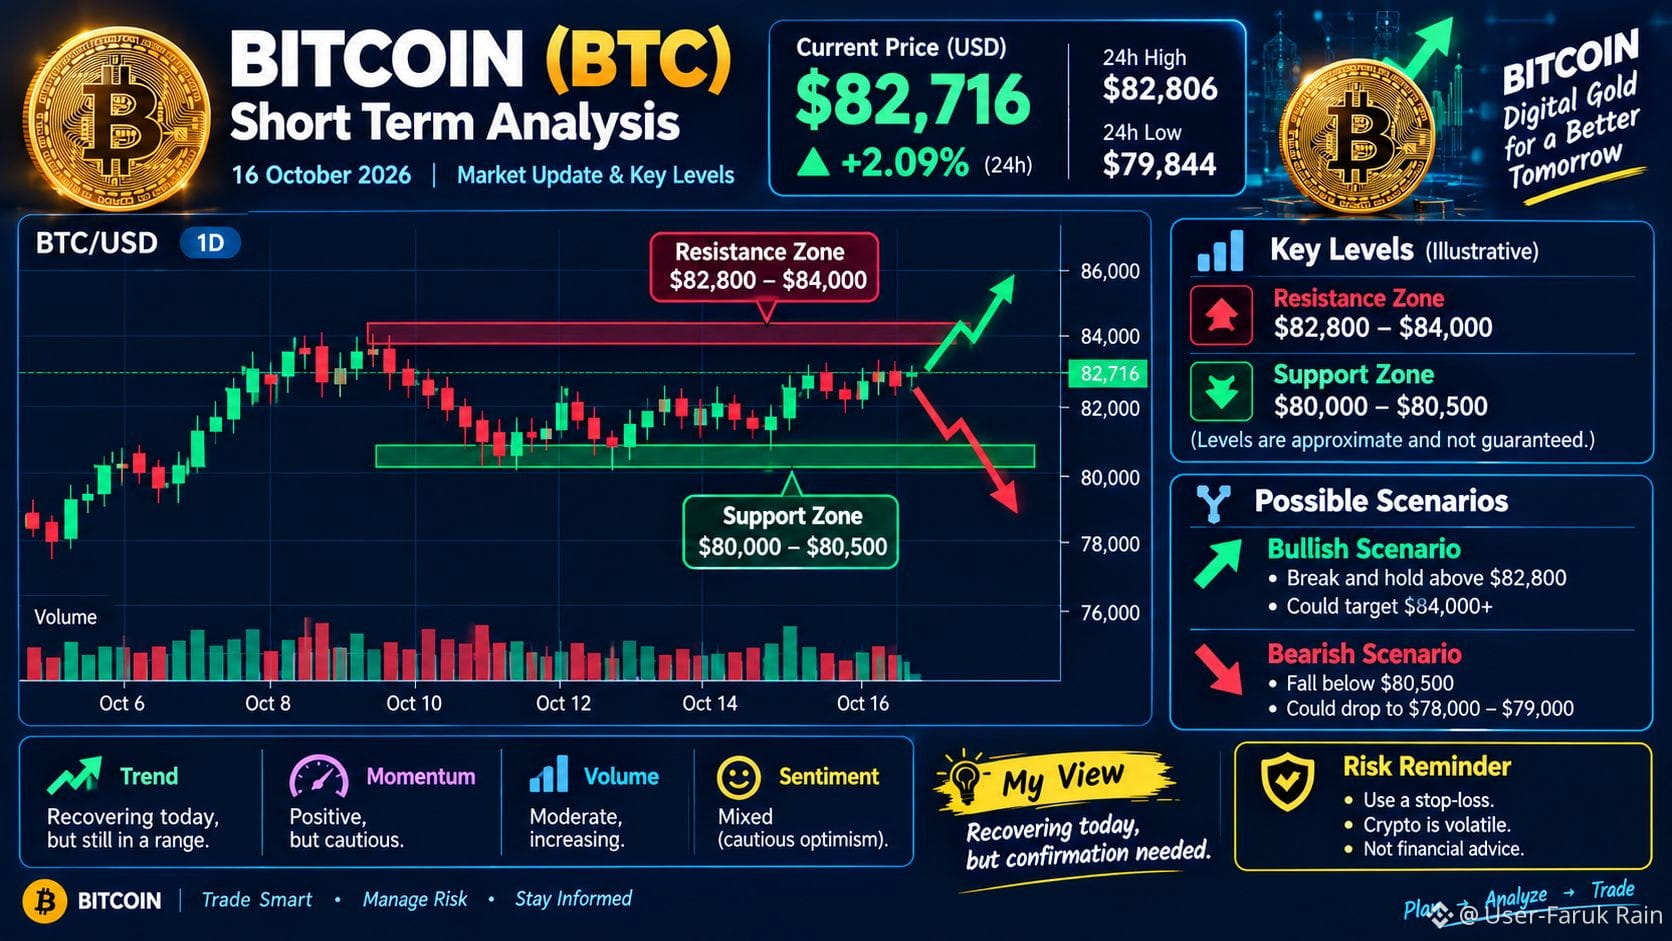
$BTC 🟢 Support: $80,000–$80,500
🔴 Resistance: $82,800–$84,000
📈 Bullish: A strong breakout above $82,800 may open the way toward $84,000 or higher.
📉 Bearish: A break below $80,000 could signal further downside.#BTC走势分析 #BitcoinShortTermHoldersReach4.08MBTC #BitcoinForecast #OctoberFedHikeOddsFallToAround17%
{spot}(BTCUSDT)
$BTC 🟢 Support: $80,000–$80,500
🔴 Resistance: $82,800–$84,000
📈 Bullish: A strong breakout above $82,800 may open the way toward $84,000 or higher.
📉 Bearish: A break below $80,000 could signal further downside.#BTC走势分析 #BitcoinShortTermHoldersReach4.08MBTC #BitcoinForecast #OctoberFedHikeOddsFallToAround17%
🔴 Resistance: $82,800–$84,000
📈 Bullish: A strong breakout above $82,800 may open the way toward $84,000 or higher.
📉 Bearish: A break below $80,000 could signal further downside.#BTC走势分析 #BitcoinShortTermHoldersReach4.08MBTC #BitcoinForecast #OctoberFedHikeOddsFallToAround17%
89

·
--
Bullish
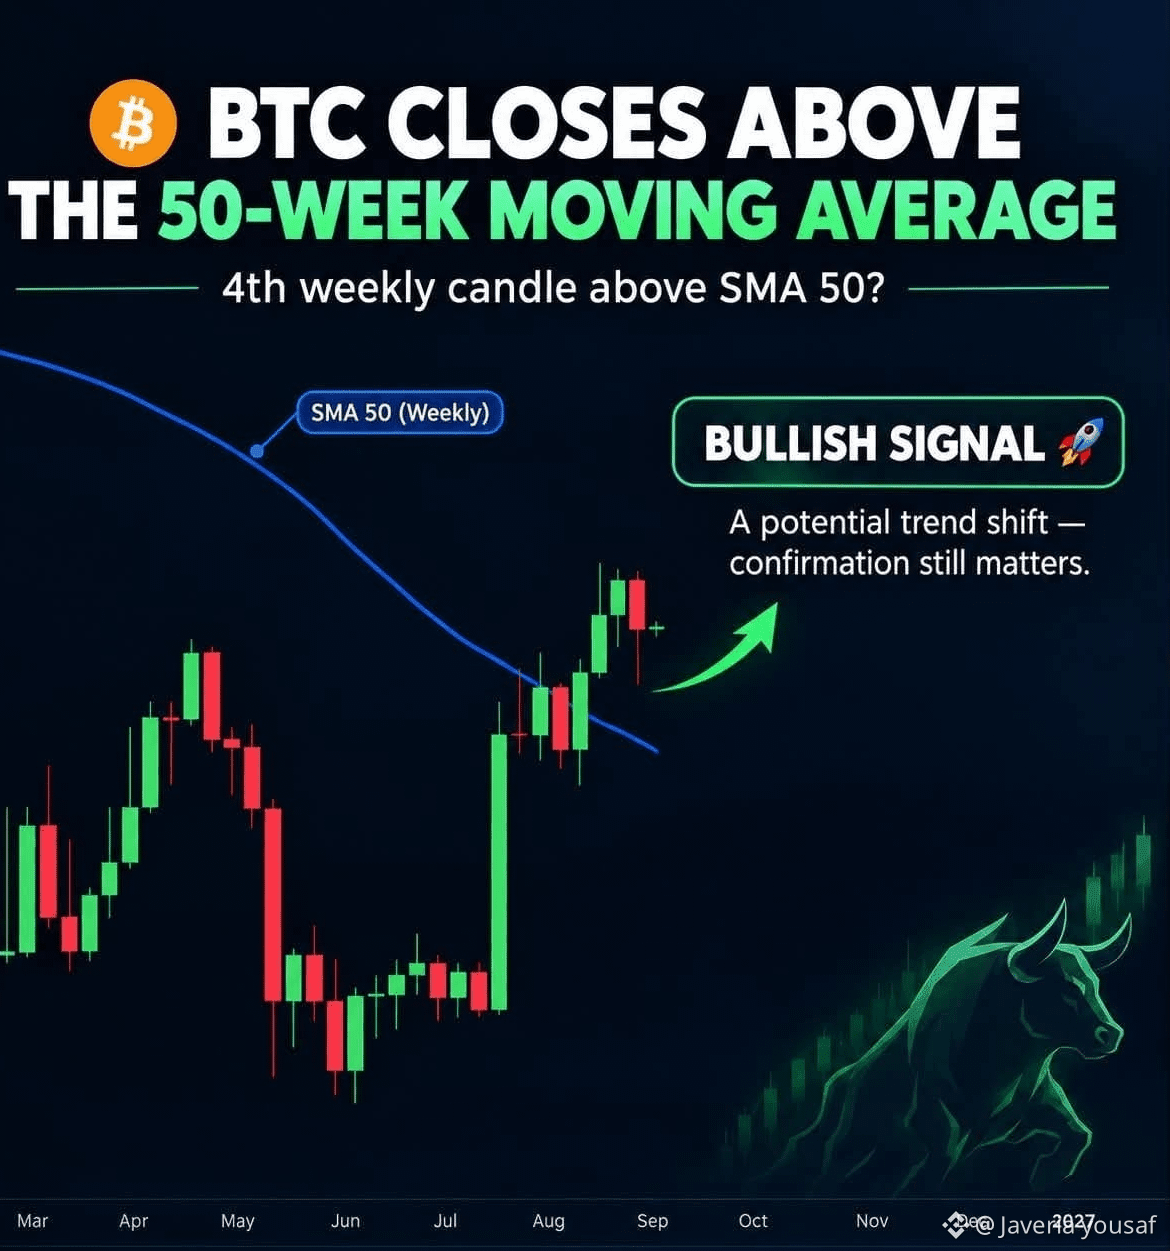
🚀 BITCOIN BULLISH SIGNAL — BREAKOUT WATCH! 📈
$BTC is trading above the 50-week moving average, a potentially bullish sign for the broader market.
🔥 A sustained breakout could strengthen the case for a major trend reversal.
👀 Is Bitcoin preparing for its next big rally? Confirmation is key — no breakout guarantees further upside.
⚠️ DYOR. Manage your risk wisely.
$BTC #BitcoinForecast #StrategyBuys250Bitcoin #Write2Earn #Binance
{spot}(BTCUSDT)
🚀 BITCOIN BULLISH SIGNAL — BREAKOUT WATCH! 📈
$BTC is trading above the 50-week moving average, a potentially bullish sign for the broader market.
🔥 A sustained breakout could strengthen the case for a major trend reversal.
👀 Is Bitcoin preparing for its next big rally? Confirmation is key — no breakout guarantees further upside.
⚠️ DYOR. Manage your risk wisely.
$BTC #BitcoinForecast #StrategyBuys250Bitcoin #Write2Earn #Binance
$BTC is trading above the 50-week moving average, a potentially bullish sign for the broader market.
🔥 A sustained breakout could strengthen the case for a major trend reversal.
👀 Is Bitcoin preparing for its next big rally? Confirmation is key — no breakout guarantees further upside.
⚠️ DYOR. Manage your risk wisely.
$BTC #BitcoinForecast #StrategyBuys250Bitcoin #Write2Earn #Binance
112

·
--
Bullish
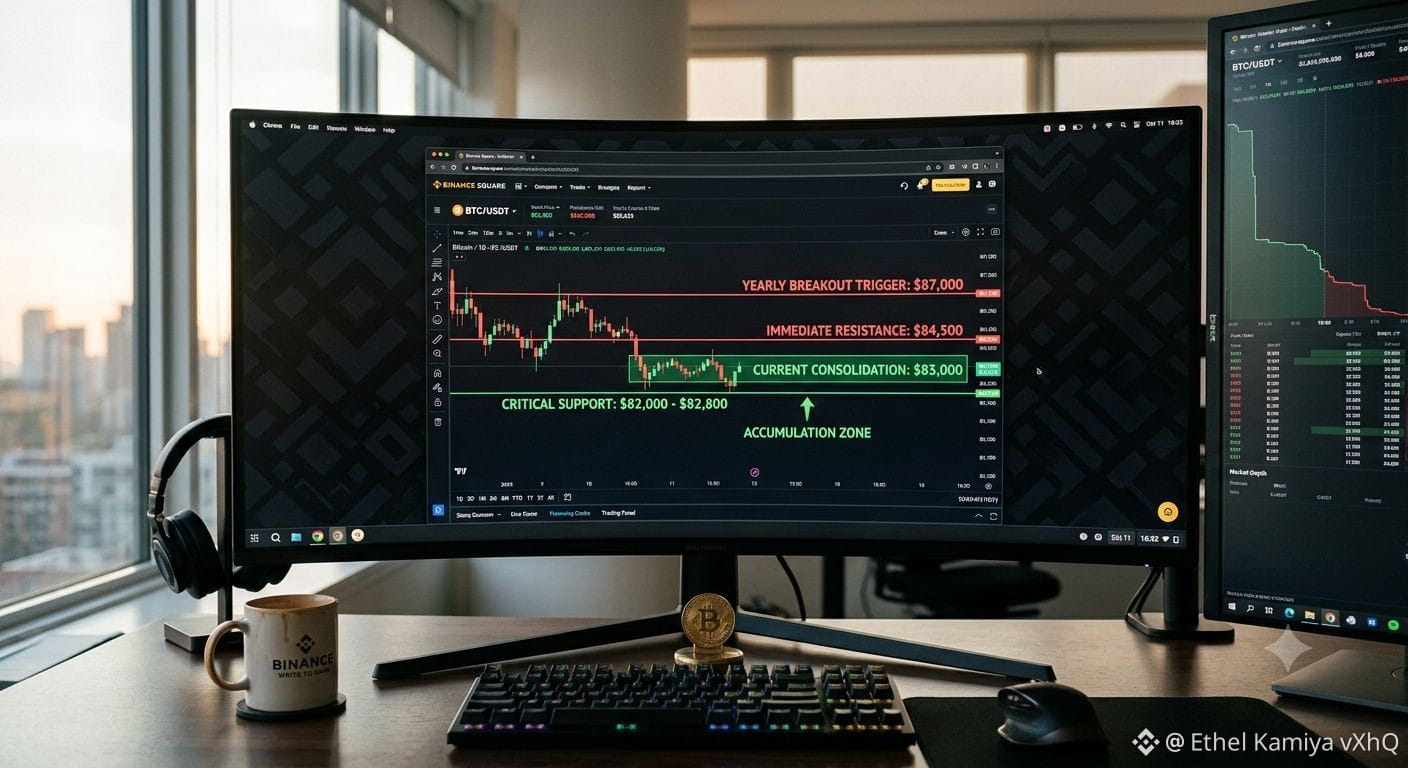
Bitcoin ($BTC ) Market Insight: $83K Consolidation Set Up for Next Move
Bitcoin ($BTC) is currently trading in a tight range around $83,000, stabilizing after a volatile week driven by macroeconomic policy updates and spot ETF movements.
Rather than signaling weakness, this sideways consolidation demonstrates that buyers are actively absorbing supply and defending key structural levels, laying the groundwork for the next leg up.
📊 Key Technical Zones
Overhead Resistance ($84,500 – $87,500): Reclaiming $84,500 is the immediate short-term hurdle. A daily candle close above $87,000 (the yearly open) provides the spark needed to target the $90,000 psychological milestone.
Immediate Support ($82,000 – $82,800): A strong intraday floor where accumulation and dip-buying activity remain high.
Macro Risk Floor ($80,300): Defending this zone keeps the broader bullish market structure fully intact.
#BitcoinOptionsVolatilityHitsFiveYearLow #BTC☀ #BitcoinForecast
{spot}(BTCUSDT)
Bitcoin ($BTC ) Market Insight: $83K Consolidation Set Up for Next Move
Bitcoin ($BTC ) is currently trading in a tight range around $83,000, stabilizing after a volatile week driven by macroeconomic policy updates and spot ETF movements.
Rather than signaling weakness, this sideways consolidation demonstrates that buyers are actively absorbing supply and defending key structural levels, laying the groundwork for the next leg up.
📊 Key Technical Zones
Overhead Resistance ($84,500 – $87,500): Reclaiming $84,500 is the immediate short-term hurdle. A daily candle close above $87,000 (the yearly open) provides the spark needed to target the $90,000 psychological milestone.
Immediate Support ($82,000 – $82,800): A strong intraday floor where accumulation and dip-buying activity remain high.
Macro Risk Floor ($80,300): Defending this zone keeps the broader bullish market structure fully intact.
#BitcoinOptionsVolatilityHitsFiveYearLow #BTC☀ #BitcoinForecast
Bitcoin ($BTC ) is currently trading in a tight range around $83,000, stabilizing after a volatile week driven by macroeconomic policy updates and spot ETF movements.
Rather than signaling weakness, this sideways consolidation demonstrates that buyers are actively absorbing supply and defending key structural levels, laying the groundwork for the next leg up.
📊 Key Technical Zones
Overhead Resistance ($84,500 – $87,500): Reclaiming $84,500 is the immediate short-term hurdle. A daily candle close above $87,000 (the yearly open) provides the spark needed to target the $90,000 psychological milestone.
Immediate Support ($82,000 – $82,800): A strong intraday floor where accumulation and dip-buying activity remain high.
Macro Risk Floor ($80,300): Defending this zone keeps the broader bullish market structure fully intact.
#BitcoinOptionsVolatilityHitsFiveYearLow #BTC☀ #BitcoinForecast
97

·
--
🚨 BITCOIN CAN’T BREAK $87K — IS A BIG MOVE COMING?
Bitcoin is facing strong resistance around $87,000, with sellers rejecting the level for the third time since September 23. BTC slipped back toward $85,600, while U.S. stocks continued pushing near record highs.
🔥 Key levels to watch:
🚧 $87K–$87.4K: Major breakout resistance
🟢 $83.3K–$84.6K: Important support zone
🚀 A sustained break above $87K could open the path toward $90K+
⚠️ Losing the $83K area could increase downside volatility
The interesting part? Stocks are near record highs while Bitcoin is struggling at resistance. That divergence could make the next BTC breakout—or breakdown—especially important.
$BTC $XAUT
#BinanceLaunchesBinanceIntelligence #BitcoinForecast #GOLD_UPDATE #BTC
{future}(BTCUSDT)
{spot}(XAUTUSDT)
🚨 BITCOIN CAN’T BREAK $87K — IS A BIG MOVE COMING?
Bitcoin is facing strong resistance around $87,000, with sellers rejecting the level for the third time since September 23. BTC slipped back toward $85,600, while U.S. stocks continued pushing near record highs.
🔥 Key levels to watch:
🚧 $87K–$87.4K: Major breakout resistance
🟢 $83.3K–$84.6K: Important support zone
🚀 A sustained break above $87K could open the path toward $90K+
⚠️ Losing the $83K area could increase downside volatility
The interesting part? Stocks are near record highs while Bitcoin is struggling at resistance. That divergence could make the next BTC breakout—or breakdown—especially important.
$BTC $XAUT
#BinanceLaunchesBinanceIntelligence #BitcoinForecast #GOLD_UPDATE #BTC
Bitcoin is facing strong resistance around $87,000, with sellers rejecting the level for the third time since September 23. BTC slipped back toward $85,600, while U.S. stocks continued pushing near record highs.
🔥 Key levels to watch:
🚧 $87K–$87.4K: Major breakout resistance
🟢 $83.3K–$84.6K: Important support zone
🚀 A sustained break above $87K could open the path toward $90K+
⚠️ Losing the $83K area could increase downside volatility
The interesting part? Stocks are near record highs while Bitcoin is struggling at resistance. That divergence could make the next BTC breakout—or breakdown—especially important.
$BTC $XAUT
#BinanceLaunchesBinanceIntelligence #BitcoinForecast #GOLD_UPDATE #BTC

8
202

·
--
⚠️ FOMC Minutes Tonight
📅 Wednesday, Oct 7, 2:00 PM ET (18:00 UTC)
The Fed will release the minutes of its September 15-16 meeting, the one where it raised rates 🔥 They will show how divided members were and how much support there is for another hike.
🧠 What I expect: a hawkish tone is more likely than not. In September, 16 of 18 members saw at least one more hike as appropriate.
⚡ The catch: that meeting took place before the weak jobs report and the cooler PCE, so the minutes may feel outdated 🕰️
📉 Why it matters for $BTC: a hawkish tone could push Treasury yields up for a short time, and yields have been the main pressure on crypto lately. A softer tone would help the price 🚀
🎯 Prediction markets give about 82% to a Fed hold on Oct 27-28, so the real surprise risk is hawkish, not dovish.
👀 Expect fast spikes around 2:00 PM ET. I will be careful with entries and keep my stops tight.
Are you trading the minutes or waiting on the sidelines? 👇
#fomc #Fed #BitcoinForecast
{future}(BTCUSDT)
How will $BTC react to the minutes?
⚠️ FOMC Minutes Tonight
📅 Wednesday, Oct 7, 2:00 PM ET (18:00 UTC)
The Fed will release the minutes of its September 15-16 meeting, the one where it raised rates 🔥 They will show how divided members were and how much support there is for another hike.
🧠 What I expect: a hawkish tone is more likely than not. In September, 16 of 18 members saw at least one more hike as appropriate.
⚡ The catch: that meeting took place before the weak jobs report and the cooler PCE, so the minutes may feel outdated 🕰️
📉 Why it matters for $BTC : a hawkish tone could push Treasury yields up for a short time, and yields have been the main pressure on crypto lately. A softer tone would help the price 🚀
🎯 Prediction markets give about 82% to a Fed hold on Oct 27-28, so the real surprise risk is hawkish, not dovish.
👀 Expect fast spikes around 2:00 PM ET. I will be careful with entries and keep my stops tight.
Are you trading the minutes or waiting on the sidelines? 👇
#fomc #Fed #BitcoinForecast
How will $BTC react to the minutes?
📅 Wednesday, Oct 7, 2:00 PM ET (18:00 UTC)
The Fed will release the minutes of its September 15-16 meeting, the one where it raised rates 🔥 They will show how divided members were and how much support there is for another hike.
🧠 What I expect: a hawkish tone is more likely than not. In September, 16 of 18 members saw at least one more hike as appropriate.
⚡ The catch: that meeting took place before the weak jobs report and the cooler PCE, so the minutes may feel outdated 🕰️
📉 Why it matters for $BTC : a hawkish tone could push Treasury yields up for a short time, and yields have been the main pressure on crypto lately. A softer tone would help the price 🚀
🎯 Prediction markets give about 82% to a Fed hold on Oct 27-28, so the real surprise risk is hawkish, not dovish.
👀 Expect fast spikes around 2:00 PM ET. I will be careful with entries and keep my stops tight.
Are you trading the minutes or waiting on the sidelines? 👇
#fomc #Fed #BitcoinForecast
How will $BTC react to the minutes?
📉 Drops
100%
📈 Rises
0%
↔️ No big move
0%
4 votes • Voting closed
218

·
--
Market rebound is picking up steam! After cooling inflation data, Bitcoin surged back past $64,000, signaling renewed strength and a massive shift in market momentum. 📈While structural changes and regulatory updates dominate the headline space this month, the bulls are actively defending crucial key support levels. Keep your eyes on immediate resistance—breaking past this zone could fast-track a steady climb to higher local targets.Are we looking at a minor relief bounce, or is the next structural macro leg up finally here? Drop your thoughts, setup ideas, and targets in the comments below! 👇
#BitcoinForecast #CryptoPatience #TradingTopics #TechnicalAnalysis
Market rebound is picking up steam! After cooling inflation data, Bitcoin surged back past $64,000, signaling renewed strength and a massive shift in market momentum. 📈While structural changes and regulatory updates dominate the headline space this month, the bulls are actively defending crucial key support levels. Keep your eyes on immediate resistance—breaking past this zone could fast-track a steady climb to higher local targets.Are we looking at a minor relief bounce, or is the next structural macro leg up finally here? Drop your thoughts, setup ideas, and targets in the comments below! 👇
#BitcoinForecast #CryptoPatience #TradingTopics #TechnicalAnalysis
#BitcoinForecast #CryptoPatience #TradingTopics #TechnicalAnalysis
101
Log in to explore more content
Join global crypto users on Binance Square
⚡️ Get latest and useful information about crypto.
💬 Trusted by the world’s largest crypto exchange.
👍 Discover real insights from verified creators.
Email / Phone number
Trending Topics
1
#JobsReportRaisesHikeOdds
291,053 views
2,251 Discussing
2
#CPITestsDecemberRateOutlook
36,592 views
456 Discussing
3
#BitcoinRebounds$75KAsChipsLead
23,701 views
236 Discussing
4
#US Data Center Rules May Constrain AI Expansion
44,523 views
162 Discussing
5
#ARKPlans14ThematicETFsCoveringAIAndTokenizedMarkets
350 views
15 Discussing
6
#WillAnthropicListOnTime
74,880 views
900 Discussing
7
#WillUS-IranTensionsBoostSafe-HavenDemand?
19,336 views
183 Discussing
8
#BitcoinETFsSee$412MNetOutflows
5,270 views
46 Discussing
9
#HKSFCPlansToRestrictCryptoAndExchangeTerms
17,333 views
304 Discussing
10
#TradFiForBeginners
45,587 views
679 Discussing