

#tvl
tvl
421,946 views
1,164 Discussing
Hot
Latest

·
--
Early Asian session hours at 05:39 AM IST always provide a clean window to look past short-term noise and audit the real structural plumbing of layer-two ecosystems. Right now, Arbitrum is quietly executing a masterclass in capital efficiency, holding strong near the 2.5 billion TVL mark while competitors fight for fragmented liquidity.
The underlying data tells a compelling story of evolution away from simple speculative trading. While traditional lending markets maintain steady utilization, the explosive growth engine is being driven entirely by liquid staking and restaking protocols like Ether.fi and Pendle. These primitives have turned the chain into a yield-optimizing machine, locking up assets that would otherwise bridge back to mainnet and keeping local liquidity remarkably sticky.
Look at the spot DEX numbers and you see Uniswap V3 and Camelot regularly rivaling top-tier chains in daily fee generation. This is institutional-grade capital flowing into LRT-backed strategies, generating real protocol revenue that fundamentally changes how we value network utility.
Of course, institutional desks are keeping a sharp eye on the tokenomics and ongoing unlock schedules. Heavy supply-side emission pressure remains the primary headwind for $ARB, forcing market participants to weigh whether protocol revenue growth can outpace the dilution curve. Whale accumulation patterns suggest smart money is betting heavily on the affirmative, viewing ARB as a core infrastructure play for the next wave of modular scaling.
Are you positioning for the long-term L2 network expansion, or waiting out the current unlock phase?
#DeFi #TVL
Early Asian session hours at 05:39 AM IST always provide a clean window to look past short-term noise and audit the real structural plumbing of layer-two ecosystems. Right now, Arbitrum is quietly executing a masterclass in capital efficiency, holding strong near the 2.5 billion TVL mark while competitors fight for fragmented liquidity.
The underlying data tells a compelling story of evolution away from simple speculative trading. While traditional lending markets maintain steady utilization, the explosive growth engine is being driven entirely by liquid staking and restaking protocols like Ether.fi and Pendle. These primitives have turned the chain into a yield-optimizing machine, locking up assets that would otherwise bridge back to mainnet and keeping local liquidity remarkably sticky.
Look at the spot DEX numbers and you see Uniswap V3 and Camelot regularly rivaling top-tier chains in daily fee generation. This is institutional-grade capital flowing into LRT-backed strategies, generating real protocol revenue that fundamentally changes how we value network utility.
Of course, institutional desks are keeping a sharp eye on the tokenomics and ongoing unlock schedules. Heavy supply-side emission pressure remains the primary headwind for $ARB , forcing market participants to weigh whether protocol revenue growth can outpace the dilution curve. Whale accumulation patterns suggest smart money is betting heavily on the affirmative, viewing ARB as a core infrastructure play for the next wave of modular scaling.
Are you positioning for the long-term L2 network expansion, or waiting out the current unlock phase?
#DeFi #TVL
The underlying data tells a compelling story of evolution away from simple speculative trading. While traditional lending markets maintain steady utilization, the explosive growth engine is being driven entirely by liquid staking and restaking protocols like Ether.fi and Pendle. These primitives have turned the chain into a yield-optimizing machine, locking up assets that would otherwise bridge back to mainnet and keeping local liquidity remarkably sticky.
Look at the spot DEX numbers and you see Uniswap V3 and Camelot regularly rivaling top-tier chains in daily fee generation. This is institutional-grade capital flowing into LRT-backed strategies, generating real protocol revenue that fundamentally changes how we value network utility.
Of course, institutional desks are keeping a sharp eye on the tokenomics and ongoing unlock schedules. Heavy supply-side emission pressure remains the primary headwind for $ARB , forcing market participants to weigh whether protocol revenue growth can outpace the dilution curve. Whale accumulation patterns suggest smart money is betting heavily on the affirmative, viewing ARB as a core infrastructure play for the next wave of modular scaling.
Are you positioning for the long-term L2 network expansion, or waiting out the current unlock phase?
#DeFi #TVL

1
85
·
--
SUI Ecosystem Velocity: Why the Billion Dollar TVL Floor is Changing the L1 Narrative
SUI is currently establishing a massive structural base that goes far beyond simple retail speculation. While the rest of the market struggles with liquidity fragmentation, the growth metrics coming out of the Sui network suggest we are seeing a genuine capital migration toward high-performance Move-based infrastructure.
The numbers tell a very specific story. Sui recently breached and sustained a 1.04 billion TVL benchmark, proving that the liquidity isn't just mercenary capital chasing a quick drop. We saw weekly DEX volume spike over 258 percent to 540 million, highlighting that active users are actually trading and providing liquidity rather than just parking assets. This level of capital efficiency is rare for a newer Layer 1.
The emergence of liquid staking through SpringSui and AlphaFi is effectively doubling the utility of $SUI. By allowing users to stack yields across lending protocols while keeping their stake liquid, the network is creating a flywheel effect. The integration of Bitcoin restaking via SatLayer is the next major catalyst, essentially importing the security and liquidity of the largest asset in crypto directly into the Sui DeFi stack.
On the supply side, roughly 4.12 billion tokens, or 41.18 percent of the 10 billion maximum supply, are currently in circulation. Even with the upcoming unlock on November 1, 2026, for the Community Reserve, the market has shown a remarkable ability to absorb these releases. On-chain data indicates that whales have been aggressively accumulating in the 0.80 to 1.00 range during the last consolidation phase, and with spot hovering around 1.201, those positions are looking increasingly solid.
This shift toward real utility and institutional-grade restaking might be the spark needed for the next leg of adoption. How are you positioning your on-chain assets to take advantage of these rising yield opportunities on SUI?
_
#DeFi #TVL
SUI Ecosystem Velocity: Why the Billion Dollar TVL Floor is Changing the L1 Narrative
SUI is currently establishing a massive structural base that goes far beyond simple retail speculation. While the rest of the market struggles with liquidity fragmentation, the growth metrics coming out of the Sui network suggest we are seeing a genuine capital migration toward high-performance Move-based infrastructure.
The numbers tell a very specific story. Sui recently breached and sustained a 1.04 billion TVL benchmark, proving that the liquidity isn't just mercenary capital chasing a quick drop. We saw weekly DEX volume spike over 258 percent to 540 million, highlighting that active users are actually trading and providing liquidity rather than just parking assets. This level of capital efficiency is rare for a newer Layer 1.
The emergence of liquid staking through SpringSui and AlphaFi is effectively doubling the utility of $SUI . By allowing users to stack yields across lending protocols while keeping their stake liquid, the network is creating a flywheel effect. The integration of Bitcoin restaking via SatLayer is the next major catalyst, essentially importing the security and liquidity of the largest asset in crypto directly into the Sui DeFi stack.
On the supply side, roughly 4.12 billion tokens, or 41.18 percent of the 10 billion maximum supply, are currently in circulation. Even with the upcoming unlock on November 1, 2026, for the Community Reserve, the market has shown a remarkable ability to absorb these releases. On-chain data indicates that whales have been aggressively accumulating in the 0.80 to 1.00 range during the last consolidation phase, and with spot hovering around 1.201, those positions are looking increasingly solid.
This shift toward real utility and institutional-grade restaking might be the spark needed for the next leg of adoption. How are you positioning your on-chain assets to take advantage of these rising yield opportunities on SUI?
_
#DeFi #TVL
SUI is currently establishing a massive structural base that goes far beyond simple retail speculation. While the rest of the market struggles with liquidity fragmentation, the growth metrics coming out of the Sui network suggest we are seeing a genuine capital migration toward high-performance Move-based infrastructure.
The numbers tell a very specific story. Sui recently breached and sustained a 1.04 billion TVL benchmark, proving that the liquidity isn't just mercenary capital chasing a quick drop. We saw weekly DEX volume spike over 258 percent to 540 million, highlighting that active users are actually trading and providing liquidity rather than just parking assets. This level of capital efficiency is rare for a newer Layer 1.
The emergence of liquid staking through SpringSui and AlphaFi is effectively doubling the utility of $SUI . By allowing users to stack yields across lending protocols while keeping their stake liquid, the network is creating a flywheel effect. The integration of Bitcoin restaking via SatLayer is the next major catalyst, essentially importing the security and liquidity of the largest asset in crypto directly into the Sui DeFi stack.
On the supply side, roughly 4.12 billion tokens, or 41.18 percent of the 10 billion maximum supply, are currently in circulation. Even with the upcoming unlock on November 1, 2026, for the Community Reserve, the market has shown a remarkable ability to absorb these releases. On-chain data indicates that whales have been aggressively accumulating in the 0.80 to 1.00 range during the last consolidation phase, and with spot hovering around 1.201, those positions are looking increasingly solid.
This shift toward real utility and institutional-grade restaking might be the spark needed for the next leg of adoption. How are you positioning your on-chain assets to take advantage of these rising yield opportunities on SUI?
_
#DeFi #TVL

1
13
·
--
While everyone is busy tracking short-term price fluctuations, a massive structural shift is quietly playing out beneath the surface of the $BNB ecosystem. The real story isn't just about candles on a chart; it is about how capital efficiency is fundamentally transforming the way on-chain participants generate yield.
Look closely at the data and you will see BNB Chain TVL holding firm near the 6 billion dollar mark. But the composition of that capital has completely changed. Instead of sitting idle in basic wallets, liquidity is rapidly migrating into liquid staking derivatives and advanced restaking protocols. Users are actively unlocking trapped assets, routing them into high-utilization lending markets, and capturing automated market maker fee generation that rewards genuine protocol utility over inflationary token emissions.
On-chain metrics confirm this evolution. DEX volume on the chain is capturing a much larger share of activity compared to legacy spot markets, proving that traders prefer keeping capital fluid within the ecosystem to compound their returns. Whales are heavily favoring these sustainable, real-yield avenues, which is tightening the circulating float faster than many realize. When combined with disciplined tokenomics and heavy spot absorption around the 808.58 reference level, the underlying supply-demand dynamics are looking structurally tighter week by week.
As BNB deepens its role as the primary collateral layer for these burgeoning yield strategies, the depth and resilience of the entire network are scaling up nicely.
What is your take on the current shift toward liquid staking yield strategies on BNB Chain?
#DeFi #TVL
While everyone is busy tracking short-term price fluctuations, a massive structural shift is quietly playing out beneath the surface of the $BNB ecosystem. The real story isn't just about candles on a chart; it is about how capital efficiency is fundamentally transforming the way on-chain participants generate yield.
Look closely at the data and you will see BNB Chain TVL holding firm near the 6 billion dollar mark. But the composition of that capital has completely changed. Instead of sitting idle in basic wallets, liquidity is rapidly migrating into liquid staking derivatives and advanced restaking protocols. Users are actively unlocking trapped assets, routing them into high-utilization lending markets, and capturing automated market maker fee generation that rewards genuine protocol utility over inflationary token emissions.
On-chain metrics confirm this evolution. DEX volume on the chain is capturing a much larger share of activity compared to legacy spot markets, proving that traders prefer keeping capital fluid within the ecosystem to compound their returns. Whales are heavily favoring these sustainable, real-yield avenues, which is tightening the circulating float faster than many realize. When combined with disciplined tokenomics and heavy spot absorption around the 808.58 reference level, the underlying supply-demand dynamics are looking structurally tighter week by week.
As BNB deepens its role as the primary collateral layer for these burgeoning yield strategies, the depth and resilience of the entire network are scaling up nicely.
What is your take on the current shift toward liquid staking yield strategies on BNB Chain?
#DeFi #TVL
Look closely at the data and you will see BNB Chain TVL holding firm near the 6 billion dollar mark. But the composition of that capital has completely changed. Instead of sitting idle in basic wallets, liquidity is rapidly migrating into liquid staking derivatives and advanced restaking protocols. Users are actively unlocking trapped assets, routing them into high-utilization lending markets, and capturing automated market maker fee generation that rewards genuine protocol utility over inflationary token emissions.
On-chain metrics confirm this evolution. DEX volume on the chain is capturing a much larger share of activity compared to legacy spot markets, proving that traders prefer keeping capital fluid within the ecosystem to compound their returns. Whales are heavily favoring these sustainable, real-yield avenues, which is tightening the circulating float faster than many realize. When combined with disciplined tokenomics and heavy spot absorption around the 808.58 reference level, the underlying supply-demand dynamics are looking structurally tighter week by week.
As BNB deepens its role as the primary collateral layer for these burgeoning yield strategies, the depth and resilience of the entire network are scaling up nicely.
What is your take on the current shift toward liquid staking yield strategies on BNB Chain?
#DeFi #TVL

1
55
·
--
On-chain liquidity is maturing beyond speculation. I'm noticing a massive surge in DeFi TVL, specifically through liquid restaking protocols which maximize capital efficiency. DEX volumes are also outpacing CEXs in key pairs, driving real protocol revenue. No clear setup on $DOGE yet, but the $BTC DeFi ecosystem is heating up.
#DeFi #TVL #DOGE
On-chain liquidity is maturing beyond speculation. I'm noticing a massive surge in DeFi TVL, specifically through liquid restaking protocols which maximize capital efficiency. DEX volumes are also outpacing CEXs in key pairs, driving real protocol revenue. No clear setup on $DOGE yet, but the $BTC DeFi ecosystem is heating up.
#DeFi #TVL #DOGE
#DeFi #TVL #DOGE
1
30
·
--
DeFi TVL & Protocol Revenue Leaderboard: Which Chains Are Capturing Real On-Chain Fee Flow: What the Real Numbers Are Showing for $LINK and BTC
Most people only look at the 15-minute price candles on LINK around 14.411, but if you step back and look at what is actually happening inside the defi tvl, restaking, liquid staking & dex volume data right now, a much clearer picture starts to emerge alongside BTC.
Why this caught my attention today:
Total Value Locked (TVL) Growth, DEX vs CEX Spot Volume Ratio, Liquid Staking/Restaking (LRT), Lending Utilization & Protocol Revenue. Rather than reacting to social media noise, I've been tracking the raw sector metrics to see where real capital and user activity are actually flowing.
Here are the four data points that stood out to me on the desk today:
• Chain & Protocol TVL Growth (7D / 30D %)
• DEX-to-CEX Volume Dominance & AMM Fee Generation
• Real Yield Protocol Revenue Distributed to Token Holders
• Liquid Staking & Restaking Capital Efficiency
When you connect these dots together, you can see that smart market participants around LINK and BTC are paying way more attention to real liquidity depth, on-chain velocity, and sustainable fundamentals than short-term hype. I'll keep tracking these numbers as the week unfolds.
Are you watching this trend on LINK right now, or is your focus on another sector of the market? Share your take in the comments 👇
#BinanceSquare #TVL
DeFi TVL & Protocol Revenue Leaderboard: Which Chains Are Capturing Real On-Chain Fee Flow: What the Real Numbers Are Showing for $LINK and BTC
Most people only look at the 15-minute price candles on LINK around 14.411, but if you step back and look at what is actually happening inside the defi tvl, restaking, liquid staking & dex volume data right now, a much clearer picture starts to emerge alongside BTC.
Why this caught my attention today:
Total Value Locked (TVL) Growth, DEX vs CEX Spot Volume Ratio, Liquid Staking/Restaking (LRT), Lending Utilization & Protocol Revenue. Rather than reacting to social media noise, I've been tracking the raw sector metrics to see where real capital and user activity are actually flowing.
Here are the four data points that stood out to me on the desk today:
• Chain & Protocol TVL Growth (7D / 30D %)
• DEX-to-CEX Volume Dominance & AMM Fee Generation
• Real Yield Protocol Revenue Distributed to Token Holders
• Liquid Staking & Restaking Capital Efficiency
When you connect these dots together, you can see that smart market participants around LINK and BTC are paying way more attention to real liquidity depth, on-chain velocity, and sustainable fundamentals than short-term hype. I'll keep tracking these numbers as the week unfolds.
Are you watching this trend on LINK right now, or is your focus on another sector of the market? Share your take in the comments 👇
#BinanceSquare #TVL
Most people only look at the 15-minute price candles on LINK around 14.411, but if you step back and look at what is actually happening inside the defi tvl, restaking, liquid staking & dex volume data right now, a much clearer picture starts to emerge alongside BTC.
Why this caught my attention today:
Total Value Locked (TVL) Growth, DEX vs CEX Spot Volume Ratio, Liquid Staking/Restaking (LRT), Lending Utilization & Protocol Revenue. Rather than reacting to social media noise, I've been tracking the raw sector metrics to see where real capital and user activity are actually flowing.
Here are the four data points that stood out to me on the desk today:
• Chain & Protocol TVL Growth (7D / 30D %)
• DEX-to-CEX Volume Dominance & AMM Fee Generation
• Real Yield Protocol Revenue Distributed to Token Holders
• Liquid Staking & Restaking Capital Efficiency
When you connect these dots together, you can see that smart market participants around LINK and BTC are paying way more attention to real liquidity depth, on-chain velocity, and sustainable fundamentals than short-term hype. I'll keep tracking these numbers as the week unfolds.
Are you watching this trend on LINK right now, or is your focus on another sector of the market? Share your take in the comments 👇
#BinanceSquare #TVL

1
122

·
--
Algorand has gone years without a security incident—some people wear that as a badge. In one sentence, ZachXBT completely threw this narrative off: what if it’s simply because there’s nothing worth stealing?
The timing of that line is spot-on. Right after the NEAR Intents vulnerability—on the order of $3.8 million—was exposed, ZachXBT quickly redirected the attention to the old argument of “low incident rate = high security.” Algorand’s own marketing highlights technical metrics like instant finality, zero downtime, and Pure Proof-of-Stake. But attackers don’t read the specs—they look at whether it’s worth the effort. When the liquidity pools are small, even if they steal, they can’t extract much value, so nobody bothers to attack.
The numbers are there. Algorand’s native TVL is roughly $38 million, while NEAR is $227 million in the same period and Sui is $552 million. Over the past 30 days it’s up 28%, but over the past year it’s still down 49%. This rebound is nowhere near “deep liquidity.” With a market cap of $1.15 billion propped up on a real funding pool of only $38 million, that gap is the risk that should actually be priced in.
That tweet was reshared by 15 high-quality accounts, reaching 115,000 views, 88 quote tweets, and 315 replies—but the market didn’t buy the “security premium.” In the same time window (13:00 to 16:00 UTC), ALGO fell 3.3% while Bitcoin rose 0.5%. Social buzz and capital flows are moving in opposite directions this time.
If it were me, I wouldn’t touch this level. The gap between market cap and the real liquidity pool is more alarming than “it’s never had an incident” ever was. I think the short-term bias is bearish. I’d revisit this chain only after TVL can keep rising for several months, with stablecoin balances, bridged capital, and lending/borrowing usage all catching up.
$ALGO #Algorand #TVL
Algorand has gone years without a security incident—some people wear that as a badge. In one sentence, ZachXBT completely threw this narrative off: what if it’s simply because there’s nothing worth stealing?
The timing of that line is spot-on. Right after the NEAR Intents vulnerability—on the order of $3.8 million—was exposed, ZachXBT quickly redirected the attention to the old argument of “low incident rate = high security.” Algorand’s own marketing highlights technical metrics like instant finality, zero downtime, and Pure Proof-of-Stake. But attackers don’t read the specs—they look at whether it’s worth the effort. When the liquidity pools are small, even if they steal, they can’t extract much value, so nobody bothers to attack.
The numbers are there. Algorand’s native TVL is roughly $38 million, while NEAR is $227 million in the same period and Sui is $552 million. Over the past 30 days it’s up 28%, but over the past year it’s still down 49%. This rebound is nowhere near “deep liquidity.” With a market cap of $1.15 billion propped up on a real funding pool of only $38 million, that gap is the risk that should actually be priced in.
That tweet was reshared by 15 high-quality accounts, reaching 115,000 views, 88 quote tweets, and 315 replies—but the market didn’t buy the “security premium.” In the same time window (13:00 to 16:00 UTC), ALGO fell 3.3% while Bitcoin rose 0.5%. Social buzz and capital flows are moving in opposite directions this time.
If it were me, I wouldn’t touch this level. The gap between market cap and the real liquidity pool is more alarming than “it’s never had an incident” ever was. I think the short-term bias is bearish. I’d revisit this chain only after TVL can keep rising for several months, with stablecoin balances, bridged capital, and lending/borrowing usage all catching up.
$ALGO #Algorand #TVL
The timing of that line is spot-on. Right after the NEAR Intents vulnerability—on the order of $3.8 million—was exposed, ZachXBT quickly redirected the attention to the old argument of “low incident rate = high security.” Algorand’s own marketing highlights technical metrics like instant finality, zero downtime, and Pure Proof-of-Stake. But attackers don’t read the specs—they look at whether it’s worth the effort. When the liquidity pools are small, even if they steal, they can’t extract much value, so nobody bothers to attack.
The numbers are there. Algorand’s native TVL is roughly $38 million, while NEAR is $227 million in the same period and Sui is $552 million. Over the past 30 days it’s up 28%, but over the past year it’s still down 49%. This rebound is nowhere near “deep liquidity.” With a market cap of $1.15 billion propped up on a real funding pool of only $38 million, that gap is the risk that should actually be priced in.
That tweet was reshared by 15 high-quality accounts, reaching 115,000 views, 88 quote tweets, and 315 replies—but the market didn’t buy the “security premium.” In the same time window (13:00 to 16:00 UTC), ALGO fell 3.3% while Bitcoin rose 0.5%. Social buzz and capital flows are moving in opposite directions this time.
If it were me, I wouldn’t touch this level. The gap between market cap and the real liquidity pool is more alarming than “it’s never had an incident” ever was. I think the short-term bias is bearish. I’d revisit this chain only after TVL can keep rising for several months, with stablecoin balances, bridged capital, and lending/borrowing usage all catching up.
$ALGO #Algorand #TVL
296
·
--
Let's be honest, the crypto market never stands still, and trying to keep up with the real flow of capital can feel like a full-time job. I spent some time looking at the real numbers today, especially how $BTC interacts with the broader DeFi landscape. Here is what actually stood out to me.
First, DeFi's Total Value Locked staged a significant comeback recently, jumping 38% to hit 95 billion dollars. Ethereum continues to dominate, holding over 56% of that capital. Interestingly, newer chains like Monad saw their value surge by 183% in the last quarter, while Robinhood Chain quickly crossed 1 billion dollars. For BTC, its native DeFi TVL has slipped to about 7 billion dollars, down 23% from its previous peak. We really need to see more native Bitcoin DeFi solutions emerge to capture this liquidity.
On the trading front, decentralized exchanges are grabbing a massive slice of the pie. DEXs now account for 27.1% of spot volume against centralized exchanges, an all-time high. Solana has been a standout, leading with 74 billion dollars in monthly DEX volume. This shows where real on-chain fee flow is concentrated.
When it comes to capital efficiency, liquid staking now commands 58.6 billion dollars, while restaking is facing major questions. Yields are narrowing to a modest 2 to 5 percentage points above base rates, forcing protocols like Ether.fi to reconsider their ties to EigenLayer due to insufficient yield. The market is clearly prioritizing real yield over token emissions.
Looking at the macro picture, BTC has seen a strong rally to around 84500.94 USD. However, recent whale flows show some trimming, with about 2.52 billion dollars in whale holdings decreasing this week. With a potential Fed rate hike looming and rising Treasury yields, can Bitcoin hold these gains while integrating deeper into DeFi?
What do you think is the next big catalyst for bringing Bitcoin natively into DeFi?
#DeFi #TVL
Let's be honest, the crypto market never stands still, and trying to keep up with the real flow of capital can feel like a full-time job. I spent some time looking at the real numbers today, especially how $BTC interacts with the broader DeFi landscape. Here is what actually stood out to me.
First, DeFi's Total Value Locked staged a significant comeback recently, jumping 38% to hit 95 billion dollars. Ethereum continues to dominate, holding over 56% of that capital. Interestingly, newer chains like Monad saw their value surge by 183% in the last quarter, while Robinhood Chain quickly crossed 1 billion dollars. For BTC, its native DeFi TVL has slipped to about 7 billion dollars, down 23% from its previous peak. We really need to see more native Bitcoin DeFi solutions emerge to capture this liquidity.
On the trading front, decentralized exchanges are grabbing a massive slice of the pie. DEXs now account for 27.1% of spot volume against centralized exchanges, an all-time high. Solana has been a standout, leading with 74 billion dollars in monthly DEX volume. This shows where real on-chain fee flow is concentrated.
When it comes to capital efficiency, liquid staking now commands 58.6 billion dollars, while restaking is facing major questions. Yields are narrowing to a modest 2 to 5 percentage points above base rates, forcing protocols like Ether.fi to reconsider their ties to EigenLayer due to insufficient yield. The market is clearly prioritizing real yield over token emissions.
Looking at the macro picture, BTC has seen a strong rally to around 84500.94 USD. However, recent whale flows show some trimming, with about 2.52 billion dollars in whale holdings decreasing this week. With a potential Fed rate hike looming and rising Treasury yields, can Bitcoin hold these gains while integrating deeper into DeFi?
What do you think is the next big catalyst for bringing Bitcoin natively into DeFi?
#DeFi #TVL
First, DeFi's Total Value Locked staged a significant comeback recently, jumping 38% to hit 95 billion dollars. Ethereum continues to dominate, holding over 56% of that capital. Interestingly, newer chains like Monad saw their value surge by 183% in the last quarter, while Robinhood Chain quickly crossed 1 billion dollars. For BTC, its native DeFi TVL has slipped to about 7 billion dollars, down 23% from its previous peak. We really need to see more native Bitcoin DeFi solutions emerge to capture this liquidity.
On the trading front, decentralized exchanges are grabbing a massive slice of the pie. DEXs now account for 27.1% of spot volume against centralized exchanges, an all-time high. Solana has been a standout, leading with 74 billion dollars in monthly DEX volume. This shows where real on-chain fee flow is concentrated.
When it comes to capital efficiency, liquid staking now commands 58.6 billion dollars, while restaking is facing major questions. Yields are narrowing to a modest 2 to 5 percentage points above base rates, forcing protocols like Ether.fi to reconsider their ties to EigenLayer due to insufficient yield. The market is clearly prioritizing real yield over token emissions.
Looking at the macro picture, BTC has seen a strong rally to around 84500.94 USD. However, recent whale flows show some trimming, with about 2.52 billion dollars in whale holdings decreasing this week. With a potential Fed rate hike looming and rising Treasury yields, can Bitcoin hold these gains while integrating deeper into DeFi?
What do you think is the next big catalyst for bringing Bitcoin natively into DeFi?
#DeFi #TVL
1
44

·
--
🎯 Prices are flat, but exchange money is moving around
📰 On-chain TVL: Binance CEX up 3.2% over 7 days, Hyperliquid bridge +6.1%; but Bitstamp has evaporated by 21.3%, and Bitget was hacked down by 2.7%
💬 Big platforms attract capital, while mid-tier platforms bleed out—no one has left the market; they’re just choosing the safer place to hide. Don’t just look at fees when picking an exchange—deposit flows are more tangible
🏷️ #链上数据 #资金流 #CEX提现 #TVL
🎯 Prices are flat, but exchange money is moving around
📰 On-chain TVL: Binance CEX up 3.2% over 7 days, Hyperliquid bridge +6.1%; but Bitstamp has evaporated by 21.3%, and Bitget was hacked down by 2.7%
💬 Big platforms attract capital, while mid-tier platforms bleed out—no one has left the market; they’re just choosing the safer place to hide. Don’t just look at fees when picking an exchange—deposit flows are more tangible
🏷️ #链上数据 #资金流 #CEX提现 #TVL
📰 On-chain TVL: Binance CEX up 3.2% over 7 days, Hyperliquid bridge +6.1%; but Bitstamp has evaporated by 21.3%, and Bitget was hacked down by 2.7%
💬 Big platforms attract capital, while mid-tier platforms bleed out—no one has left the market; they’re just choosing the safer place to hide. Don’t just look at fees when picking an exchange—deposit flows are more tangible
🏷️ #链上数据 #资金流 #CEX提现 #TVL
14
·
--
🎯 On-chain funds have collectively returned
📰 The top 30 DeFi protocols and exchanges saw TVL rise for seven straight days, totaling $462 billion; Binance CEX surged to $178.9B +7.7%, Bitget +14%, Gate +12%
💬 All 30 were red without exception—this isn’t just a round of churn trading. People were still shouting that capital was flowing out, but on-chain has already quietly moved the ammunition back, and the wind direction is about to change
🏷️ #DeFi #链上数据 #资金回流 #TVL
🎯 On-chain funds have collectively returned
📰 The top 30 DeFi protocols and exchanges saw TVL rise for seven straight days, totaling $462 billion; Binance CEX surged to $178.9B +7.7%, Bitget +14%, Gate +12%
💬 All 30 were red without exception—this isn’t just a round of churn trading. People were still shouting that capital was flowing out, but on-chain has already quietly moved the ammunition back, and the wind direction is about to change
🏷️ #DeFi #链上数据 #资金回流 #TVL
📰 The top 30 DeFi protocols and exchanges saw TVL rise for seven straight days, totaling $462 billion; Binance CEX surged to $178.9B +7.7%, Bitget +14%, Gate +12%
💬 All 30 were red without exception—this isn’t just a round of churn trading. People were still shouting that capital was flowing out, but on-chain has already quietly moved the ammunition back, and the wind direction is about to change
🏷️ #DeFi #链上数据 #资金回流 #TVL
5
·
--
🎯 On-chain funds quietly switch tracks
📰 DeFi lending quietly draws in money: SparkLend’s 7-day TVL up 9.5%, Morpho up 2.6%, ether.fi up 3.2%
💬 Cross-chain bridges are bleeding out instead: LayerZero and Hyperliquid bridge volumes each down 1.6% and 2% over 7 days. Instead of playing cross-chain, people prefer to lie back and collect interest—this preference is pretty honest
🏷️ #DeFi #TVL #链上资金 #Lending
🎯 On-chain funds quietly switch tracks
📰 DeFi lending quietly draws in money: SparkLend’s 7-day TVL up 9.5%, Morpho up 2.6%, ether.fi up 3.2%
💬 Cross-chain bridges are bleeding out instead: LayerZero and Hyperliquid bridge volumes each down 1.6% and 2% over 7 days. Instead of playing cross-chain, people prefer to lie back and collect interest—this preference is pretty honest
🏷️ #DeFi #TVL #链上资金 #Lending
📰 DeFi lending quietly draws in money: SparkLend’s 7-day TVL up 9.5%, Morpho up 2.6%, ether.fi up 3.2%
💬 Cross-chain bridges are bleeding out instead: LayerZero and Hyperliquid bridge volumes each down 1.6% and 2% over 7 days. Instead of playing cross-chain, people prefer to lie back and collect interest—this preference is pretty honest
🏷️ #DeFi #TVL #链上资金 #Lending
74

·
--
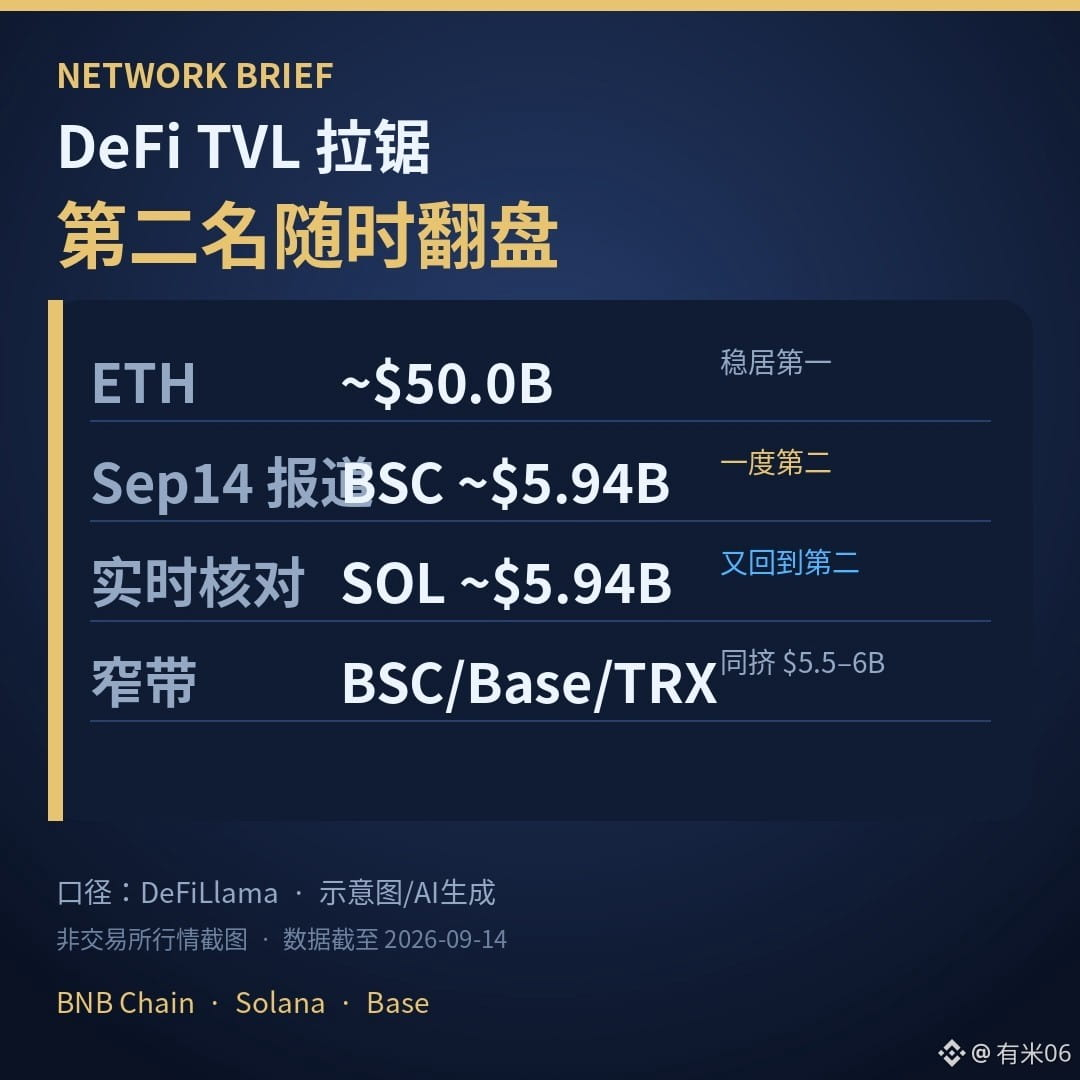
First, the conclusion: on the DeFi locked-value charts, BNB Chain and Solana are fighting for second place, with the gap often under one percentage point; every few hours, the lead can flip.
Under the DeFiLlama methodology, as of September 14, multiple reports once put BNB Chain at about $5.94 billion and Solana at about $5.89 billion, with BSC briefly moving into second place; Ethereum still remains far ahead at roughly the $50 billion range. I just checked the real-time interfaces: Solana is back to about $5.94 billion, BSC is about $5.63 billion, and Base is about $5.69 billion—BSC, Base, and Tron are all squeezed into this narrow band of $5.5–6.0 billion.
Data as of: reported on 2026-09-14; real-time verification around 19:30 UTC on 2026-09-14.
The figure is a schematic/AI-generated illustration, not a market screenshot.
#BNBChain #DeFi #TVL
First, the conclusion: on the DeFi locked-value charts, BNB Chain and Solana are fighting for second place, with the gap often under one percentage point; every few hours, the lead can flip.
Under the DeFiLlama methodology, as of September 14, multiple reports once put BNB Chain at about $5.94 billion and Solana at about $5.89 billion, with BSC briefly moving into second place; Ethereum still remains far ahead at roughly the $50 billion range. I just checked the real-time interfaces: Solana is back to about $5.94 billion, BSC is about $5.63 billion, and Base is about $5.69 billion—BSC, Base, and Tron are all squeezed into this narrow band of $5.5–6.0 billion.
Data as of: reported on 2026-09-14; real-time verification around 19:30 UTC on 2026-09-14.
The figure is a schematic/AI-generated illustration, not a market screenshot.
#BNBChain #DeFi #TVL
Under the DeFiLlama methodology, as of September 14, multiple reports once put BNB Chain at about $5.94 billion and Solana at about $5.89 billion, with BSC briefly moving into second place; Ethereum still remains far ahead at roughly the $50 billion range. I just checked the real-time interfaces: Solana is back to about $5.94 billion, BSC is about $5.63 billion, and Base is about $5.69 billion—BSC, Base, and Tron are all squeezed into this narrow band of $5.5–6.0 billion.
Data as of: reported on 2026-09-14; real-time verification around 19:30 UTC on 2026-09-14.
The figure is a schematic/AI-generated illustration, not a market screenshot.
#BNBChain #DeFi #TVL
1
207
·
--
🎯 Exchange funds are quietly being moved to staking
📰 DefiLlama: Lido rose 3.07% in a single day to $24.3B, SSV rose 2.46%, staked ETH rose 3% in tandem, while OKX and Bybit saw outflows of 1.66% and 3.48% over seven days, respectively
💬 Nobody cuts losses on spot—yet the money is being shifted from trading accounts into staking to earn yield. This “calling for a crash with your mouth while your hands are locking funds”—do you get it?
🏷️ #质押 #Lido #TVL #资金流向
🎯 Exchange funds are quietly being moved to staking
📰 DefiLlama: Lido rose 3.07% in a single day to $24.3B, SSV rose 2.46%, staked ETH rose 3% in tandem, while OKX and Bybit saw outflows of 1.66% and 3.48% over seven days, respectively
💬 Nobody cuts losses on spot—yet the money is being shifted from trading accounts into staking to earn yield. This “calling for a crash with your mouth while your hands are locking funds”—do you get it?
🏷️ #质押 #Lido #TVL #资金流向
📰 DefiLlama: Lido rose 3.07% in a single day to $24.3B, SSV rose 2.46%, staked ETH rose 3% in tandem, while OKX and Bybit saw outflows of 1.66% and 3.48% over seven days, respectively
💬 Nobody cuts losses on spot—yet the money is being shifted from trading accounts into staking to earn yield. This “calling for a crash with your mouth while your hands are locking funds”—do you get it?
🏷️ #质押 #Lido #TVL #资金流向
500

BSC and Hyperliquid are moving in opposite directions across the latest 7d snapshot, but the gap is too large to dismiss as ordinary noise. BSC TVL slipped 1.28% to $5.56B, while Hyperliquid L1 fell 11.38% to $1.38B. Across all tracked networks, TVL sits at $86.95B.
That looks like relative capital preference for BSC, especially with $BNB’s 7d move limited to -1.24%. But TVL isn’t a clean deposit meter. It can change because of token prices, collateral values, withdrawals, or bridge activity. The data shows a sharper contraction on Hyperliquid, not exactly how much liquidity left or where it went.
The useful read is the asymmetry. A network holding up while another loses nearly a ninth of its tracked TVL suggests the same week is being experienced very differently across venues. It doesn’t prove funds rotated into BSC, and it says nothing about whether the remaining liquidity is active or merely parked.
Not financial advice. Do your own research.
#DeFi #TVL #BSC #Hyperliquid
BSC and Hyperliquid are moving in opposite directions across the latest 7d snapshot, but the gap is too large to dismiss as ordinary noise. BSC TVL slipped 1.28% to $5.56B, while Hyperliquid L1 fell 11.38% to $1.38B. Across all tracked networks, TVL sits at $86.95B.
That looks like relative capital preference for BSC, especially with $BNB ’s 7d move limited to -1.24%. But TVL isn’t a clean deposit meter. It can change because of token prices, collateral values, withdrawals, or bridge activity. The data shows a sharper contraction on Hyperliquid, not exactly how much liquidity left or where it went.
The useful read is the asymmetry. A network holding up while another loses nearly a ninth of its tracked TVL suggests the same week is being experienced very differently across venues. It doesn’t prove funds rotated into BSC, and it says nothing about whether the remaining liquidity is active or merely parked.
Not financial advice. Do your own research.
#DeFi #TVL #BSC #Hyperliquid
That looks like relative capital preference for BSC, especially with $BNB ’s 7d move limited to -1.24%. But TVL isn’t a clean deposit meter. It can change because of token prices, collateral values, withdrawals, or bridge activity. The data shows a sharper contraction on Hyperliquid, not exactly how much liquidity left or where it went.
The useful read is the asymmetry. A network holding up while another loses nearly a ninth of its tracked TVL suggests the same week is being experienced very differently across venues. It doesn’t prove funds rotated into BSC, and it says nothing about whether the remaining liquidity is active or merely parked.
Not financial advice. Do your own research.
#DeFi #TVL #BSC #Hyperliquid
25
Capital is rotating toward Tron and away from Hyperliquid L1 in the latest TVL snapshot.
Tron’s TVL rose 0.89% to $5.47B, giving it 6.3% of the $87.04B tracked total. Hyperliquid L1 fell 11.52% to $1.38B. That gap is too wide to dismiss as noise, especially with the broader pool barely changing in the same window.
The naive read is “money left Hyperliquid and moved to Tron.” The data doesn’t prove that. TVL can shift through withdrawals, bridged assets, incentive deposits, or changes in token valuations. It also doesn’t tell us whether users are more active on Tron, or whether Hyperliquid’s decline is concentrated in a narrow part of its ecosystem.
Still, the direction matters. One network is holding more capital while another is giving it back, and the aggregate total isn’t showing a broad DeFi expansion to explain both moves. This looks more like allocation being repriced across venues than fresh liquidity lifting everything.
$TRX
Not financial advice. Do your own research.
#DeFi #TVL #Tron
Capital is rotating toward Tron and away from Hyperliquid L1 in the latest TVL snapshot.
Tron’s TVL rose 0.89% to $5.47B, giving it 6.3% of the $87.04B tracked total. Hyperliquid L1 fell 11.52% to $1.38B. That gap is too wide to dismiss as noise, especially with the broader pool barely changing in the same window.
The naive read is “money left Hyperliquid and moved to Tron.” The data doesn’t prove that. TVL can shift through withdrawals, bridged assets, incentive deposits, or changes in token valuations. It also doesn’t tell us whether users are more active on Tron, or whether Hyperliquid’s decline is concentrated in a narrow part of its ecosystem.
Still, the direction matters. One network is holding more capital while another is giving it back, and the aggregate total isn’t showing a broad DeFi expansion to explain both moves. This looks more like allocation being repriced across venues than fresh liquidity lifting everything.
$TRX
Not financial advice. Do your own research.
#DeFi #TVL #Tron
Tron’s TVL rose 0.89% to $5.47B, giving it 6.3% of the $87.04B tracked total. Hyperliquid L1 fell 11.52% to $1.38B. That gap is too wide to dismiss as noise, especially with the broader pool barely changing in the same window.
The naive read is “money left Hyperliquid and moved to Tron.” The data doesn’t prove that. TVL can shift through withdrawals, bridged assets, incentive deposits, or changes in token valuations. It also doesn’t tell us whether users are more active on Tron, or whether Hyperliquid’s decline is concentrated in a narrow part of its ecosystem.
Still, the direction matters. One network is holding more capital while another is giving it back, and the aggregate total isn’t showing a broad DeFi expansion to explain both moves. This looks more like allocation being repriced across venues than fresh liquidity lifting everything.
$TRX
Not financial advice. Do your own research.
#DeFi #TVL #Tron
56
·
--
🎯 Bybit gives back everything it pulled in within a day
📰 DeFiLlama: Bybit platform TVL plummeted 11.8% in a single day to $14 billion. All of the 9% net inflow from the beginning of the month was fully withdrawn in just one day. Binance only fell 2%
💬 Last week people praised it for snatching money from its peers. This week it’s getting slapped in the face. Subsidy-period “hot money” arrives quickly and leaves even faster. Before the data was released, the big players撤 retreat. Only when the tide goes out do you learn who was swimming naked
🏷️ #Bybit #TVL #资金流出 #on-chain data
🎯 Bybit gives back everything it pulled in within a day
📰 DeFiLlama: Bybit platform TVL plummeted 11.8% in a single day to $14 billion. All of the 9% net inflow from the beginning of the month was fully withdrawn in just one day. Binance only fell 2%
💬 Last week people praised it for snatching money from its peers. This week it’s getting slapped in the face. Subsidy-period “hot money” arrives quickly and leaves even faster. Before the data was released, the big players撤 retreat. Only when the tide goes out do you learn who was swimming naked
🏷️ #Bybit #TVL #资金流出 #on-chain data
📰 DeFiLlama: Bybit platform TVL plummeted 11.8% in a single day to $14 billion. All of the 9% net inflow from the beginning of the month was fully withdrawn in just one day. Binance only fell 2%
💬 Last week people praised it for snatching money from its peers. This week it’s getting slapped in the face. Subsidy-period “hot money” arrives quickly and leaves even faster. Before the data was released, the big players撤 retreat. Only when the tide goes out do you learn who was swimming naked
🏷️ #Bybit #TVL #资金流出 #on-chain data
33

·
--
Article
🚨⚠️ DEFILLAMA⚠️ 🚨INTENTIONALLY OUTDATED?🚨⚠️$BTC $EUL $ETH #DEFİ #RWA板块涨势强劲 #VanEck提交首个SolanaETF #altcoins #TVL
UPDATED INSIDER ALERT - EULER TVL DELAYED ON DEFILLAMA | IS IT INTENTIONAL?
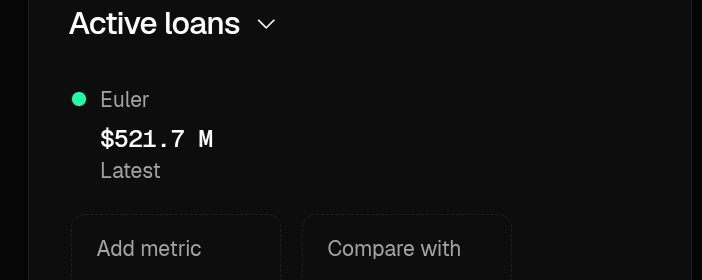
🚨 COMMUNITY ALERT: DefiLlama is 15 days behind and 104% BELOW the actual TVL of Euler
I had to audit vault by vault with AI because the public dashboards don't reflect the reality. Here's the cold hard data:
1. THE DIVERGENCE: DEFILLAMA VS REAL
Source TVL Euler Date Status
**DefiLlama** $256M | 02/06/2026 | ❌ 15 days outdated
**app.euler.finance** $527.91M 04/06/2026 ✅ Real-time
🚨⚠️ DEFILLAMA⚠️ 🚨INTENTIONALLY OUTDATED?🚨⚠️
$BTC $EUL $ETH #DEFİ #RWA板块涨势强劲 #VanEck提交首个SolanaETF #altcoins #TVL
UPDATED INSIDER ALERT - EULER TVL DELAYED ON DEFILLAMA | IS IT INTENTIONAL?
🚨 COMMUNITY ALERT: DefiLlama is 15 days behind and 104% BELOW the actual TVL of Euler
I had to audit vault by vault with AI because the public dashboards don't reflect the reality. Here's the cold hard data:
1. THE DIVERGENCE: DEFILLAMA VS REAL
Source TVL Euler Date Status
**DefiLlama** $256M | 02/06/2026 | ❌ 15 days outdated
**app.euler.finance** $527.91M 04/06/2026 ✅ Real-time
UPDATED INSIDER ALERT - EULER TVL DELAYED ON DEFILLAMA | IS IT INTENTIONAL?
🚨 COMMUNITY ALERT: DefiLlama is 15 days behind and 104% BELOW the actual TVL of Euler
I had to audit vault by vault with AI because the public dashboards don't reflect the reality. Here's the cold hard data:
1. THE DIVERGENCE: DEFILLAMA VS REAL
Source TVL Euler Date Status
**DefiLlama** $256M | 02/06/2026 | ❌ 15 days outdated
**app.euler.finance** $527.91M 04/06/2026 ✅ Real-time
1
308

$MAV Recent on-chain data doesn’t look very good: the current price is $0.00921, 24h trading volume is only $918,000, market cap has shrunk to $9.06 million, and liquidity is clearly thinning.
What really worries me isn’t the price, but the continuous decline in TVL—funds on the protocol side are leaving, and market-making depth is retreating with the tide. This combination often means a break in buyer confidence, and any rebound is unlikely to have staying power.
For friends who are still holding positions, my view is:
- Don’t comfort yourself with “it has dropped enough”—a low market cap + low volume can be a volatility amplifier
- If you want to bottom-fish, wait for the TVL curve to stop falling and stabilize, then check whether on-chain active addresses return
- At this stage, it’s more suitable to observe rather than add to your position
Old DeFi protocols aren’t necessarily unable to make a comeback, but they need a new narrative or new products to attract capital—in which both are currently missing for MAV.
#MAV #DeFi #TVL
$MAV Recent on-chain data doesn’t look very good: the current price is $0.00921, 24h trading volume is only $918,000, market cap has shrunk to $9.06 million, and liquidity is clearly thinning.
What really worries me isn’t the price, but the continuous decline in TVL—funds on the protocol side are leaving, and market-making depth is retreating with the tide. This combination often means a break in buyer confidence, and any rebound is unlikely to have staying power.
For friends who are still holding positions, my view is:
- Don’t comfort yourself with “it has dropped enough”—a low market cap + low volume can be a volatility amplifier
- If you want to bottom-fish, wait for the TVL curve to stop falling and stabilize, then check whether on-chain active addresses return
- At this stage, it’s more suitable to observe rather than add to your position
Old DeFi protocols aren’t necessarily unable to make a comeback, but they need a new narrative or new products to attract capital—in which both are currently missing for MAV.
#MAV #DeFi #TVL
What really worries me isn’t the price, but the continuous decline in TVL—funds on the protocol side are leaving, and market-making depth is retreating with the tide. This combination often means a break in buyer confidence, and any rebound is unlikely to have staying power.
For friends who are still holding positions, my view is:
- Don’t comfort yourself with “it has dropped enough”—a low market cap + low volume can be a volatility amplifier
- If you want to bottom-fish, wait for the TVL curve to stop falling and stabilize, then check whether on-chain active addresses return
- At this stage, it’s more suitable to observe rather than add to your position
Old DeFi protocols aren’t necessarily unable to make a comeback, but they need a new narrative or new products to attract capital—in which both are currently missing for MAV.
#MAV #DeFi #TVL
17

·
--
DeFi TVL plunges 39% in 2026 as market corrections and exploits reshape the sector. From $115 billion in January to approximately $70 billion today, the numbers paint a stark picture. Yet CryptoRank data reveals why this downturn is fundamentally different from the 2021-2022 bear market.
121 hacks have caused $942M in losses year-to-date, with Q2 2026 becoming the most-hacked quarter on record — 83 exploits targeting DeFi protocols. The $293M Kelp DAO exploit on April 18 compressed years of risk into a single event, accelerating deleveraging across the ecosystem.
But the data tells a more nuanced story. Capital is not vanishing — it is concentrating in battle-tested protocols. Total losses stayed well below 2022 peaks despite record hack counts, signaling a maturing ecosystem rather than a dying one.
Is this DeFi's reset moment, or the beginning of a deeper correction? Drop your take below.
$ETH $SOL $BTC
#DeFi #TVL #CryptoSecurity #Crypto
DeFi TVL plunges 39% in 2026 as market corrections and exploits reshape the sector. From $115 billion in January to approximately $70 billion today, the numbers paint a stark picture. Yet CryptoRank data reveals why this downturn is fundamentally different from the 2021-2022 bear market.
121 hacks have caused $942M in losses year-to-date, with Q2 2026 becoming the most-hacked quarter on record — 83 exploits targeting DeFi protocols. The $293M Kelp DAO exploit on April 18 compressed years of risk into a single event, accelerating deleveraging across the ecosystem.
But the data tells a more nuanced story. Capital is not vanishing — it is concentrating in battle-tested protocols. Total losses stayed well below 2022 peaks despite record hack counts, signaling a maturing ecosystem rather than a dying one.
Is this DeFi's reset moment, or the beginning of a deeper correction? Drop your take below.
$ETH $SOL $BTC
#DeFi #TVL #CryptoSecurity #Crypto
121 hacks have caused $942M in losses year-to-date, with Q2 2026 becoming the most-hacked quarter on record — 83 exploits targeting DeFi protocols. The $293M Kelp DAO exploit on April 18 compressed years of risk into a single event, accelerating deleveraging across the ecosystem.
But the data tells a more nuanced story. Capital is not vanishing — it is concentrating in battle-tested protocols. Total losses stayed well below 2022 peaks despite record hack counts, signaling a maturing ecosystem rather than a dying one.
Is this DeFi's reset moment, or the beginning of a deeper correction? Drop your take below.
$ETH $SOL $BTC
#DeFi #TVL #CryptoSecurity #Crypto
1
53

·
--
🚀 MONAD SURPASSES SUI IN TVL! 📈
Capital is flowing fast into the Monad ecosystem as its Total Value Locked (TVL) climbs to $447.9M, surpassing Sui and signaling growing investor confidence.
🔥 Key Highlights:
✅ TVL reaches a new all-time high
✅ RWA (Real World Assets) narrative continues to strengthen
✅ Increasing ecosystem adoption and liquidity
✅ Rising institutional and retail interest
📊 Market Insight:
A sustained rise in TVL often reflects stronger network activity and growing confidence. If this trend continues, Monad could see additional liquidity inflows and stronger bullish momentum.
💡 Trading View:
Consider accumulating on healthy pullbacks while momentum remains intact. Keep a close eye on ecosystem developments and potential breakout levels before making trading decisions.
⚠️ This is not financial advice. Always do your own research and manage risk.
👇 CLICK ON THE YELLOW COIN TAG BELOW FOR MORE TRADE OPPORTUNITIES!#Monad #MON #Sui #TVL
$SUI $MON $BTC
{future}(BTCUSDT)
{future}(SUIUSDT)
{future}(MONUSDT)
🚀 MONAD SURPASSES SUI IN TVL! 📈
Capital is flowing fast into the Monad ecosystem as its Total Value Locked (TVL) climbs to $447.9M, surpassing Sui and signaling growing investor confidence.
🔥 Key Highlights:
✅ TVL reaches a new all-time high
✅ RWA (Real World Assets) narrative continues to strengthen
✅ Increasing ecosystem adoption and liquidity
✅ Rising institutional and retail interest
📊 Market Insight:
A sustained rise in TVL often reflects stronger network activity and growing confidence. If this trend continues, Monad could see additional liquidity inflows and stronger bullish momentum.
💡 Trading View:
Consider accumulating on healthy pullbacks while momentum remains intact. Keep a close eye on ecosystem developments and potential breakout levels before making trading decisions.
⚠️ This is not financial advice. Always do your own research and manage risk.
👇 CLICK ON THE YELLOW COIN TAG BELOW FOR MORE TRADE OPPORTUNITIES!#Monad #MON #Sui #TVL
$SUI $MON $BTC
Capital is flowing fast into the Monad ecosystem as its Total Value Locked (TVL) climbs to $447.9M, surpassing Sui and signaling growing investor confidence.
🔥 Key Highlights:
✅ TVL reaches a new all-time high
✅ RWA (Real World Assets) narrative continues to strengthen
✅ Increasing ecosystem adoption and liquidity
✅ Rising institutional and retail interest
📊 Market Insight:
A sustained rise in TVL often reflects stronger network activity and growing confidence. If this trend continues, Monad could see additional liquidity inflows and stronger bullish momentum.
💡 Trading View:
Consider accumulating on healthy pullbacks while momentum remains intact. Keep a close eye on ecosystem developments and potential breakout levels before making trading decisions.
⚠️ This is not financial advice. Always do your own research and manage risk.
👇 CLICK ON THE YELLOW COIN TAG BELOW FOR MORE TRADE OPPORTUNITIES!#Monad #MON #Sui #TVL
$SUI $MON $BTC

13

·
--
The on-chain data for Pendle recently looks quite interesting and is worth highlighting on its own.
TVL has broken the $100 million threshold, which suggests real capital is still moving into the fixed-income track rather than being purely emotion-driven. More importantly, incentive emissions have been cut by 71%, which has significantly eased the sell-pressure side. This kind of combination—“fewer tokens issued + more deposits locked”—is often the underlying structure that allows a market to move.
On the other hand, new markets like sUSDD are being continuously onboarded, extending Pendle’s yield-splitting logic toward stablecoin interest-bearing dynamics. Boros’ cumulative trading volume has also surpassed $20 billion, meaning the second curve—derivatives—is basically up and running.
At the current price of $1.53, with a market cap of a little over $260 million and 24h trading volume of $42.66 million, the valuation isn’t particularly expensive relative to TVL and the product matrix. In the short term, we should keep an eye on whether the net inflows after the incentive adjustment can continue, as well as how quickly the depth of the sUSDD pools expands. Once these two signals move upward in sync, the pricing room for $PENDLE will be reopened.
#Pendle #DeFi收益 #TVL
The on-chain data for Pendle recently looks quite interesting and is worth highlighting on its own.
TVL has broken the $100 million threshold, which suggests real capital is still moving into the fixed-income track rather than being purely emotion-driven. More importantly, incentive emissions have been cut by 71%, which has significantly eased the sell-pressure side. This kind of combination—“fewer tokens issued + more deposits locked”—is often the underlying structure that allows a market to move.
On the other hand, new markets like sUSDD are being continuously onboarded, extending Pendle’s yield-splitting logic toward stablecoin interest-bearing dynamics. Boros’ cumulative trading volume has also surpassed $20 billion, meaning the second curve—derivatives—is basically up and running.
At the current price of $1.53, with a market cap of a little over $260 million and 24h trading volume of $42.66 million, the valuation isn’t particularly expensive relative to TVL and the product matrix. In the short term, we should keep an eye on whether the net inflows after the incentive adjustment can continue, as well as how quickly the depth of the sUSDD pools expands. Once these two signals move upward in sync, the pricing room for $PENDLE will be reopened.
#Pendle #DeFi收益 #TVL
TVL has broken the $100 million threshold, which suggests real capital is still moving into the fixed-income track rather than being purely emotion-driven. More importantly, incentive emissions have been cut by 71%, which has significantly eased the sell-pressure side. This kind of combination—“fewer tokens issued + more deposits locked”—is often the underlying structure that allows a market to move.
On the other hand, new markets like sUSDD are being continuously onboarded, extending Pendle’s yield-splitting logic toward stablecoin interest-bearing dynamics. Boros’ cumulative trading volume has also surpassed $20 billion, meaning the second curve—derivatives—is basically up and running.
At the current price of $1.53, with a market cap of a little over $260 million and 24h trading volume of $42.66 million, the valuation isn’t particularly expensive relative to TVL and the product matrix. In the short term, we should keep an eye on whether the net inflows after the incentive adjustment can continue, as well as how quickly the depth of the sUSDD pools expands. Once these two signals move upward in sync, the pricing room for $PENDLE will be reopened.
#Pendle #DeFi收益 #TVL
50
Log in to explore more content
Join global crypto users on Binance Square
⚡️ Get latest and useful information about crypto.
💬 Trusted by the world’s largest crypto exchange.
👍 Discover real insights from verified creators.
Email / Phone number
Trending Topics
1
#BinanceLaunchesBinanceIntelligence
698,587 views
4,383 Discussing
2
#BTCFallsBelow$84K
22,447 views
85 Discussing
3
#DubaiVARAIssuesReserveAssetAuditCircular
3,412 views
264 Discussing
4
#SECApproves3XBitcoinETF
3,200 views
236 Discussing
5
#WinklevossFilesSpotZcashETFApplication
12,647 views
370 Discussing
6
#SouthKoreaAITradeLiftsWorldcoinTo$7.41B
1,399 views
30 Discussing
7
#StrategyEstimates$4.1BIncomeTaxBenefit
1,222 views
18 Discussing
8
#IglooShutsDownAbstractBlockchain
5,034 views
180 Discussing
9
#StrategyMarketCapSurpassesRumble
43,085 views
879 Discussing
10
#StriveBuys2000BTCFor$169M
18,256 views
159 Discussing