

#12
12
32,452 views
460 Discussing
Hot
Latest

·
--
$ORDER Things are getting lively here. The 15m price is up 1.74%, while volume has surged to 11 times its usual level. OI is climbing in tandem—up 2.61% over 15m and 1.25% over 1h. The nominal change ranks #12 across the entire pool, at an anomaly percentile of 97.6%.
Price up + OI up: a classic sign of leveraged longs opening positions, not a move driven by shorts closing. The taker buy/sell ratio is 1.22, with the difference nearing 10%—buyers are definitely absorbing the offers.
It’s nearing historically extreme territory, and the move has persisted for several consecutive periods, with volume keeping pace. This setup could either accelerate or pull back. Don’t chase; keep a close eye on whether OI suddenly reverses.
$ORDER Things are getting lively here. The 15m price is up 1.74%, while volume has surged to 11 times its usual level. OI is climbing in tandem—up 2.61% over 15m and 1.25% over 1h. The nominal change ranks #12 across the entire pool, at an anomaly percentile of 97.6%.
Price up + OI up: a classic sign of leveraged longs opening positions, not a move driven by shorts closing. The taker buy/sell ratio is 1.22, with the difference nearing 10%—buyers are definitely absorbing the offers.
It’s nearing historically extreme territory, and the move has persisted for several consecutive periods, with volume keeping pace. This setup could either accelerate or pull back. Don’t chase; keep a close eye on whether OI suddenly reverses.
Price up + OI up: a classic sign of leveraged longs opening positions, not a move driven by shorts closing. The taker buy/sell ratio is 1.22, with the difference nearing 10%—buyers are definitely absorbing the offers.
It’s nearing historically extreme territory, and the move has persisted for several consecutive periods, with volume keeping pace. This setup could either accelerate or pull back. Don’t chase; keep a close eye on whether OI suddenly reverses.

·
--
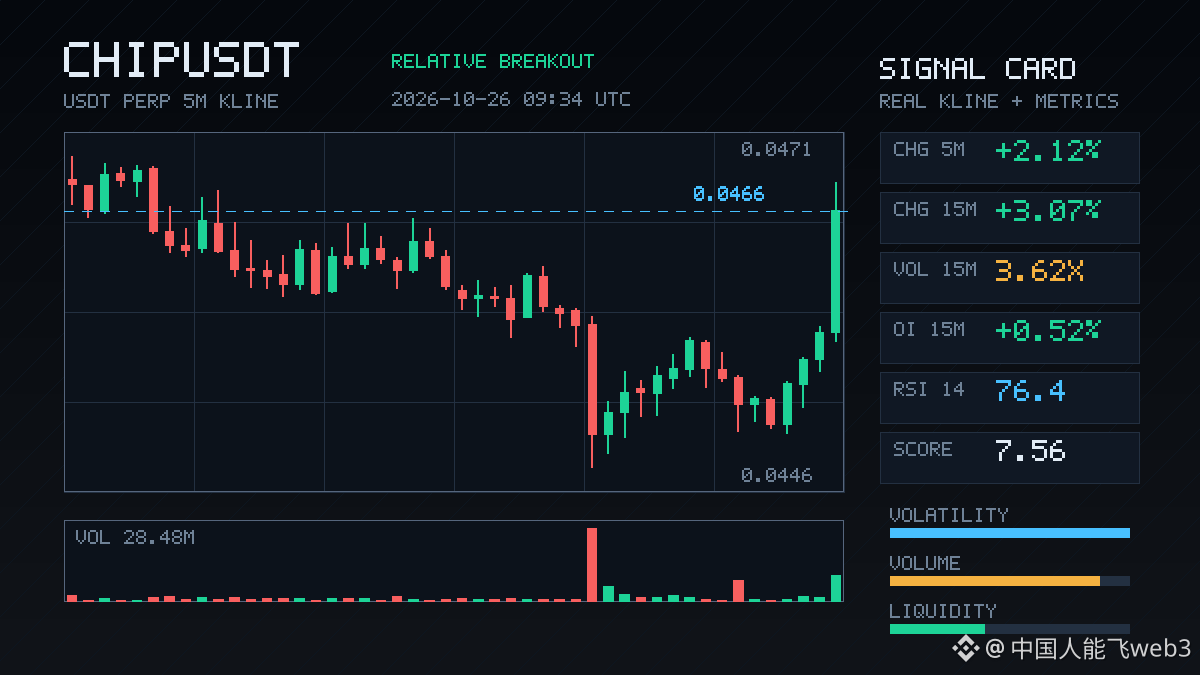
$CHIP made a clean move up: +3% in 15m, with volume at 3.6 times normal and the buy/sell ratio reaching 2.87. Aggressive buyers accounted for nearly half of the flow. OI was up 0.5% over half an hour and 0.68% over an hour, with price and open interest rising in tandem—a classic leveraged long entry, not the kind of artificial rise caused by short covering. Its anomaly percentile is 97.2%, ranking #12 across the entire pool and already brushing up against historical extremes. Funding rates have also climbed to recent highs. With just over 15 million in 24h trading volume, the market isn’t particularly deep. In this setup, be cautious about chasing the price: missing out stings, but buying in at the top could hurt even more.
$CHIP made a clean move up: +3% in 15m, with volume at 3.6 times normal and the buy/sell ratio reaching 2.87. Aggressive buyers accounted for nearly half of the flow. OI was up 0.5% over half an hour and 0.68% over an hour, with price and open interest rising in tandem—a classic leveraged long entry, not the kind of artificial rise caused by short covering. Its anomaly percentile is 97.2%, ranking #12 across the entire pool and already brushing up against historical extremes. Funding rates have also climbed to recent highs. With just over 15 million in 24h trading volume, the market isn’t particularly deep. In this setup, be cautious about chasing the price: missing out stings, but buying in at the top could hurt even more.
3

·
--
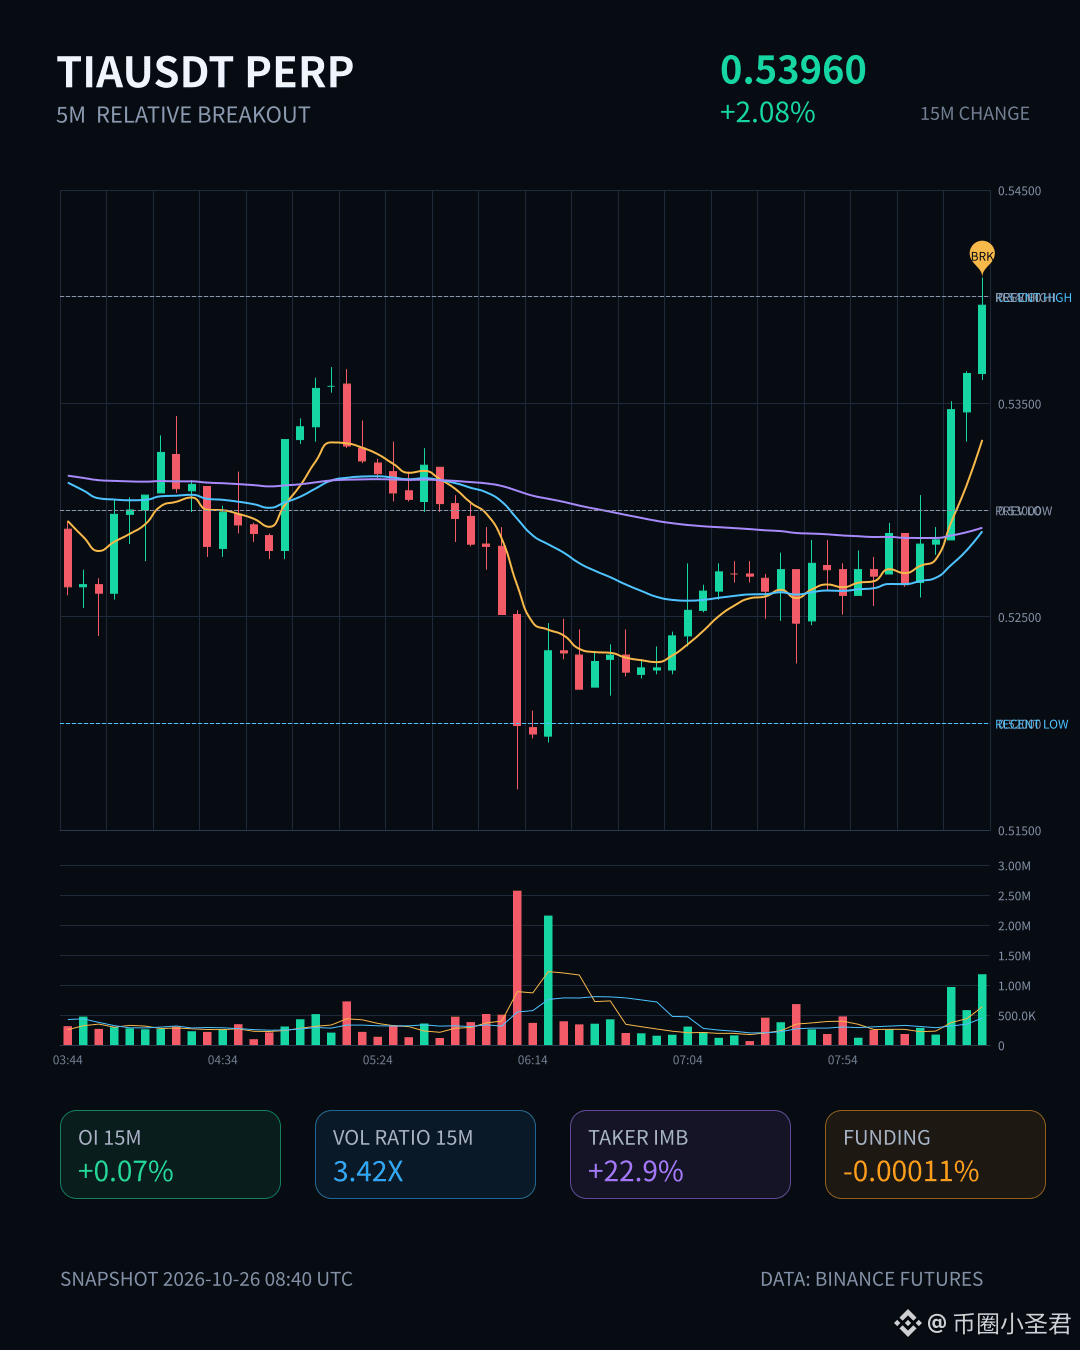
$TIA This rally looks pretty well-supported. 15m volume expanded to 3.4 times its usual level, with noticeably stronger aggressive buying; the buy/sell ratio is 1.59, and the price broke above the highs of the last 20 or so 5m candles.
The key is that OI is rising in tandem—net increases on both the 15m and 1h timeframes, with the combined notional increase approaching 1 million USDT. Its anomaly percentile has already hit 98.2%, ranking #12 across the entire pool. This isn’t just a spot-driven spike; it looks more like new leveraged longs are moving in.
Price is up, open interest is up, and volume confirms the move. Structurally, that’s much healthier than a low-volume wick. Still, with OI at such an extreme level, weigh the risk-reward before chasing higher, and don’t get carried away when sentiment is at its hottest.
$TIA This rally looks pretty well-supported. 15m volume expanded to 3.4 times its usual level, with noticeably stronger aggressive buying; the buy/sell ratio is 1.59, and the price broke above the highs of the last 20 or so 5m candles.
The key is that OI is rising in tandem—net increases on both the 15m and 1h timeframes, with the combined notional increase approaching 1 million USDT. Its anomaly percentile has already hit 98.2%, ranking #12 across the entire pool. This isn’t just a spot-driven spike; it looks more like new leveraged longs are moving in.
Price is up, open interest is up, and volume confirms the move. Structurally, that’s much healthier than a low-volume wick. Still, with OI at such an extreme level, weigh the risk-reward before chasing higher, and don’t get carried away when sentiment is at its hottest.
The key is that OI is rising in tandem—net increases on both the 15m and 1h timeframes, with the combined notional increase approaching 1 million USDT. Its anomaly percentile has already hit 98.2%, ranking #12 across the entire pool. This isn’t just a spot-driven spike; it looks more like new leveraged longs are moving in.
Price is up, open interest is up, and volume confirms the move. Structurally, that’s much healthier than a low-volume wick. Still, with OI at such an extreme level, weigh the risk-reward before chasing higher, and don’t get carried away when sentiment is at its hottest.
3
·
--
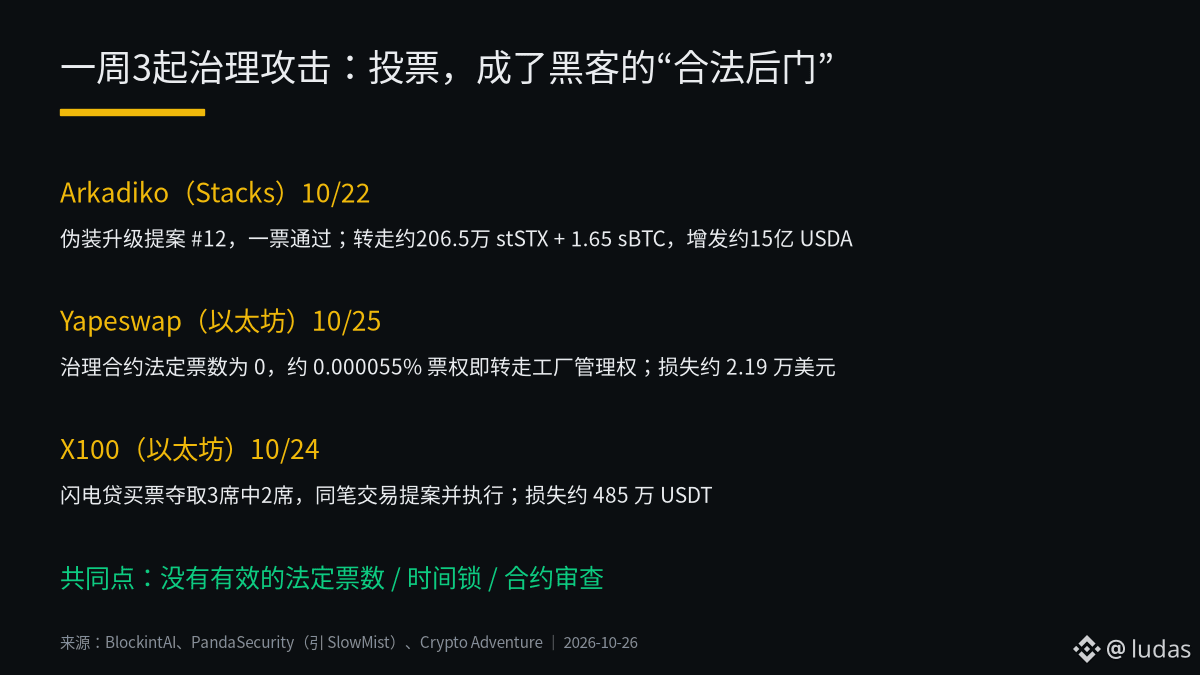
In just one week, three DeFi projects were drained through “voting”—the hackers didn’t crack the contracts; they simply won governance votes legitimately. ⚠️
🧵 According to BlockintAI’s on-chain analysis, on October 22, a proposal disguised as a routine upgrade passed on Stacks-based Arkadiko. Proposal #12 received just one vote—the attacker’s. They then transferred approximately 2.065 million stSTX and 1.65 sBTC, and minted around 1.5 billion USDA, causing USDA to depeg.
🔓 According to PandaSecurity (citing SlowMist), on October 25, the governance contract of Yapeswap, a small Ethereum DEX, had a quorum requirement of zero. Just about 0.000055% of the voting power was enough to transfer control of the factory, resulting in losses of approximately $21,900—almost the protocol’s entire TVL.
⚡ According to Crypto Adventure, on October 24, around 1.94 million USDT was borrowed via flash loan to buy votes in X100, securing 2 of 3 board seats. A proposal was submitted and executed in the same transaction, resulting in losses of approximately 4.85 million USDT.
🛡️ All three incidents shared the same weaknesses: quorum requirements were effectively nonexistent, there were no timelocks, and nobody reviewed the proposal code.
💡 My take: Governance in small projects is often just for show—but even a show can authorize fund transfers. Before getting involved with any DeFi project that has a governance token, check at least three things: whether execution is delayed, what the quorum requirement is, and what code the latest proposal changed.
Are people actually reading governance proposals in the protocols you’re involved with? Would governance risks make you withdraw your funds? 👇
If you found this useful, give it a like and share it with friends who are still farming~
#DeFi安全 #治理攻击 #Web3Security
In just one week, three DeFi projects were drained through “voting”—the hackers didn’t crack the contracts; they simply won governance votes legitimately. ⚠️
🧵 According to BlockintAI’s on-chain analysis, on October 22, a proposal disguised as a routine upgrade passed on Stacks-based Arkadiko. Proposal #12 received just one vote—the attacker’s. They then transferred approximately 2.065 million stSTX and 1.65 sBTC, and minted around 1.5 billion USDA, causing USDA to depeg.
🔓 According to PandaSecurity (citing SlowMist), on October 25, the governance contract of Yapeswap, a small Ethereum DEX, had a quorum requirement of zero. Just about 0.000055% of the voting power was enough to transfer control of the factory, resulting in losses of approximately $21,900—almost the protocol’s entire TVL.
⚡ According to Crypto Adventure, on October 24, around 1.94 million USDT was borrowed via flash loan to buy votes in X100, securing 2 of 3 board seats. A proposal was submitted and executed in the same transaction, resulting in losses of approximately 4.85 million USDT.
🛡️ All three incidents shared the same weaknesses: quorum requirements were effectively nonexistent, there were no timelocks, and nobody reviewed the proposal code.
💡 My take: Governance in small projects is often just for show—but even a show can authorize fund transfers. Before getting involved with any DeFi project that has a governance token, check at least three things: whether execution is delayed, what the quorum requirement is, and what code the latest proposal changed.
Are people actually reading governance proposals in the protocols you’re involved with? Would governance risks make you withdraw your funds? 👇
If you found this useful, give it a like and share it with friends who are still farming~
#DeFi安全 #治理攻击 #Web3Security
🧵 According to BlockintAI’s on-chain analysis, on October 22, a proposal disguised as a routine upgrade passed on Stacks-based Arkadiko. Proposal #12 received just one vote—the attacker’s. They then transferred approximately 2.065 million stSTX and 1.65 sBTC, and minted around 1.5 billion USDA, causing USDA to depeg.
🔓 According to PandaSecurity (citing SlowMist), on October 25, the governance contract of Yapeswap, a small Ethereum DEX, had a quorum requirement of zero. Just about 0.000055% of the voting power was enough to transfer control of the factory, resulting in losses of approximately $21,900—almost the protocol’s entire TVL.
⚡ According to Crypto Adventure, on October 24, around 1.94 million USDT was borrowed via flash loan to buy votes in X100, securing 2 of 3 board seats. A proposal was submitted and executed in the same transaction, resulting in losses of approximately 4.85 million USDT.
🛡️ All three incidents shared the same weaknesses: quorum requirements were effectively nonexistent, there were no timelocks, and nobody reviewed the proposal code.
💡 My take: Governance in small projects is often just for show—but even a show can authorize fund transfers. Before getting involved with any DeFi project that has a governance token, check at least three things: whether execution is delayed, what the quorum requirement is, and what code the latest proposal changed.
Are people actually reading governance proposals in the protocols you’re involved with? Would governance risks make you withdraw your funds? 👇
If you found this useful, give it a like and share it with friends who are still farming~
#DeFi安全 #治理攻击 #Web3Security
·
--
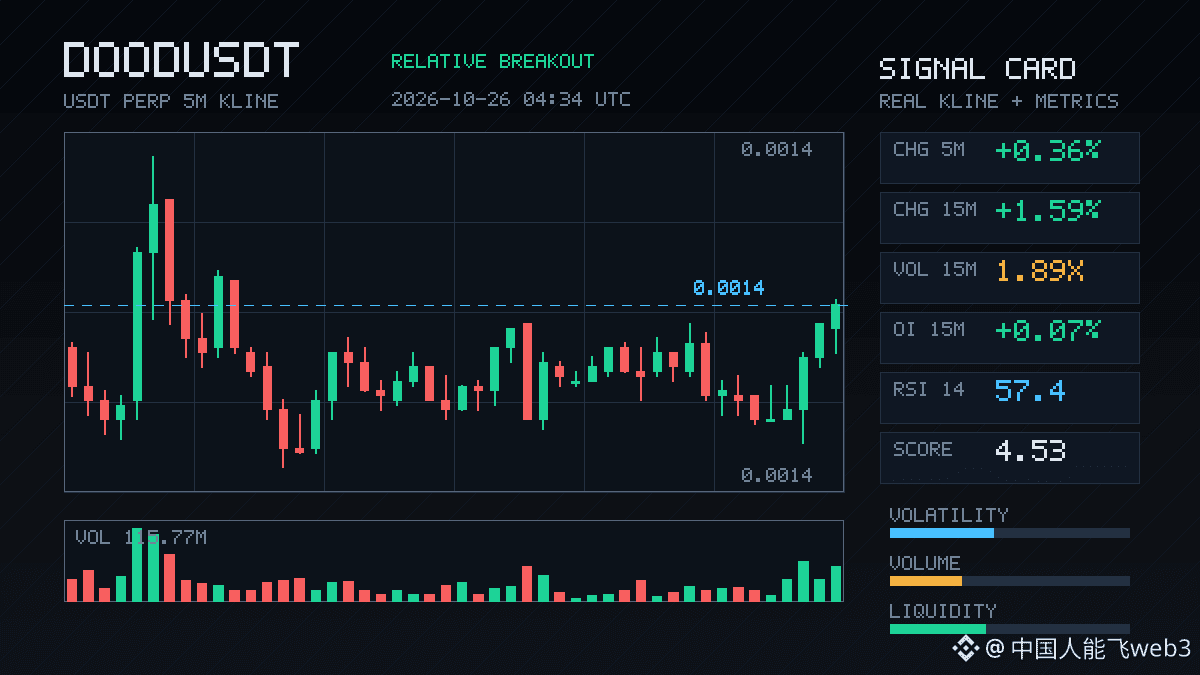
$DOOD 15m broke above the upper bound of nearly 20 recent 5m ranges on expanding volume. Volume was 1.89x, aggressive buy/sell delta was 8%, the buy/sell ratio was 1.17, and 1h OI climbed steadily to the 87.1st percentile—price and OI rising together, suggesting new leveraged longs are entering. Ranked #12 among all-pool anomalies, while notional change is still relatively low-ranked, so this looks more like an early move. Watch for support on a pullback to the upper bound; don't rush to chase the highs.
$DOOD 15m broke above the upper bound of nearly 20 recent 5m ranges on expanding volume. Volume was 1.89x, aggressive buy/sell delta was 8%, the buy/sell ratio was 1.17, and 1h OI climbed steadily to the 87.1st percentile—price and OI rising together, suggesting new leveraged longs are entering. Ranked #12 among all-pool anomalies, while notional change is still relatively low-ranked, so this looks more like an early move. Watch for support on a pullback to the upper bound; don't rush to chase the highs.
2
·
--
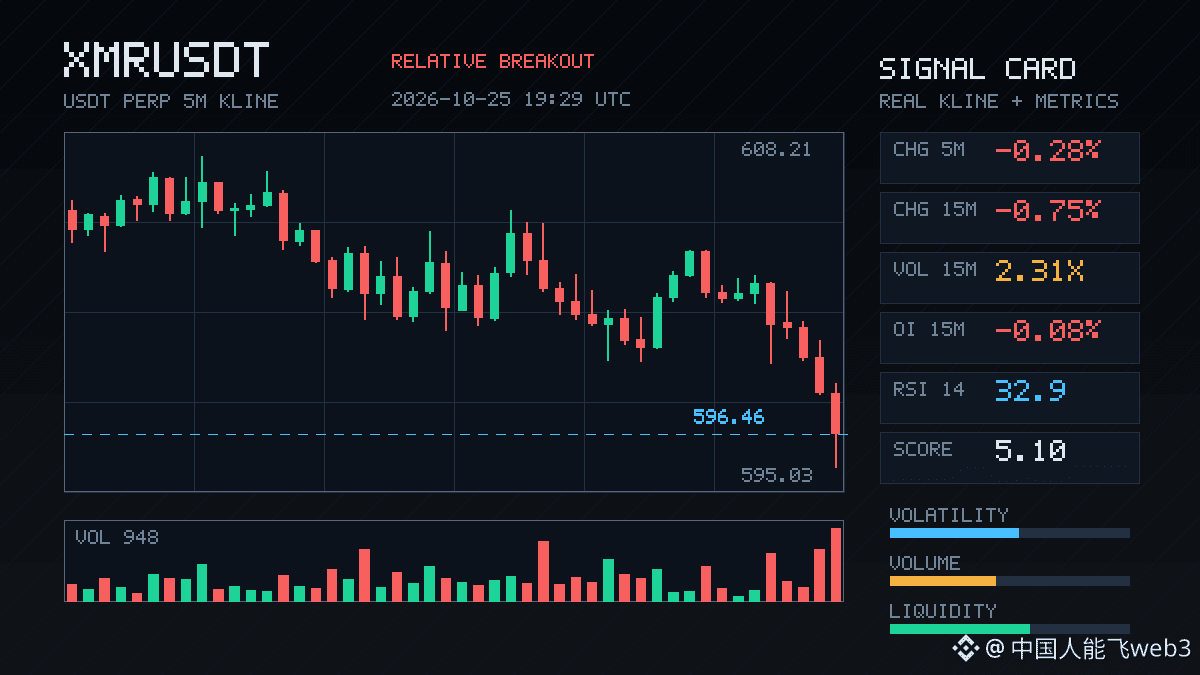
$XMR 15 minutes broke below the lower bound of the past 20 5m ranges, with volume surging to 2.31x and the taker volume delta at -32.1%—clear selling pressure.
But interestingly, OI is falling: -0.08% over 15m and -0.07% over 1h, with notional changes also contracting. Price down + OI down is typical deleveraging, not a sell-off driven by new shorts entering; it looks more like long stop-losses or positions being passively reduced.
OI anomaly percentile: 86.5%, ranked #12 across the entire pool. This kind of anomaly persisting across multiple timeframes is worth keeping an eye on. 24h trading volume is 54.74M, and market depth confirms it’s not a false move.
My take: the “quality” of this decline is more nuanced than it looks on the surface. Leverage is being flushed out; watch whether OI can stabilize going forward.
$XMR 15 minutes broke below the lower bound of the past 20 5m ranges, with volume surging to 2.31x and the taker volume delta at -32.1%—clear selling pressure.
But interestingly, OI is falling: -0.08% over 15m and -0.07% over 1h, with notional changes also contracting. Price down + OI down is typical deleveraging, not a sell-off driven by new shorts entering; it looks more like long stop-losses or positions being passively reduced.
OI anomaly percentile: 86.5%, ranked #12 across the entire pool. This kind of anomaly persisting across multiple timeframes is worth keeping an eye on. 24h trading volume is 54.74M, and market depth confirms it’s not a false move.
My take: the “quality” of this decline is more nuanced than it looks on the surface. Leverage is being flushed out; watch whether OI can stabilize going forward.
But interestingly, OI is falling: -0.08% over 15m and -0.07% over 1h, with notional changes also contracting. Price down + OI down is typical deleveraging, not a sell-off driven by new shorts entering; it looks more like long stop-losses or positions being passively reduced.
OI anomaly percentile: 86.5%, ranked #12 across the entire pool. This kind of anomaly persisting across multiple timeframes is worth keeping an eye on. 24h trading volume is 54.74M, and market depth confirms it’s not a false move.
My take: the “quality” of this decline is more nuanced than it looks on the surface. Leverage is being flushed out; watch whether OI can stabilize going forward.
1
·
--
$ICNT : This drop is a bit sharp: down 2.13% in 15m, with volume nearly 4x higher and an aggressive buy/sell ratio of 0.54, showing clear selling pressure.
The key point is that OI is still rising—up 0.63% in 15m and 0.92% in 1h. Price is falling while open interest increases, a classic sign of new shorts entering rather than old longs capitulating. The close also broke below the lows of nearly 20 recent 5m candles, making the structure look weak.
The anomaly percentile is 82.3%, ranking #12 across the entire pool. This kind of volume-price action isn’t just a random wiggle. 24h trading volume is only 15.9M, so liquidity is thin; if the price keeps dropping, slippage could amplify the move.
First, watch whether price can quickly reclaim the lower edge of this range. If it can’t, shorts still have room to add leverage. Don’t rush to buy the dip.
$ICNT : This drop is a bit sharp: down 2.13% in 15m, with volume nearly 4x higher and an aggressive buy/sell ratio of 0.54, showing clear selling pressure.
The key point is that OI is still rising—up 0.63% in 15m and 0.92% in 1h. Price is falling while open interest increases, a classic sign of new shorts entering rather than old longs capitulating. The close also broke below the lows of nearly 20 recent 5m candles, making the structure look weak.
The anomaly percentile is 82.3%, ranking #12 across the entire pool. This kind of volume-price action isn’t just a random wiggle. 24h trading volume is only 15.9M, so liquidity is thin; if the price keeps dropping, slippage could amplify the move.
First, watch whether price can quickly reclaim the lower edge of this range. If it can’t, shorts still have room to add leverage. Don’t rush to buy the dip.
The key point is that OI is still rising—up 0.63% in 15m and 0.92% in 1h. Price is falling while open interest increases, a classic sign of new shorts entering rather than old longs capitulating. The close also broke below the lows of nearly 20 recent 5m candles, making the structure look weak.
The anomaly percentile is 82.3%, ranking #12 across the entire pool. This kind of volume-price action isn’t just a random wiggle. 24h trading volume is only 15.9M, so liquidity is thin; if the price keeps dropping, slippage could amplify the move.
First, watch whether price can quickly reclaim the lower edge of this range. If it can’t, shorts still have room to add leverage. Don’t rush to buy the dip.

·
--
$JCT fell 2.93% over the past 15m, with price breaking below the lower bound of the recent 20-candle 5m range while OI rose—up 1.04% over 1h and 0.30% over 15m. Its nominal change ranked #12 across the entire pool. Price down + OI up looks more like new shorts entering with leverage than existing longs closing out. The funding rate is still in a high percentile compared with recent levels, taker flow imbalance is -6.1%, and the buy/sell ratio is 0.89, with selling pressure in control. 24h trading volume is 288 million, and liquidity is sufficient, so this short signal at this level is worth keeping an eye on.
$JCT fell 2.93% over the past 15m, with price breaking below the lower bound of the recent 20-candle 5m range while OI rose—up 1.04% over 1h and 0.30% over 15m. Its nominal change ranked #12 across the entire pool. Price down + OI up looks more like new shorts entering with leverage than existing longs closing out. The funding rate is still in a high percentile compared with recent levels, taker flow imbalance is -6.1%, and the buy/sell ratio is 0.89, with selling pressure in control. 24h trading volume is 288 million, and liquidity is sufficient, so this short signal at this level is worth keeping an eye on.
3
·
--
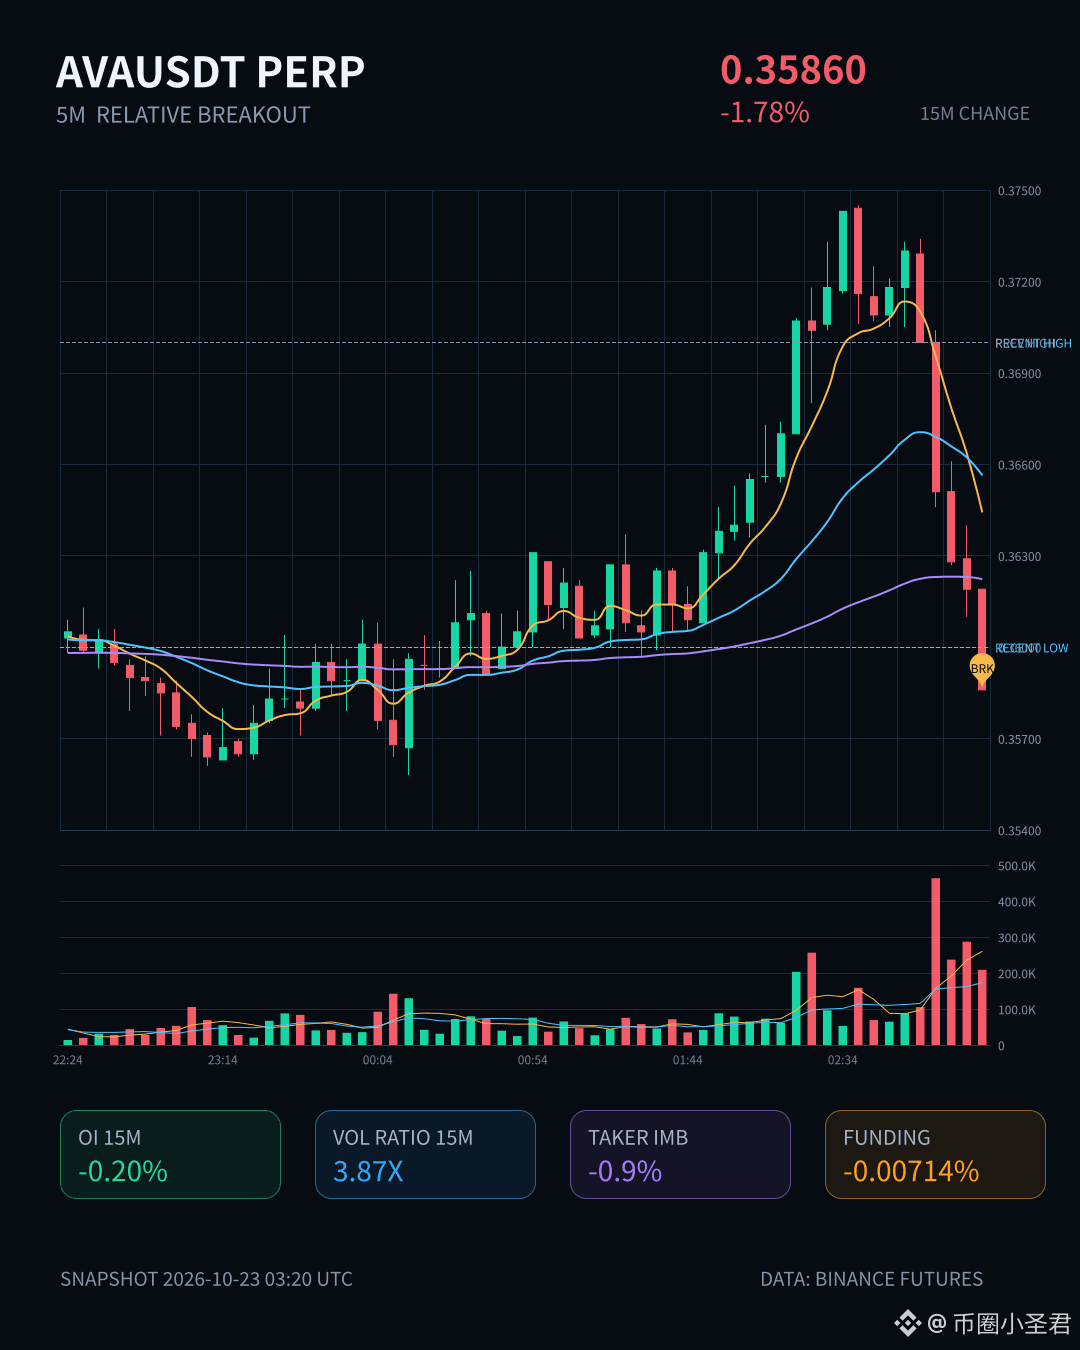
$AVA This drop is pretty sharp: it fell 1.78% in just 15 minutes, with volume rising to 3.87 times normal levels. Clearly, some holders couldn’t take the pressure and are handing over their positions.
Looking at positioning, OI is down on both the 15-minute and 1-hour timeframes, with notional changes of -96K and -46K. Combined with the price drop, this looks more like longs deleveraging and exiting via stop-losses than new shorts piling in to drive the price down. The taker buy/sell imbalance is -0.9%, and the buy/sell ratio is 0.98, so selling pressure isn’t overwhelming. But the price has already broken below the lows of the last 20 or so 5-minute candles, making the short-term structure look a bit rough.
The anomaly percentile is 89.1%, ranking #12 across the entire pool, and this has persisted for several consecutive periods. This kind of volume-price action doesn’t look much like noise. 24-hour trading volume is 23.8M, and the pool isn’t particularly deep, so a real sell-off could cause significant slippage.
Let’s first see if this deleveraging wave can stabilize. Don’t rush to catch a falling knife.
$AVA This drop is pretty sharp: it fell 1.78% in just 15 minutes, with volume rising to 3.87 times normal levels. Clearly, some holders couldn’t take the pressure and are handing over their positions.
Looking at positioning, OI is down on both the 15-minute and 1-hour timeframes, with notional changes of -96K and -46K. Combined with the price drop, this looks more like longs deleveraging and exiting via stop-losses than new shorts piling in to drive the price down. The taker buy/sell imbalance is -0.9%, and the buy/sell ratio is 0.98, so selling pressure isn’t overwhelming. But the price has already broken below the lows of the last 20 or so 5-minute candles, making the short-term structure look a bit rough.
The anomaly percentile is 89.1%, ranking #12 across the entire pool, and this has persisted for several consecutive periods. This kind of volume-price action doesn’t look much like noise. 24-hour trading volume is 23.8M, and the pool isn’t particularly deep, so a real sell-off could cause significant slippage.
Let’s first see if this deleveraging wave can stabilize. Don’t rush to catch a falling knife.
Looking at positioning, OI is down on both the 15-minute and 1-hour timeframes, with notional changes of -96K and -46K. Combined with the price drop, this looks more like longs deleveraging and exiting via stop-losses than new shorts piling in to drive the price down. The taker buy/sell imbalance is -0.9%, and the buy/sell ratio is 0.98, so selling pressure isn’t overwhelming. But the price has already broken below the lows of the last 20 or so 5-minute candles, making the short-term structure look a bit rough.
The anomaly percentile is 89.1%, ranking #12 across the entire pool, and this has persisted for several consecutive periods. This kind of volume-price action doesn’t look much like noise. 24-hour trading volume is 23.8M, and the pool isn’t particularly deep, so a real sell-off could cause significant slippage.
Let’s first see if this deleveraging wave can stabilize. Don’t rush to catch a falling knife.
4

·
--
$MEW 's 15m move was pretty decisive, up +2.1% and straight through the highs of the last 20 or so 5m candles. The key is that OI moved up alongside it: +2.66% over 1h, volume at 1.61x, and a taker buy/sell ratio of 1.72—this looks much more like new leveraged longs entering than shorts covering.
Its OI anomaly percentile is 85.5%, ranking #12 across the whole pool. Not top-tier, but definitely noticeable. 24h trading volume is only 14.85M, so liquidity is thin; a breakout of this size could easily get rejected. First see if it can hold above the highs. Be cautious about chasing.
$MEW 's 15m move was pretty decisive, up +2.1% and straight through the highs of the last 20 or so 5m candles. The key is that OI moved up alongside it: +2.66% over 1h, volume at 1.61x, and a taker buy/sell ratio of 1.72—this looks much more like new leveraged longs entering than shorts covering.
Its OI anomaly percentile is 85.5%, ranking #12 across the whole pool. Not top-tier, but definitely noticeable. 24h trading volume is only 14.85M, so liquidity is thin; a breakout of this size could easily get rejected. First see if it can hold above the highs. Be cautious about chasing.
Its OI anomaly percentile is 85.5%, ranking #12 across the whole pool. Not top-tier, but definitely noticeable. 24h trading volume is only 14.85M, so liquidity is thin; a breakout of this size could easily get rejected. First see if it can hold above the highs. Be cautious about chasing.
8
·
--
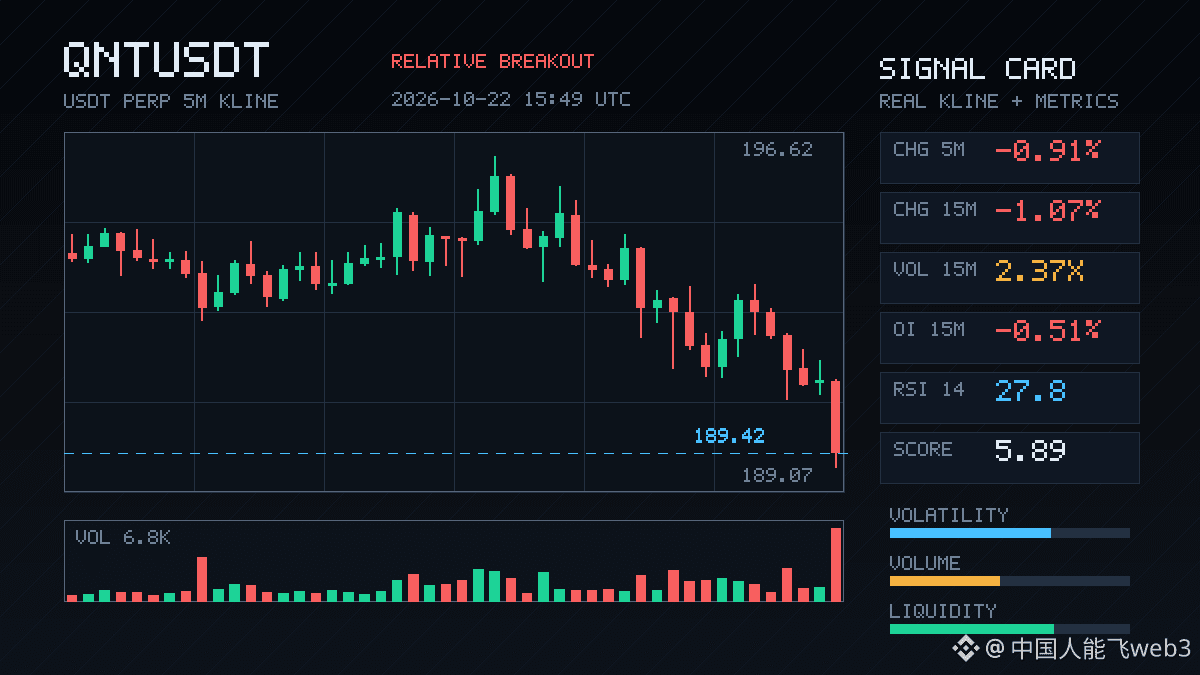
$QNT This 15m move is interesting. A 1.07% price drop is nothing major, but volume surged to 2.37x while OI kept falling—longs are exiting, not shorts launching a fierce attack. Active trade delta is -12.4%, the buy/sell ratio is 0.78, and selling pressure is clearly tilted. Price just broke below the lower bound of the last 20 5m candles. It ranks #5 for anomalies across the whole pool and #12 for notional change, with an OI anomaly percentile of 92.5%—that’s relatively high. This structure looks more like leveraged positions being flushed out than a trend reversal, so don’t rush to chase shorts.
$QNT This 15m move is interesting. A 1.07% price drop is nothing major, but volume surged to 2.37x while OI kept falling—longs are exiting, not shorts launching a fierce attack. Active trade delta is -12.4%, the buy/sell ratio is 0.78, and selling pressure is clearly tilted. Price just broke below the lower bound of the last 20 5m candles. It ranks #5 for anomalies across the whole pool and #12 for notional change, with an OI anomaly percentile of 92.5%—that’s relatively high. This structure looks more like leveraged positions being flushed out than a trend reversal, so don’t rush to chase shorts.
4

Article
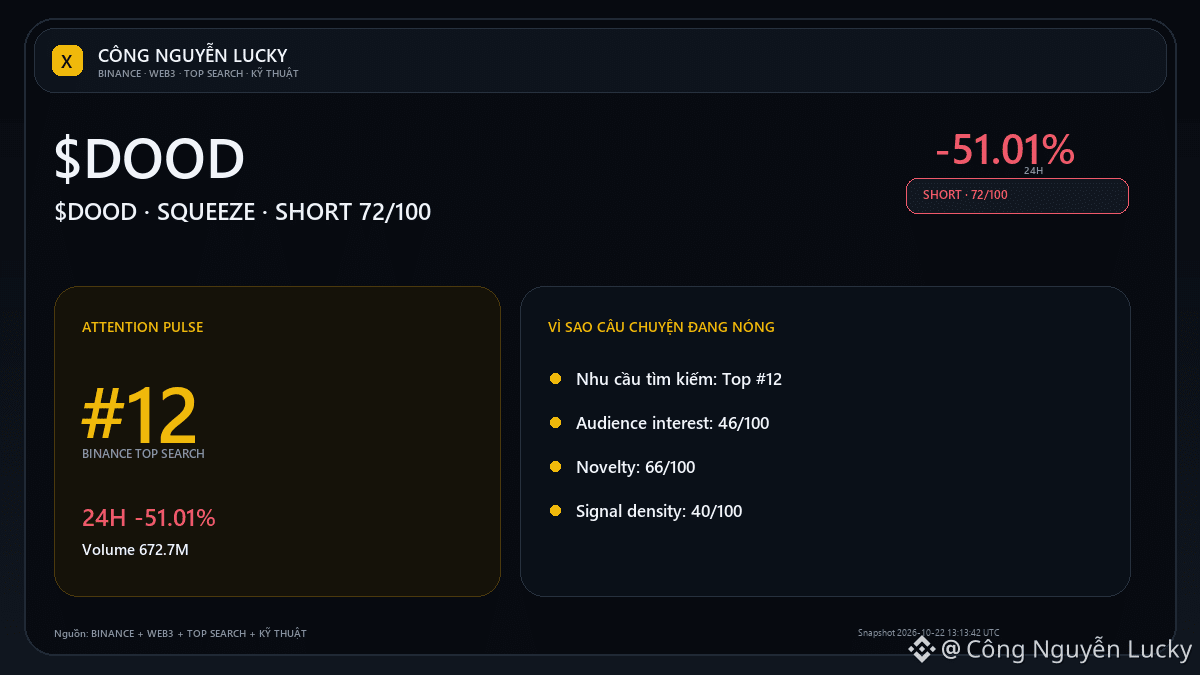
$DOOD -51.01%: What data confirms this sharp move?🔥 $DOOD is down 51.01% — but the percentage move alone isn’t enough to call this a good setup. Snapshot: 0.002207 · 24h -51.01% · volume ~672.7M USDT · 6,376,164 trades. 🟢 Bull/continuation case: A break below 0.00208 with expanding volume would make the continuation-of-the-decline scenario more credible.
🔴 Bear/cooling case: Failing to hold the lows and reclaim the midpoint at 0.003518 would ease downside pressure. 🎯 Preferred bias: **SHORT · MEDIUM · 72/100**.
$DOOD -51.01%: What data confirms this sharp move?
🔥 $DOOD is down 51.01% — but the percentage move alone isn’t enough to call this a good setup. Snapshot: 0.002207 · 24h -51.01% · volume ~672.7M USDT · 6,376,164 trades. 🟢 Bull/continuation case: A break below 0.00208 with expanding volume would make the continuation-of-the-decline scenario more credible.
🔴 Bear/cooling case: Failing to hold the lows and reclaim the midpoint at 0.003518 would ease downside pressure. 🎯 Preferred bias: **SHORT · MEDIUM · 72/100**.
🔴 Bear/cooling case: Failing to hold the lows and reclaim the midpoint at 0.003518 would ease downside pressure. 🎯 Preferred bias: **SHORT · MEDIUM · 72/100**.
420
·
--
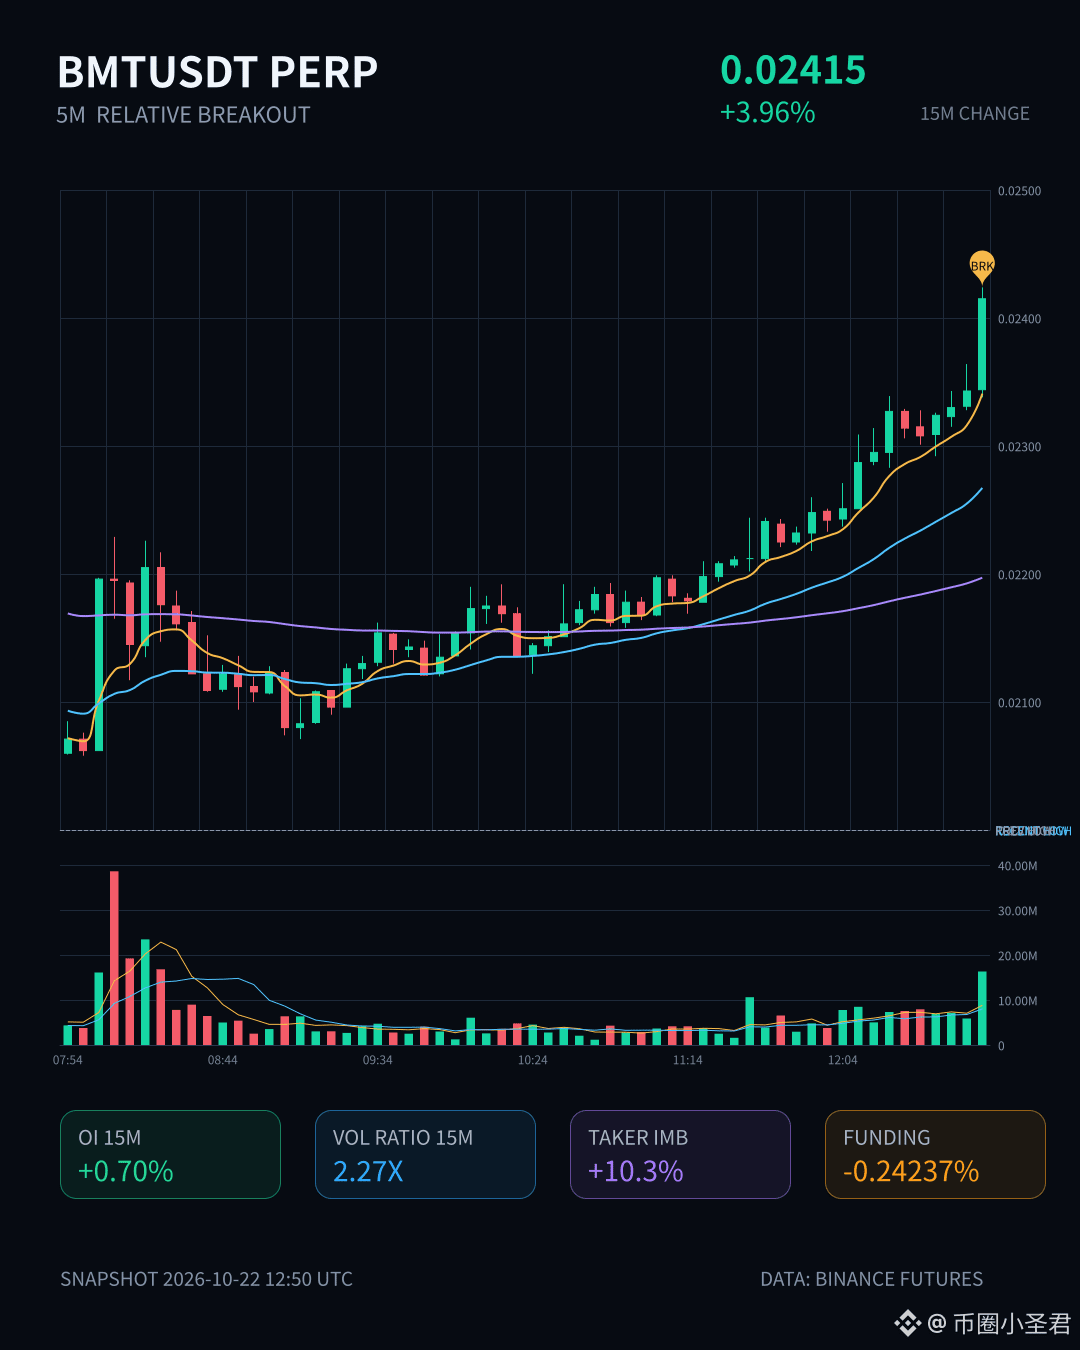
$BMT made a pretty decisive move over 15m, up +3.96% and breaking straight through the upper end of the last ~20 5m candles. Volume was 2.27x, Z-score 2.46, with a 10.3% net active buy imbalance and a 1.23 ratio—buyers are clearly more aggressive.
OI is interesting here: 15m contracts are up +0.70%, while 1h is still down -0.48%. But the notional change is actually larger on the 1h timeframe (220K vs. 109K), with an anomaly percentile of 80% and a rank of #12 across the whole pool. New leveraged longs are coming in over the short term to drive the move, while short covering on the 1h timeframe is also helping. Structurally, this looks more like new leveraged participation than purely position reshuffling. The funding rate is already at a high percentile relative to recent levels, so chasing longs is getting expensive.
24h trading volume is 61.96M, and depth looks fine. My take: don’t chase at the highs—wait for a pullback and confirmation before acting. At this funding rate, chasing higher could easily get crowded out. $BMT
$BMT made a pretty decisive move over 15m, up +3.96% and breaking straight through the upper end of the last ~20 5m candles. Volume was 2.27x, Z-score 2.46, with a 10.3% net active buy imbalance and a 1.23 ratio—buyers are clearly more aggressive.
OI is interesting here: 15m contracts are up +0.70%, while 1h is still down -0.48%. But the notional change is actually larger on the 1h timeframe (220K vs. 109K), with an anomaly percentile of 80% and a rank of #12 across the whole pool. New leveraged longs are coming in over the short term to drive the move, while short covering on the 1h timeframe is also helping. Structurally, this looks more like new leveraged participation than purely position reshuffling. The funding rate is already at a high percentile relative to recent levels, so chasing longs is getting expensive.
24h trading volume is 61.96M, and depth looks fine. My take: don’t chase at the highs—wait for a pullback and confirmation before acting. At this funding rate, chasing higher could easily get crowded out. $BMT
OI is interesting here: 15m contracts are up +0.70%, while 1h is still down -0.48%. But the notional change is actually larger on the 1h timeframe (220K vs. 109K), with an anomaly percentile of 80% and a rank of #12 across the whole pool. New leveraged longs are coming in over the short term to drive the move, while short covering on the 1h timeframe is also helping. Structurally, this looks more like new leveraged participation than purely position reshuffling. The funding rate is already at a high percentile relative to recent levels, so chasing longs is getting expensive.
24h trading volume is 61.96M, and depth looks fine. My take: don’t chase at the highs—wait for a pullback and confirmation before acting. At this funding rate, chasing higher could easily get crowded out. $BMT
2
·
--
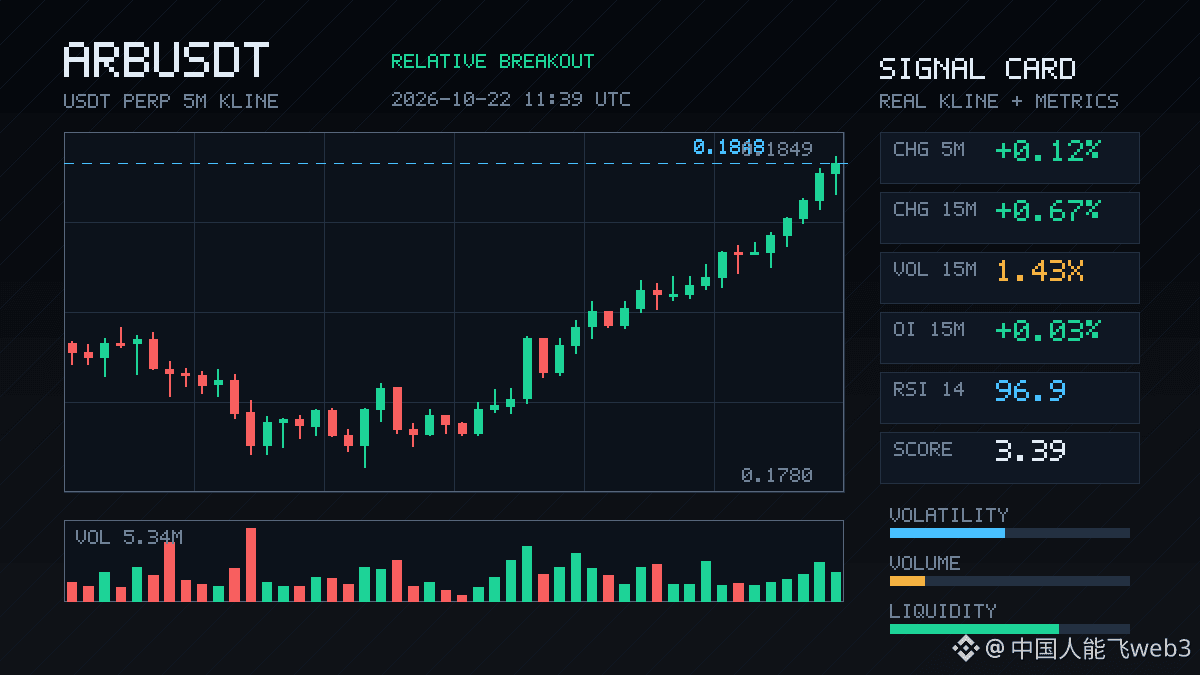
$ARB This move is getting interesting: the price has pushed above the highs of nearly 20 recent 5m candles, while 1h OI rose 0.68%, adding over a million U in notional value. It’s pretty clear that new leveraged longs are entering—not just shorts covering.
However, the aggressive trade imbalance is negative, and the buy/sell ratio is 0.91, suggesting that buyers aren’t fully chasing the move yet; sell orders are also being absorbed as the price rises. 15m volume is 1.43x, with a Z-score of 1.91—some unusual activity, but nothing explosive.
It ranks #8 for anomalies across the pool and #12 for notional change. Moves at this level usually aren’t driven by retail traders, but this isn’t a market-wide confluence either. 24h trading volume is 128M, and liquidity is adequate. The key is whether this breakout can hold—let’s hope it doesn’t just wick up and fade.
$ARB This move is getting interesting: the price has pushed above the highs of nearly 20 recent 5m candles, while 1h OI rose 0.68%, adding over a million U in notional value. It’s pretty clear that new leveraged longs are entering—not just shorts covering.
However, the aggressive trade imbalance is negative, and the buy/sell ratio is 0.91, suggesting that buyers aren’t fully chasing the move yet; sell orders are also being absorbed as the price rises. 15m volume is 1.43x, with a Z-score of 1.91—some unusual activity, but nothing explosive.
It ranks #8 for anomalies across the pool and #12 for notional change. Moves at this level usually aren’t driven by retail traders, but this isn’t a market-wide confluence either. 24h trading volume is 128M, and liquidity is adequate. The key is whether this breakout can hold—let’s hope it doesn’t just wick up and fade.
However, the aggressive trade imbalance is negative, and the buy/sell ratio is 0.91, suggesting that buyers aren’t fully chasing the move yet; sell orders are also being absorbed as the price rises. 15m volume is 1.43x, with a Z-score of 1.91—some unusual activity, but nothing explosive.
It ranks #8 for anomalies across the pool and #12 for notional change. Moves at this level usually aren’t driven by retail traders, but this isn’t a market-wide confluence either. 24h trading volume is 128M, and liquidity is adequate. The key is whether this breakout can hold—let’s hope it doesn’t just wick up and fade.
5
·
--
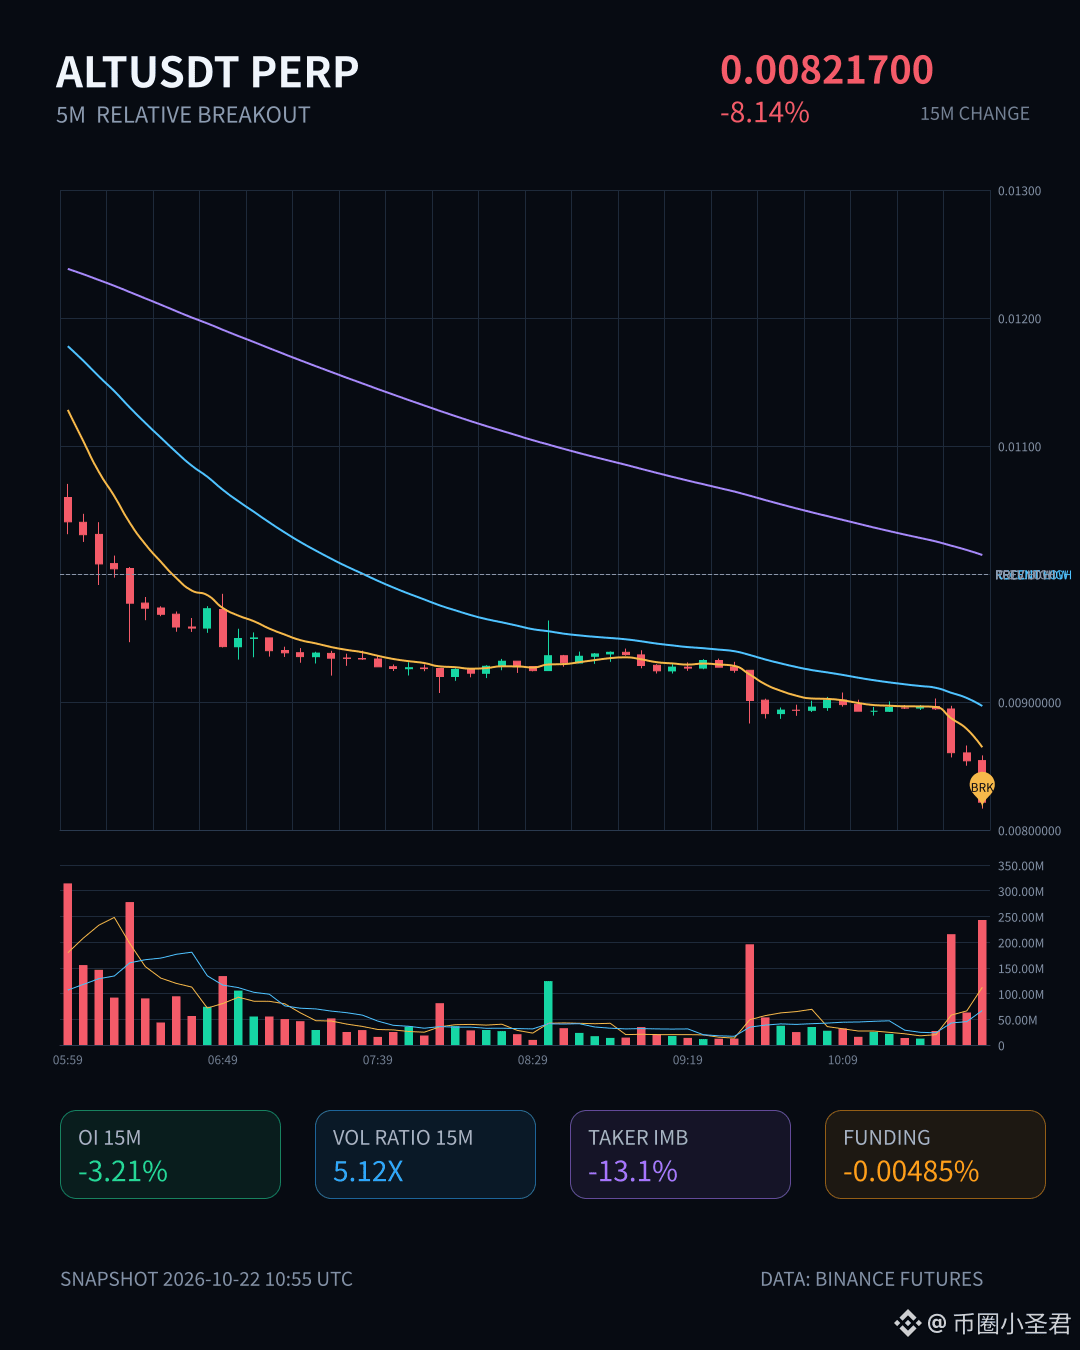
$ALT saw a pretty sharp drop: down 8.14% in 15m, with volume surging to more than 5 times its previous level and the aggressive trade delta at -13.1%, clearly showing sellers in control. But looking closer, OI is shrinking at the same time: -3.21% for 15m contracts and -3.43% for 1h, with the notional change close to -850,000 U. This looks more like longs being liquidated or actively closing positions than fresh shorts entering to drive the price down. The price has just broken below the low of the last 20 or so 5m candles, and the OI anomaly percentile has reached 93.1%, ranking #12 across the entire pool—suggesting this deleveraging move is relatively extreme. The key thing to watch next is whether OI keeps falling or stabilizes. If OI stops dropping and the price recovers, this is more likely to have been a shakeout; if OI keeps collapsing and the price fails to recover, don't rush to buy the dip.
$ALT saw a pretty sharp drop: down 8.14% in 15m, with volume surging to more than 5 times its previous level and the aggressive trade delta at -13.1%, clearly showing sellers in control. But looking closer, OI is shrinking at the same time: -3.21% for 15m contracts and -3.43% for 1h, with the notional change close to -850,000 U. This looks more like longs being liquidated or actively closing positions than fresh shorts entering to drive the price down. The price has just broken below the low of the last 20 or so 5m candles, and the OI anomaly percentile has reached 93.1%, ranking #12 across the entire pool—suggesting this deleveraging move is relatively extreme. The key thing to watch next is whether OI keeps falling or stabilizes. If OI stops dropping and the price recovers, this is more likely to have been a shakeout; if OI keeps collapsing and the price fails to recover, don't rush to buy the dip.
·
--
ADA saw a high-volume sell-off over the past 15m, with volume reaching 2.28x normal levels. Price broke below the lower end of the recent 20-candle 5m range; the taker buy/sell ratio was 0.45 and the taker volume delta was -37.6%—selling pressure is real. But OI fell along with it: -0.36% over 15m and -0.16% over 1h, with notional exposure down by more than 800,000 U. This looks more like longs deleveraging and stops being hit than fresh shorts entering to drive the price down. The anomaly percentile is 90.7%, ranking #12 across the entire pool, and the pattern has persisted across several timeframes. At minimum, this structure suggests positions are shrinking, rather than simple panic. First see whether price can stabilize near the lower end after this wave of deleveraging plays out—don't rush to buy the dip.
ADA saw a high-volume sell-off over the past 15m, with volume reaching 2.28x normal levels. Price broke below the lower end of the recent 20-candle 5m range; the taker buy/sell ratio was 0.45 and the taker volume delta was -37.6%—selling pressure is real. But OI fell along with it: -0.36% over 15m and -0.16% over 1h, with notional exposure down by more than 800,000 U. This looks more like longs deleveraging and stops being hit than fresh shorts entering to drive the price down. The anomaly percentile is 90.7%, ranking #12 across the entire pool, and the pattern has persisted across several timeframes. At minimum, this structure suggests positions are shrinking, rather than simple panic. First see whether price can stabilize near the lower end after this wave of deleveraging plays out—don't rush to buy the dip.
·
--
$CVX has some serious momentum. It’s up 1.93% over 15m, with volume surging to 2.29x. OI is up 2.87% over one hour and 1.55% over 15m. Price and open interest are rising together, which clearly points to new leveraged longs entering—not just a hollow pump from short covering.
Aggressive trade delta is 20.4%, the buy/sell ratio is 1.51, and the close is still above the upper end of the past 20 5m candles. The funding rate has also climbed to a high percentile for the recent period. The anomaly percentile is 92.9%, ranking #12 across the whole pool, and the order book depth confirms the move.
That said, with funding this high, chasing longs is already costly. If it can’t push higher in the short term, it could easily reverse and shake out late buyers. For now, I’ll watch whether it can hold above the top of this range. Only then would I consider a continuation—no need to get carried away.
$CVX has some serious momentum. It’s up 1.93% over 15m, with volume surging to 2.29x. OI is up 2.87% over one hour and 1.55% over 15m. Price and open interest are rising together, which clearly points to new leveraged longs entering—not just a hollow pump from short covering.
Aggressive trade delta is 20.4%, the buy/sell ratio is 1.51, and the close is still above the upper end of the past 20 5m candles. The funding rate has also climbed to a high percentile for the recent period. The anomaly percentile is 92.9%, ranking #12 across the whole pool, and the order book depth confirms the move.
That said, with funding this high, chasing longs is already costly. If it can’t push higher in the short term, it could easily reverse and shake out late buyers. For now, I’ll watch whether it can hold above the top of this range. Only then would I consider a continuation—no need to get carried away.
Aggressive trade delta is 20.4%, the buy/sell ratio is 1.51, and the close is still above the upper end of the past 20 5m candles. The funding rate has also climbed to a high percentile for the recent period. The anomaly percentile is 92.9%, ranking #12 across the whole pool, and the order book depth confirms the move.
That said, with funding this high, chasing longs is already costly. If it can’t push higher in the short term, it could easily reverse and shake out late buyers. For now, I’ll watch whether it can hold above the top of this range. Only then would I consider a continuation—no need to get carried away.
·
--
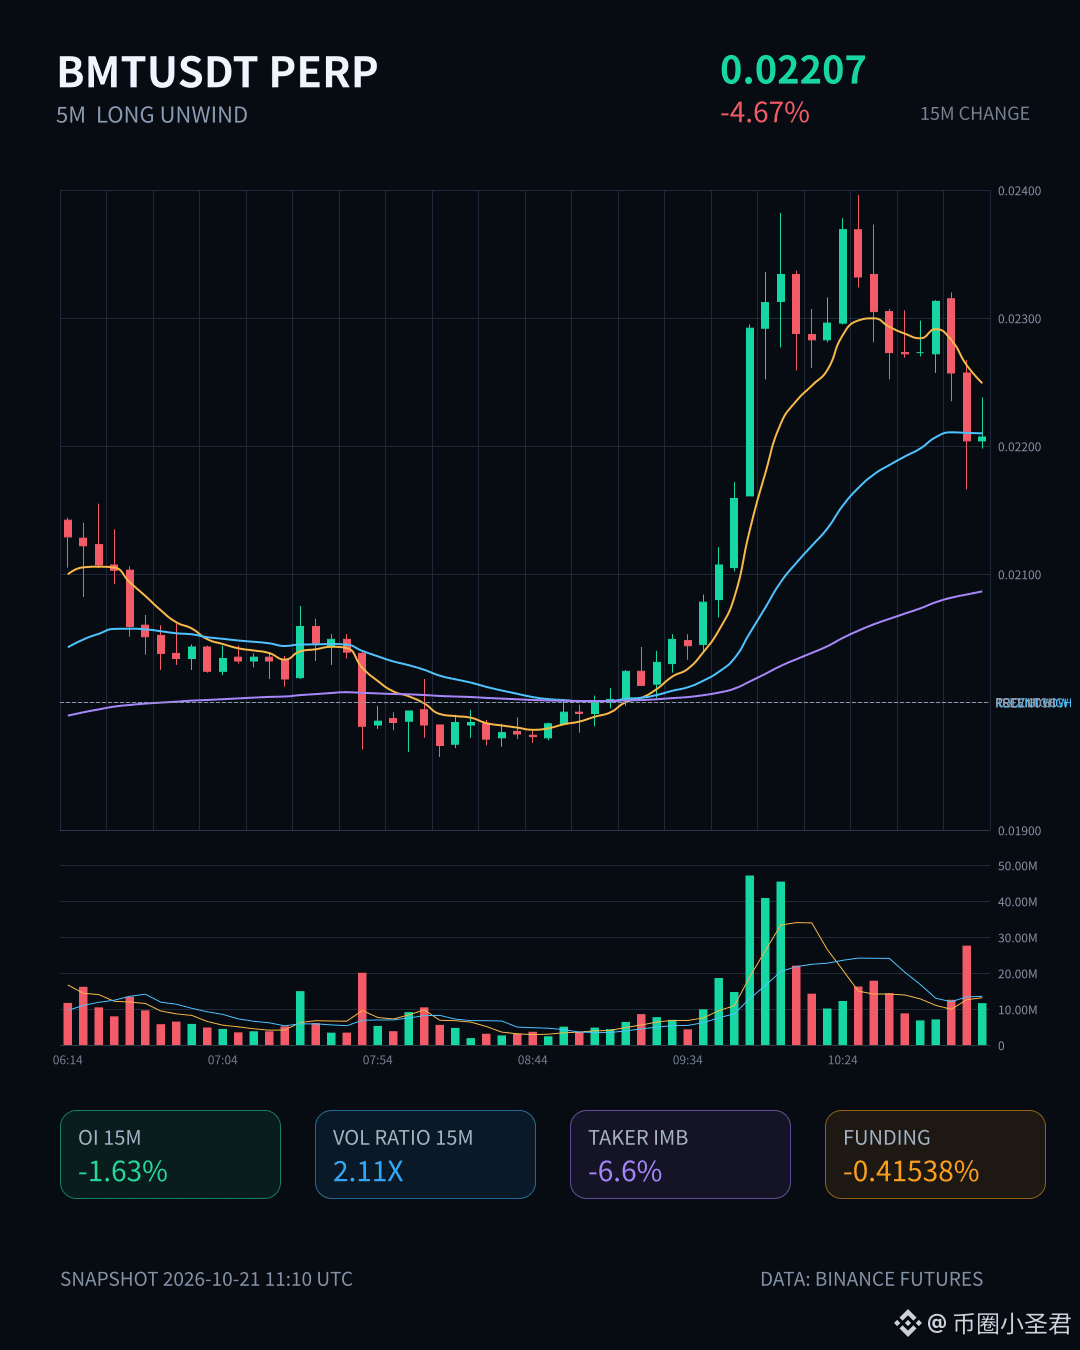
$BMT is down 4.67% over this 15m move. The structure looks more like long deleveraging than new shorts entering—OI is down 1.63% over 15m and 1.75% over 1h, with price and open interest shrinking together, typical of stop-losses and position trimming.
Volume is up 2.11x, and the taker volume delta is -6.6%, so selling pressure is real. The funding rate is still at a high percentile for recent levels, and longs were getting somewhat crowded. OI's abnormality percentile is 94.8%, ranking #12 across the pool. Extreme readings like this are often followed by further aftershocks.
24h trading volume of 37.87M isn't particularly high, and market depth is average. Don't rush to buy the dip.
$BMT is down 4.67% over this 15m move. The structure looks more like long deleveraging than new shorts entering—OI is down 1.63% over 15m and 1.75% over 1h, with price and open interest shrinking together, typical of stop-losses and position trimming.
Volume is up 2.11x, and the taker volume delta is -6.6%, so selling pressure is real. The funding rate is still at a high percentile for recent levels, and longs were getting somewhat crowded. OI's abnormality percentile is 94.8%, ranking #12 across the pool. Extreme readings like this are often followed by further aftershocks.
24h trading volume of 37.87M isn't particularly high, and market depth is average. Don't rush to buy the dip.
Volume is up 2.11x, and the taker volume delta is -6.6%, so selling pressure is real. The funding rate is still at a high percentile for recent levels, and longs were getting somewhat crowded. OI's abnormality percentile is 94.8%, ranking #12 across the pool. Extreme readings like this are often followed by further aftershocks.
24h trading volume of 37.87M isn't particularly high, and market depth is average. Don't rush to buy the dip.
2
·
--
$MORPHO is looking interesting. 15m volume is up 2.37x, price is +0.55%, and OI has been gradually rising over the past hour (+0.81%). New leveraged longs are coming in, so this isn’t a fake pump caused by shorts covering. Aggressive trade delta is +16.1%, the buy/sell ratio is 1.38, and the close is above the top of the recent 20-candle 5m range—a genuine structural breakout. It ranks #12 for anomalies and #36 for notional change, with depth confirmation too. 24h trading volume is still only a little over 18M, so liquidity is thin; if it attracts attention, the price could move sharply. I’m personally watching to see whether it can hold this level. Don’t chase—watch for a pullback and confirmation.
$MORPHO is looking interesting. 15m volume is up 2.37x, price is +0.55%, and OI has been gradually rising over the past hour (+0.81%). New leveraged longs are coming in, so this isn’t a fake pump caused by shorts covering. Aggressive trade delta is +16.1%, the buy/sell ratio is 1.38, and the close is above the top of the recent 20-candle 5m range—a genuine structural breakout. It ranks #12 for anomalies and #36 for notional change, with depth confirmation too. 24h trading volume is still only a little over 18M, so liquidity is thin; if it attracts attention, the price could move sharply. I’m personally watching to see whether it can hold this level. Don’t chase—watch for a pullback and confirmation.
1
·
--
$CHIP This 15m rally is accompanied by rising volume, with trading volume up 3.35x and OI also increasing in tandem—clear signs of new leveraged longs entering. Price has just broken above the highs of the past 20 or so 5m candles. The active buy-sell imbalance is 13.7%, indicating a fairly decisive buying bias.
Although changes in notional value and the abnormality percentile aren’t extreme, the full-pool abnormality ranking of #12 indicates relatively strong performance. The biggest risk with this setup is a false breakout without OI following through. There’s no divergence so far, so watch whether price can hold above the range.
$CHIP This 15m rally is accompanied by rising volume, with trading volume up 3.35x and OI also increasing in tandem—clear signs of new leveraged longs entering. Price has just broken above the highs of the past 20 or so 5m candles. The active buy-sell imbalance is 13.7%, indicating a fairly decisive buying bias.
Although changes in notional value and the abnormality percentile aren’t extreme, the full-pool abnormality ranking of #12 indicates relatively strong performance. The biggest risk with this setup is a false breakout without OI following through. There’s no divergence so far, so watch whether price can hold above the range.
Although changes in notional value and the abnormality percentile aren’t extreme, the full-pool abnormality ranking of #12 indicates relatively strong performance. The biggest risk with this setup is a false breakout without OI following through. There’s no divergence so far, so watch whether price can hold above the range.
13
Log in to explore more content
Join global crypto users on Binance Square
⚡️ Get latest and useful information about crypto.
💬 Trusted by the world’s largest crypto exchange.
👍 Discover real insights from verified creators.
Email / Phone number
Trending Topics
1
#BinancePick
3M views
152,263 Discussing
2
#EarningsSeason
5.3M views
25,868 Discussing
3
#AnthropicTTMRevenueGrewAbout1200%
24,259 views
366 Discussing
4
#AnthropicS1ExpectedToday
23,745 views
312 Discussing
5
#SouthKoreaReportedlyWeighsFourthCryptoTaxDelay
28,122 views
435 Discussing
6
#FranklinTempletonFilesForTwoDividendToBitcoinETFs
36,936 views
519 Discussing
7
#StrategyMSTRSurpassesNasdaqInMarketCap
27,810 views
375 Discussing
8
#CanadaProposesStablecoinRedemptionWithin3BusinessDays
1,260 views
36 Discussing
9
#ElectrumWalletBugLetRogueServersStealFunds
29,543 views
454 Discussing
10
#ArgentineCourtDismissesLIBRACaseAgainstMilei
44,460 views
560 Discussing