

#106
106
3,008 views
41 Discussing
Hot
Latest

·
--
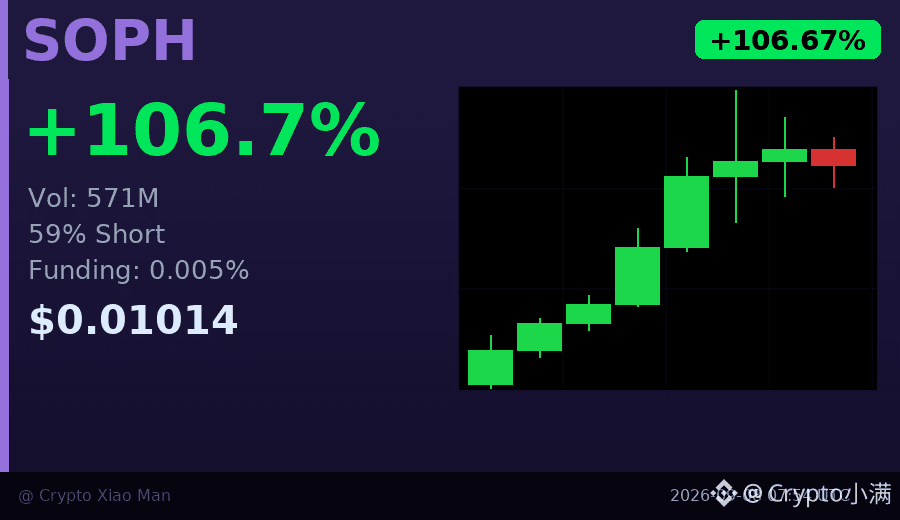
A day has already doubled and then some, but most people are still short.
In the past 24 hours, SOPH surged 106% and trading volume hit 570 million USDT. What’s interesting is that now 59% of positions are shorts—when the price is up like this, most people are still betting on a pullback.
Within 8 hours, the trend continued to strengthen, rising from 0.0046 to 0.0117. Although it has since pulled back to 0.0101, the buy pressure clearly hasn’t faded. This kind of setup—"prices are pumping hard, but there are lots of shorts"—often means the shorts haven’t conceded yet, and there may be more short-squeezing ahead.
Of course, since the short-term move is too large, volatility will be intense. The key is whether support around 0.0095 can hold.
$SOPH #逼空行情 #106%
Click the small card below to quickly check the market situation 👇
29

·
--
💎 BINANCE GEMS | EARLY SPOT WATCH
Signal #106 · $EPIC
Score: 48/100 | EARLY ENTRY
I've got $EPIC on my radar because the setup may still be developing, rather than being a move I'd want to chase after a big candle.
Volume activity is one of the main things supporting this watch. There appears to be about 15.1% of room to the nearby resistance reference.
Price reference: $0.1375
24h change: +7.7% · 24h volume: $1.12M
Risk reference — SL: $0.12352857
Potential TP1: $0.15147143
Potential TP2: $0.15845714
Potential TP3: $0.16544286
My plan: no chasing. I want the setup to hold, volume to stay healthy, and resistance to clear cleanly. If those conditions fail, I skip it.
This is a spot-market watchlist idea, not a guaranteed result. Manage risk and confirm the live chart before acting.
#BinanceGems #SpotTrading $EPIC
2

·
--
Partly True
【Binance Spot 4h Top 3 Gainers】
1 $BMT BMT/USDT | Price 0.04224U | 24h trading volume 31.34M U
Bubblemaps turns on-chain addresses into bubble maps, making it easy to see which wallets belong to the same group. It’s often used to check whether insiders are controlling a new token. It’s in the on-chain data visualization sector, and V2 supports cross-chain wallet cluster tracking and historical playback.
Latest update: On October 24 at 11:00, Upbit opened BMT/KRW trading. Deposits and withdrawals use the Solana network.
Total supply 1B | Market cap 31.51M U | Rank #625
4h【+84.67%】| 24h +42.94% | 7d +144.16%
Momentum watch: Trading volume over these 4 hours was 20.22M U, 3.95x the average 4h volume. The candle closed at 65.9% of its high-low range. The current price is 17.88% below the 24h high, and the previous 4h candle gained 2.64%.
2 $ERA ERA/USDT | Price 0.0884U | 24h trading volume 18.38M U
Caldera lets project teams launch their own chain in minutes without building the underlying infrastructure from scratch, then uses Metalayer to bring multiple chains together through a single cross-chain entry point. It’s in the Rollup infrastructure (RaaS) sector, focused on interoperability between chains.
Latest update: Metalayer Token Launcher launched in April, enabling cross-chain token launches without code. No new announcements since then.
Total supply 1B | Market cap 15.4M U | Rank #964
4h【+14.55%】| 24h +29.62% | 7d +49.58%
Momentum watch: Trading volume over these 4 hours was 7.2M U, 2.36x the average 4h volume. The candle closed at 52.9% of its range. The current price is 9.80% below the 24h high, and the previous 4h candle gained 6.13%.
3 $TIA TIA/USDT | Price 0.5485U | 24h trading volume 9.45M U
Celestia is a blockchain that sells Rollups “space to store data.” Storing transaction data there is much cheaper than writing it directly to Ethereum. It’s a data availability (DA) layer in the modular blockchain sector, with TIA serving as both gas and a staking token.
Latest update: The V9 mainnet upgrade is complete, with 3-second block times and a 32 MiB block capacity. In June, inflation was reduced from around 7.2% to around 5.0%.
Total supply 1.18B | Market cap 541M U | Rank #106
4h【+2.19%】| 24h -2.68% | 7d -26.89%
Momentum watch: Trading volume over these 4 hours was 3.62M U, 2.31x the average 4h volume. The candle closed at 60.3% of its range. The current price is 2.95% below the 24h high, and the previous 4h candle fell 0.79%.
Summary: BMT was the strongest gainer at +84.67%, but also gave back the most from its 24h high at 17.88%. ERA gained 14.55% and pulled back 9.80%. TIA gained just 2.19% and is still negative over 24h—the one that has only just turned green.
Which coin have you been watching over these four hours?
Not investment advice. DYOR.
1
1
674


·
--
I’m watching the CoinGecko trending list and Solana (SOL) is up +3.5% today 🚀, while Hyperliquid (HYPE) jumped +7.2% and Quack AI (Q) nudged +2.1%.
I’ve also seen NEAR Protocol (NEAR) climb +4.8%, Canton (CC) rise +5.0% and Ondo (ONDO) gain +3.9% 🔥.
My takeaway? These seven tokens span ranks from #7 to #106, and the momentum suggests more upside 🌟. I’ll keep an eye on them.
$AVA, $GTC, $Q
I’m watching the CoinGecko trending list and Solana (SOL) is up +3.5% today 🚀, while Hyperliquid (HYPE) jumped +7.2% and Quack AI (Q) nudged +2.1%.
I’ve also seen NEAR Protocol (NEAR) climb +4.8%, Canton (CC) rise +5.0% and Ondo (ONDO) gain +3.9% 🔥.
My takeaway? These seven tokens span ranks from #7 to #106, and the momentum suggests more upside 🌟. I’ll keep an eye on them.
$AVA , $GTC , $Q
I’ve also seen NEAR Protocol (NEAR) climb +4.8%, Canton (CC) rise +5.0% and Ondo (ONDO) gain +3.9% 🔥.
My takeaway? These seven tokens span ranks from #7 to #106, and the momentum suggests more upside 🌟. I’ll keep an eye on them.
$AVA , $GTC , $Q
821

·
--
Starknet is asking STRK holders to vote on whether to study breaking away from Ethereum and becoming an independent L1, because it doesn’t want to be tied to Ethereum’s quantum-security upgrade timeline. This is the first major L2 to put “leaving Ethereum” up for a vote. I’ve been following this for a while, and I still did a double take when I saw the news.
Quantum risk is a real issue, but voting on it at this point in October 2026 says more about the timing than the rationale. Ethereum is down 5.4% over 24h, BTC is down 2.7%, and nearly $1 billion in leveraged positions have been liquidated across the market, with ETH accounting for almost 60%. ZK is up 8.1% against the trend, with $20 million in trading volume. L2s’ distrust of Ethereum’s upgrade roadmap arrived earlier than quantum computers.
STRK is up only 1.4% over 24h, ranked #106 by market cap. The market hasn’t priced in this narrative at all.
$STRK $ETH $ZK

442

·
--
Unusual KAIA Spot-Futures Spread! A Sign of Arbitrage Capital Moving In?20:24 (12 minutes ago): KAIA surged 5.3% intraday. As of 20:37:16, its current price is 0.05233, up 37.2% in 24h. Other assets with unusual moves in the same batch include RLC and MAGIC.
📅 Data as of 20:37:16 (event trigger times are shown for each item; prices are real-time snapshots at the time of writing)
📌 In a nutshell: The spot-futures spread has widened, and arbitrage capital may be moving in
Market overview: BTC 83,095.60 (+0.94%) · ETH 2,498.88 (-1.25%); across the market, 139 assets rose and 353 fell in 24h; top gainer: US +100.51%, top loser: CT -14.28%.
—— Details of Unusual Moves ——
I. Sharp 5-Minute Moves
Unusual KAIA Spot-Futures Spread! A Sign of Arbitrage Capital Moving In?
20:24 (12 minutes ago): KAIA surged 5.3% intraday. As of 20:37:16, its current price is 0.05233, up 37.2% in 24h. Other assets with unusual moves in the same batch include RLC and MAGIC.
📅 Data as of 20:37:16 (event trigger times are shown for each item; prices are real-time snapshots at the time of writing)
📌 In a nutshell: The spot-futures spread has widened, and arbitrage capital may be moving in
Market overview: BTC 83,095.60 (+0.94%) · ETH 2,498.88 (-1.25%); across the market, 139 assets rose and 353 fell in 24h; top gainer: US +100.51%, top loser: CT -14.28%.
—— Details of Unusual Moves ——
I. Sharp 5-Minute Moves
10

·
--
$FET makes the trending list as market sentiment turns bullish
Artificial Superintelligence Alliance ($FET) appeared on CoinGecko’s Trending list today, ranking #106. Overall market sentiment is Greed (70/100).
① Is the breakout confirmed, or is it a false breakout?
② After the high-volume breakout, how high do you think the first resistance level could be?
③ How does the price-volume relationship on the breakout day differ from last time?
Data source: CoinGecko / Binance
#FET
$FET makes the trending list as market sentiment turns bullish
Artificial Superintelligence Alliance ($FET ) appeared on CoinGecko’s Trending list today, ranking #106. Overall market sentiment is Greed (70/100).
① Is the breakout confirmed, or is it a false breakout?
② After the high-volume breakout, how high do you think the first resistance level could be?
③ How does the price-volume relationship on the breakout day differ from last time?
Data source: CoinGecko / Binance
#FET
73

·
--
The most eye-catching thing about $TRUMP is not the -97.08% distance from ATH, but its turnover rate. A 24h trading volume of 229 million on a 600 million market cap means that about 40% of the float changed hands in a single day. A meme token that is close to zero, by rights, should be deserted, but instead it lives as if the story has not yet finished.
This divergence points to two explanations.
First: someone is indeed slowly accumulating in the $2.0-2.2 range, absorbing weak hands. The intraday decline is limited, and whenever it drops to $2.03 someone buys it back. The volume is hidden inside a narrow range to build a position. If you lean toward this view, you need to see it break above $2.4 on volume, and then stay above 2.4 for at least three days, with any pullback not breaking 2.3.
Second: some funds are using wash trading to keep the market active and prevent it from being completely forgotten. Every time it rises, it gets pushed back down around $2.15. The volume looks impressive, but the price is really just going in circles. The 30-day -2.6% performance is exactly the kind of readout this kind of market produces: price barely moves, while volume is just self-amusement.
These two judgments call for completely different response plans, but the real commonality is this: $2.15 is the router level. If it holds and total volume can be maintained, the first scenario is more likely. If it breaks below $1.95 and returns to that range, there is no need to rush, and you will not suffer losses.
The person in the middle is not a miner — a meme coin ranked #106 by market cap, yet still -97% from ATH, does not have a strong logic of buying dips on losses, and the emergence of a healing narrative can basically be ignored. At this position, it is precisely necessary to redefine its relationship with the main capital; that is the core issue.
Which one do you want to choose? And which signal do you want to wait for before acting?
44
·
--
PONS Suddenly Plunges 7.0% in 5 Minutes! Panic or Opportunity? Check Support Levels Fast07:37 (22 minutes ago) PONS saw a 7.0% drop within 5 minutes (5-minute window 07:32→07:37). As of 08:00:12, the current price is 0.5037, with a 24h change of -7.2%. Other movers in the same batch include Lobster.
📅 Data as of 08:00:12 (event trigger time is noted on each item; prices are real-time snapshots at the time of writing)
📌 One-line takeaway: Short-term momentum is concentrated—pullbacks often come quickly, too; staggered limit orders are steadier than chasing the price higher.
Market Overview: BTC 83,617.10 (+0.14%) · ETH 2,676.44 (-0.43%); Across the whole market, 223 up and 269 down over the past 24h; Top gainer over the past 24h: SOON (+33.49%), top decliner: US- (-44.73%).
PONS Suddenly Plunges 7.0% in 5 Minutes! Panic or Opportunity? Check Support Levels Fast
07:37 (22 minutes ago) PONS saw a 7.0% drop within 5 minutes (5-minute window 07:32→07:37). As of 08:00:12, the current price is 0.5037, with a 24h change of -7.2%. Other movers in the same batch include Lobster.
📅 Data as of 08:00:12 (event trigger time is noted on each item; prices are real-time snapshots at the time of writing)
📌 One-line takeaway: Short-term momentum is concentrated—pullbacks often come quickly, too; staggered limit orders are steadier than chasing the price higher.
Market Overview: BTC 83,617.10 (+0.14%) · ETH 2,676.44 (-0.43%); Across the whole market, 223 up and 269 down over the past 24h; Top gainer over the past 24h: SOON (+33.49%), top decliner: US- (-44.73%).
236

·
--
** How to Do Technical Analysis: A Step-by-Step Guide for Crypto InvestorsOfficial Trump (TRUMPUSDT) is trending right now!
Rank: #106
** Hello Binance Square family! 📊 Today, we’re going to start learning the fundamental technical analysis skills needed to be a successful investor in the crypto market. Technical analysis helps you estimate future prices by examining market trends and price movements. Now, let’s learn step by step how to do technical analysis! 🎯 ### Step 1: Choose the Chart Type The first step is choosing the right chart type. The most commonly used chart types are: - **Line Chart**: Shows the closing values of the price over a specific period by connecting them. - **Candlestick Chart**: Also known as Japanese candlestick charts; it shows the opening, closing, high, and low prices for each time interval. **Example:** Let’s look at the candlestick chart for the last 24 hours for the price. 📊 ### Step 2: Identify Trends Trends determine the direction of the market. There are three types of trends: - **Uptrends**: The price keeps rising. - **Downtrends**: The price keeps falling. - **Sideways Trends**: The price moves within a certain range. **Example:** The current price is 83,000.77 $ and it shows a change of %-1.07 over the last 24 hours. This indicates a minor downtrend. 📉 ### Step 3: Determine Support and Resistance Levels Support levels are the points where the price stops falling. Resistance levels are the points that prevent the price from rising. **Example:** the price is at 2,670.40 $. If this level is a support level, then the price
** How to Do Technical Analysis: A Step-by-Step Guide for Crypto Investors
Official Trump (TRUMPUSDT) is trending right now!
Rank: #106
** Hello Binance Square family! 📊 Today, we’re going to start learning the fundamental technical analysis skills needed to be a successful investor in the crypto market. Technical analysis helps you estimate future prices by examining market trends and price movements. Now, let’s learn step by step how to do technical analysis! 🎯 ### Step 1: Choose the Chart Type The first step is choosing the right chart type. The most commonly used chart types are: - **Line Chart**: Shows the closing values of the price over a specific period by connecting them. - **Candlestick Chart**: Also known as Japanese candlestick charts; it shows the opening, closing, high, and low prices for each time interval. **Example:** Let’s look at the candlestick chart for the last 24 hours for the price. 📊 ### Step 2: Identify Trends Trends determine the direction of the market. There are three types of trends: - **Uptrends**: The price keeps rising. - **Downtrends**: The price keeps falling. - **Sideways Trends**: The price moves within a certain range. **Example:** The current price is 83,000.77 $ and it shows a change of %-1.07 over the last 24 hours. This indicates a minor downtrend. 📉 ### Step 3: Determine Support and Resistance Levels Support levels are the points where the price stops falling. Resistance levels are the points that prevent the price from rising. **Example:** the price is at 2,670.40 $. If this level is a support level, then the price
16
·
--
Crypto Market UpdateOfficial Trump (TRUMPUSDT) is trending right now!
Rank: #106
🚨 MARKET MOVES: BTC Dips Below 3,500! BTC today down **1.13%** to 3,453, while holds steady with a **0.11%** gain to ,689. I'm keeping an eye on these levels - will BTC bounce back or continue its slide? 🤔 Personally, I think this dip is a buying opportunity, but we need to see a strong reversal to confirm. What's your take? Are you ape-ing in or staying cautious?
#bitcoin #ethereum #crypto
Crypto Market Update
Official Trump (TRUMPUSDT) is trending right now!
Rank: #106
🚨 MARKET MOVES: BTC Dips Below 3,500! BTC today down **1.13%** to 3,453, while holds steady with a **0.11%** gain to ,689. I'm keeping an eye on these levels - will BTC bounce back or continue its slide? 🤔 Personally, I think this dip is a buying opportunity, but we need to see a strong reversal to confirm. What's your take? Are you ape-ing in or staying cautious?
#bitcoin #ethereum #crypto
51
·
--
** “LINK %10+ Bomb! Now, will and ’s hold onto this wave?”Official Trump (TRUMPUSDT) is trending right now!
Rank: #106
** Shock? In the past 24 hours, the **Chainlink ()** price jumped to the 5.63 level and captured a **+10.77%** gain. This is supported by a **29.7M** trading volume in the last 24 hours—meaning the “pump” isn’t just a meme, but an influx of real buyers. 🚀 I’ve got two big questions on my radar: 1️⃣ and are they still “safe haven,” or do we get swept into this “altcoin rally” and steer toward ****-type projects like ****? 2️⃣ Among falling altcoins, **** (%‑10.55) and **** (%‑9.92) are standing out. ’s drop to the .824 level is a sign of liquidity being drained; at the same time, **** still has a high **29.6M** volume over the past 24 hours, so there’s potential for a rebound after the “dump.” Other losing charts: **** (‑8.45%), **** (‑7.46%), and **** (‑3.61%). Especially, is trading around the .734 level and is looking for a “reversal” signal with .9M volume. While many traders view “ATOM” as “rekt,” I think **** is still technically in a “support” zone and could be the next “buy-the-dip” opportunity. On the other hand, **** is down **‑3.15%** at 18.82, but it’s still pulling liquidity with **00.9M** trading volume within 24 hours. This is a classic “volume-price divergence” and a typical “bull trap” signal. My “alpha” call: **ape in** on **** from the current 5.63 level to **7.00**, because the **14–15** “order-block” has been broken, and the next resistance is 7.50. At the same time, **** and **
** “LINK %10+ Bomb! Now, will and ’s hold onto this wave?”
Official Trump (TRUMPUSDT) is trending right now!
Rank: #106
** Shock? In the past 24 hours, the **Chainlink ()** price jumped to the 5.63 level and captured a **+10.77%** gain. This is supported by a **29.7M** trading volume in the last 24 hours—meaning the “pump” isn’t just a meme, but an influx of real buyers. 🚀 I’ve got two big questions on my radar: 1️⃣ and are they still “safe haven,” or do we get swept into this “altcoin rally” and steer toward ****-type projects like ****? 2️⃣ Among falling altcoins, **** (%‑10.55) and **** (%‑9.92) are standing out. ’s drop to the .824 level is a sign of liquidity being drained; at the same time, **** still has a high **29.6M** volume over the past 24 hours, so there’s potential for a rebound after the “dump.” Other losing charts: **** (‑8.45%), **** (‑7.46%), and **** (‑3.61%). Especially, is trading around the .734 level and is looking for a “reversal” signal with .9M volume. While many traders view “ATOM” as “rekt,” I think **** is still technically in a “support” zone and could be the next “buy-the-dip” opportunity. On the other hand, **** is down **‑3.15%** at 18.82, but it’s still pulling liquidity with **00.9M** trading volume within 24 hours. This is a classic “volume-price divergence” and a typical “bull trap” signal. My “alpha” call: **ape in** on **** from the current 5.63 level to **7.00**, because the **14–15** “order-block” has been broken, and the next resistance is 7.50. At the same time, **** and **
22
·
--
When the price breaks below a key support line, it’s often the moment when panic sellers and smart money narrowly miss each other.
Take a look at the recent $VVV: over the past 30 days it has been in a steady downtrend, falling more than 37%, and it’s already been cut in half from its ATH. It’s now hovering around $10.48 in search of support. As an exchange token nearing the top 100 by market cap (#106), it once delivered a staggering +285% performance over a one-year run—but right now it’s going through a brutal phase of profit-taking liquidation.
This kind of move isn’t unusual in the cycle. After a high-volume sell-off around mid-June that totaled 140 million USD, the bulls failed to organize an effective counterattack. The recent liquidity of roughly 40 million suggests that buyers are still watching and waiting. When it’s listed on top-tier exchange contracts, liquidity is plentiful—but it also gives shorts a natural channel to vent, and early alpha is being repriced by the market.
Risk is also laid bare here: the tolerance for “catching the falling knife” on the left side is extremely low. If buying volume doesn’t pick up afterward, and the current price breaks below the $10 psychological level, it will most likely test even deeper demand zones. Never blindly bottom-fish just because “it’s been cut in half.” A trend bottom requires confirmation under the right conditions.
Only when liquidity ebbs can you see the true thickness of the buy orders. 📉 Do you think this deep pullback—$VVV —is long-term capital pulling over to pick someone up, or just a long, bearish leg in the middle of the downtrend?
When the price breaks below a key support line, it’s often the moment when panic sellers and smart money narrowly miss each other.
Take a look at the recent $VVV : over the past 30 days it has been in a steady downtrend, falling more than 37%, and it’s already been cut in half from its ATH. It’s now hovering around $10.48 in search of support. As an exchange token nearing the top 100 by market cap (#106), it once delivered a staggering +285% performance over a one-year run—but right now it’s going through a brutal phase of profit-taking liquidation.
This kind of move isn’t unusual in the cycle. After a high-volume sell-off around mid-June that totaled 140 million USD, the bulls failed to organize an effective counterattack. The recent liquidity of roughly 40 million suggests that buyers are still watching and waiting. When it’s listed on top-tier exchange contracts, liquidity is plentiful—but it also gives shorts a natural channel to vent, and early alpha is being repriced by the market.
Risk is also laid bare here: the tolerance for “catching the falling knife” on the left side is extremely low. If buying volume doesn’t pick up afterward, and the current price breaks below the $10 psychological level, it will most likely test even deeper demand zones. Never blindly bottom-fish just because “it’s been cut in half.” A trend bottom requires confirmation under the right conditions.
Only when liquidity ebbs can you see the true thickness of the buy orders. 📉 Do you think this deep pullback—$VVV —is long-term capital pulling over to pick someone up, or just a long, bearish leg in the middle of the downtrend?
76

What if Binance’s move to add 10 bStocks tokenized securities as collateral assets isn’t just about expanding options - but about preparing the market for a new kind of financial hybrid?
Binance’s decision to include tokenized securities from bStocks as collateral assets - effective this summer - suggests a shift in how traditional finance is being integrated into crypto markets.
The addition of these assets on both spot and futures trading platforms is not just a technical update; it reflects a growing appetite from institutional players to use crypto as a vehicle for real-world financial instruments.
Could the influx of institutional validation be the turning point for TradFi-backed tokens?
—
Not financial advice. DYOR.
📌 News Take · #106 · #CryptoNews #CryptoSighted
134

·
--
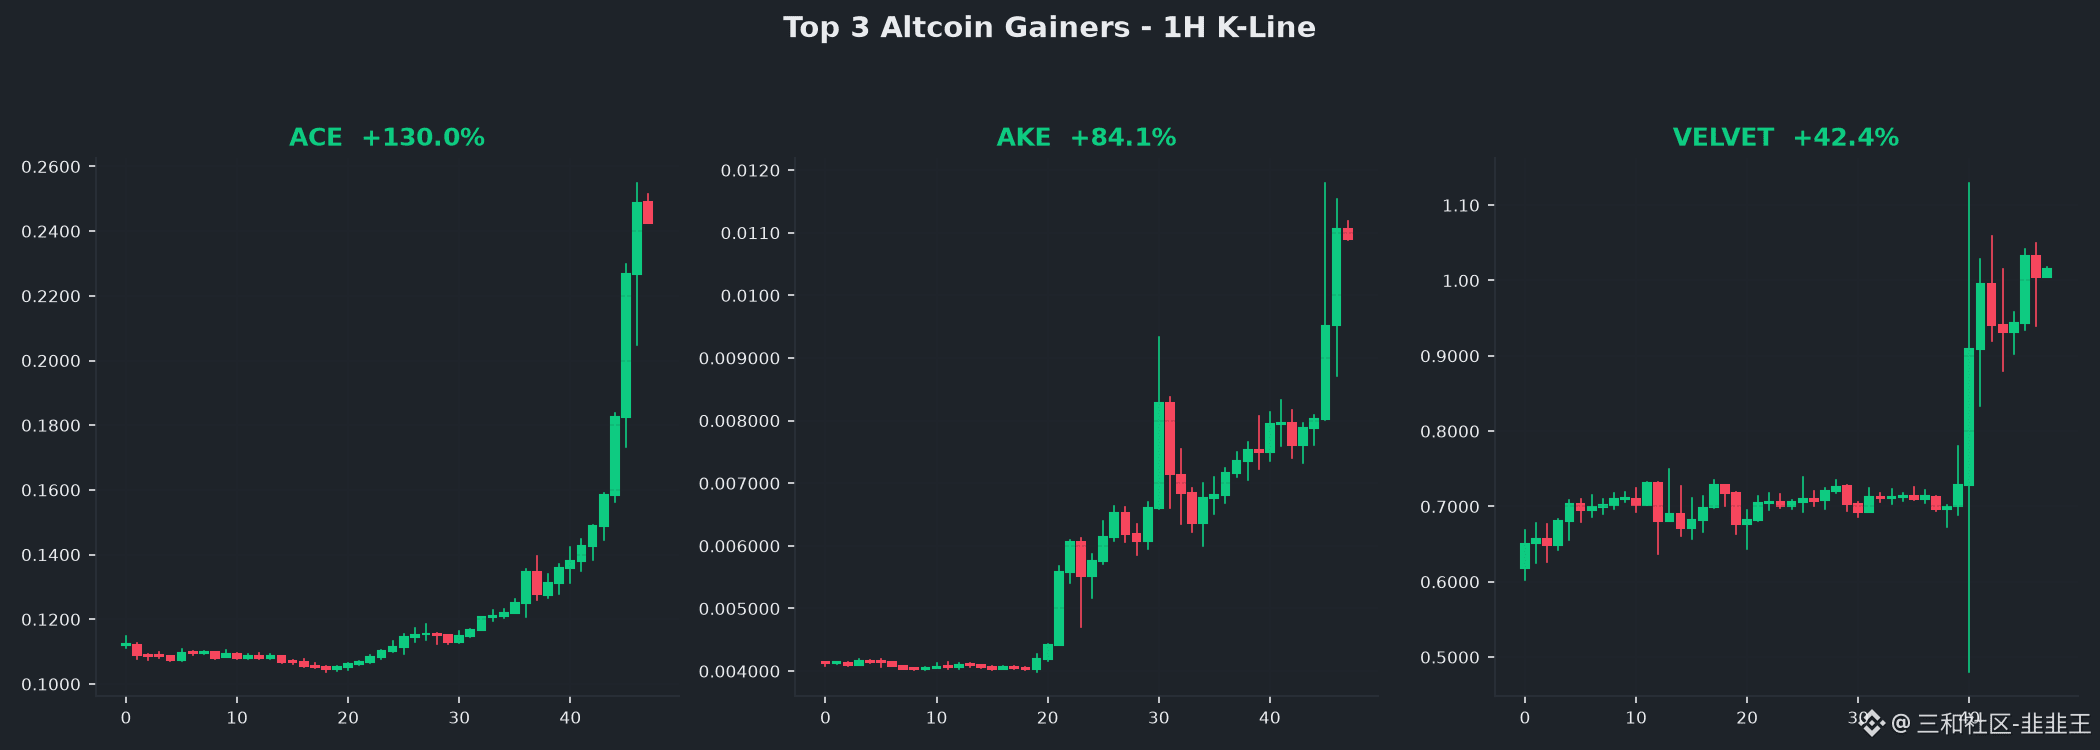
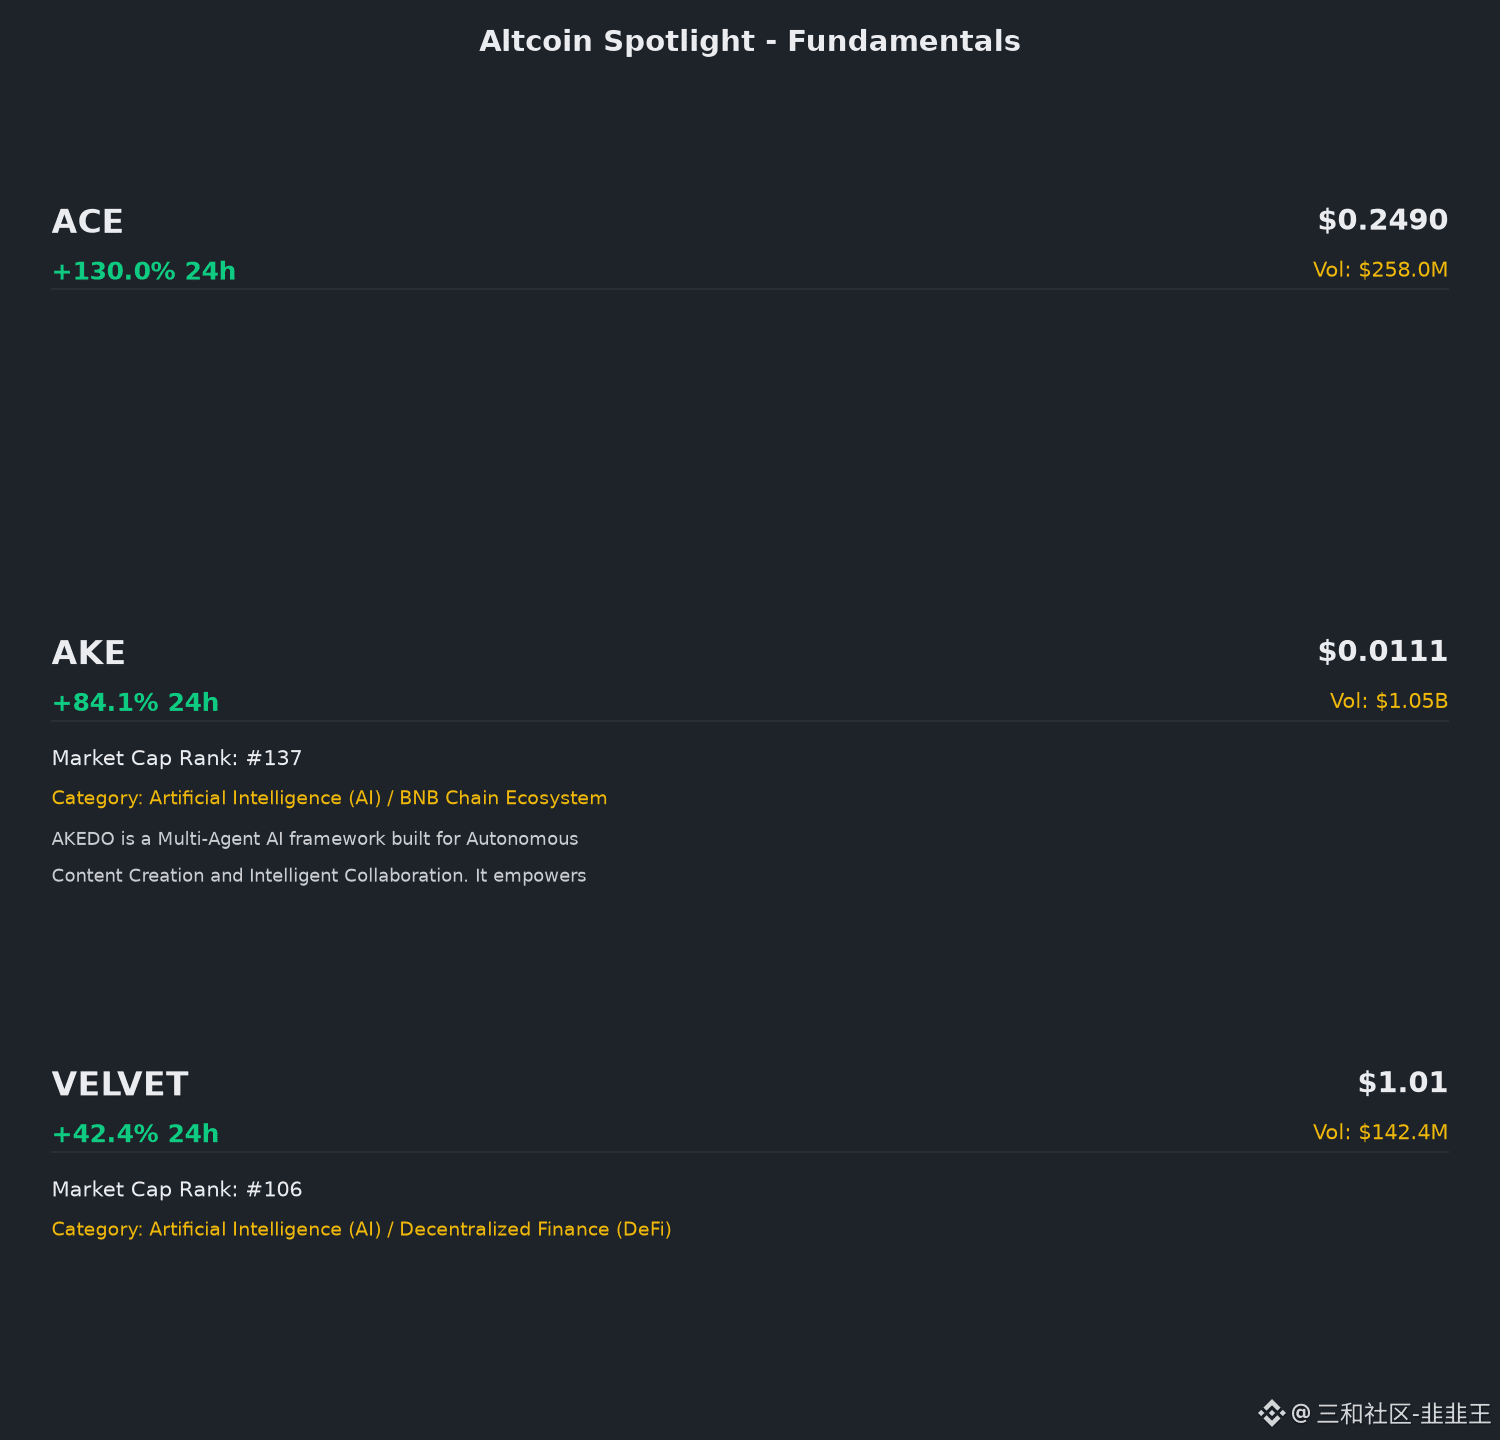
ACE soars directly by +130.0% — this kind of market only comes around a few times a year. Let’s take a look at what happened.
🥇 Champion: ACE
ACE led the pack among low-cap altcoins today with a +130.0% gain, with trading volume of 258.0M USDT.
Current price: $0.2490 | 24H volume: 258.0M
📊 Technical analysis:
- Trend: Strong uptrend; MA7 is above MA25, bullish alignment
- RSI(14): 91.1 (overbought zone — watch for pullback risk)
- Support levels: $0.1207 / $0.1094
- Resistance levels: $0.2550 / $0.2550
💡 Trading suggestions:
- Entry zone: $0.1871 - $0.1987 (suggest waiting for a pullback near MA7 before entering)
- Stop-loss: $0.1775 (about -8.0%)
- Take-profit 1 (conservative): $0.2161 (+12.0%, risk/reward 1.5:1)
- Take-profit 2 (aggressive): $0.2809 (+45.6%, risk/reward 3:1)
⚠️ The above is for technical analysis reference only and does not constitute investment advice. Coins with already large gains have high pullback risk—manage position size tightly.
🥈 Runner-up: AKE
#2 on the gainers list: AKE, +84.1%, volume 1.05B.
Current price: $0.0111 | 24H volume: 1.05B
Market cap rank: #137 | Track: Artificial Intelligence (AI), BNB Chain Ecosystem
📊 Technical analysis:
- Trend: Strong uptrend; MA7 is above MA25, bullish alignment
- RSI(14): 90.5 (overbought zone — watch for pullback risk)
- Support levels: $0.006684 / $0.005160
- Resistance levels: $0.0118 / $0.0118
💡 Trading suggestions:
- Entry zone: $0.008723 - $0.009263 (suggest waiting for a pullback near MA7 before entering)
- Stop-loss: $0.008273 (about -8.0%)
- Take-profit 1 (conservative): $0.0101 (+12.0%, risk/reward 1.5:1)
- Take-profit 2 (aggressive): $0.0131 (+45.6%, risk/reward 3:1)
⚠️ The above is for technical analysis reference only and does not constitute investment advice. Coins with already large gains have high pullback risk—manage position size tightly.
📝 Project overview: AKEDO is a Multi-Agent AI framework built for Autonomous Content Creation and Intelligent Collaboration. It empowers cre...
🥉 Third place: VELVET
#3: VELVET, +42.4%, volume 142.4M.
Current price: $1.01 | 24H volume: 142.4M
Market cap rank: #106 | Track: Artificial Intelligence (AI), Decentralized Finance (DeFi)
📊 Technical analysis:
- Trend: Strong uptrend; MA7 is above MA25, bullish alignment
- RSI(14): 78.7 (overbought zone — watch for pullback risk)
- Support levels: $0.4805 / $0.4805
- Resistance levels: $1.13 / $1.13
💡 Trading suggestions:
- Entry zone: $0.9510 - $1.01 (suggest waiting for a pullback near MA7 before entering)
- Stop-loss: $0.9020 (about -8.0%)
- Take-profit 1 (conservative): $1.10 (+12.0%, risk/reward 1.5:1)
- Take-profit 2 (aggressive): $1.43 (+45.6%, risk/reward 3:1)
⚠️ The above is for technical analysis reference only and does not constitute investment advice. Coins with already large gains have high pullback risk—manage position size tightly.
📂 Today’s trending sectors: AI Applications, Decentralized Finance (DeFi), Artificial Intelligence (AI), BNB Chain Ecosystem
For the top gainers today: if their fundamentals have support, you can watch them for the mid-to-long term; if it’s only capital-driven, take profit when you can.
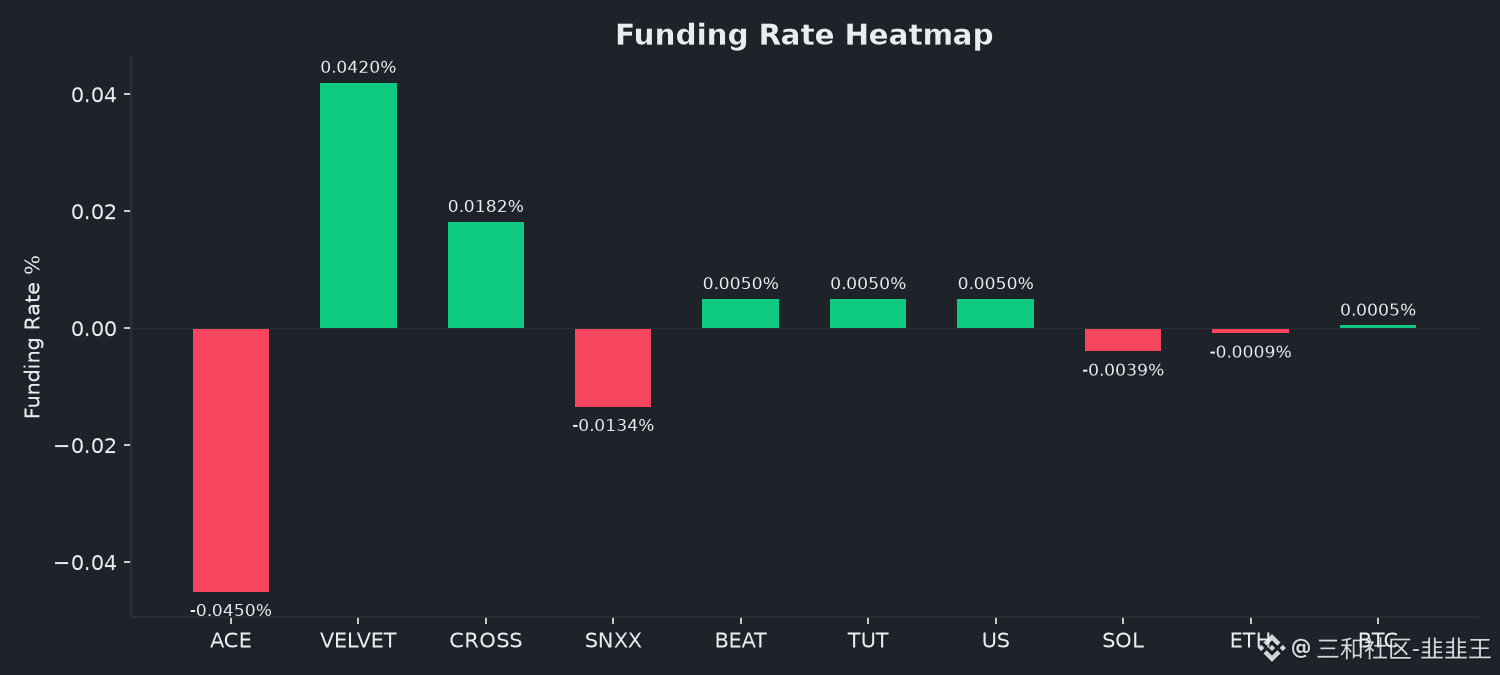
💰 Funding rate quick glance:
Average funding rate +0.0012%, longs and shorts are basically balanced.
ACE: -0.0450% (slightly bearish (possible short squeeze))
VELVET: +0.0420% (hot)
CROSS: +0.0182% (hot)
BTC: +0.0005% (normal slightly bullish)
SOL: -0.0039% (normal slightly bearish)
📊 Coins to watch:
ACE: https://www.binance.com/futures/ACEUSDT
AKE: https://www.binance.com/futures/AKEUSDT
VELVET: https://www.binance.com/futures/VELVETUSDT
#ACE #AKE #VELVET
357
·
--
Liquidity has rotated several rounds within the meme sector. $PENGU hasn’t been forgotten, but it hasn’t been repriced either. Over the past 30 days, the price has only moved 7%, yet trading volume has repeatedly surged to 70–80M before falling back to 35M. With a market cap near 400M and a rank of #106, it still sits 90% below its ATH.
This volume-price structure looks more like slow chip rotation than a trend breakout. When volume picked up in late July, the price didn’t break through. On August 10 it closed above 0.0065, but the volume didn’t follow through—today it’s back to 0.0062. There are funds accumulating below 0.006, but no one wants to proactively push the price higher because the overhead trapped-supply is too heavy.
$PENGU ’s narrative sits in the middle ground: it has an IP and a consumer brand, but it doesn’t behave like a pure meme that can easily “take off” on emotion. This zone needs confirmation that trading volume can stay above 50M for several consecutive days, while holding 0.0063. If it breaks below 0.0057, it looks more like liquidity is being borrowed and then leaving.
What I care about most is whether, within this rotating move, there are new clues changing $PENGU ’s positioning—such as changes in whale addresses, a new合作方, or capital flowing back from the NFT sector. If you see anything on-chain or on an exchange, feel free to add it.
75

·
--
Contract Quant Brief #106 | The pullback is still ongoing, but I’d rather wait for a retracement to confirm
Market situation:
Today is still a continuation session. The overall tone is bullish, but it’s not the kind of strength you can blindly chase. DEXEUSDT is trading right along the 20-day moving average. EVAAUSDT is surging faster. VIRTUALUSDT is also strong, but it’s farther away from the moving average. My focus is whether it can still hold after a retracement, not whether to hard-chase the extension.
Top candidates:
1)DEXEUSDT
This one feels more like a comfortable retracement entry within a trend. Current price is 35.07, it’s very close to the 20-day line, funding rates aren’t high, and the recent one-hour position change isn’t that dramatic—suggesting it’s not just random, emotion-driven buying.
Observation zone: 34.8-35.2
Trigger: After the retracement, it holds above the 20-day line and then reclaims and stays above 35.3, while volume continues to expand—then we’ll see if this is a second continuation.
Invalidation: If it breaks below 34.5 and fails to pull back up for a while, it means the momentum is starting to loosen.
I’ll take a closer look first; the entry is more comfortable than chasing the high.
2)EVAAUSDT
This one is more like “runs fast, but shakes more easily.” The 6-hour increase is already large. In the last hour it’s still pushing higher, but the position change is starting to ease off. That suggests there are plenty of people chasing on the short-term rally, but the follow-through may not be keeping pace.
Observation zone: 2.38-2.42
Trigger: After the retracement, it doesn’t break and then reclaims the ~2.50 area. Then we’ll watch to see if it accelerates again for a second push.
Invalidation: If it falls back below 2.30, short-term strength can easily turn into high-level consolidation.
I don’t want to hard-chase this one either—I’d rather wait for it to give you the position.
Watchlist / Not chasing for now:
VIRTUALUSDT is also strong, but it’s farther from the moving average. It’s the type where “strong remains strong,” but the volatility is larger when you chase—so I’ll just keep it under observation for now and won’t elaborate.
Risk warning:
Today is more suitable for waiting for confirmation; it’s not suitable for chasing just because you see red. If it’s truly strong, it will still offer opportunities after the retracement. If it’s fake strength, once it spikes, it’s easy to give back gains.
776
We are entering a new phase of institutional-grade trading on Binance, said Binance in a recent statement.
Binance has been accelerating its expansion in 2026, launching multiple USDⓈ-Margined TradFi perpetual contracts and adding new bStocks trading pairs. These developments are part of a broader strategy to enhance product offerings and attract institutional participants.
What might happen if this pace of innovation continues for the next year?
—
For educational purposes only. Not financial advice.
📌 Crypto 101 · #106 · #CryptoEducation #CryptoSighted

1
69

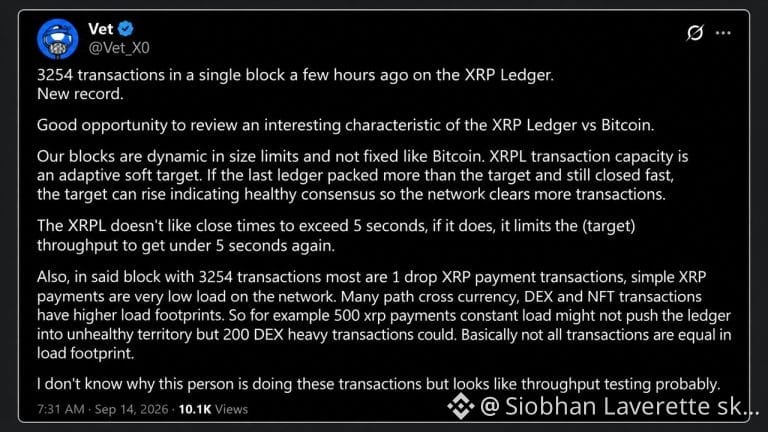
XRP Ledger transaction volume hits a record—why do the numbers “made” by just 20 wallets hide a concern?
The number of transactions per single XRP Ledger transaction record has broken a historical record, but most of it is volume generated by 20 wallets, which is artificial heat for the short-term coin price.
According to Bitcoin.com, on September 13 the XRP Ledger block #106,965,249 packed 3,254 transactions, setting a new all-time high. But when you break it down, it exposes the trick: about 2,000 of them are completely identical “1 drop” payments (the smallest unit of XRP transfer, basically equal to zero), initiated by only 20 wallets. The XRP Ledger Foundation’s community director, Hussein Zangana, also confirmed this figure.
In plain terms, someone uses scripts to repeatedly send dust-level transfers, stacking the ledger’s transaction count sky-high.
One-sentence translation: This isn’t an ecosystem boom—it’s 20 addresses刷 KPI.
Market impact
- Short term: XRP is now $1.423, up 5.66% in 24h, the strongest among major coins. But if you treat this “record” as evidence of on-chain prosperity and chase it, you’re buying watered-down “meat” as if it were fresh snowflake beef. If you remove those roughly 2,000 junk transfers, the real usage is about 1,200 transactions—just normal to somewhat elevated.
- Medium term: The刷 volume itself isn’t necessarily bearish, but it exposes a problem—XRP Ledger’s performance narrative can be manipulated by data. When institutions conduct due diligence later, these inflated records will actually work against it. On-chain data should be assessed by its source and structure, not just the headline.
My view
Slightly neutral to cautious. This 5.66% rally in XRP is driven more by sentiment; the on-chain record is hollow, and I don’t take it as fuel for sustained gains. A hold above $1.4 could still carry momentum, but it can’t be supported by the “volume刷” narrative alone, so a pullback is possible. I’m 70% confident in this view, and the remaining 30% is left to the market—if I’m wrong, please keep it light.
$BTC $ETH #BTC #ETH
- Asset: BTC
- Direction: Bullish📈 Predicts rise
- Duration: 12 hours
📊 Historical backtest
- After a similar claim (“55 million Bitcoin wallets are in profit, hitting a new all-time high”) was published (2025-08-28), BTC’s 12h performance was -0.90%; the bullish prediction was ❌ wrong
⚠️ Not investment advice
#XRP
19
·
--
%10 Crashed But I’m Not Selling: Has a Dip Hunt Started in the Altcoin Bloodbath?Raydium (RAYUSDT) is trending right now!
Rank: #106
In the last 24 hours, it dumped 93 million in volume, falling 10.4%, dragging down to the 0.10 level and almost freshened the bottom. While everyone was panicking in their TL and crying that the altseason is over, I personally put 30% of my cash position on the table. The market is experiencing a full-on weak-hands shaking-off operation. The screens are burning red. It slipped down to the 0.24 level, and then with an 8.9% drop it edged up to the 0.24 limit. Even in the memecoin space, it lost 7.5% and got pulled back to /bin/sh.092. But look more carefully at on-chain data and volumes. It and only dropped 2.7%. Especially at level 15 it stands like a rock, and the 24-hour volume is over $20 million. What does this tell us? Smart money doesn’t completely leave the market; it’s just waiting for opportunities to gather panic sells. You more or less know my trading style; I don’t sell while everyone is screaming, I buy. For the 0.10 levels, technically it’s a massive reaction zone. A bounce from here is just a matter of time. Personally, I didn’t miss this hard dump and started doing a segmented DCA on the DeFi side. I’m staying in the game by placing a stop-loss below 0.00. Remember, low-quality projects melt away, but the devs with a strong ecosystem are the first to recover. Chasing it from these levels definitely takes guts, but big money is made exactly in moments like these. In this bloodbath, did you panic-sell and get rekt, or did you place a dip order? For you, where’s your dip target?
%10 Crashed But I’m Not Selling: Has a Dip Hunt Started in the Altcoin Bloodbath?
Raydium (RAYUSDT) is trending right now!
Rank: #106
In the last 24 hours, it dumped 93 million in volume, falling 10.4%, dragging down to the 0.10 level and almost freshened the bottom. While everyone was panicking in their TL and crying that the altseason is over, I personally put 30% of my cash position on the table. The market is experiencing a full-on weak-hands shaking-off operation. The screens are burning red. It slipped down to the 0.24 level, and then with an 8.9% drop it edged up to the 0.24 limit. Even in the memecoin space, it lost 7.5% and got pulled back to /bin/sh.092. But look more carefully at on-chain data and volumes. It and only dropped 2.7%. Especially at level 15 it stands like a rock, and the 24-hour volume is over $20 million. What does this tell us? Smart money doesn’t completely leave the market; it’s just waiting for opportunities to gather panic sells. You more or less know my trading style; I don’t sell while everyone is screaming, I buy. For the 0.10 levels, technically it’s a massive reaction zone. A bounce from here is just a matter of time. Personally, I didn’t miss this hard dump and started doing a segmented DCA on the DeFi side. I’m staying in the game by placing a stop-loss below 0.00. Remember, low-quality projects melt away, but the devs with a strong ecosystem are the first to recover. Chasing it from these levels definitely takes guts, but big money is made exactly in moments like these. In this bloodbath, did you panic-sell and get rekt, or did you place a dip order? For you, where’s your dip target?
67
Log in to explore more content
Join global crypto users on Binance Square
⚡️ Get latest and useful information about crypto.
💬 Trusted by the world’s largest crypto exchange.
👍 Discover real insights from verified creators.
Email / Phone number
Trending Topics
1
#BinancePick
3.1M views
152,840 Discussing
2
#EarningsSeason
5.3M views
25,995 Discussing
3
#AnthropicTTMRevenueGrewAbout1200%
29,072 views
422 Discussing
4
#AnthropicS1ExpectedToday
25,714 views
344 Discussing
5
#SouthKoreaReportedlyWeighsFourthCryptoTaxDelay
30,183 views
472 Discussing
6
#FranklinTempletonFilesForTwoDividendToBitcoinETFs
39,779 views
541 Discussing
7
#StrategyMSTRSurpassesNasdaqInMarketCap
30,172 views
384 Discussing
8
#CanadaProposesStablecoinRedemptionWithin3BusinessDays
1,320 views
36 Discussing
9
#ElectrumWalletBugLetRogueServersStealFunds
30,934 views
463 Discussing
10
#ArgentineCourtDismissesLIBRACaseAgainstMilei
46,326 views
580 Discussing