Overbought vs. Oversold Signals: How to Identify Them
Disclaimer: Digital asset prices can be volatile. Do your own research. See full terms here and our risk warning here. Binance Futures products are restricted in certain countries and to certain users. This communication is not intended for users/countries to which restrictions apply.
Main Takeaways
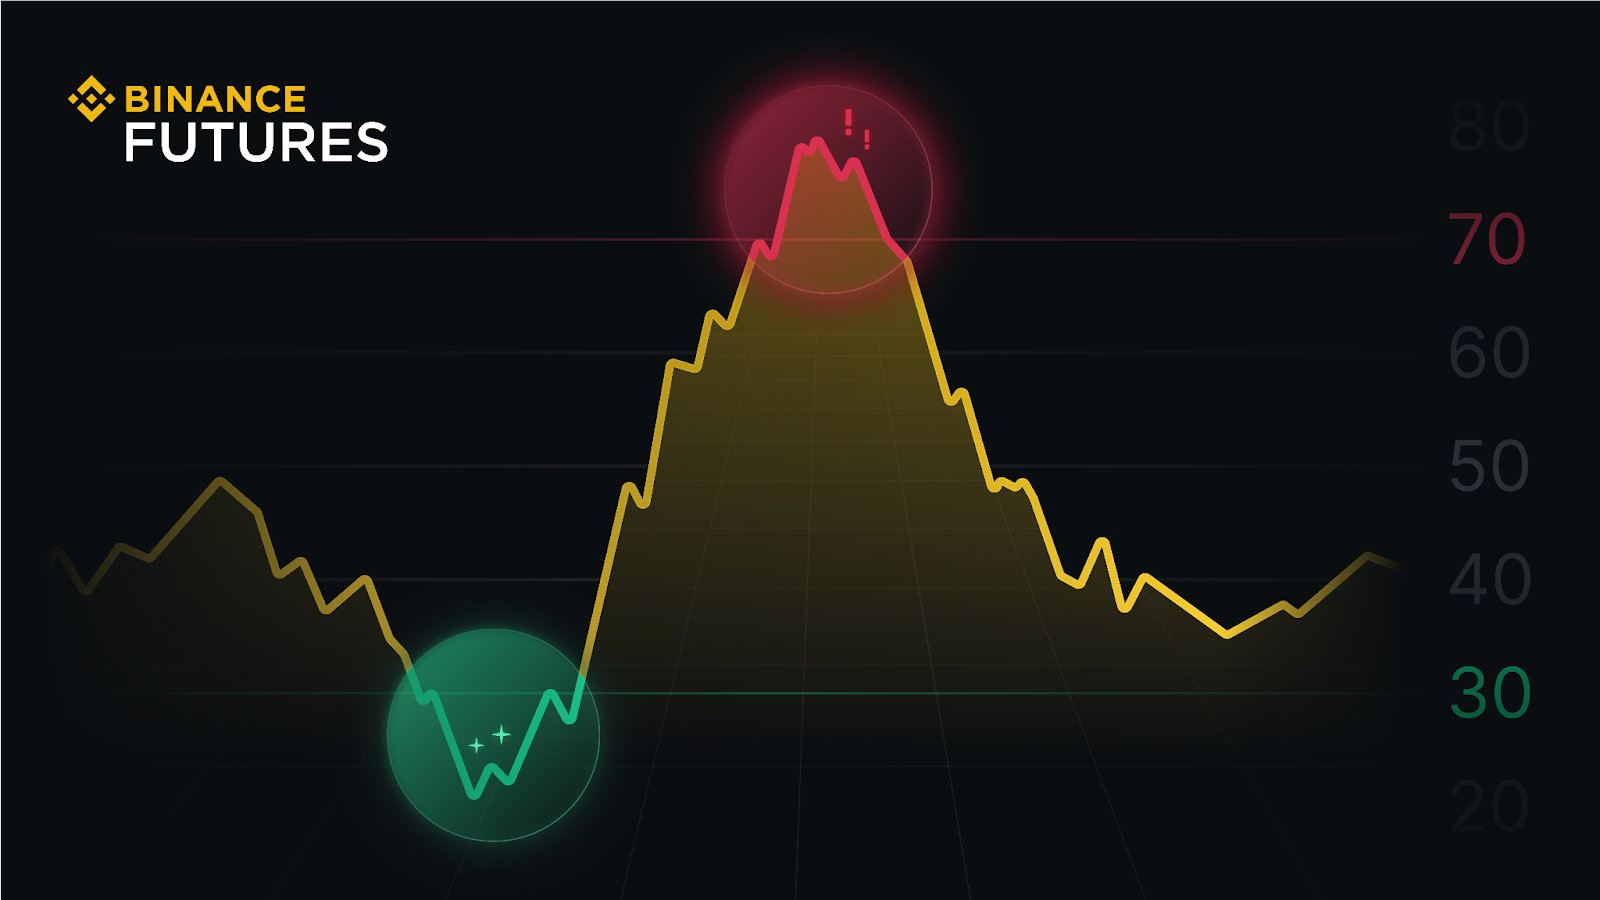
When a cryptocurrency reaches an overbought level, it suggests there could be a high possibility of a correction.
Conversely, if a crypto asset enters an oversold area, it indicates there may be an upcoming reversal point.
The RSI and the Stochastic Oscillator indicators oscillate between 0 to 100, which can possibly help to identify when the cryptocurrency is in overbought or oversold price territory.
Cryptocurrency investors often use trading signals as indicators to enter or exit a trade. Two particularly popular types are overbought and oversold signals. These can help traders determine whether a cryptocurrency's price is perhaps in bullish or bearish momentum.
Two of the most common indicators used in technical analysis to establish overbought and oversold levels are the Relative Strength Index (RSI) and the Stochastic Oscillator. Both indicators mentioned are oscillators, which describe a broader group of technical indicators analysts use.
What Are Overbought and Oversold Signals?
An overbought signal suggests that the price has been in bullish momentum for an extended period and is trading higher than its inherent value. Traders may conclude that the cryptocurrency is more expensive than the asset's intrinsic price, and a possible sell-off may be on the horizon.
An oversold signal may indicate that the cryptocurrency's price is trading below the asset's actual worth – suggesting a bearish trend. However, given that the cryptocurrency is sold at an undervalued price over an extended period, the momentum could shift to the upside, potentially seeing a price reversal.
The Relative Strength Index
The Relative Strength Index (RSI) is a commonly used technical analysis indicator to estimate short-term market momentum, evaluating overvalued or undervalued conditions. It provides insight into the cryptocurrency's trading strength by measuring the speed and direction of the recent price movements.
The RSI measures the change in momentum of the cryptocurrency's price through a range-bound oscillator. The values on the RSI range between 0 to 100, calculated based on recent price changes and prior periods' average gains vs. losses.
Short-term traders often use the RSI for buy and sell signals and also in conjunction with other technical indicators to support trading strategies.
Stochastic Oscillator
The Stochastic Oscillator compares the current price of a cryptocurrency to its range over a specific period. The indicator also provides insight into the possible times to exit and enter a trade by determining whether the crypto asset is overbought or oversold.
Given the volatile nature of cryptocurrencies, traders utilize the Stochastic Oscillator as it enables analysts to identify changes more in sideways or choppy markets.
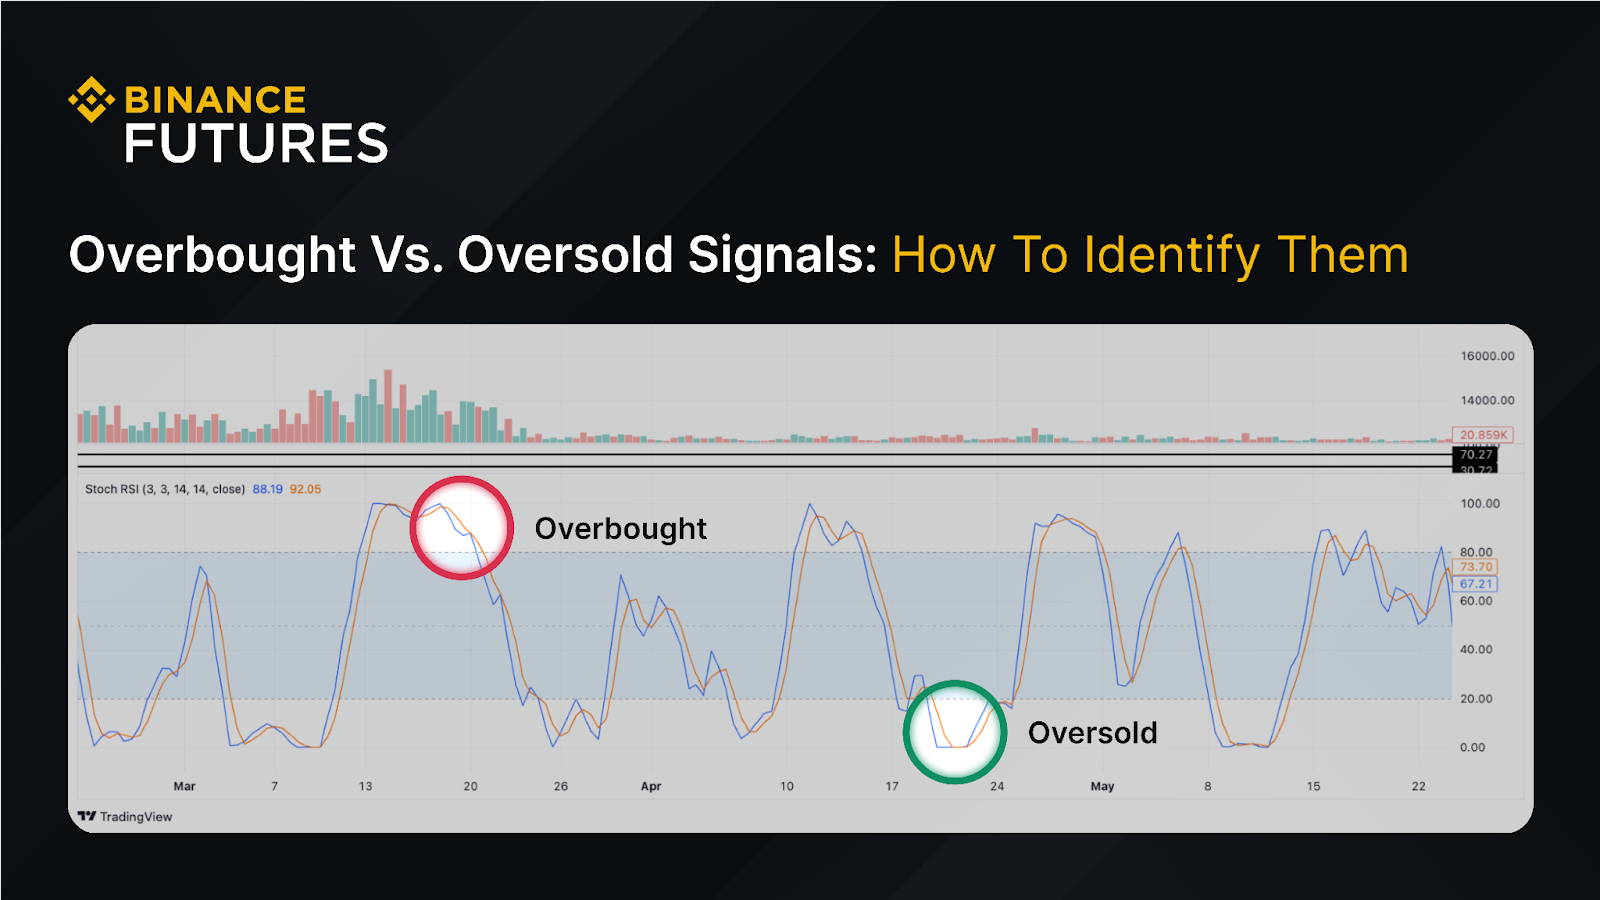
How to Identify if a Cryptocurrency Is Oversold or Overbought
As mentioned, traders can leverage the RSI to identify a reversal in a trend or a corrective pullback in the cryptocurrency's price. For example, an RSI reading of over 70 typically indicates that the asset is in the overbought territory – which means that the digital asset could see a pullback.

When the RSI shows a reading below 30, the crypto is in an oversold condition, which suggests that there could be a potential reversal in trend and due for a rally upwards.
With the Stochastic Oscillator, a value of 80 or above is considered overbought, and levels under 20 are considered oversold. If the indicator crosses these levels, it generally suggests a higher possibility of an incoming trend reversal or a price correction.
Identifying Divergences
Along with the overbought and oversold readings from the two indicators above, trendlines could also be useful for detecting divergences between the price and the strength of the cryptocurrency.
Divergences typically indicate either bullishness or bearishness used in conjunction with the trading chart and the RSI.
A bullish divergence is when the RSI reaches a higher low while the cryptocurrency's price reaches a lower low.

A bearish divergence occurs when the crypto asset's price reaches a higher high, but the RSI reading indicates a lower high.

Closing Thoughts
Overbought and oversold signals provide great insight for traders to help them decide at which levels to enter and exit the market. The RSI and the Stochastic Oscillator are the most popular tools to identify these levels and to see whether there could be a price correction or a reversal.
As with all types of technical indicators, the RSI and the Stochastic Oscillator can provide helpful insight into the upcoming trends for digital assets, but they are best when used in conjunction with other tools.
Further Reading
(Blog) What Are Bull Flags and Bear Flags and How to Trade Them
(Blog) What Is Long/Short Ratio and What Does It Convey in Cryptocurrency Futures?
(Blog) Two Technical Indicators to Gauge Market Trends in Binance Futures
Risk Warning: This content is presented to you on an "as is" basis for general information and educational purposes only, without representation or warranty of any kind. It should not be construed as financial or investment advice, nor is it intended to recommend the purchase of any specific product or service. Digital asset prices can be volatile. The value of your investment may go down or up, and you may not get back the amount invested. You are solely responsible for your investment decisions, and Binance is not liable for any losses you may incur. For more information, see our Terms of Use and Risk Warning.
The products and services referred to herein may be restricted in certain jurisdictions or regions or to certain users in accordance with applicable legal and regulatory requirements. You are responsible for informing yourself about and observing any restrictions and/or requirements imposed with respect to the access to and use of any products and services offered by or available through Binance in each country or region from which they are accessed by you or on your behalf. Binance reserves the right to change, modify or impose additional restrictions with respect to the access to and use of any products and/or services offered from time to time in its sole discretion at any time without notification.