
Vusal-Ismailov
116 Posts

Vusal-Ismailov
Report
Block User
23 Following
18 Followers
45 Liked
Posts
Portfolio
All
Quotes
PINNED

Article
A Bearish Favor: Why the Arrival of Banks Actually Crashed Crypto Prices $BTC $ETH $USDT
{spot}(BTCUSDT)
{spot}(ETHUSDT)
How Banks Crashed Crypto Prices
For a long time, the crypto industry awaited the arrival of major banks as its main growth driver. In 2026, it finally happened—but instead of skyrocketing prices, the market got a prolonged correction.
How Banks Can Drive Prices Down
• Liquidity capture and functional replacement. Previously, investors and businesses bought Bitcoin, Ethereum, or traditional stablecoins (USDT, USDC) as an alternative to slow bank transfers or as an inflation hedge. Now that banks are launching their own regulated stablecoins (such as the Project Faro consortium or Japanese megabanks) and instant blockchain settlements, the need for independent cryptocurrencies for these purposes is declining. Capital is flowing out of the open crypto market into closed banking ecosystems.
• Growth in short positions and hedging. With the arrival of bank desks, custodians, and derivatives (futures, ETF options), major players gained the ability not only to buy the asset, but also to effectively bet against it. Banks hedge their clients' risks by selling futures, which puts constant downward pressure on the spot price and dampens sharp upward rallies.
• Strict compliance and cutting off "gray" channels. Bank integration means the widespread enforcement of regulations like the Travel Rule (83% of countries), the blocking of anonymous wallets, and bans on P2P transactions (such as in Russia). A massive layer of retail and shadow capital that used to flow freely onto crypto exchanges and push prices up is now cut off from the market due to bank checks and account freezes.
• Demand restrictions on the banks themselves. Due to strict Basel Committee requirements (a 1,250% risk weight and a 1–2% capital limit), banks physically cannot become major buyers of Bitcoin. Instead, they actively act as sellers—for example, liquidating confiscated or collateralized client assets—while collecting fees for servicing the infrastructure.
The arrival of traditional finance worked against prices for four key reasons:
• Liquidity capture. Banks are launching their own regulated stablecoins and tokenizing real-world assets. Businesses and investors no longer need to buy volatile coins for fast settlements—capital is moving into closed banking networks.
• Betting on a decline. With the growth of bank derivatives and ETF options, institutional players gained convenient tools for shorting and hedging. This weighs on the spot market and suppresses any attempts at sharp growth.
• Strict compliance. The rollout of the Travel Rule standard, account freezes, and P2P bans have cut exchanges off from a massive flow of retail and shadow capital that previously drove prices higher.
• Purchase restrictions for banks. Under international Basel Committee rules, holding Bitcoin on a balance sheet is unprofitable for banks due to prohibitive capital requirements. They build the infrastructure and earn fees, but they do not buy up the coins themselves.
Ultimately, banks have "tamed" the market: they took blockchain technology for their own purposes while stripping cryptocurrencies of their former freedom and speculative fuel.
"If this perspective on the current correction rings true to you—support the post with a reaction so more people in the feed can see the real picture of what's happening."
• #Bitcoin #BTC #Ethereum #ETH
• #CryptoMarket #MarketPullback #CryptoNews
• #BearMarket #InstitutionalAdoption #Regulation
• #Stablecoins #DeFi #TradFi
A Bearish Favor: Why the Arrival of Banks Actually Crashed Crypto Prices
$BTC $ETH $USDT
How Banks Crashed Crypto Prices
For a long time, the crypto industry awaited the arrival of major banks as its main growth driver. In 2026, it finally happened—but instead of skyrocketing prices, the market got a prolonged correction.
How Banks Can Drive Prices Down
• Liquidity capture and functional replacement. Previously, investors and businesses bought Bitcoin, Ethereum, or traditional stablecoins (USDT, USDC) as an alternative to slow bank transfers or as an inflation hedge. Now that banks are launching their own regulated stablecoins (such as the Project Faro consortium or Japanese megabanks) and instant blockchain settlements, the need for independent cryptocurrencies for these purposes is declining. Capital is flowing out of the open crypto market into closed banking ecosystems.
• Growth in short positions and hedging. With the arrival of bank desks, custodians, and derivatives (futures, ETF options), major players gained the ability not only to buy the asset, but also to effectively bet against it. Banks hedge their clients' risks by selling futures, which puts constant downward pressure on the spot price and dampens sharp upward rallies.
• Strict compliance and cutting off "gray" channels. Bank integration means the widespread enforcement of regulations like the Travel Rule (83% of countries), the blocking of anonymous wallets, and bans on P2P transactions (such as in Russia). A massive layer of retail and shadow capital that used to flow freely onto crypto exchanges and push prices up is now cut off from the market due to bank checks and account freezes.
• Demand restrictions on the banks themselves. Due to strict Basel Committee requirements (a 1,250% risk weight and a 1–2% capital limit), banks physically cannot become major buyers of Bitcoin. Instead, they actively act as sellers—for example, liquidating confiscated or collateralized client assets—while collecting fees for servicing the infrastructure.
The arrival of traditional finance worked against prices for four key reasons:
• Liquidity capture. Banks are launching their own regulated stablecoins and tokenizing real-world assets. Businesses and investors no longer need to buy volatile coins for fast settlements—capital is moving into closed banking networks.
• Betting on a decline. With the growth of bank derivatives and ETF options, institutional players gained convenient tools for shorting and hedging. This weighs on the spot market and suppresses any attempts at sharp growth.
• Strict compliance. The rollout of the Travel Rule standard, account freezes, and P2P bans have cut exchanges off from a massive flow of retail and shadow capital that previously drove prices higher.
• Purchase restrictions for banks. Under international Basel Committee rules, holding Bitcoin on a balance sheet is unprofitable for banks due to prohibitive capital requirements. They build the infrastructure and earn fees, but they do not buy up the coins themselves.
Ultimately, banks have "tamed" the market: they took blockchain technology for their own purposes while stripping cryptocurrencies of their former freedom and speculative fuel.
"If this perspective on the current correction rings true to you—support the post with a reaction so more people in the feed can see the real picture of what's happening."
• #Bitcoin #BTC #Ethereum #ETH
• #CryptoMarket #MarketPullback #CryptoNews
• #BearMarket #InstitutionalAdoption #Regulation
• #Stablecoins #DeFi #TradFi
How Banks Crashed Crypto Prices
For a long time, the crypto industry awaited the arrival of major banks as its main growth driver. In 2026, it finally happened—but instead of skyrocketing prices, the market got a prolonged correction.
How Banks Can Drive Prices Down
• Liquidity capture and functional replacement. Previously, investors and businesses bought Bitcoin, Ethereum, or traditional stablecoins (USDT, USDC) as an alternative to slow bank transfers or as an inflation hedge. Now that banks are launching their own regulated stablecoins (such as the Project Faro consortium or Japanese megabanks) and instant blockchain settlements, the need for independent cryptocurrencies for these purposes is declining. Capital is flowing out of the open crypto market into closed banking ecosystems.
• Growth in short positions and hedging. With the arrival of bank desks, custodians, and derivatives (futures, ETF options), major players gained the ability not only to buy the asset, but also to effectively bet against it. Banks hedge their clients' risks by selling futures, which puts constant downward pressure on the spot price and dampens sharp upward rallies.
• Strict compliance and cutting off "gray" channels. Bank integration means the widespread enforcement of regulations like the Travel Rule (83% of countries), the blocking of anonymous wallets, and bans on P2P transactions (such as in Russia). A massive layer of retail and shadow capital that used to flow freely onto crypto exchanges and push prices up is now cut off from the market due to bank checks and account freezes.
• Demand restrictions on the banks themselves. Due to strict Basel Committee requirements (a 1,250% risk weight and a 1–2% capital limit), banks physically cannot become major buyers of Bitcoin. Instead, they actively act as sellers—for example, liquidating confiscated or collateralized client assets—while collecting fees for servicing the infrastructure.
The arrival of traditional finance worked against prices for four key reasons:
• Liquidity capture. Banks are launching their own regulated stablecoins and tokenizing real-world assets. Businesses and investors no longer need to buy volatile coins for fast settlements—capital is moving into closed banking networks.
• Betting on a decline. With the growth of bank derivatives and ETF options, institutional players gained convenient tools for shorting and hedging. This weighs on the spot market and suppresses any attempts at sharp growth.
• Strict compliance. The rollout of the Travel Rule standard, account freezes, and P2P bans have cut exchanges off from a massive flow of retail and shadow capital that previously drove prices higher.
• Purchase restrictions for banks. Under international Basel Committee rules, holding Bitcoin on a balance sheet is unprofitable for banks due to prohibitive capital requirements. They build the infrastructure and earn fees, but they do not buy up the coins themselves.
Ultimately, banks have "tamed" the market: they took blockchain technology for their own purposes while stripping cryptocurrencies of their former freedom and speculative fuel.
"If this perspective on the current correction rings true to you—support the post with a reaction so more people in the feed can see the real picture of what's happening."
• #Bitcoin #BTC #Ethereum #ETH
• #CryptoMarket #MarketPullback #CryptoNews
• #BearMarket #InstitutionalAdoption #Regulation
• #Stablecoins #DeFi #TradFi
6
3
196
PINNED

Article
While my portfolio is in the red: why I keep writing market articles ☕️📊Right now, my main funds are locked in a drawdown, so I can’t trade actively — I’m simply waiting for a reversal. To avoid wasting time, I write short articles for you covering key levels for $BTC and altcoins.
Nothing to hide: I’m doing this for extra side income from content creation. The payouts are tiny right now, but for a small trader sitting at a loss, every single cent helps.
The truth is, engagement is almost zero — plenty of people read, yet almost no one hits like or drops a quick comment. For the Square algorithm, your activity is direct support for the creator that translates into real help for my account.
If my articles bring you even a bit of value, let me know in the comments so I know I’m not writing into the void 👇
#BTC #CryptoLife #Trading #BinanceSquare
While my portfolio is in the red: why I keep writing market articles ☕️📊
Right now, my main funds are locked in a drawdown, so I can’t trade actively — I’m simply waiting for a reversal. To avoid wasting time, I write short articles for you covering key levels for $BTC and altcoins.
Nothing to hide: I’m doing this for extra side income from content creation. The payouts are tiny right now, but for a small trader sitting at a loss, every single cent helps.
The truth is, engagement is almost zero — plenty of people read, yet almost no one hits like or drops a quick comment. For the Square algorithm, your activity is direct support for the creator that translates into real help for my account.
If my articles bring you even a bit of value, let me know in the comments so I know I’m not writing into the void 👇
#BTC #CryptoLife #Trading #BinanceSquare
Nothing to hide: I’m doing this for extra side income from content creation. The payouts are tiny right now, but for a small trader sitting at a loss, every single cent helps.
The truth is, engagement is almost zero — plenty of people read, yet almost no one hits like or drops a quick comment. For the Square algorithm, your activity is direct support for the creator that translates into real help for my account.
If my articles bring you even a bit of value, let me know in the comments so I know I’m not writing into the void 👇
#BTC #CryptoLife #Trading #BinanceSquare
1
1
44
Article
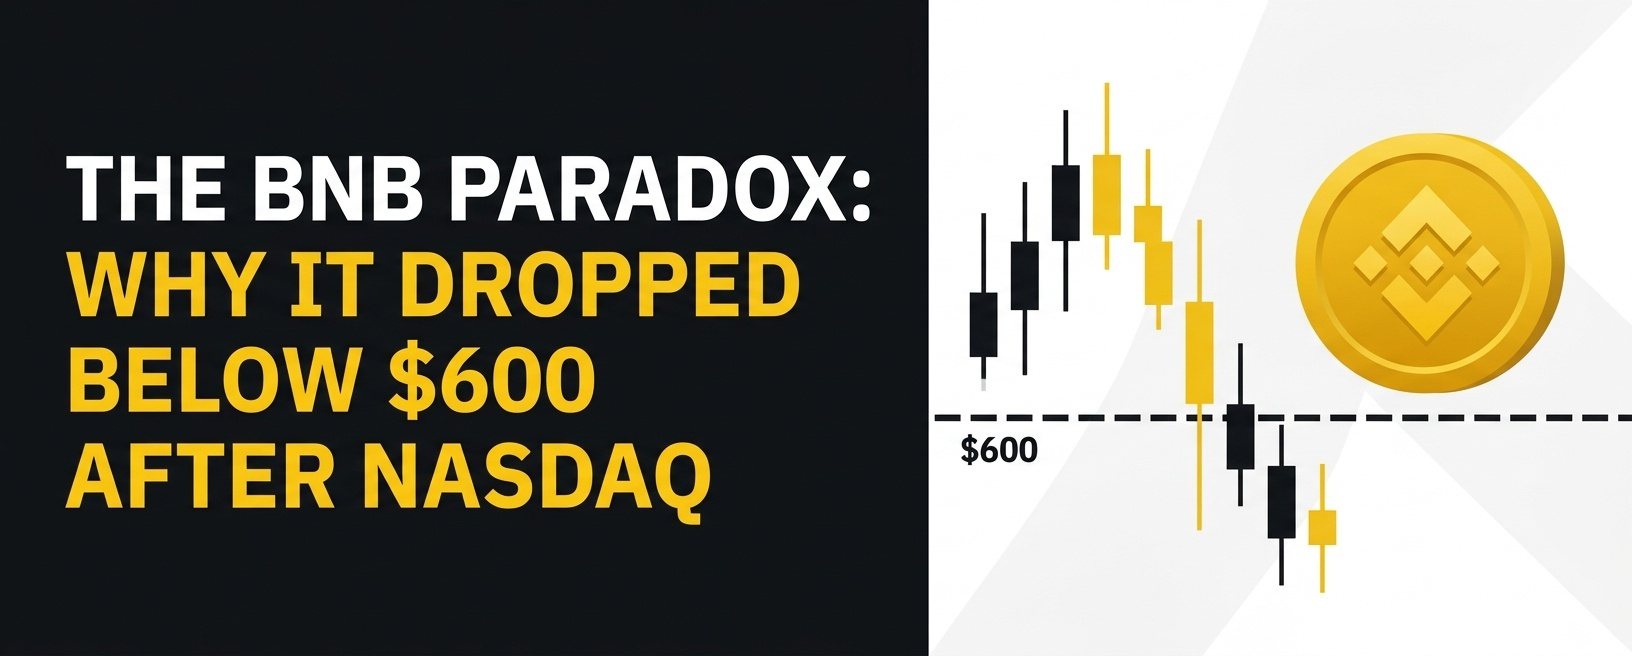
Парадокс $BNB: почему токен падает ниже $600 сразу после выхода на биржу Nasdaq?$BNB На крипторынке долгое время работало простое правило: выход актива на американский фондовый рынок неизбежно толкает курс вверх на волне институционального капитала. Но осень 2026 года сломала этот шаблон.
В середине ноября $BNB пробил психологическую отметку в $600, опустившись в зону $570–$595 и потеряв за месяц более 20%. И это произошло сразу после того, как в октябре компания BNB Standard Corporation (тикер BNC) вышла на Nasdaq, открыв инвесторам с Уолл-стрит регулируемый доступ к экосистеме.
Разбираем 3 главные причины, почему признание традиционных финансов не удержало курс от коррекции:
🔹 Эффект «продажи на фактах» и бегство от риска
Выход на Nasdaq совпал с общим охлаждением рынков. В первой половине ноября из американских спотовых $BTC-ETF утекло почти $2 млрд, а свободный капитал перетек в крупные технологические IPO. В таких условиях институционалы предпочли переждать шторм в кэше, из-за чего акции BNC скорректировались синхронно с базовым криптоактивом.
🔹 Психологический навес после октябрьского стресс-теста
В конце октября индустрия пережила крупнейший инцидент безопасности на 6,34 млрд, связанный с уязвимостью делегирования ETH (EIP-7702) и атакой на внутренние ИИ-инструменты. Площадка оперативно возместила пользователям более 90% средств за счет фонда SAFU и собственных резервов. Однако колоссальные расходы и временная перестройка работы горячих кошельков затормозили активность маркетмейкеров и породили на рынке волну спекуляций.
🔹 Снижение органического спроса на комиссии
Ценность $BNB напрямую зависит от торговых оборотов. После вступления в полную силу европейских правил MiCA летом 2026 года часть продуктов в ЕС была ограничена. Одновременно усилилась конкуренция со стороны децентрализованных фьючерсных площадок (таких как Hyperliquid). В результате утилитарный спрос на оплату комиссий временно просел, и даже регулярные механизмы сжигания Auto-Burn и BEP-95 не смогли сразу перекрыть давление продавцов.
Что дальше? Ключевые уровни на графике
Ситуация вокруг $BNB сейчас напоминает туго натянутую пружину. С одной стороны — сильный фундамент и планы по выходу на 5 новых рынков Азии в начале 2027 года. С другой — напряженная техническая картина:
Критическая поддержка: зона $550–$570. Если покупатели удержат этот рубеж, текущий провал запомнится лишь как эмоциональная перепроданность.Сигнал к развороту: уверенный возврат и закрепление выше $630, где сосредоточены основные объемы продавцов с конца октября.{spot}(BNBUSDT)
А как вы считаете: текущий пролив ниже $600 — это отличная точка входа перед приходом капитала с Nasdaq или мы еще увидим тест $550? Делитесь мнением в комментариях! 👇
#BNB #Nasdaq #BNBChain #Аналитика #криптовалюта
Парадокс $BNB: почему токен падает ниже $600 сразу после выхода на биржу Nasdaq?
$BNB На крипторынке долгое время работало простое правило: выход актива на американский фондовый рынок неизбежно толкает курс вверх на волне институционального капитала. Но осень 2026 года сломала этот шаблон.
В середине ноября $BNB пробил психологическую отметку в $600, опустившись в зону $570–$595 и потеряв за месяц более 20%. И это произошло сразу после того, как в октябре компания BNB Standard Corporation (тикер BNC) вышла на Nasdaq, открыв инвесторам с Уолл-стрит регулируемый доступ к экосистеме.
Разбираем 3 главные причины, почему признание традиционных финансов не удержало курс от коррекции:
🔹 Эффект «продажи на фактах» и бегство от риска
Выход на Nasdaq совпал с общим охлаждением рынков. В первой половине ноября из американских спотовых $BTC-ETF утекло почти $2 млрд, а свободный капитал перетек в крупные технологические IPO. В таких условиях институционалы предпочли переждать шторм в кэше, из-за чего акции BNC скорректировались синхронно с базовым криптоактивом.
🔹 Психологический навес после октябрьского стресс-теста
В конце октября индустрия пережила крупнейший инцидент безопасности на 6,34 млрд, связанный с уязвимостью делегирования ETH (EIP-7702) и атакой на внутренние ИИ-инструменты. Площадка оперативно возместила пользователям более 90% средств за счет фонда SAFU и собственных резервов. Однако колоссальные расходы и временная перестройка работы горячих кошельков затормозили активность маркетмейкеров и породили на рынке волну спекуляций.
🔹 Снижение органического спроса на комиссии
Ценность $BNB напрямую зависит от торговых оборотов. После вступления в полную силу европейских правил MiCA летом 2026 года часть продуктов в ЕС была ограничена. Одновременно усилилась конкуренция со стороны децентрализованных фьючерсных площадок (таких как Hyperliquid). В результате утилитарный спрос на оплату комиссий временно просел, и даже регулярные механизмы сжигания Auto-Burn и BEP-95 не смогли сразу перекрыть давление продавцов.
Что дальше? Ключевые уровни на графике
Ситуация вокруг $BNB сейчас напоминает туго натянутую пружину. С одной стороны — сильный фундамент и планы по выходу на 5 новых рынков Азии в начале 2027 года. С другой — напряженная техническая картина:
Критическая поддержка: зона $550–$570. Если покупатели удержат этот рубеж, текущий провал запомнится лишь как эмоциональная перепроданность.Сигнал к развороту: уверенный возврат и закрепление выше $630, где сосредоточены основные объемы продавцов с конца октября.А как вы считаете: текущий пролив ниже $600 — это отличная точка входа перед приходом капитала с Nasdaq или мы еще увидим тест $550? Делитесь мнением в комментариях! 👇
#BNB #Nasdaq #BNBChain #Аналитика #криптовалюта
В середине ноября $BNB пробил психологическую отметку в $600, опустившись в зону $570–$595 и потеряв за месяц более 20%. И это произошло сразу после того, как в октябре компания BNB Standard Corporation (тикер BNC) вышла на Nasdaq, открыв инвесторам с Уолл-стрит регулируемый доступ к экосистеме.
Разбираем 3 главные причины, почему признание традиционных финансов не удержало курс от коррекции:
🔹 Эффект «продажи на фактах» и бегство от риска
Выход на Nasdaq совпал с общим охлаждением рынков. В первой половине ноября из американских спотовых $BTC-ETF утекло почти $2 млрд, а свободный капитал перетек в крупные технологические IPO. В таких условиях институционалы предпочли переждать шторм в кэше, из-за чего акции BNC скорректировались синхронно с базовым криптоактивом.
🔹 Психологический навес после октябрьского стресс-теста
В конце октября индустрия пережила крупнейший инцидент безопасности на 6,34 млрд, связанный с уязвимостью делегирования ETH (EIP-7702) и атакой на внутренние ИИ-инструменты. Площадка оперативно возместила пользователям более 90% средств за счет фонда SAFU и собственных резервов. Однако колоссальные расходы и временная перестройка работы горячих кошельков затормозили активность маркетмейкеров и породили на рынке волну спекуляций.
🔹 Снижение органического спроса на комиссии
Ценность $BNB напрямую зависит от торговых оборотов. После вступления в полную силу европейских правил MiCA летом 2026 года часть продуктов в ЕС была ограничена. Одновременно усилилась конкуренция со стороны децентрализованных фьючерсных площадок (таких как Hyperliquid). В результате утилитарный спрос на оплату комиссий временно просел, и даже регулярные механизмы сжигания Auto-Burn и BEP-95 не смогли сразу перекрыть давление продавцов.
Что дальше? Ключевые уровни на графике
Ситуация вокруг $BNB сейчас напоминает туго натянутую пружину. С одной стороны — сильный фундамент и планы по выходу на 5 новых рынков Азии в начале 2027 года. С другой — напряженная техническая картина:
Критическая поддержка: зона $550–$570. Если покупатели удержат этот рубеж, текущий провал запомнится лишь как эмоциональная перепроданность.Сигнал к развороту: уверенный возврат и закрепление выше $630, где сосредоточены основные объемы продавцов с конца октября.А как вы считаете: текущий пролив ниже $600 — это отличная точка входа перед приходом капитала с Nasdaq или мы еще увидим тест $550? Делитесь мнением в комментариях! 👇
#BNB #Nasdaq #BNBChain #Аналитика #криптовалюта
1
117
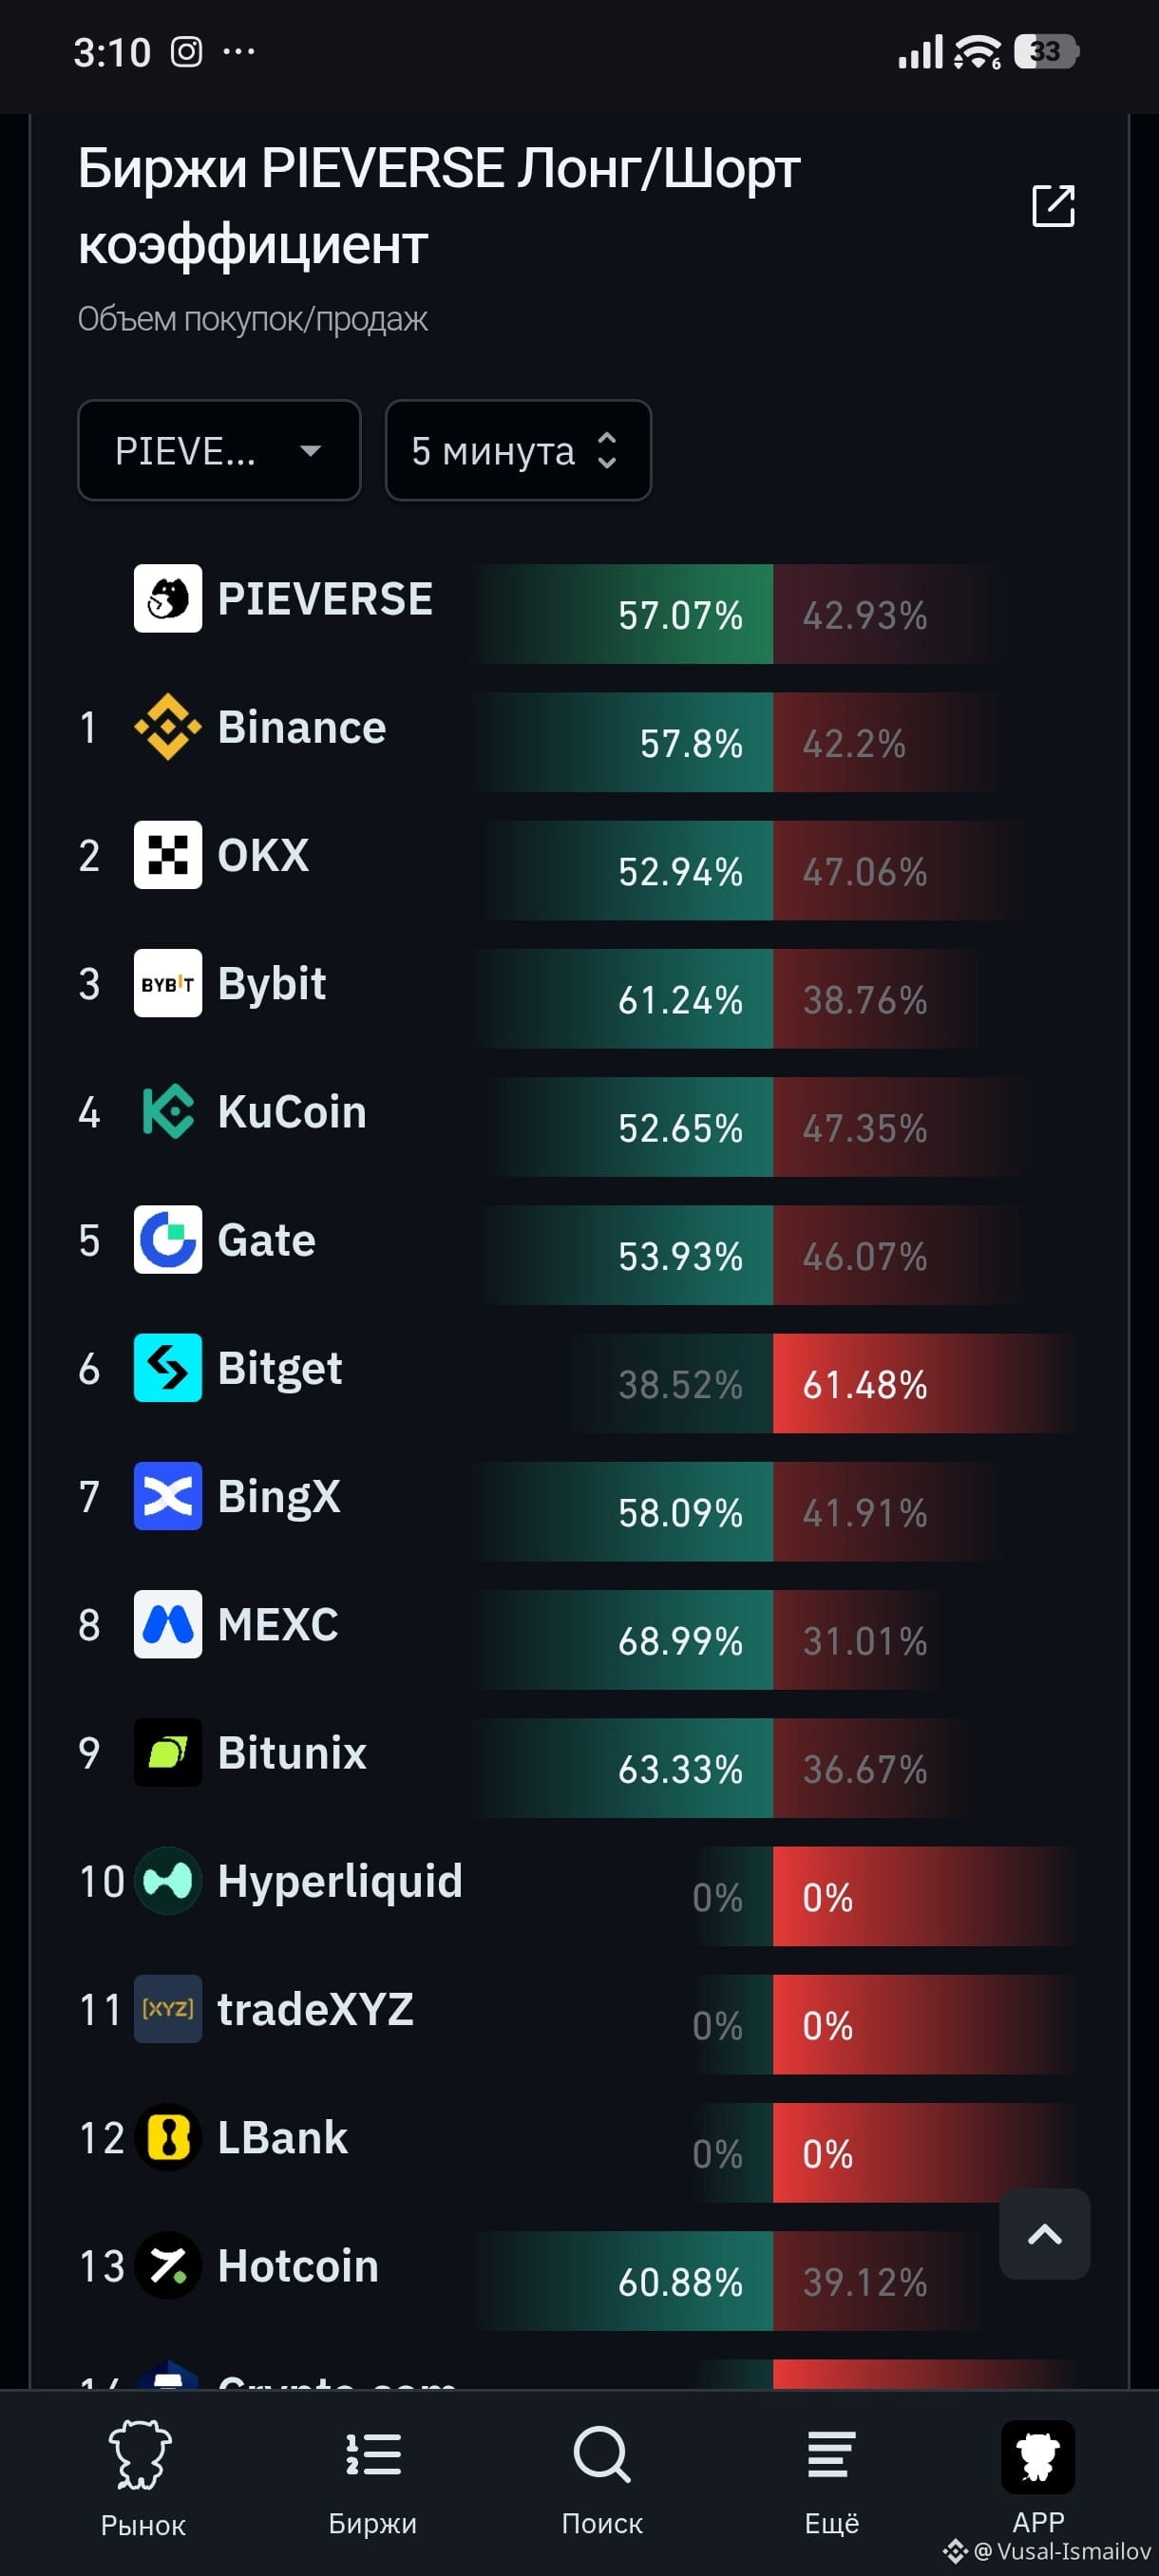
$PIEVERSE Осторожный шорт-сетап после пампа 📉⚠️
Цена упёрлась в поддержку $3.1356, поэтому с текущих ($3.21) не шортим — ждём либо отскок к сопротивлению, либо чистый пробой вниз:
• Вход (Entry): $3.36 – $3.42 (на отскоке к уровню $3.419) или после закрепления 15м свечи ниже $3.1350.
• TP1: $3.05
• TP2: $2.86
• Стоп-лосс (SL): $3.66 (строго за пик $3.6382).
⚠️ Высокий риск: за 7 дней актив вырос почти на +100%, в стакане много покупателей — возможны резкие сквизы. Используйте минимальное плечо (2x–3x) и не заходите на всю котлету (DYOR)! 🛡️
$PIEVERSE Осторожный шорт-сетап после пампа 📉⚠️
Цена упёрлась в поддержку $3.1356, поэтому с текущих ($3.21) не шортим — ждём либо отскок к сопротивлению, либо чистый пробой вниз:
• Вход (Entry): $3.36 – $3.42 (на отскоке к уровню $3.419) или после закрепления 15м свечи ниже $3.1350.
• TP1: $3.05
• TP2: $2.86
• Стоп-лосс (SL): $3.66 (строго за пик $3.6382).
⚠️ Высокий риск: за 7 дней актив вырос почти на +100%, в стакане много покупателей — возможны резкие сквизы. Используйте минимальное плечо (2x–3x) и не заходите на всю котлету (DYOR)! 🛡️
Цена упёрлась в поддержку $3.1356, поэтому с текущих ($3.21) не шортим — ждём либо отскок к сопротивлению, либо чистый пробой вниз:
• Вход (Entry): $3.36 – $3.42 (на отскоке к уровню $3.419) или после закрепления 15м свечи ниже $3.1350.
• TP1: $3.05
• TP2: $2.86
• Стоп-лосс (SL): $3.66 (строго за пик $3.6382).
⚠️ Высокий риск: за 7 дней актив вырос почти на +100%, в стакане много покупателей — возможны резкие сквизы. Используйте минимальное плечо (2x–3x) и не заходите на всю котлету (DYOR)! 🛡️
142
Article
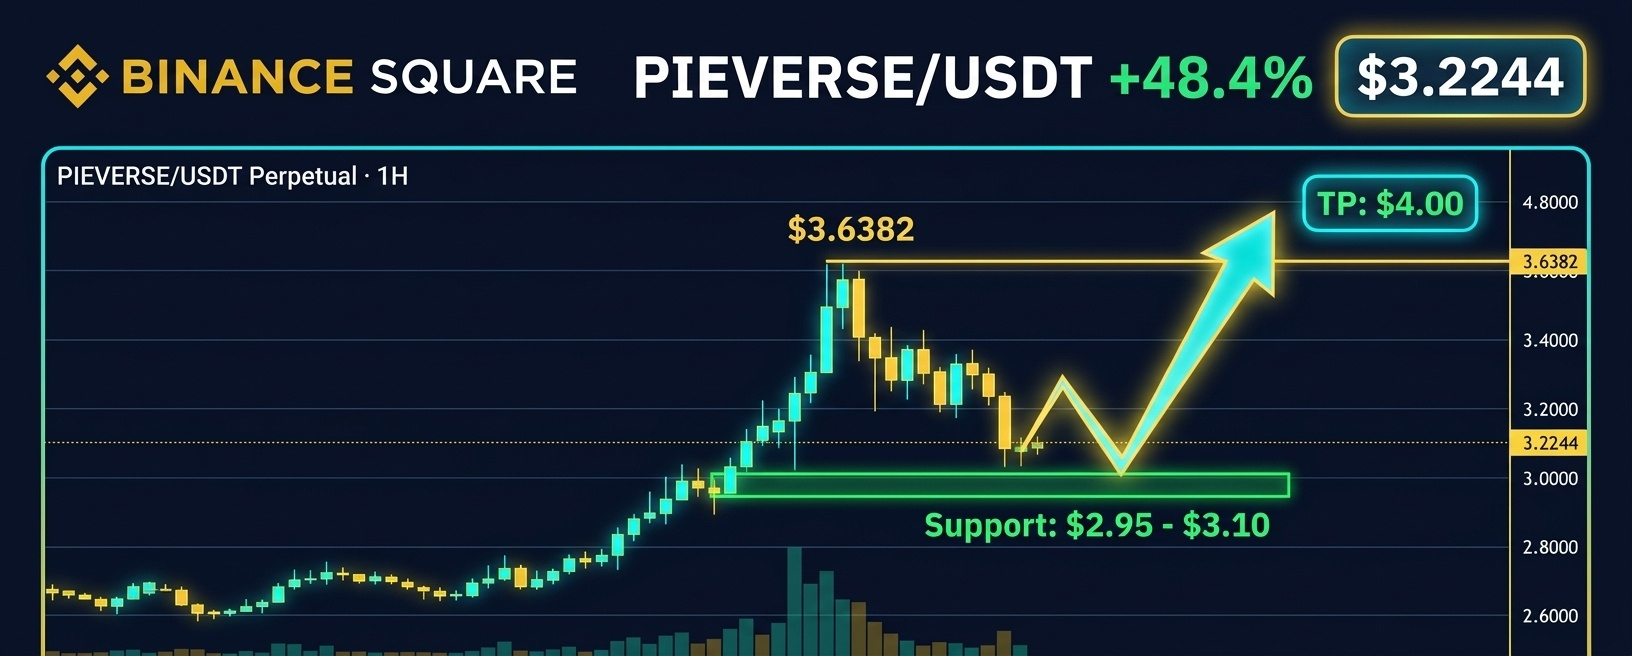
PIEVERSE/USDT (+48%): Cooldown After the Rally to $3.63 — Waiting for the Second Wave? 🚀📊$PIEVERSE The PIEVERSE token remains the top liquidity magnet on Binance Futures with a 24-hour volume of over $282.9M! Following a powerful impulse to $3.6382, the price has entered a natural correction phase toward the $3.2244 area, cooling off overheated indicators on lower timeframes.
What the charts are showing right now:
4H: Global momentum remains confidently bullish above the $2.87–$2.96 support (EMA7/MA7) and the Supertrend line ($2.75).1H and 15M: Local overbought conditions have already been cleared — the 1-hour StochRSI has reset to zero, and the 15-minute RSI has dropped into the oversold zone (26.6), forming a base for a new bounce.
Key levels and forecast:
Support zone (area of interest): $2.95 – $3.10 (1-hour Supertrend at $3.05 and MA25/EMA25 moving averages). Holding this zone will confirm buyer strength.Targets if growth resumes: a return to $3.45, a retest of the $3.638 high, and a push toward the psychological target of $4.00.Scenario invalidation: dropping and consolidating below $2.75 will send the coin into a deeper correction toward $2.35.
How do you trade explosive moves like this: waiting for a support retest near $3.00 or already in a position? Hit like, follow, and share your thoughts in the comments — your activity really helps grow this blog while part of my spot portfolio waits for a market reversal! 🔥🤝👇
Not financial advice (DYOR).
#Pieverse #PIEVERSEUSDT #BinanceSquare #CryptoAnalysis #Altcoins #Trading #Futures #dyor
PIEVERSE/USDT (+48%): Cooldown After the Rally to $3.63 — Waiting for the Second Wave? 🚀📊
$PIEVERSE The PIEVERSE token remains the top liquidity magnet on Binance Futures with a 24-hour volume of over $282.9M! Following a powerful impulse to $3.6382, the price has entered a natural correction phase toward the $3.2244 area, cooling off overheated indicators on lower timeframes.
What the charts are showing right now:
4H: Global momentum remains confidently bullish above the $2.87–$2.96 support (EMA7/MA7) and the Supertrend line ($2.75).1H and 15M: Local overbought conditions have already been cleared — the 1-hour StochRSI has reset to zero, and the 15-minute RSI has dropped into the oversold zone (26.6), forming a base for a new bounce.
Key levels and forecast:
Support zone (area of interest): $2.95 – $3.10 (1-hour Supertrend at $3.05 and MA25/EMA25 moving averages). Holding this zone will confirm buyer strength.Targets if growth resumes: a return to $3.45, a retest of the $3.638 high, and a push toward the psychological target of $4.00.Scenario invalidation: dropping and consolidating below $2.75 will send the coin into a deeper correction toward $2.35.
How do you trade explosive moves like this: waiting for a support retest near $3.00 or already in a position? Hit like, follow, and share your thoughts in the comments — your activity really helps grow this blog while part of my spot portfolio waits for a market reversal! 🔥🤝👇
Not financial advice (DYOR).
#Pieverse #PIEVERSEUSDT #BinanceSquare #CryptoAnalysis #Altcoins #Trading #Futures #dyor
What the charts are showing right now:
4H: Global momentum remains confidently bullish above the $2.87–$2.96 support (EMA7/MA7) and the Supertrend line ($2.75).1H and 15M: Local overbought conditions have already been cleared — the 1-hour StochRSI has reset to zero, and the 15-minute RSI has dropped into the oversold zone (26.6), forming a base for a new bounce.
Key levels and forecast:
Support zone (area of interest): $2.95 – $3.10 (1-hour Supertrend at $3.05 and MA25/EMA25 moving averages). Holding this zone will confirm buyer strength.Targets if growth resumes: a return to $3.45, a retest of the $3.638 high, and a push toward the psychological target of $4.00.Scenario invalidation: dropping and consolidating below $2.75 will send the coin into a deeper correction toward $2.35.
How do you trade explosive moves like this: waiting for a support retest near $3.00 or already in a position? Hit like, follow, and share your thoughts in the comments — your activity really helps grow this blog while part of my spot portfolio waits for a market reversal! 🔥🤝👇
Not financial advice (DYOR).
#Pieverse #PIEVERSEUSDT #BinanceSquare #CryptoAnalysis #Altcoins #Trading #Futures #dyor
301
$IRYS Тейк-профит взят! Как отработал наш сетап по IRYS/USDT 🎯🚀
Помните наш недавний разбор и торговый план по IRYS? Сегодня рынок дал идеальный импульс, пробил психологическую отметку $0.0200 и точно дошёл до нашей второй цели TP2 ($0.0220)!
Свой спот я закрыл по $0.0223 — забрал чистый профит и полностью ушёл в кэш перед крупным разлоком токенов 25 ноября (~1.18 млрд IRYS). В трейдинге главное не жадничать, вовремя фиксировать прибыль по плану и не поддаваться FOMO! 💰😎
Что дальше? Сейчас ожидаю охлаждение импульса и откат обратно в зону $0.0175–$0.0195, а более интересную точку для перезахода буду присматривать уже после 25–26 ноября в районе $0.0135–$0.0150.
Кто заходил по моему сетапу и тоже зафиксировал профит? Ставьте 🔥, жмите лайк и подписывайтесь — впереди ещё много точных разборов! 👇🤝
Не является финансовой рекомендацией (DYOR).
$IRYS Тейк-профит взят! Как отработал наш сетап по IRYS/USDT 🎯🚀
Помните наш недавний разбор и торговый план по IRYS? Сегодня рынок дал идеальный импульс, пробил психологическую отметку $0.0200 и точно дошёл до нашей второй цели TP2 ($0.0220)!
Свой спот я закрыл по $0.0223 — забрал чистый профит и полностью ушёл в кэш перед крупным разлоком токенов 25 ноября (~1.18 млрд IRYS). В трейдинге главное не жадничать, вовремя фиксировать прибыль по плану и не поддаваться FOMO! 💰😎
Что дальше? Сейчас ожидаю охлаждение импульса и откат обратно в зону $0.0175–$0.0195, а более интересную точку для перезахода буду присматривать уже после 25–26 ноября в районе $0.0135–$0.0150.
Кто заходил по моему сетапу и тоже зафиксировал профит? Ставьте 🔥, жмите лайк и подписывайтесь — впереди ещё много точных разборов! 👇🤝
Не является финансовой рекомендацией (DYOR).
Помните наш недавний разбор и торговый план по IRYS? Сегодня рынок дал идеальный импульс, пробил психологическую отметку $0.0200 и точно дошёл до нашей второй цели TP2 ($0.0220)!
Свой спот я закрыл по $0.0223 — забрал чистый профит и полностью ушёл в кэш перед крупным разлоком токенов 25 ноября (~1.18 млрд IRYS). В трейдинге главное не жадничать, вовремя фиксировать прибыль по плану и не поддаваться FOMO! 💰😎
Что дальше? Сейчас ожидаю охлаждение импульса и откат обратно в зону $0.0175–$0.0195, а более интересную точку для перезахода буду присматривать уже после 25–26 ноября в районе $0.0135–$0.0150.
Кто заходил по моему сетапу и тоже зафиксировал профит? Ставьте 🔥, жмите лайк и подписывайтесь — впереди ещё много точных разборов! 👇🤝
Не является финансовой рекомендацией (DYOR).
203
$IRYS • Текущая ситуация. После импульсного выноса вверх в район $0.0223–$0.0233 (сбор ликвидности за психологическим уровнем $0.0200), монета уперлась в плотную зону продаж.
• Ближайшие дни (до 25 ноября). Ожидается охлаждение импульса и откат обратно в диапазон $0.0175–$0.0195. На рынке по-прежнему сохраняется главный давящий фактор — крупный клифф-разлок на ~1.18 млрд IRYS через 6 дней (25 ноября). Спекулянты использовали этот памп, чтобы разгрузить позиции.
• Сценарий на конец ноября. К 25–27 ноября высока вероятность повторного снижения в район $0.0136–$0.0155 под давлением новых разблокированных токенов.
$IRYS • Текущая ситуация. После импульсного выноса вверх в район $0.0223–$0.0233 (сбор ликвидности за психологическим уровнем $0.0200), монета уперлась в плотную зону продаж.
• Ближайшие дни (до 25 ноября). Ожидается охлаждение импульса и откат обратно в диапазон $0.0175–$0.0195. На рынке по-прежнему сохраняется главный давящий фактор — крупный клифф-разлок на ~1.18 млрд IRYS через 6 дней (25 ноября). Спекулянты использовали этот памп, чтобы разгрузить позиции.
• Сценарий на конец ноября. К 25–27 ноября высока вероятность повторного снижения в район $0.0136–$0.0155 под давлением новых разблокированных токенов.
• Ближайшие дни (до 25 ноября). Ожидается охлаждение импульса и откат обратно в диапазон $0.0175–$0.0195. На рынке по-прежнему сохраняется главный давящий фактор — крупный клифф-разлок на ~1.18 млрд IRYS через 6 дней (25 ноября). Спекулянты использовали этот памп, чтобы разгрузить позиции.
• Сценарий на конец ноября. К 25–27 ноября высока вероятность повторного снижения в район $0.0136–$0.0155 под давлением новых разблокированных токенов.
Vusal-Ismailov
·
--
Bullish$IRYS IRYS/USDT (4H): Bullish Bounce Setup 🚀📈
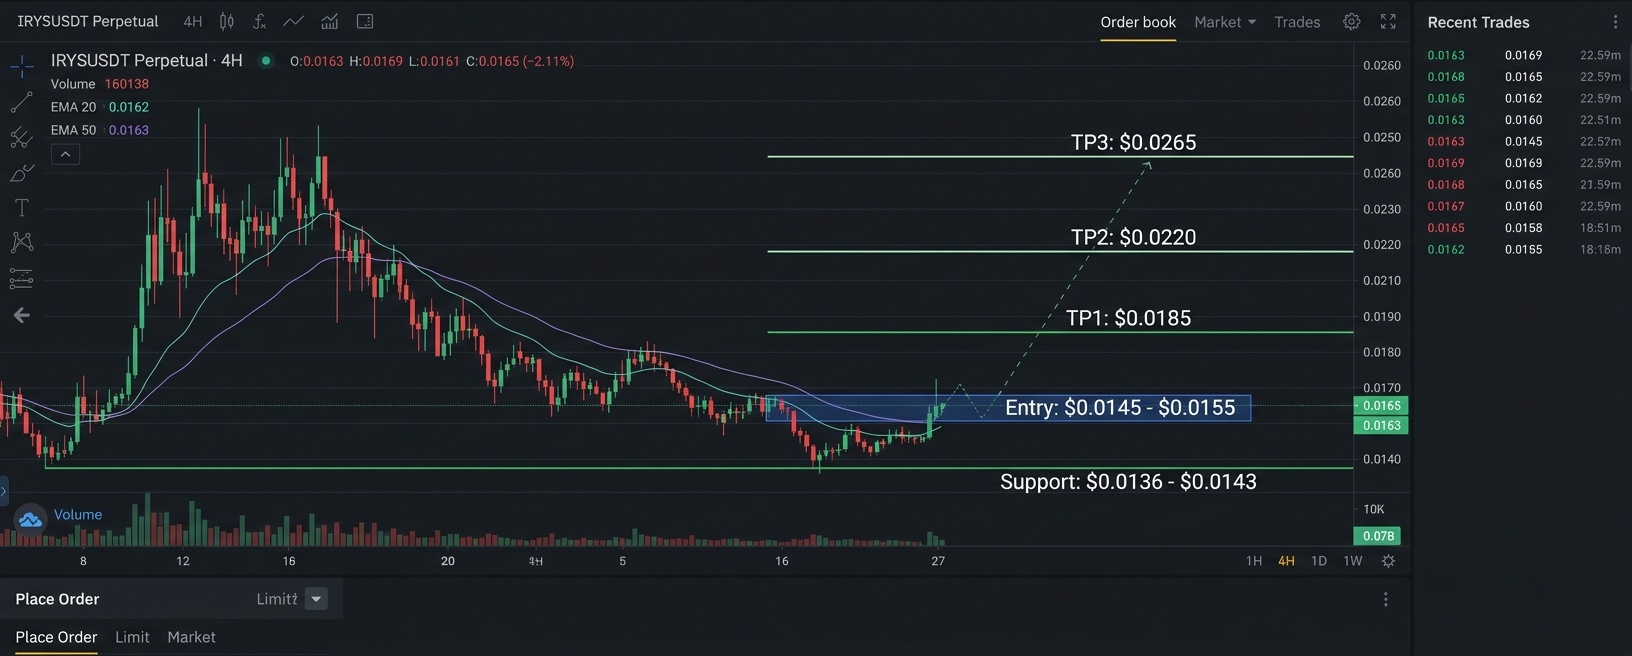
Buyers are strongly defending the $0.0136–$0.0143 support zone right around EMA 20/50 ($0.0162–$0.0163).
• Entry: $0.0145 – $0.0155
• TP1: $0.0185 (+23%)
• TP2: $0.0220 (+46%)
• TP3: $0.0265 (+76%)
• Stop Loss: $0.0132
Do you see IRYS breaking above $0.0200 soon? 👇
107
$PIEVERSE
Приоритет — лонг от поддержки. Тренд строго восходящий, но RSI(6) на 91,2 (сильная перегретость) — по текущей цене 3,5076 входить нельзя.
1. Лонг (основной)
Вход: 3,37 – 3,41 (зона EMA7 / MA7)
Стоп-лосс: 3,24
Тейк-профит: 3,638 (TP1) / 3,922 (TP2)
2. Шорт (высокий риск, контртренд)
Вход: 3,63 – 3,66 (только после ложного пробоя пика 3,6382 и закрытия 15м свечи ниже 3,60)
Стоп-лосс: 3,74
Тейк-профит: 3,40 (TP1) / 3,12 (TP2)
$PIEVERSE
Приоритет — лонг от поддержки. Тренд строго восходящий, но RSI(6) на 91,2 (сильная перегретость) — по текущей цене 3,5076 входить нельзя.
1. Лонг (основной)
Вход: 3,37 – 3,41 (зона EMA7 / MA7)
Стоп-лосс: 3,24
Тейк-профит: 3,638 (TP1) / 3,922 (TP2)
2. Шорт (высокий риск, контртренд)
Вход: 3,63 – 3,66 (только после ложного пробоя пика 3,6382 и закрытия 15м свечи ниже 3,60)
Стоп-лосс: 3,74
Тейк-профит: 3,40 (TP1) / 3,12 (TP2)
Приоритет — лонг от поддержки. Тренд строго восходящий, но RSI(6) на 91,2 (сильная перегретость) — по текущей цене 3,5076 входить нельзя.
1. Лонг (основной)
Вход: 3,37 – 3,41 (зона EMA7 / MA7)
Стоп-лосс: 3,24
Тейк-профит: 3,638 (TP1) / 3,922 (TP2)
2. Шорт (высокий риск, контртренд)
Вход: 3,63 – 3,66 (только после ложного пробоя пика 3,6382 и закрытия 15м свечи ниже 3,60)
Стоп-лосс: 3,74
Тейк-профит: 3,40 (TP1) / 3,12 (TP2)
92
$PIEVERSE • Оптимальная зона входа (лонг): 3,33 – 3,38 (вдоль линии Supertrend 3,3289 и недавнего локального минимума отката).
• Стоп-лосс: 3,24 (закрепление 15м свечи ниже 3,3289 развернет индикатор Supertrend в шорт и сломает структуру).
• Тейк-профит: 3,6380 (TP1 — ретест пика) / 4,0000 (TP2).
• Агрессивный вход: только после уверенного закрытия 15-минутной свечи выше 3,54 со стопом 3,39.
$PIEVERSE • Оптимальная зона входа (лонг): 3,33 – 3,38 (вдоль линии Supertrend 3,3289 и недавнего локального минимума отката).
• Стоп-лосс: 3,24 (закрепление 15м свечи ниже 3,3289 развернет индикатор Supertrend в шорт и сломает структуру).
• Тейк-профит: 3,6380 (TP1 — ретест пика) / 4,0000 (TP2).
• Агрессивный вход: только после уверенного закрытия 15-минутной свечи выше 3,54 со стопом 3,39.
• Стоп-лосс: 3,24 (закрепление 15м свечи ниже 3,3289 развернет индикатор Supertrend в шорт и сломает структуру).
• Тейк-профит: 3,6380 (TP1 — ретест пика) / 4,0000 (TP2).
• Агрессивный вход: только после уверенного закрытия 15-минутной свечи выше 3,54 со стопом 3,39.
171
$PIEVERSE уперлась в максимум ($3.42), высокий риск отката. Используйте один из трех сетапов:
1. Основной (откат к 38.2% Фибо)
• Вход: $2.80 – $2.86
• Стоп-лосс: $2.64
• Тейк-профит: $3.40 (TP1) / $3.82 (TP2)
2. Агрессивный (отскок от поддержки $3.00)
• Вход: $3.00 – $3.06 (после удержания 1H свечи выше $3.00)
• Стоп-лосс: $2.88
• Тейк-профит: $3.42 (TP1) / $3.85 (TP2)
3. Пробойный (закрепление выше максимума)
• Вход: $3.45 – $3.50 (на ретесте $3.42 сверху)
• Стоп-лосс: $3.24
• Тейк-профит: $3.82 (TP1) / $4.00 – $4.34 (TP2)
Риск-менеджмент: плечо не выше 2x–3x, риск на сделку 1–2% от депозита.
$PIEVERSE уперлась в максимум ($3.42), высокий риск отката. Используйте один из трех сетапов:
1. Основной (откат к 38.2% Фибо)
• Вход: $2.80 – $2.86
• Стоп-лосс: $2.64
• Тейк-профит: $3.40 (TP1) / $3.82 (TP2)
2. Агрессивный (отскок от поддержки $3.00)
• Вход: $3.00 – $3.06 (после удержания 1H свечи выше $3.00)
• Стоп-лосс: $2.88
• Тейк-профит: $3.42 (TP1) / $3.85 (TP2)
3. Пробойный (закрепление выше максимума)
• Вход: $3.45 – $3.50 (на ретесте $3.42 сверху)
• Стоп-лосс: $3.24
• Тейк-профит: $3.82 (TP1) / $4.00 – $4.34 (TP2)
Риск-менеджмент: плечо не выше 2x–3x, риск на сделку 1–2% от депозита.
1. Основной (откат к 38.2% Фибо)
• Вход: $2.80 – $2.86
• Стоп-лосс: $2.64
• Тейк-профит: $3.40 (TP1) / $3.82 (TP2)
2. Агрессивный (отскок от поддержки $3.00)
• Вход: $3.00 – $3.06 (после удержания 1H свечи выше $3.00)
• Стоп-лосс: $2.88
• Тейк-профит: $3.42 (TP1) / $3.85 (TP2)
3. Пробойный (закрепление выше максимума)
• Вход: $3.45 – $3.50 (на ретесте $3.42 сверху)
• Стоп-лосс: $3.24
• Тейк-профит: $3.82 (TP1) / $4.00 – $4.34 (TP2)
Риск-менеджмент: плечо не выше 2x–3x, риск на сделку 1–2% от депозита.
1
216
3
Article
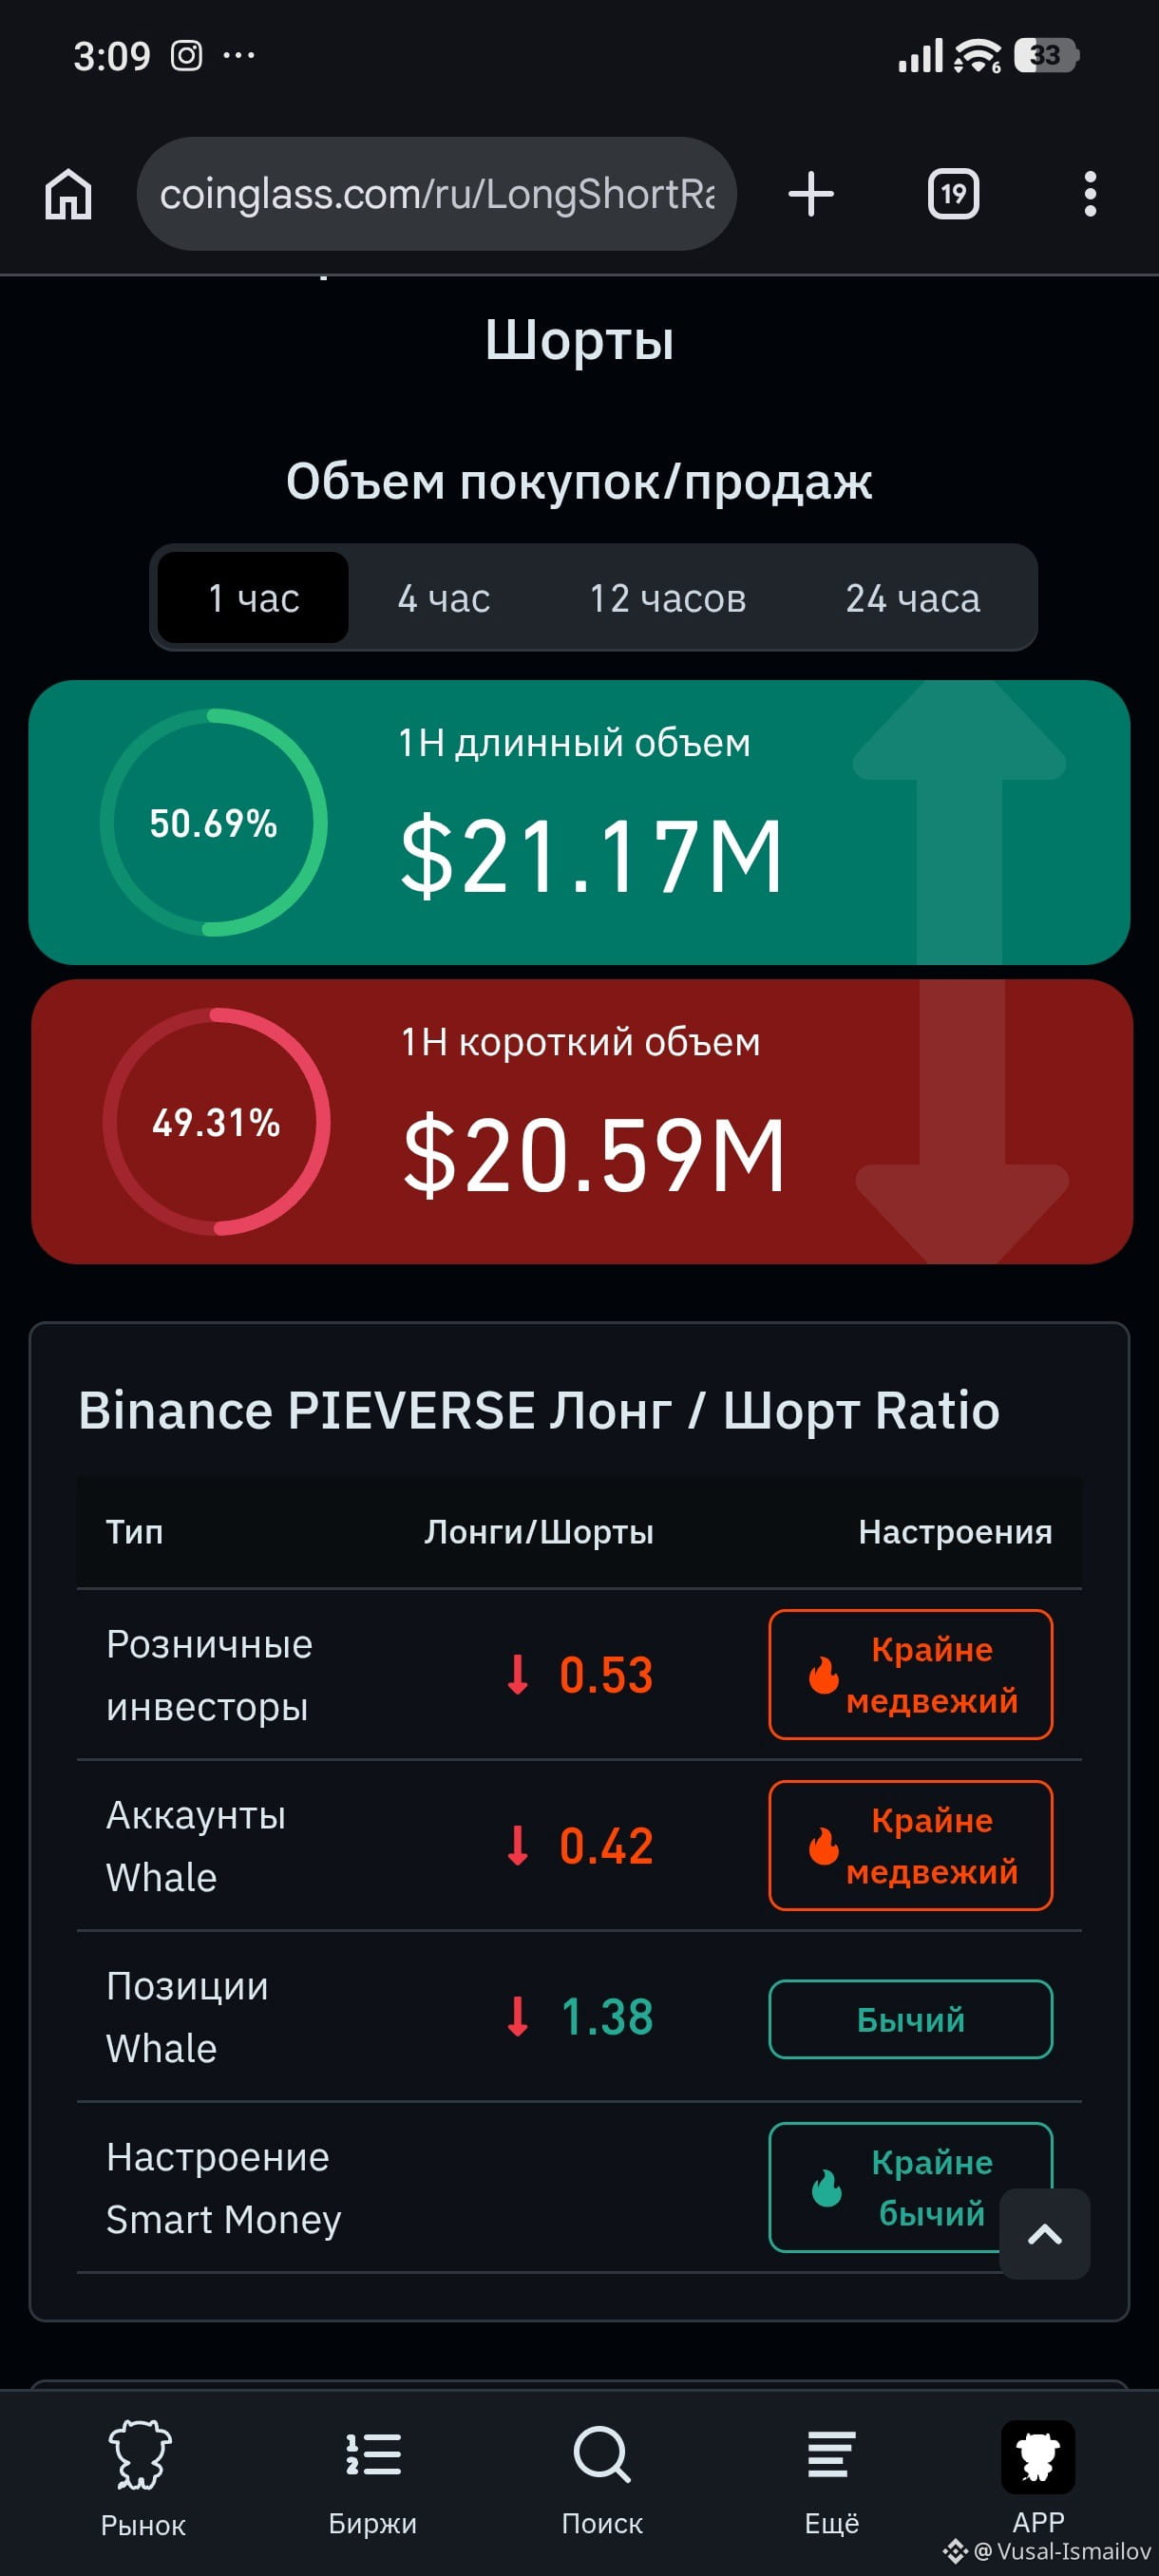
Top Liquidity Magnets of the Last 24H: PIEVERSE & HYPE 🔥🚀$PIEVERSE $HYPE
{future}(PIEVERSEUSDT)
{future}(HYPEUSDT)
While the broader market moves sideways, speculative and institutional capital has flooded into two standout performers over the past 24 hours:
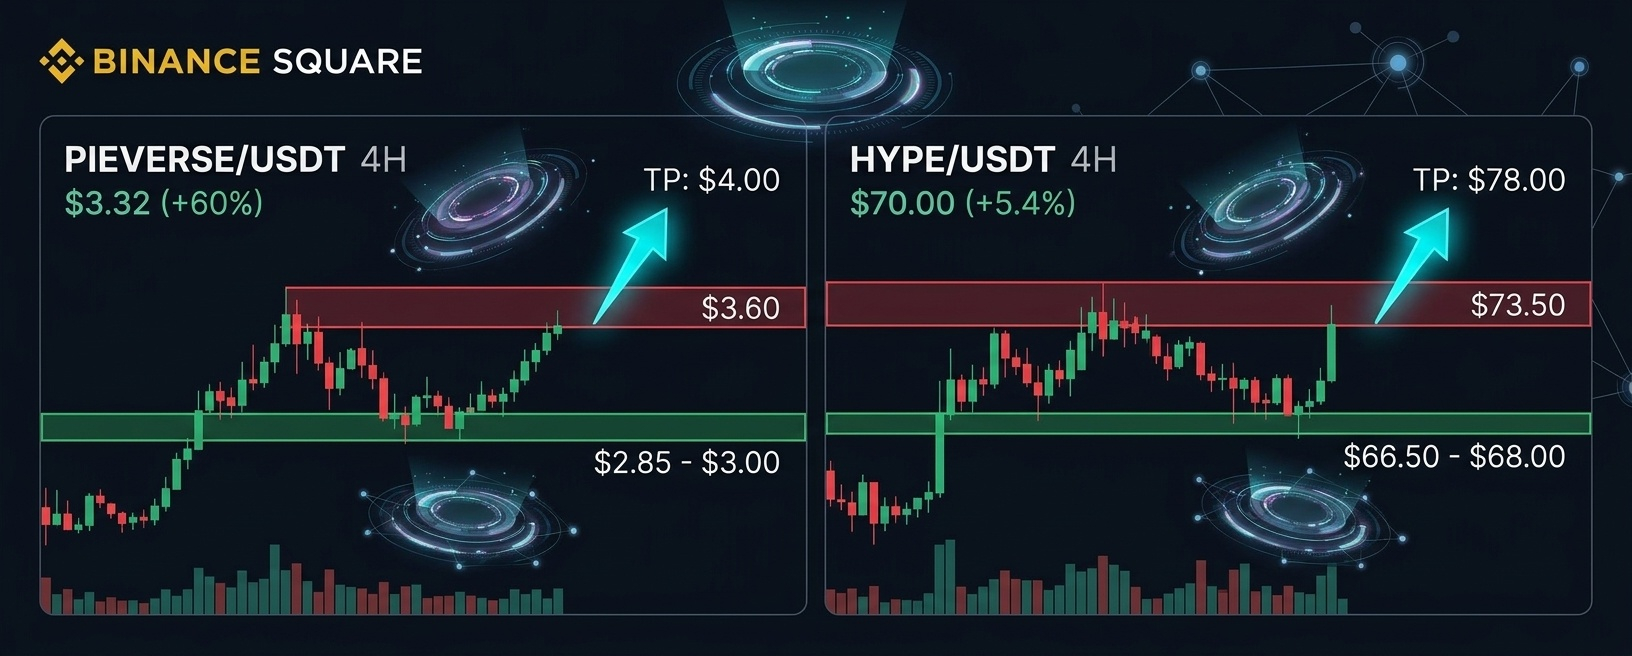
• PIEVERSE/USDT ($3.32 | +60%): Leading the entire market following its hardware privacy rollout for AI agents on BNB Chain, backed by $178M+ in daily volume. Key support sits at $2.85–$3.00; clearing $3.60 resistance opens the path to $4.00.
• HYPE/USDT ($70.00 | +5.4%): Dominating large-cap flows with a massive $1.48B in 24h turnover. Holding the $66.50–$68.00 zone and breaking above $73.50 puts $78.00 squarely in sight.
Capital rotation is crystal clear right now: AI infrastructure and top decentralized perp protocols are stealing the spotlight.
Let’s get the comments moving: which one are you picking today — the explosive PIEVERSE pump or the steady HYPE trend? Hit like, follow, and drop your thoughts below! Your engagement genuinely keeps me motivated while my own bags are temporarily frozen in deep spot red waiting for the market to bounce back 😅🤝👇
Not financial advice (DYOR).
#Pieverse #hype #Hyperliquid #BinanceSquare #Crypto #Altcoins #Trading #AI #DYOR
Top Liquidity Magnets of the Last 24H: PIEVERSE & HYPE 🔥🚀
$PIEVERSE $HYPE
While the broader market moves sideways, speculative and institutional capital has flooded into two standout performers over the past 24 hours:
• PIEVERSE/USDT ($3.32 | +60%): Leading the entire market following its hardware privacy rollout for AI agents on BNB Chain, backed by $178M+ in daily volume. Key support sits at $2.85–$3.00; clearing $3.60 resistance opens the path to $4.00.
• HYPE/USDT ($70.00 | +5.4%): Dominating large-cap flows with a massive $1.48B in 24h turnover. Holding the $66.50–$68.00 zone and breaking above $73.50 puts $78.00 squarely in sight.
Capital rotation is crystal clear right now: AI infrastructure and top decentralized perp protocols are stealing the spotlight.
Let’s get the comments moving: which one are you picking today — the explosive PIEVERSE pump or the steady HYPE trend? Hit like, follow, and drop your thoughts below! Your engagement genuinely keeps me motivated while my own bags are temporarily frozen in deep spot red waiting for the market to bounce back 😅🤝👇
Not financial advice (DYOR).
#Pieverse #hype #Hyperliquid #BinanceSquare #Crypto #Altcoins #Trading #AI #DYOR
While the broader market moves sideways, speculative and institutional capital has flooded into two standout performers over the past 24 hours:
• PIEVERSE/USDT ($3.32 | +60%): Leading the entire market following its hardware privacy rollout for AI agents on BNB Chain, backed by $178M+ in daily volume. Key support sits at $2.85–$3.00; clearing $3.60 resistance opens the path to $4.00.
• HYPE/USDT ($70.00 | +5.4%): Dominating large-cap flows with a massive $1.48B in 24h turnover. Holding the $66.50–$68.00 zone and breaking above $73.50 puts $78.00 squarely in sight.
Capital rotation is crystal clear right now: AI infrastructure and top decentralized perp protocols are stealing the spotlight.
Let’s get the comments moving: which one are you picking today — the explosive PIEVERSE pump or the steady HYPE trend? Hit like, follow, and drop your thoughts below! Your engagement genuinely keeps me motivated while my own bags are temporarily frozen in deep spot red waiting for the market to bounce back 😅🤝👇
Not financial advice (DYOR).
#Pieverse #hype #Hyperliquid #BinanceSquare #Crypto #Altcoins #Trading #AI #DYOR
548
Article
$ZBT (ZEROBASE): Deep Dive into ZK Infrastructure & Bounce Setup 🔍📊$ZBT
ZEROBASE ($ZBT) is holding steady around $0.0518 (+2.78% in 24h) after bouncing cleanly off its daily low of $0.0502. While large caps remain range-bound, speculative interest is rotating back into low-cap infrastructure plays, highlighted by surging futures activity.
Fundamental Snapshot:
• Real-time ZK + TEE computing. ZEROBASE builds a decentralized zero-knowledge prover network combining ZK proofs with Trusted Execution Environments (TEE) for institutional DeFi and verifiable AI workloads.
• Tokenomics & valuation. With a market cap near $18.8M (364.1M ZBT circulating out of 1B total supply), $ZBT sits in the low-cap infrastructure tier, giving it strong upside sensitivity when liquidity rotates into altcoins.
Derivatives & Technical Picture (4H):
• Futures-driven momentum. 24-hour volume on ZBT/USDT perpetuals surpassed $8.3M, significantly outpacing spot turnover. Elevated derivatives volume creates a thin order book prone to sharp short squeezes once key resistance levels break.
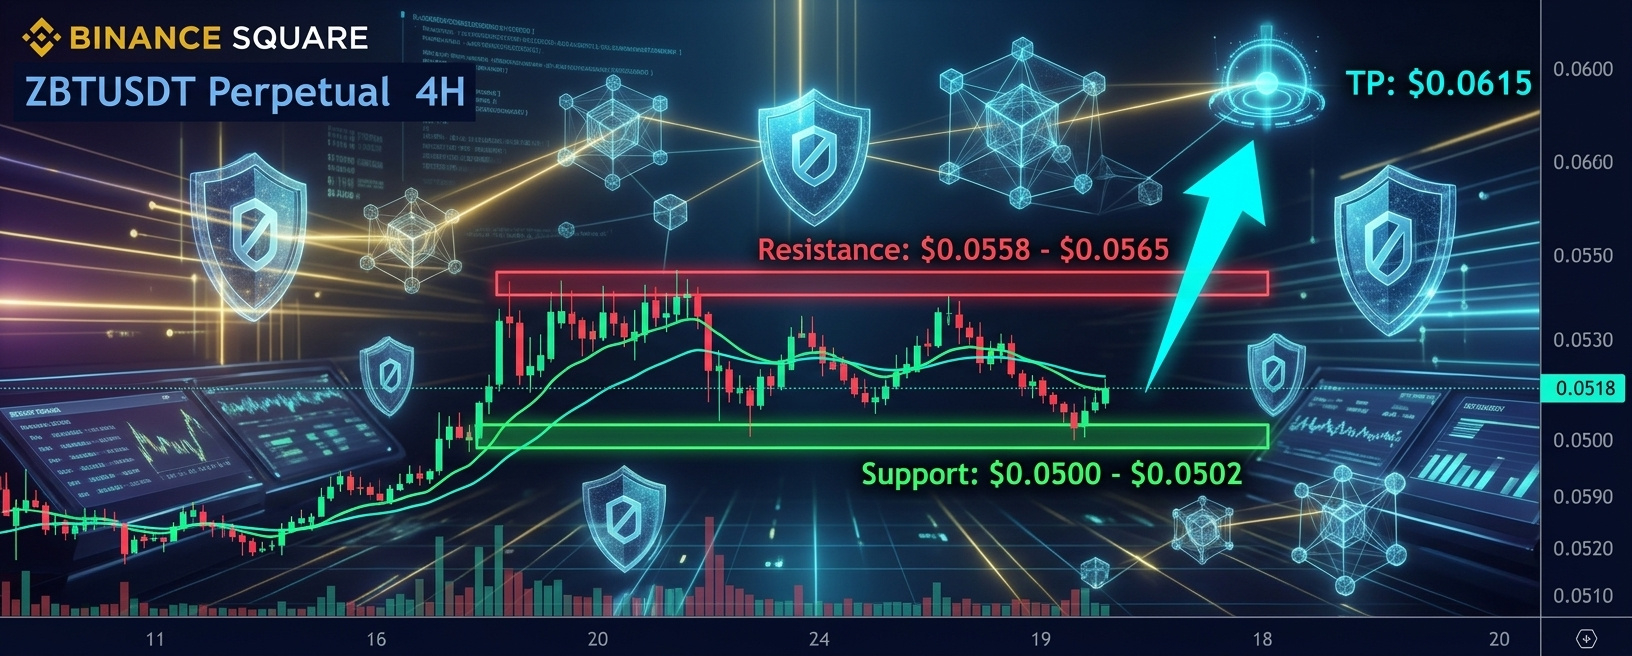
• Key zones. Buyers successfully defended the psychological $0.0500–$0.0502 support base and reclaimed the 4H EMA 20/50 cluster. The immediate hurdle lies at the $0.0558–$0.0565 resistance zone (recent futures high).
Trade Setup (Long):
• Entry: $0.0505 – $0.0518 (near support / EMA retest) or on a confirmed breakout above $0.0565.
• Targets (Take Profit): TP1 — $0.0560, TP2 — $0.0615 (+18% from current levels).
• Stop Loss: Below $0.0488 (invalidation if $0.0500 support fails).
What’s your play on $ZBT right now: targeting a breakout toward $0.0615 or waiting for another $0.0500 retest? Drop a like and share your thoughts in the comments! 🔥👇
Not financial advice. Always do your own research (DYOR).
#ZBT #ZBTUSDT #ZEROBASE #BinanceSquare #CryptoAnalysis #Altcoins #ZK #Trading #DYOR
{spot}(ZBTUSDT)
$ZBT (ZEROBASE): Deep Dive into ZK Infrastructure & Bounce Setup 🔍📊
$ZBT
ZEROBASE ($ZBT ) is holding steady around $0.0518 (+2.78% in 24h) after bouncing cleanly off its daily low of $0.0502. While large caps remain range-bound, speculative interest is rotating back into low-cap infrastructure plays, highlighted by surging futures activity.
Fundamental Snapshot:
• Real-time ZK + TEE computing. ZEROBASE builds a decentralized zero-knowledge prover network combining ZK proofs with Trusted Execution Environments (TEE) for institutional DeFi and verifiable AI workloads.
• Tokenomics & valuation. With a market cap near $18.8M (364.1M ZBT circulating out of 1B total supply), $ZBT sits in the low-cap infrastructure tier, giving it strong upside sensitivity when liquidity rotates into altcoins.
Derivatives & Technical Picture (4H):
• Futures-driven momentum. 24-hour volume on ZBT/USDT perpetuals surpassed $8.3M, significantly outpacing spot turnover. Elevated derivatives volume creates a thin order book prone to sharp short squeezes once key resistance levels break.
• Key zones. Buyers successfully defended the psychological $0.0500–$0.0502 support base and reclaimed the 4H EMA 20/50 cluster. The immediate hurdle lies at the $0.0558–$0.0565 resistance zone (recent futures high).
Trade Setup (Long):
• Entry: $0.0505 – $0.0518 (near support / EMA retest) or on a confirmed breakout above $0.0565.
• Targets (Take Profit): TP1 — $0.0560, TP2 — $0.0615 (+18% from current levels).
• Stop Loss: Below $0.0488 (invalidation if $0.0500 support fails).
What’s your play on $ZBT right now: targeting a breakout toward $0.0615 or waiting for another $0.0500 retest? Drop a like and share your thoughts in the comments! 🔥👇
Not financial advice. Always do your own research (DYOR).
#ZBT #ZBTUSDT #ZEROBASE #BinanceSquare #CryptoAnalysis #Altcoins #ZK #Trading #DYOR
ZEROBASE ($ZBT ) is holding steady around $0.0518 (+2.78% in 24h) after bouncing cleanly off its daily low of $0.0502. While large caps remain range-bound, speculative interest is rotating back into low-cap infrastructure plays, highlighted by surging futures activity.
Fundamental Snapshot:
• Real-time ZK + TEE computing. ZEROBASE builds a decentralized zero-knowledge prover network combining ZK proofs with Trusted Execution Environments (TEE) for institutional DeFi and verifiable AI workloads.
• Tokenomics & valuation. With a market cap near $18.8M (364.1M ZBT circulating out of 1B total supply), $ZBT sits in the low-cap infrastructure tier, giving it strong upside sensitivity when liquidity rotates into altcoins.
Derivatives & Technical Picture (4H):
• Futures-driven momentum. 24-hour volume on ZBT/USDT perpetuals surpassed $8.3M, significantly outpacing spot turnover. Elevated derivatives volume creates a thin order book prone to sharp short squeezes once key resistance levels break.
• Key zones. Buyers successfully defended the psychological $0.0500–$0.0502 support base and reclaimed the 4H EMA 20/50 cluster. The immediate hurdle lies at the $0.0558–$0.0565 resistance zone (recent futures high).
Trade Setup (Long):
• Entry: $0.0505 – $0.0518 (near support / EMA retest) or on a confirmed breakout above $0.0565.
• Targets (Take Profit): TP1 — $0.0560, TP2 — $0.0615 (+18% from current levels).
• Stop Loss: Below $0.0488 (invalidation if $0.0500 support fails).
What’s your play on $ZBT right now: targeting a breakout toward $0.0615 or waiting for another $0.0500 retest? Drop a like and share your thoughts in the comments! 🔥👇
Not financial advice. Always do your own research (DYOR).
#ZBT #ZBTUSDT #ZEROBASE #BinanceSquare #CryptoAnalysis #Altcoins #ZK #Trading #DYOR
69
$RIVER My RIVER lottery ticket hasn’t hit yet... and honestly, I’m totally chill! 🎟️😅
Threw a small bag into RIVER on spot thinking, "What if this pulls a massive pump?" The chart isn't quite cooperating yet, but that’s the true beauty of spot trading:
• No expiration timer ticking down.
• No margin calls or liquidations on a random wick.
• The coins just sit safely in my wallet waiting for their moment while I sip my coffee. ☕️😎
On futures, I’d be stressed out three times over — on spot, I’m simply a "long-term investor" holding a lottery ticket with zero expiration date!
What "no-expiration lottery tickets" are sitting in your spot bag right now? Drop them in the comments! 👇😂
$RIVER My RIVER lottery ticket hasn’t hit yet... and honestly, I’m totally chill! 🎟️😅
Threw a small bag into RIVER on spot thinking, "What if this pulls a massive pump?" The chart isn't quite cooperating yet, but that’s the true beauty of spot trading:
• No expiration timer ticking down.
• No margin calls or liquidations on a random wick.
• The coins just sit safely in my wallet waiting for their moment while I sip my coffee. ☕️😎
On futures, I’d be stressed out three times over — on spot, I’m simply a "long-term investor" holding a lottery ticket with zero expiration date!
What "no-expiration lottery tickets" are sitting in your spot bag right now? Drop them in the comments! 👇😂
Threw a small bag into RIVER on spot thinking, "What if this pulls a massive pump?" The chart isn't quite cooperating yet, but that’s the true beauty of spot trading:
• No expiration timer ticking down.
• No margin calls or liquidations on a random wick.
• The coins just sit safely in my wallet waiting for their moment while I sip my coffee. ☕️😎
On futures, I’d be stressed out three times over — on spot, I’m simply a "long-term investor" holding a lottery ticket with zero expiration date!
What "no-expiration lottery tickets" are sitting in your spot bag right now? Drop them in the comments! 👇😂
2
3
280
Article
A Hidden Gem Before December: Why Is Everyone Silent About the Telcoin ($TEL) Mainnet Launch? 📡🚀$BTC $ETH $SOL
While 99% of the Binance Square feed is crowded with Bitcoin price action, the Fear & Greed Index, and the upcoming December 9 Fed meeting, one of the most underrated infrastructure launches of late 2026 is quietly approaching.
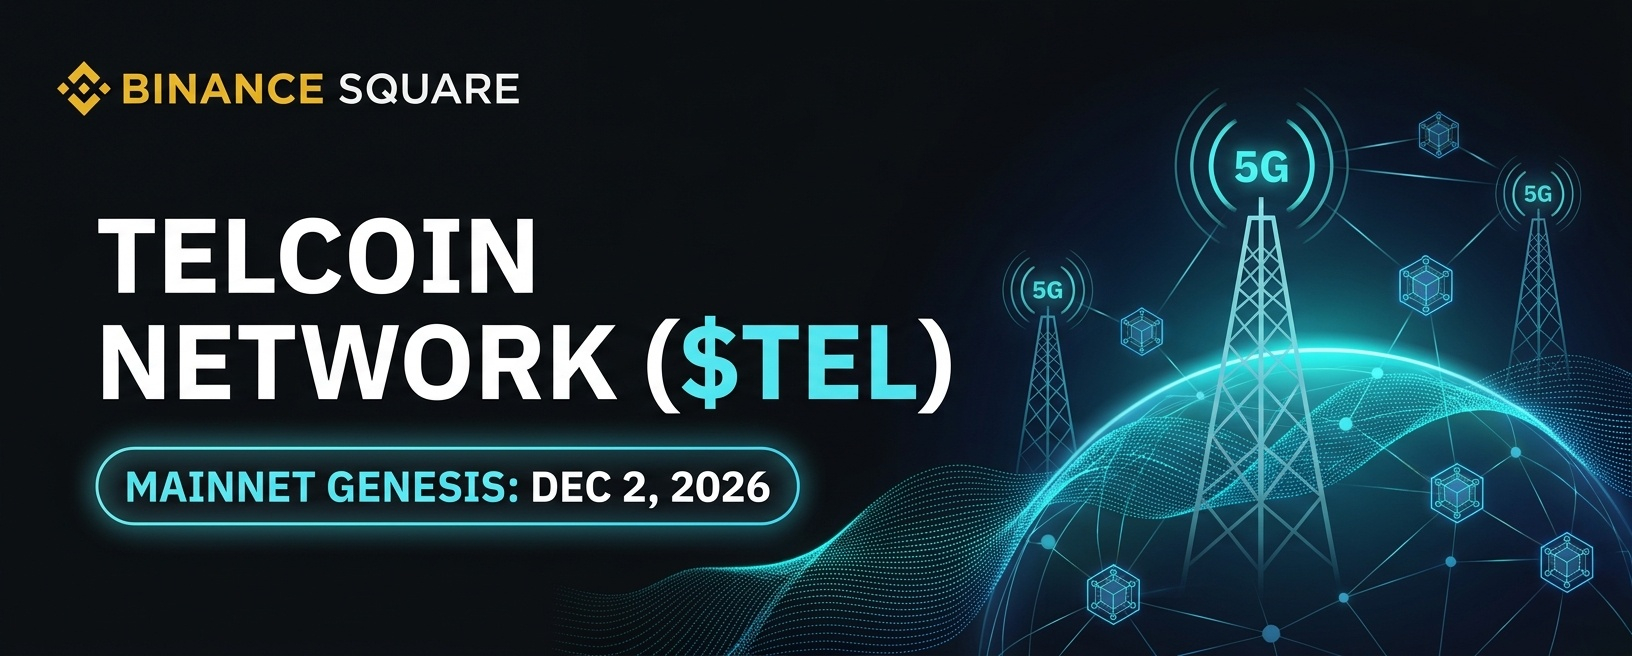
Telcoin ($TEL) has officially completed its code freeze (November 16) and entered the final stretch ahead of launching its own Layer-1 blockchain, Telcoin Network:
• December 2, 2026 — Mainnet Genesis block generation.
• Mid-December — Full public launch.
Why Could This Event Be an Explosive Catalyst?
• A real bridge between telecom and DeFi. Unlike dozens of empty Layer-1 networks, Telcoin works closely with the global mobile operator association (GSMA). The network enables sending stablecoins and digital assets directly via mobile phone numbers through telecom carrier infrastructure.
• Token transformation. With its own mainnet going live, $TEL evolves from a standard ERC-20 token into a native Layer-1 coin required for gas fees, validator staking (operated by telecom companies themselves), and ecosystem settlements.
• The quiet-market advantage. Amid the broader market correction, most retail traders missed the confirmed launch timeline. Historically, confirmed mainnet transitions occurring during low-hype periods trigger the sharpest repricings once liquidity rotates back.
What Should Traders Watch?
Over the next two weeks leading up to December 2, the market will gradually start pricing in the Genesis launch. Keep a close eye on trading volume spikes and how $TEL reacts as soon as BTC shows signs of stabilization.
Are you tracking projects at the intersection of telecom and blockchain, or keeping your focus strictly on large caps right now? Drop a like, share your thoughts in the comments, and let’s get an active discussion going! 🔥👇
Not financial advice. Always do your own research (DYOR).
#TEL #Telcoin #Altcoins #Layer1 #DeFi #CryptoNews #BinanceSquare #Web3 #DYOR
A Hidden Gem Before December: Why Is Everyone Silent About the Telcoin ($TEL) Mainnet Launch? 📡🚀
$BTC $ETH $SOL
While 99% of the Binance Square feed is crowded with Bitcoin price action, the Fear & Greed Index, and the upcoming December 9 Fed meeting, one of the most underrated infrastructure launches of late 2026 is quietly approaching.
Telcoin ($TEL) has officially completed its code freeze (November 16) and entered the final stretch ahead of launching its own Layer-1 blockchain, Telcoin Network:
• December 2, 2026 — Mainnet Genesis block generation.
• Mid-December — Full public launch.
Why Could This Event Be an Explosive Catalyst?
• A real bridge between telecom and DeFi. Unlike dozens of empty Layer-1 networks, Telcoin works closely with the global mobile operator association (GSMA). The network enables sending stablecoins and digital assets directly via mobile phone numbers through telecom carrier infrastructure.
• Token transformation. With its own mainnet going live, $TEL evolves from a standard ERC-20 token into a native Layer-1 coin required for gas fees, validator staking (operated by telecom companies themselves), and ecosystem settlements.
• The quiet-market advantage. Amid the broader market correction, most retail traders missed the confirmed launch timeline. Historically, confirmed mainnet transitions occurring during low-hype periods trigger the sharpest repricings once liquidity rotates back.
What Should Traders Watch?
Over the next two weeks leading up to December 2, the market will gradually start pricing in the Genesis launch. Keep a close eye on trading volume spikes and how $TEL reacts as soon as BTC shows signs of stabilization.
Are you tracking projects at the intersection of telecom and blockchain, or keeping your focus strictly on large caps right now? Drop a like, share your thoughts in the comments, and let’s get an active discussion going! 🔥👇
Not financial advice. Always do your own research (DYOR).
#TEL #Telcoin #Altcoins #Layer1 #DeFi #CryptoNews #BinanceSquare #Web3 #DYOR
While 99% of the Binance Square feed is crowded with Bitcoin price action, the Fear & Greed Index, and the upcoming December 9 Fed meeting, one of the most underrated infrastructure launches of late 2026 is quietly approaching.
Telcoin ($TEL) has officially completed its code freeze (November 16) and entered the final stretch ahead of launching its own Layer-1 blockchain, Telcoin Network:
• December 2, 2026 — Mainnet Genesis block generation.
• Mid-December — Full public launch.
Why Could This Event Be an Explosive Catalyst?
• A real bridge between telecom and DeFi. Unlike dozens of empty Layer-1 networks, Telcoin works closely with the global mobile operator association (GSMA). The network enables sending stablecoins and digital assets directly via mobile phone numbers through telecom carrier infrastructure.
• Token transformation. With its own mainnet going live, $TEL evolves from a standard ERC-20 token into a native Layer-1 coin required for gas fees, validator staking (operated by telecom companies themselves), and ecosystem settlements.
• The quiet-market advantage. Amid the broader market correction, most retail traders missed the confirmed launch timeline. Historically, confirmed mainnet transitions occurring during low-hype periods trigger the sharpest repricings once liquidity rotates back.
What Should Traders Watch?
Over the next two weeks leading up to December 2, the market will gradually start pricing in the Genesis launch. Keep a close eye on trading volume spikes and how $TEL reacts as soon as BTC shows signs of stabilization.
Are you tracking projects at the intersection of telecom and blockchain, or keeping your focus strictly on large caps right now? Drop a like, share your thoughts in the comments, and let’s get an active discussion going! 🔥👇
Not financial advice. Always do your own research (DYOR).
#TEL #Telcoin #Altcoins #Layer1 #DeFi #CryptoNews #BinanceSquare #Web3 #DYOR
106

Article
A Quiet Revolution in DeFi: Why Did Polymarket Drop Binance Candles for Chainlink? 🔄📊$BTC $LINK $BNB
While the broader market watches Bitcoin hover around $64,000–$65,000 with the Fear & Greed Index deep in extreme fear, a major Web3 infrastructure shift just happened under the radar — one that directly changes the game for algorithmic traders.
Leading decentralized prediction platform Polymarket officially completed migrating its international hourly and daily crypto markets (Up/Down) from direct Binance spot candles to Chainlink Data Streams.
What Changed and Why Does It Matter?
• Shift to aggregated pricing. Previously, hourly and daily Polymarket outcomes were settled based on the open and close of 1-minute or 1-hour BTC/USDT candles on Binance. Now, settlement uses Chainlink’s aggregated 60-second time-weighted average price (USD TWAP-60s), matching how 5-minute and 15-minute contracts already operate.
• Protection against last-second spikes. Relying on a single order book — even on the world’s most liquid exchange — always carried the risk of sudden last-second volatility flipping a contract outcome. Chainlink’s aggregated feed smooths out those spikes and keeps settlements neutral.
• New rules for trading bots. Tie-breaker logic in daily contracts has also been updated: exact price matches now resolve to the Up side. Algorithmic traders using PolyBolt have until November 30 to migrate their systems to Chainlink APIs.
Binance’s Role Remains Fundamental
It is important to note that this update does not diminish Binance’s market leadership in any way. On the contrary, Binance’s unmatched liquidity and benchmark price discovery across spot and futures markets still form the core backbone of global crypto pricing — the exact data that market makers and Chainlink’s own aggregators rely on. For Chainlink ($LINK), this is another strong validation as the leading DeFi oracle, while for Binance, it proves once again that its ecosystem remains the foundation of the entire crypto industry.
What do you think: is shifting DeFi protocols from direct exchange feeds to aggregated oracles a win for security, or does it make things harder for everyday traders? Drop a like, share your thoughts in the comments, and let’s get an active discussion going! 🔥👇
Not financial advice. Always do your own research (DYOR).
#Chainlink #LINK #Binance #Polymarket
A Quiet Revolution in DeFi: Why Did Polymarket Drop Binance Candles for Chainlink? 🔄📊
$BTC $LINK $BNB
While the broader market watches Bitcoin hover around $64,000–$65,000 with the Fear & Greed Index deep in extreme fear, a major Web3 infrastructure shift just happened under the radar — one that directly changes the game for algorithmic traders.
Leading decentralized prediction platform Polymarket officially completed migrating its international hourly and daily crypto markets (Up/Down) from direct Binance spot candles to Chainlink Data Streams.
What Changed and Why Does It Matter?
• Shift to aggregated pricing. Previously, hourly and daily Polymarket outcomes were settled based on the open and close of 1-minute or 1-hour BTC/USDT candles on Binance. Now, settlement uses Chainlink’s aggregated 60-second time-weighted average price (USD TWAP-60s), matching how 5-minute and 15-minute contracts already operate.
• Protection against last-second spikes. Relying on a single order book — even on the world’s most liquid exchange — always carried the risk of sudden last-second volatility flipping a contract outcome. Chainlink’s aggregated feed smooths out those spikes and keeps settlements neutral.
• New rules for trading bots. Tie-breaker logic in daily contracts has also been updated: exact price matches now resolve to the Up side. Algorithmic traders using PolyBolt have until November 30 to migrate their systems to Chainlink APIs.
Binance’s Role Remains Fundamental
It is important to note that this update does not diminish Binance’s market leadership in any way. On the contrary, Binance’s unmatched liquidity and benchmark price discovery across spot and futures markets still form the core backbone of global crypto pricing — the exact data that market makers and Chainlink’s own aggregators rely on. For Chainlink ($LINK ), this is another strong validation as the leading DeFi oracle, while for Binance, it proves once again that its ecosystem remains the foundation of the entire crypto industry.
What do you think: is shifting DeFi protocols from direct exchange feeds to aggregated oracles a win for security, or does it make things harder for everyday traders? Drop a like, share your thoughts in the comments, and let’s get an active discussion going! 🔥👇
Not financial advice. Always do your own research (DYOR).
#Chainlink #LINK #Binance #Polymarket
While the broader market watches Bitcoin hover around $64,000–$65,000 with the Fear & Greed Index deep in extreme fear, a major Web3 infrastructure shift just happened under the radar — one that directly changes the game for algorithmic traders.
Leading decentralized prediction platform Polymarket officially completed migrating its international hourly and daily crypto markets (Up/Down) from direct Binance spot candles to Chainlink Data Streams.
What Changed and Why Does It Matter?
• Shift to aggregated pricing. Previously, hourly and daily Polymarket outcomes were settled based on the open and close of 1-minute or 1-hour BTC/USDT candles on Binance. Now, settlement uses Chainlink’s aggregated 60-second time-weighted average price (USD TWAP-60s), matching how 5-minute and 15-minute contracts already operate.
• Protection against last-second spikes. Relying on a single order book — even on the world’s most liquid exchange — always carried the risk of sudden last-second volatility flipping a contract outcome. Chainlink’s aggregated feed smooths out those spikes and keeps settlements neutral.
• New rules for trading bots. Tie-breaker logic in daily contracts has also been updated: exact price matches now resolve to the Up side. Algorithmic traders using PolyBolt have until November 30 to migrate their systems to Chainlink APIs.
Binance’s Role Remains Fundamental
It is important to note that this update does not diminish Binance’s market leadership in any way. On the contrary, Binance’s unmatched liquidity and benchmark price discovery across spot and futures markets still form the core backbone of global crypto pricing — the exact data that market makers and Chainlink’s own aggregators rely on. For Chainlink ($LINK ), this is another strong validation as the leading DeFi oracle, while for Binance, it proves once again that its ecosystem remains the foundation of the entire crypto industry.
What do you think: is shifting DeFi protocols from direct exchange feeds to aggregated oracles a win for security, or does it make things harder for everyday traders? Drop a like, share your thoughts in the comments, and let’s get an active discussion going! 🔥👇
Not financial advice. Always do your own research (DYOR).
#Chainlink #LINK #Binance #Polymarket
93
Article
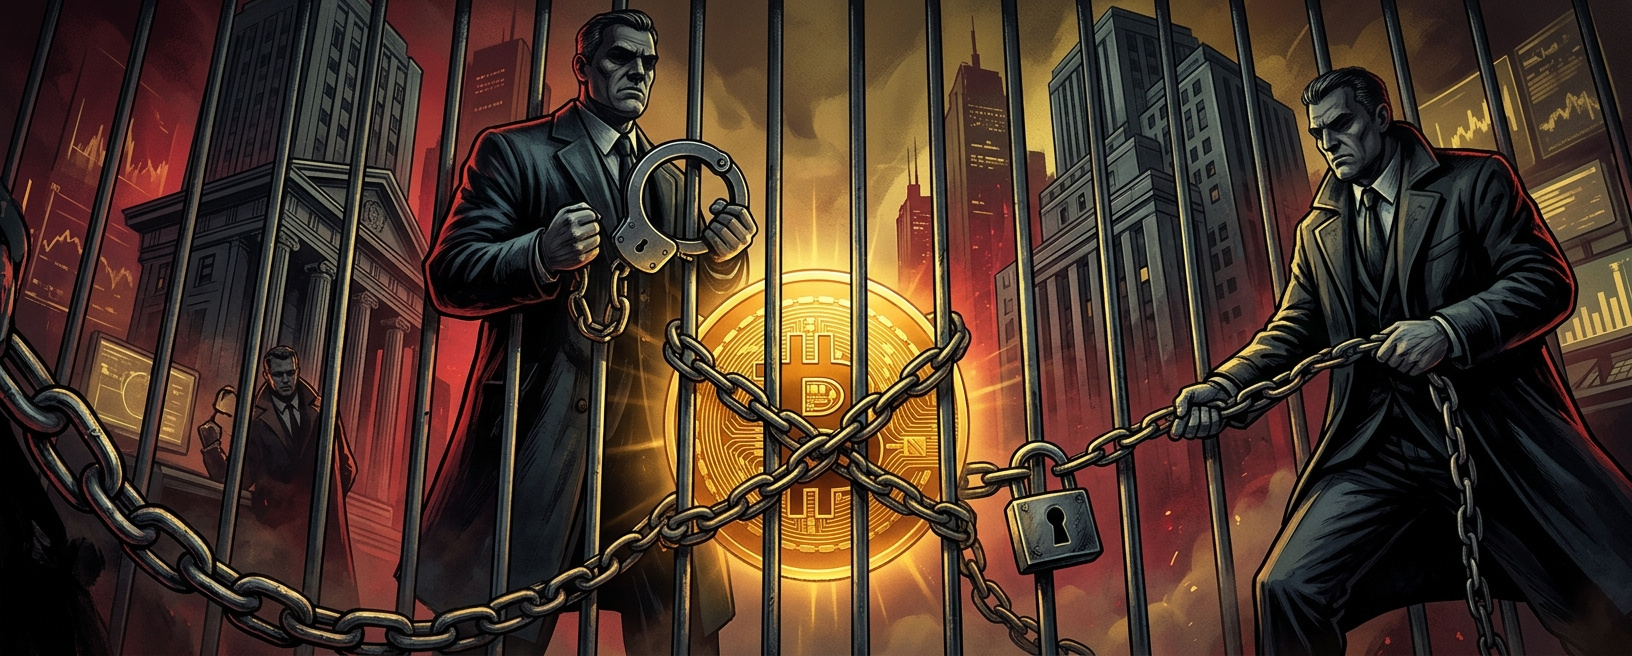
Banks Are Taking Over Crypto: Why Is This Bad News for Traders? 🏦⚠️$BTC $ETH $BNB
Major global banks have already integrated crypto services by over 30% — from direct in-app trading to institutional custody. At first glance, this looks like a victory for mass adoption, but in reality, the arrival of Wall Street and banking giants is changing the rules of the game against everyday users.
4 Major Negative Consequences of Banking Expansion:
• Loss of anonymity and total control. Banks push trading into a strict KYC/AML perimeter. Every transaction is scanned by compliance algorithms, coins are labeled as "clean" or "dirty," and funds coming from non-custodial wallets or DEXs increasingly face freezes until their origin is verified.
• Killing volatility and massive gains. Institutions are turning Bitcoin and top altcoins into boring stock-index clones (like the S&P 500). Instead of explosive pumps, the market gets sluggish sideways chop where making big spot returns becomes much harder.
• Manipulation via derivatives and ETFs. Managing billions in flows through spot ETFs and futures gives big players powerful levers over price action. Aggressive stop-loss hunts and options-expiration squeezes are becoming the norm, wiping out retail traders.
• Centralization instead of freedom. Crypto was originally created as an alternative to the banking system. Today, primary liquidity and coin custody are once again concentrating in the hands of the very financial corporations the industry tried to escape.
Bottom Line:
Institutional adoption brings capital into the market, but it takes away what matters most — freedom, decentralization, and old-school upside. Crypto is slowly turning into just another branch of traditional finance with strict rules and taxes.
How do you view banks entering crypto: a long-awaited bull catalyst, or the end of true decentralization? Hit like, share this post, and drop your honest opinion in the comments — let’s get an active discussion going! 🔥👇
{spot}(BTCUSDT)
{spot}(ETHUSDT)
{spot}(BNBUSDT)
#crypto #banks #DeFi #decentralization #BinanceSquare
Banks Are Taking Over Crypto: Why Is This Bad News for Traders? 🏦⚠️
$BTC $ETH $BNB
Major global banks have already integrated crypto services by over 30% — from direct in-app trading to institutional custody. At first glance, this looks like a victory for mass adoption, but in reality, the arrival of Wall Street and banking giants is changing the rules of the game against everyday users.
4 Major Negative Consequences of Banking Expansion:
• Loss of anonymity and total control. Banks push trading into a strict KYC/AML perimeter. Every transaction is scanned by compliance algorithms, coins are labeled as "clean" or "dirty," and funds coming from non-custodial wallets or DEXs increasingly face freezes until their origin is verified.
• Killing volatility and massive gains. Institutions are turning Bitcoin and top altcoins into boring stock-index clones (like the S&P 500). Instead of explosive pumps, the market gets sluggish sideways chop where making big spot returns becomes much harder.
• Manipulation via derivatives and ETFs. Managing billions in flows through spot ETFs and futures gives big players powerful levers over price action. Aggressive stop-loss hunts and options-expiration squeezes are becoming the norm, wiping out retail traders.
• Centralization instead of freedom. Crypto was originally created as an alternative to the banking system. Today, primary liquidity and coin custody are once again concentrating in the hands of the very financial corporations the industry tried to escape.
Bottom Line:
Institutional adoption brings capital into the market, but it takes away what matters most — freedom, decentralization, and old-school upside. Crypto is slowly turning into just another branch of traditional finance with strict rules and taxes.
How do you view banks entering crypto: a long-awaited bull catalyst, or the end of true decentralization? Hit like, share this post, and drop your honest opinion in the comments — let’s get an active discussion going! 🔥👇
#crypto #banks #DeFi #decentralization #BinanceSquare
Major global banks have already integrated crypto services by over 30% — from direct in-app trading to institutional custody. At first glance, this looks like a victory for mass adoption, but in reality, the arrival of Wall Street and banking giants is changing the rules of the game against everyday users.
4 Major Negative Consequences of Banking Expansion:
• Loss of anonymity and total control. Banks push trading into a strict KYC/AML perimeter. Every transaction is scanned by compliance algorithms, coins are labeled as "clean" or "dirty," and funds coming from non-custodial wallets or DEXs increasingly face freezes until their origin is verified.
• Killing volatility and massive gains. Institutions are turning Bitcoin and top altcoins into boring stock-index clones (like the S&P 500). Instead of explosive pumps, the market gets sluggish sideways chop where making big spot returns becomes much harder.
• Manipulation via derivatives and ETFs. Managing billions in flows through spot ETFs and futures gives big players powerful levers over price action. Aggressive stop-loss hunts and options-expiration squeezes are becoming the norm, wiping out retail traders.
• Centralization instead of freedom. Crypto was originally created as an alternative to the banking system. Today, primary liquidity and coin custody are once again concentrating in the hands of the very financial corporations the industry tried to escape.
Bottom Line:
Institutional adoption brings capital into the market, but it takes away what matters most — freedom, decentralization, and old-school upside. Crypto is slowly turning into just another branch of traditional finance with strict rules and taxes.
How do you view banks entering crypto: a long-awaited bull catalyst, or the end of true decentralization? Hit like, share this post, and drop your honest opinion in the comments — let’s get an active discussion going! 🔥👇
#crypto #banks #DeFi #decentralization #BinanceSquare
62
·
--
Bullish
{future}(IRYSUSDT)
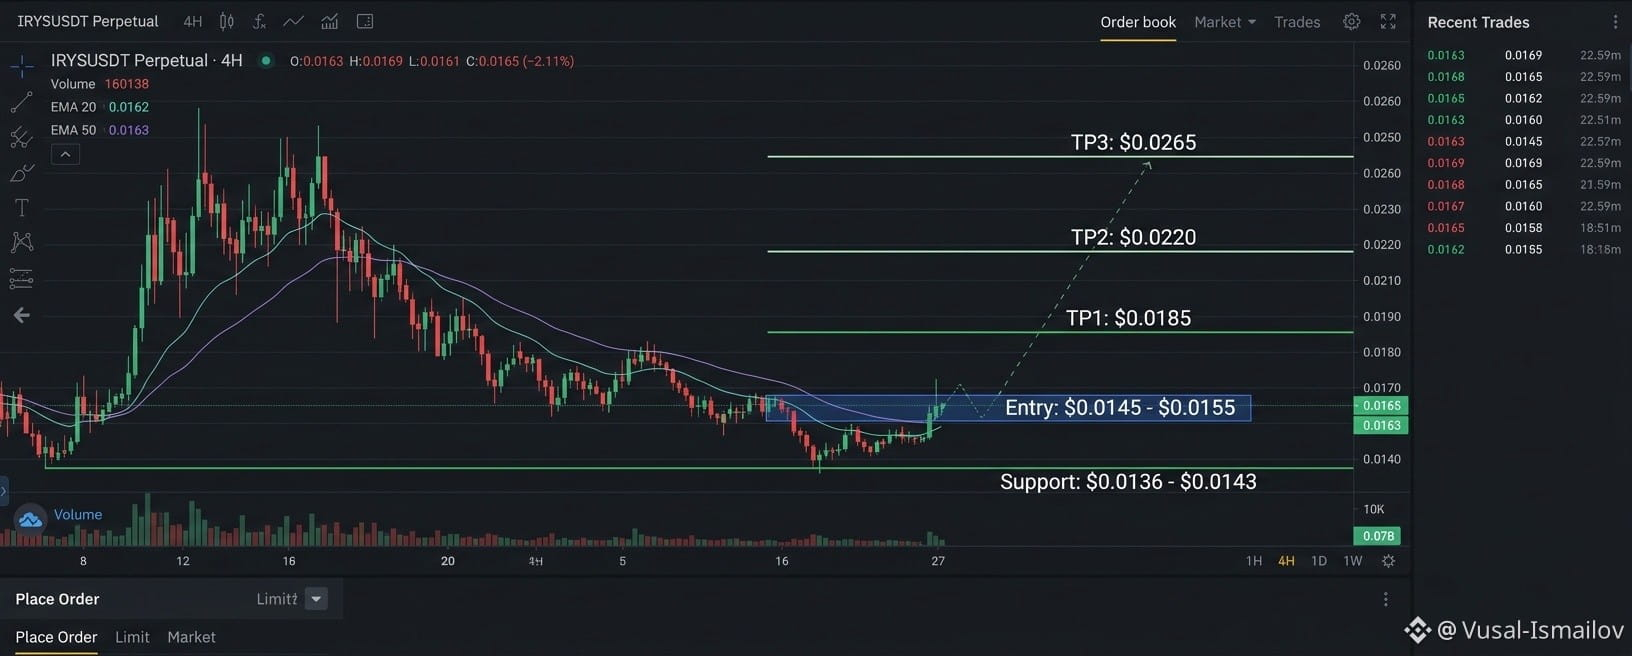
$IRYS IRYS/USDT (4H): Bullish Bounce Setup 🚀📈
Buyers are strongly defending the $0.0136–$0.0143 support zone right around EMA 20/50 ($0.0162–$0.0163).
• Entry: $0.0145 – $0.0155
• TP1: $0.0185 (+23%)
• TP2: $0.0220 (+46%)
• TP3: $0.0265 (+76%)
• Stop Loss: $0.0132
Do you see IRYS breaking above $0.0200 soon? 👇
$IRYS IRYS/USDT (4H): Bullish Bounce Setup 🚀📈
Buyers are strongly defending the $0.0136–$0.0143 support zone right around EMA 20/50 ($0.0162–$0.0163).
• Entry: $0.0145 – $0.0155
• TP1: $0.0185 (+23%)
• TP2: $0.0220 (+46%)
• TP3: $0.0265 (+76%)
• Stop Loss: $0.0132
Do you see IRYS breaking above $0.0200 soon? 👇
Buyers are strongly defending the $0.0136–$0.0143 support zone right around EMA 20/50 ($0.0162–$0.0163).
• Entry: $0.0145 – $0.0155
• TP1: $0.0185 (+23%)
• TP2: $0.0220 (+46%)
• TP3: $0.0265 (+76%)
• Stop Loss: $0.0132
Do you see IRYS breaking above $0.0200 soon? 👇
1
1
437
$HUMA HUMA/USDT: Bullish Momentum & Entry Setup 🚀💸
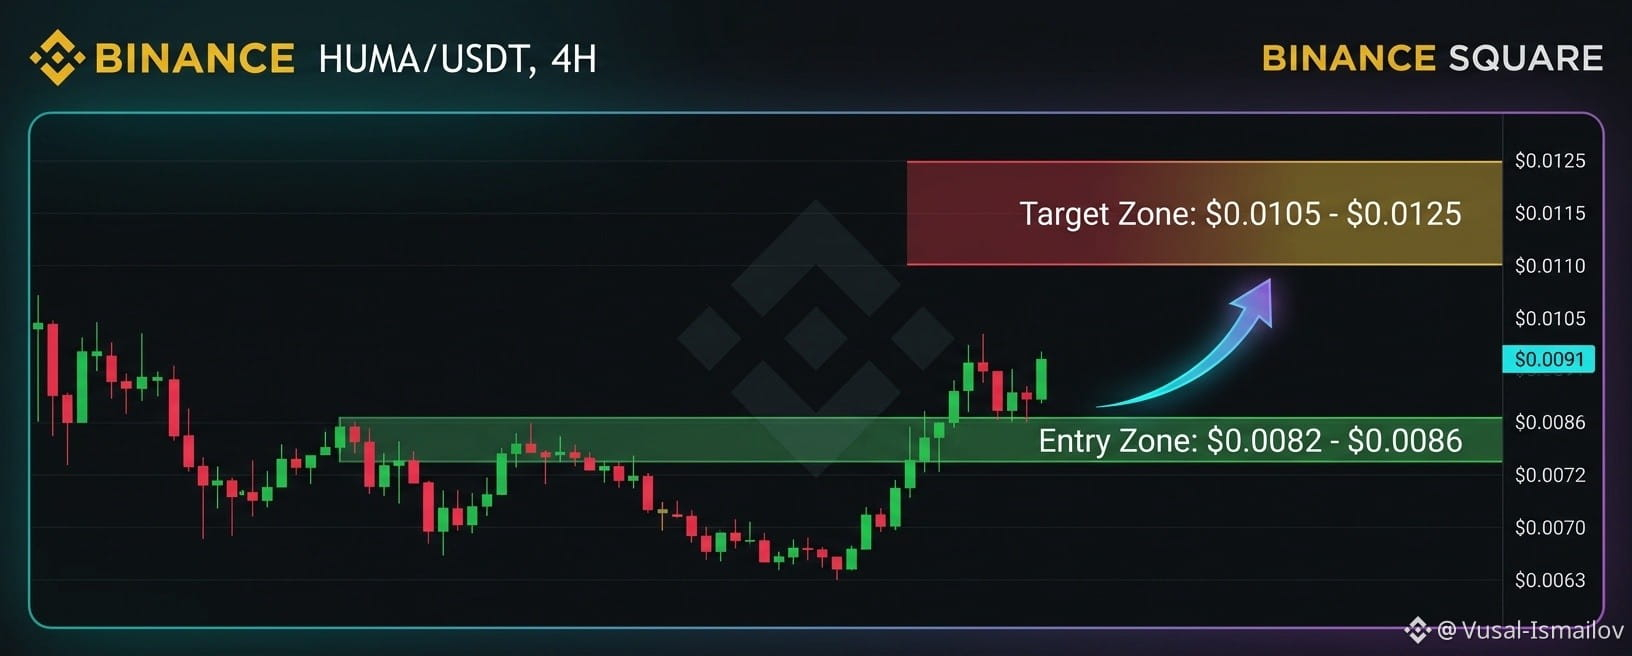
Huma Finance (HUMA) — a leading PayFi protocol — bounced strongly off its local bottom ($0.00625) by over 20% on surging volume, holding steady around $0.0091. Buyer demand is returning, forming a solid setup for further upside.
Trade Setup (Long):
• Entry Zone: $0.0082 – $0.0086 (on a retest of broken resistance) or market entry while holding above $0.0088.
• Targets (Take Profit): TP1 — $0.0105, TP2 — $0.0115, TP3 — $0.0125.
• Stop Loss: Below $0.0076 (invalidation of the bullish setup).
Real-world Web3 payments are gaining traction, and HUMA remains one of the top contenders in the space.
Do you see HUMA breaking above $0.0105 soon? Drop your thoughts below! 👇
$HUMA HUMA/USDT: Bullish Momentum & Entry Setup 🚀💸
Huma Finance (HUMA) — a leading PayFi protocol — bounced strongly off its local bottom ($0.00625) by over 20% on surging volume, holding steady around $0.0091. Buyer demand is returning, forming a solid setup for further upside.
Trade Setup (Long):
• Entry Zone: $0.0082 – $0.0086 (on a retest of broken resistance) or market entry while holding above $0.0088.
• Targets (Take Profit): TP1 — $0.0105, TP2 — $0.0115, TP3 — $0.0125.
• Stop Loss: Below $0.0076 (invalidation of the bullish setup).
Real-world Web3 payments are gaining traction, and HUMA remains one of the top contenders in the space.
Do you see HUMA breaking above $0.0105 soon? Drop your thoughts below! 👇
Huma Finance (HUMA) — a leading PayFi protocol — bounced strongly off its local bottom ($0.00625) by over 20% on surging volume, holding steady around $0.0091. Buyer demand is returning, forming a solid setup for further upside.
Trade Setup (Long):
• Entry Zone: $0.0082 – $0.0086 (on a retest of broken resistance) or market entry while holding above $0.0088.
• Targets (Take Profit): TP1 — $0.0105, TP2 — $0.0115, TP3 — $0.0125.
• Stop Loss: Below $0.0076 (invalidation of the bullish setup).
Real-world Web3 payments are gaining traction, and HUMA remains one of the top contenders in the space.
Do you see HUMA breaking above $0.0105 soon? Drop your thoughts below! 👇
335
Article
SOL/USDT: Battle for $70–$75 & Institutional Demand Reversal ⚡️🔍$SOL
{spot}(SOLUSDT)
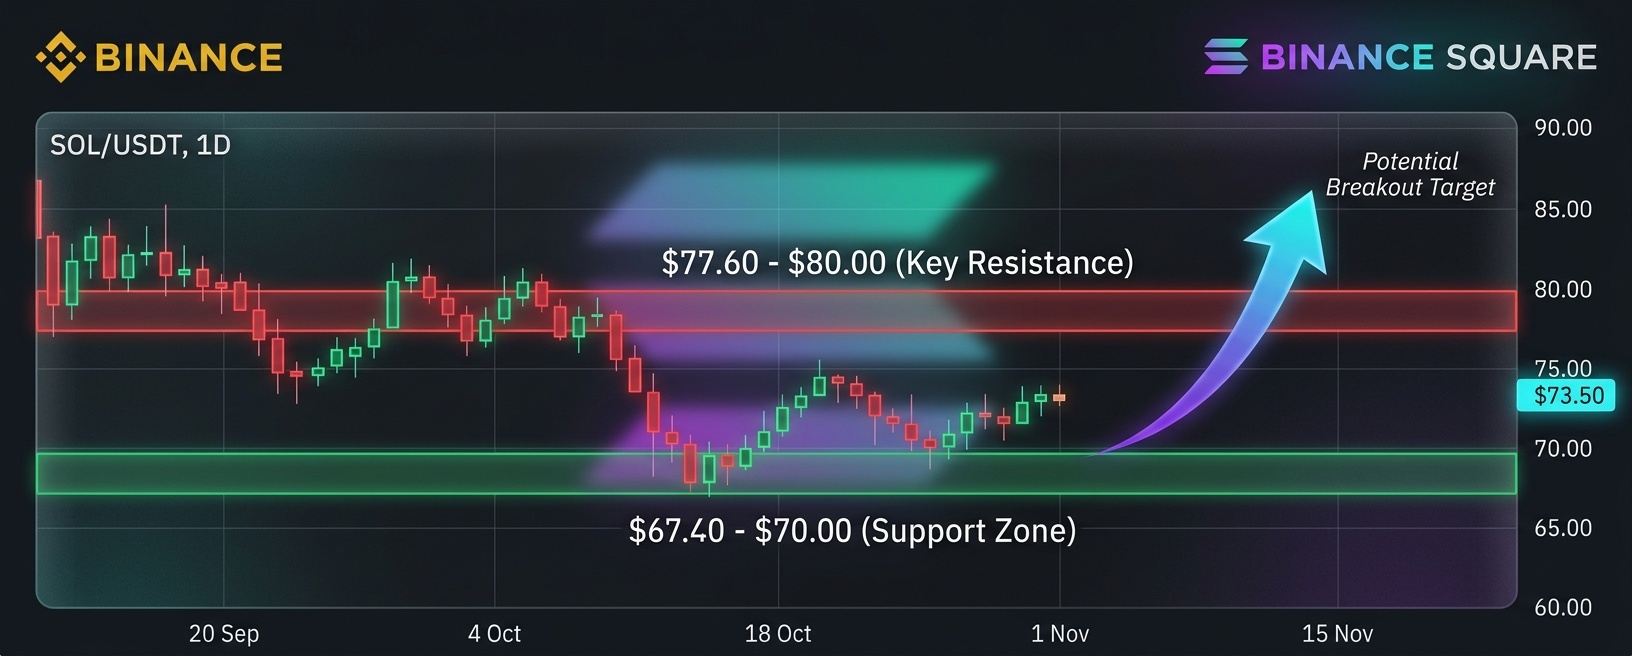
After a prolonged autumn decline from levels above $120 and setting a local low near $67.40–$67.50, Solana (SOL) is trying to find a bottom in the $71.50–$75.00 range. Despite pressure from the broader downtrend, early fundamental and on-chain signs of stabilization emerged this week.
Key Drivers of the Week:
Return of ETF inflows. After three consecutive weeks of capital outflows, spot Solana ETFs recorded their first net inflow of roughly $11.7–$12M, signaling renewed institutional interest at current levels.London Breakpoint conference takeaways. The Solana Foundation announced the acquisition of a controlling stake in CoinGecko to strengthen trading infrastructure, while asset manager Bitwise released a comprehensive report setting a base-case target of $385 (and a bull case of $1,100) for SOL by 2031, driven by the network's leadership in tokenized equities.Futures leverage flush. Derivatives open interest (OI) dropped to 54.3M SOL — the market has cleared excess leverage, reducing the risk of cascading liquidations during bounce attempts.
Technical Picture & Key Levels:
Support Zone ($67.40–$70.00): The primary line of defense for buyers. Holding the psychological $70.00 mark and the weekly low of $67.40 keeps hopes alive for a reversal base. Losing this level opens the door toward $60–$62.Resistance Zone ($77.60–$80.00): The nearest barrier for the current bounce. Only a decisive daily candle close above $80.00 will allow buyers to target key moving averages around $93–$96.
Bottom Line:
In the short term, SOL remains in oversold territory (daily RSI near 28), supporting a technical bounce from $67.50. However, breaking the bearish trend requires consolidating above $78–$80 backed by sustained spot ETF inflows.
How do you view SOL's current levels: looking to buy around $70, or waiting for a $60 test? 👇
«Your support keeps these daily market breakdowns coming! ☕️💛»
Not financial advice. Always do your own research (DYOR).
#solana #SOLUSDT #BinanceSquare #CryptoAnalysis #CryptoMarket
SOL/USDT: Battle for $70–$75 & Institutional Demand Reversal ⚡️🔍
$SOL
After a prolonged autumn decline from levels above $120 and setting a local low near $67.40–$67.50, Solana (SOL) is trying to find a bottom in the $71.50–$75.00 range. Despite pressure from the broader downtrend, early fundamental and on-chain signs of stabilization emerged this week.
Key Drivers of the Week:
Return of ETF inflows. After three consecutive weeks of capital outflows, spot Solana ETFs recorded their first net inflow of roughly $11.7–$12M, signaling renewed institutional interest at current levels.London Breakpoint conference takeaways. The Solana Foundation announced the acquisition of a controlling stake in CoinGecko to strengthen trading infrastructure, while asset manager Bitwise released a comprehensive report setting a base-case target of $385 (and a bull case of $1,100) for SOL by 2031, driven by the network's leadership in tokenized equities.Futures leverage flush. Derivatives open interest (OI) dropped to 54.3M SOL — the market has cleared excess leverage, reducing the risk of cascading liquidations during bounce attempts.
Technical Picture & Key Levels:
Support Zone ($67.40–$70.00): The primary line of defense for buyers. Holding the psychological $70.00 mark and the weekly low of $67.40 keeps hopes alive for a reversal base. Losing this level opens the door toward $60–$62.Resistance Zone ($77.60–$80.00): The nearest barrier for the current bounce. Only a decisive daily candle close above $80.00 will allow buyers to target key moving averages around $93–$96.
Bottom Line:
In the short term, SOL remains in oversold territory (daily RSI near 28), supporting a technical bounce from $67.50. However, breaking the bearish trend requires consolidating above $78–$80 backed by sustained spot ETF inflows.
How do you view SOL's current levels: looking to buy around $70, or waiting for a $60 test? 👇
«Your support keeps these daily market breakdowns coming! ☕️💛»
Not financial advice. Always do your own research (DYOR).
#solana #SOLUSDT #BinanceSquare #CryptoAnalysis #CryptoMarket
After a prolonged autumn decline from levels above $120 and setting a local low near $67.40–$67.50, Solana (SOL) is trying to find a bottom in the $71.50–$75.00 range. Despite pressure from the broader downtrend, early fundamental and on-chain signs of stabilization emerged this week.
Key Drivers of the Week:
Return of ETF inflows. After three consecutive weeks of capital outflows, spot Solana ETFs recorded their first net inflow of roughly $11.7–$12M, signaling renewed institutional interest at current levels.London Breakpoint conference takeaways. The Solana Foundation announced the acquisition of a controlling stake in CoinGecko to strengthen trading infrastructure, while asset manager Bitwise released a comprehensive report setting a base-case target of $385 (and a bull case of $1,100) for SOL by 2031, driven by the network's leadership in tokenized equities.Futures leverage flush. Derivatives open interest (OI) dropped to 54.3M SOL — the market has cleared excess leverage, reducing the risk of cascading liquidations during bounce attempts.
Technical Picture & Key Levels:
Support Zone ($67.40–$70.00): The primary line of defense for buyers. Holding the psychological $70.00 mark and the weekly low of $67.40 keeps hopes alive for a reversal base. Losing this level opens the door toward $60–$62.Resistance Zone ($77.60–$80.00): The nearest barrier for the current bounce. Only a decisive daily candle close above $80.00 will allow buyers to target key moving averages around $93–$96.
Bottom Line:
In the short term, SOL remains in oversold territory (daily RSI near 28), supporting a technical bounce from $67.50. However, breaking the bearish trend requires consolidating above $78–$80 backed by sustained spot ETF inflows.
How do you view SOL's current levels: looking to buy around $70, or waiting for a $60 test? 👇
«Your support keeps these daily market breakdowns coming! ☕️💛»
Not financial advice. Always do your own research (DYOR).
#solana #SOLUSDT #BinanceSquare #CryptoAnalysis #CryptoMarket
4
219
Log in to explore more content
Join global crypto users on Binance Square
⚡️ Get latest and useful information about crypto.
💬 Trusted by the world’s largest crypto exchange.
👍 Discover real insights from verified creators.
Email / Phone number
Trending Topics
BTCRemainsUnderPressureAfterHawkishFOMCMinutes
33,374 views
496 Discussing
FOMC Minutes | Fed Minutes Show Almost All Officials Expect More Rate Hikes, With Some Open to a Larger December Move
Binance News
·45 Likes
·53.8k views
AnthropicToDebutAfter$83IPOPricing
9,649 views
57 Discussing
NvidiaBoardReportedlySplitOverHuang’sReturn
10,276 views
170 Discussing