
#bitcoinbreaksbelow200weekmovingaverage
bitcoinbreaksbelow200weekmovingaverage
Hot
Latest

🚨 THE MOMENT OF TRUTH: BITCOIN TESTS THE 200-WEEK MA 🚨
We are officially testing one of the most critical long-term indicators in crypto. Today, Bitcoin flushed down to the $67,500 zone, directly retesting the 200-Week Moving Average sitting around $67,760 to $67,975.
Here is the unfiltered truth from a professional trader's desk:
📉 The Bear Case: If we print a definitive weekly close below the 200-WMA, the structural uptrend is at risk. The next major support band rests between $66,000 and $67,000, and if that gives way, the final structural floor is $62,300.
📈 The Bull Case: This exact same moving average caught the July sell-off and launched the August rally. Furthermore, the daily RSI is currently deeply oversold (registering at 26). Historically, capitulation wicks below this slow-moving average trap late shorts before a reversal.
The Gameplan:
Do not panic trade intraday noise. A single daily wick means little—the upcoming weekly close is everything. Protect your capital, wait for confirmation, and watch how the market reacts at this line in the sand.
Are you buying this retest or waiting for lower levels? Drop your strategy below. 👇
$BTC $AKE $KGEN
{future}(KGENUSDT)
{future}(AKEUSDT)
{future}(BTCUSDT)
#bitcoinbreaksbelow200weekmovingaverage #BTC #CryptoTrading #BinanceSquare
🚨 THE MOMENT OF TRUTH: BITCOIN TESTS THE 200-WEEK MA 🚨
We are officially testing one of the most critical long-term indicators in crypto. Today, Bitcoin flushed down to the $67,500 zone, directly retesting the 200-Week Moving Average sitting around $67,760 to $67,975.
Here is the unfiltered truth from a professional trader's desk:
📉 The Bear Case: If we print a definitive weekly close below the 200-WMA, the structural uptrend is at risk. The next major support band rests between $66,000 and $67,000, and if that gives way, the final structural floor is $62,300.
📈 The Bull Case: This exact same moving average caught the July sell-off and launched the August rally. Furthermore, the daily RSI is currently deeply oversold (registering at 26). Historically, capitulation wicks below this slow-moving average trap late shorts before a reversal.
The Gameplan:
Do not panic trade intraday noise. A single daily wick means little—the upcoming weekly close is everything. Protect your capital, wait for confirmation, and watch how the market reacts at this line in the sand.
Are you buying this retest or waiting for lower levels? Drop your strategy below. 👇
$BTC $AKE $KGEN
#bitcoinbreaksbelow200weekmovingaverage #BTC #CryptoTrading #BinanceSquare
We are officially testing one of the most critical long-term indicators in crypto. Today, Bitcoin flushed down to the $67,500 zone, directly retesting the 200-Week Moving Average sitting around $67,760 to $67,975.
Here is the unfiltered truth from a professional trader's desk:
📉 The Bear Case: If we print a definitive weekly close below the 200-WMA, the structural uptrend is at risk. The next major support band rests between $66,000 and $67,000, and if that gives way, the final structural floor is $62,300.
📈 The Bull Case: This exact same moving average caught the July sell-off and launched the August rally. Furthermore, the daily RSI is currently deeply oversold (registering at 26). Historically, capitulation wicks below this slow-moving average trap late shorts before a reversal.
The Gameplan:
Do not panic trade intraday noise. A single daily wick means little—the upcoming weekly close is everything. Protect your capital, wait for confirmation, and watch how the market reacts at this line in the sand.
Are you buying this retest or waiting for lower levels? Drop your strategy below. 👇
$BTC $AKE $KGEN
#bitcoinbreaksbelow200weekmovingaverage #BTC #CryptoTrading #BinanceSquare

3
2.7k

·
--
Bearish
Verified
#bitcoinbreaksbelow200weekmovingaverage
🚨 BITCOIN BREAKS BELOW ITS 200-WEEK MOVING AVERAGE (~$68,000) AS DOLLAR TOPS 103 & YIELDS SURGE! 📉⚠️
Bitcoin ($BTC) breached one of its most critical historical trendlines on Friday, November 13, dipping as low as $67,640 – $67,652 and slipping below its 200-week moving average (~$68,000).
Now down roughly 16% over the past month and 17% this quarter, $BTC has erased its post-August gains as tightening global liquidity and rising yields trigger broad cross-asset de-risking.
📌 What Drove the Breakdown Below $68,000?
💵 Dollar & Treasury Yield Spike: The U.S. Dollar Index (DXY) climbed above 103 (a 19-month high since April 2025) while the 10-year Treasury yield hit 5.125%, fueled by rising bets on a 50 bps December Fed rate hike after Tuesday's hot inflation print.
💥 $1.3B+ Liquidation Cascade: Over $1.3 Billion in leveraged crypto futures were wiped out in 24 hours—including $677 Million in Bitcoin longs—accelerating the flush once $70,000 gave way.
$ETH
{future}(ETHUSDT)
📉 On-Chain & Liquidity Drain: Stablecoin supply contracted by $14.2 Billion over the past 30 days, while CryptoQuant’s Bull Score Index dropped to zero, reflecting thin spot demand despite resting buy clusters between $68,000 and $72,500.
$XRP
{future}(XRPUSDT)
📊 Key Technical Scenarios to Watch Before the Weekly Close
Historically, the 200-week moving average has served as a generational bear-market floor—meaning how $BTC finishes the weekly candle matters far more than an intraday wick:
$ZEC
{future}(ZECUSDT)
🔴 Bearish Breakdown (Confirmed Weekly Close Below $68,000): A decisive weekly close below the 200-week MA—especially with weekly RSI slipping under 41.5—opens the door to deeper downside targets at $60,000 and the $57,700 cycle low.
#SpaceXTeslaMergerTalksWouldCombine30220BTC #KoreaDigitalAssetBasicActFinalDraftExpectedEarlyJanuary #CryptoNews #Binance
#bitcoinbreaksbelow200weekmovingaverage
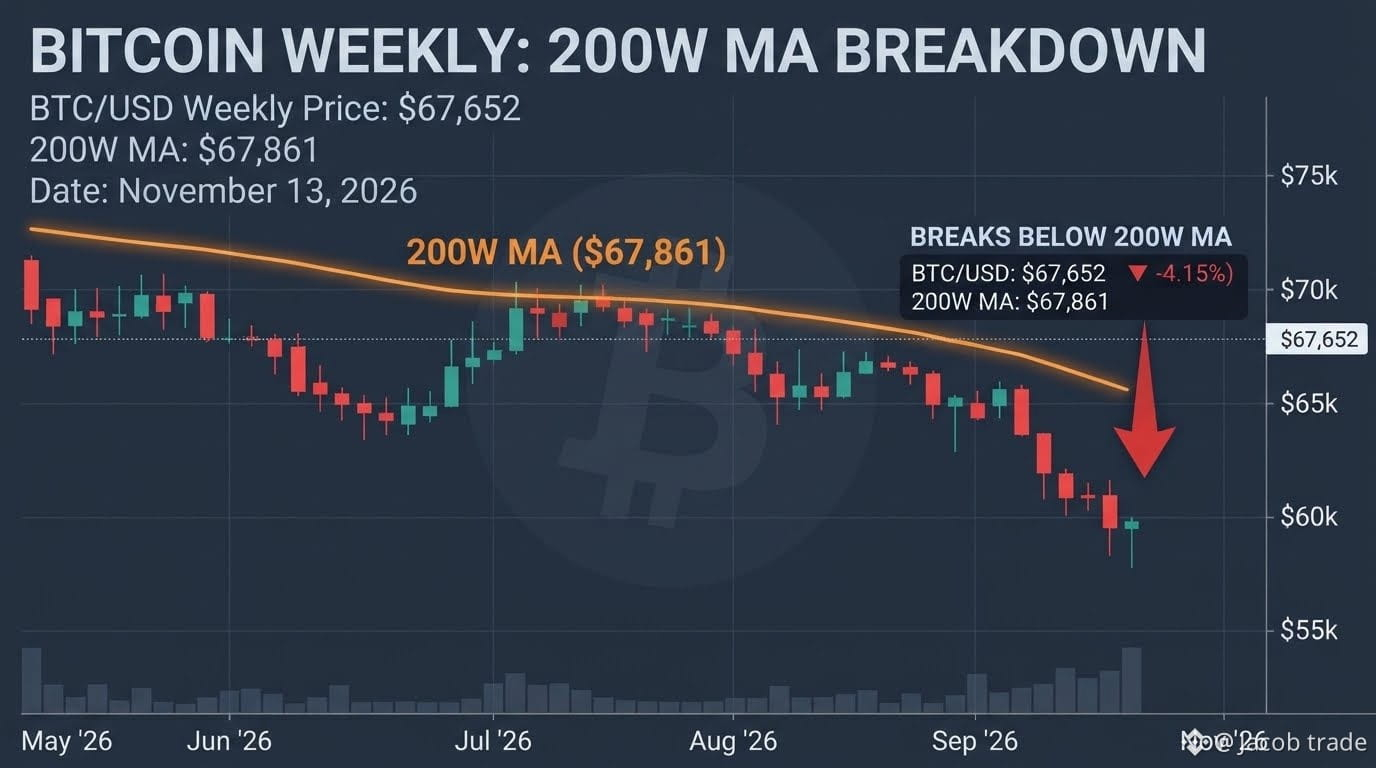
🚨 BITCOIN BREAKS BELOW ITS 200-WEEK MOVING AVERAGE (~$68,000) AS DOLLAR TOPS 103 & YIELDS SURGE! 📉⚠️
Bitcoin ($BTC) breached one of its most critical historical trendlines on Friday, November 13, dipping as low as $67,640 – $67,652 and slipping below its 200-week moving average (~$68,000).
Now down roughly 16% over the past month and 17% this quarter, $BTC has erased its post-August gains as tightening global liquidity and rising yields trigger broad cross-asset de-risking.
📌 What Drove the Breakdown Below $68,000?
💵 Dollar & Treasury Yield Spike: The U.S. Dollar Index (DXY) climbed above 103 (a 19-month high since April 2025) while the 10-year Treasury yield hit 5.125%, fueled by rising bets on a 50 bps December Fed rate hike after Tuesday's hot inflation print.
💥 $1.3B+ Liquidation Cascade: Over $1.3 Billion in leveraged crypto futures were wiped out in 24 hours—including $677 Million in Bitcoin longs—accelerating the flush once $70,000 gave way.
$ETH
📉 On-Chain & Liquidity Drain: Stablecoin supply contracted by $14.2 Billion over the past 30 days, while CryptoQuant’s Bull Score Index dropped to zero, reflecting thin spot demand despite resting buy clusters between $68,000 and $72,500.
$XRP
📊 Key Technical Scenarios to Watch Before the Weekly Close
Historically, the 200-week moving average has served as a generational bear-market floor—meaning how $BTC finishes the weekly candle matters far more than an intraday wick:
$ZEC
🔴 Bearish Breakdown (Confirmed Weekly Close Below $68,000): A decisive weekly close below the 200-week MA—especially with weekly RSI slipping under 41.5—opens the door to deeper downside targets at $60,000 and the $57,700 cycle low.
#SpaceXTeslaMergerTalksWouldCombine30220BTC #KoreaDigitalAssetBasicActFinalDraftExpectedEarlyJanuary #CryptoNews #Binance
🚨 BITCOIN BREAKS BELOW ITS 200-WEEK MOVING AVERAGE (~$68,000) AS DOLLAR TOPS 103 & YIELDS SURGE! 📉⚠️
Bitcoin ($BTC) breached one of its most critical historical trendlines on Friday, November 13, dipping as low as $67,640 – $67,652 and slipping below its 200-week moving average (~$68,000).
Now down roughly 16% over the past month and 17% this quarter, $BTC has erased its post-August gains as tightening global liquidity and rising yields trigger broad cross-asset de-risking.
📌 What Drove the Breakdown Below $68,000?
💵 Dollar & Treasury Yield Spike: The U.S. Dollar Index (DXY) climbed above 103 (a 19-month high since April 2025) while the 10-year Treasury yield hit 5.125%, fueled by rising bets on a 50 bps December Fed rate hike after Tuesday's hot inflation print.
💥 $1.3B+ Liquidation Cascade: Over $1.3 Billion in leveraged crypto futures were wiped out in 24 hours—including $677 Million in Bitcoin longs—accelerating the flush once $70,000 gave way.
$ETH
📉 On-Chain & Liquidity Drain: Stablecoin supply contracted by $14.2 Billion over the past 30 days, while CryptoQuant’s Bull Score Index dropped to zero, reflecting thin spot demand despite resting buy clusters between $68,000 and $72,500.
$XRP
📊 Key Technical Scenarios to Watch Before the Weekly Close
Historically, the 200-week moving average has served as a generational bear-market floor—meaning how $BTC finishes the weekly candle matters far more than an intraday wick:
$ZEC
🔴 Bearish Breakdown (Confirmed Weekly Close Below $68,000): A decisive weekly close below the 200-week MA—especially with weekly RSI slipping under 41.5—opens the door to deeper downside targets at $60,000 and the $57,700 cycle low.
#SpaceXTeslaMergerTalksWouldCombine30220BTC #KoreaDigitalAssetBasicActFinalDraftExpectedEarlyJanuary #CryptoNews #Binance
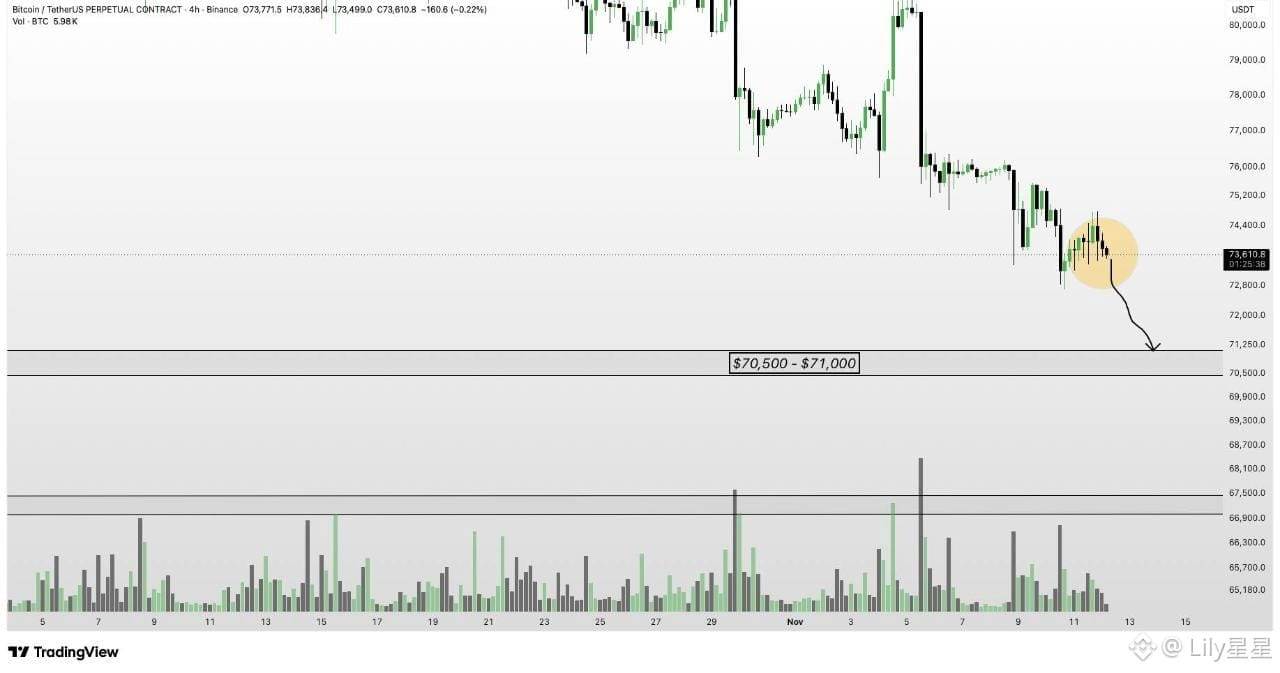
Extraterrestree:
BTC oportunidade 🩸🩸🩸🩸🩸🩸🩸☠️☠️☠️🟥🟥🟥🟥🟥🟥👺👺👺50x alvo 60k
1
3
3.9k

·
--
🚨 BITCOIN FALLS TO $67,652 EVEN ITS 200-WEEK AVERAGE IS UNDER PRESSURE!
The crypto market is facing another serious test.
Bitcoin has dropped below its 200-week moving average near $68,000, a level many long-term traders watch closely.
What's adding to the pressure?
📉 ETF outflows: Bitcoin ETFs have recorded around $1.56B in outflows during 2026, weakening the demand picture.
💵 Macro pressure: A stronger dollar and rising bond yields are making risk assets less attractive.
⚠️ Liquidations: Heavy futures liquidations are accelerating downside moves.
🔻 Altcoins: $ETH has slipped below $2,000, while $XRP and $SOL are also under pressure.
🏢 Strategy: Its reported quarterly profit was largely driven by unrealized Bitcoin gains, while its upcoming MSCI index removal adds another concern around potential passive fund flows.
Meanwhile, US producer-price inflation rose 6.5% year over year, slightly below expectations.
My take: This is a combination of macro pressure, weaker institutional flows and excessive leverage. I'm watching whether BTC can reclaim $68K or establish support below it.
Do you think $68K becomes resistance now, or can Bitcoin recover it?
#CryptoMarketMoves #ETFoutflows #MarketUpdate #BitcoinBreaksBelow200WeekMovingAverage #JaneStreetNearlyOctuplesFidelityBitcoinETFHoldings
🚨 BITCOIN FALLS TO $67,652 EVEN ITS 200-WEEK AVERAGE IS UNDER PRESSURE!
The crypto market is facing another serious test.
Bitcoin has dropped below its 200-week moving average near $68,000, a level many long-term traders watch closely.
What's adding to the pressure?
📉 ETF outflows: Bitcoin ETFs have recorded around $1.56B in outflows during 2026, weakening the demand picture.
💵 Macro pressure: A stronger dollar and rising bond yields are making risk assets less attractive.
⚠️ Liquidations: Heavy futures liquidations are accelerating downside moves.
🔻 Altcoins: $ETH has slipped below $2,000, while $XRP and $SOL are also under pressure.
🏢 Strategy: Its reported quarterly profit was largely driven by unrealized Bitcoin gains, while its upcoming MSCI index removal adds another concern around potential passive fund flows.
Meanwhile, US producer-price inflation rose 6.5% year over year, slightly below expectations.
My take: This is a combination of macro pressure, weaker institutional flows and excessive leverage. I'm watching whether BTC can reclaim $68K or establish support below it.
Do you think $68K becomes resistance now, or can Bitcoin recover it?
#CryptoMarketMoves #ETFoutflows #MarketUpdate #BitcoinBreaksBelow200WeekMovingAverage #JaneStreetNearlyOctuplesFidelityBitcoinETFHoldings
The crypto market is facing another serious test.
Bitcoin has dropped below its 200-week moving average near $68,000, a level many long-term traders watch closely.
What's adding to the pressure?
📉 ETF outflows: Bitcoin ETFs have recorded around $1.56B in outflows during 2026, weakening the demand picture.
💵 Macro pressure: A stronger dollar and rising bond yields are making risk assets less attractive.
⚠️ Liquidations: Heavy futures liquidations are accelerating downside moves.
🔻 Altcoins: $ETH has slipped below $2,000, while $XRP and $SOL are also under pressure.
🏢 Strategy: Its reported quarterly profit was largely driven by unrealized Bitcoin gains, while its upcoming MSCI index removal adds another concern around potential passive fund flows.
Meanwhile, US producer-price inflation rose 6.5% year over year, slightly below expectations.
My take: This is a combination of macro pressure, weaker institutional flows and excessive leverage. I'm watching whether BTC can reclaim $68K or establish support below it.
Do you think $68K becomes resistance now, or can Bitcoin recover it?
#CryptoMarketMoves #ETFoutflows #MarketUpdate #BitcoinBreaksBelow200WeekMovingAverage #JaneStreetNearlyOctuplesFidelityBitcoinETFHoldings
1
53

·
--
#BitcoinBreaksBelow200WeekMovingAverage
📏 $68K Line Lost: BTC's First 200-Week Test Since August
Bitcoin slipped under its 200-week average today, the line that marked the 2018 and 2020 bottoms but failed in 2022.
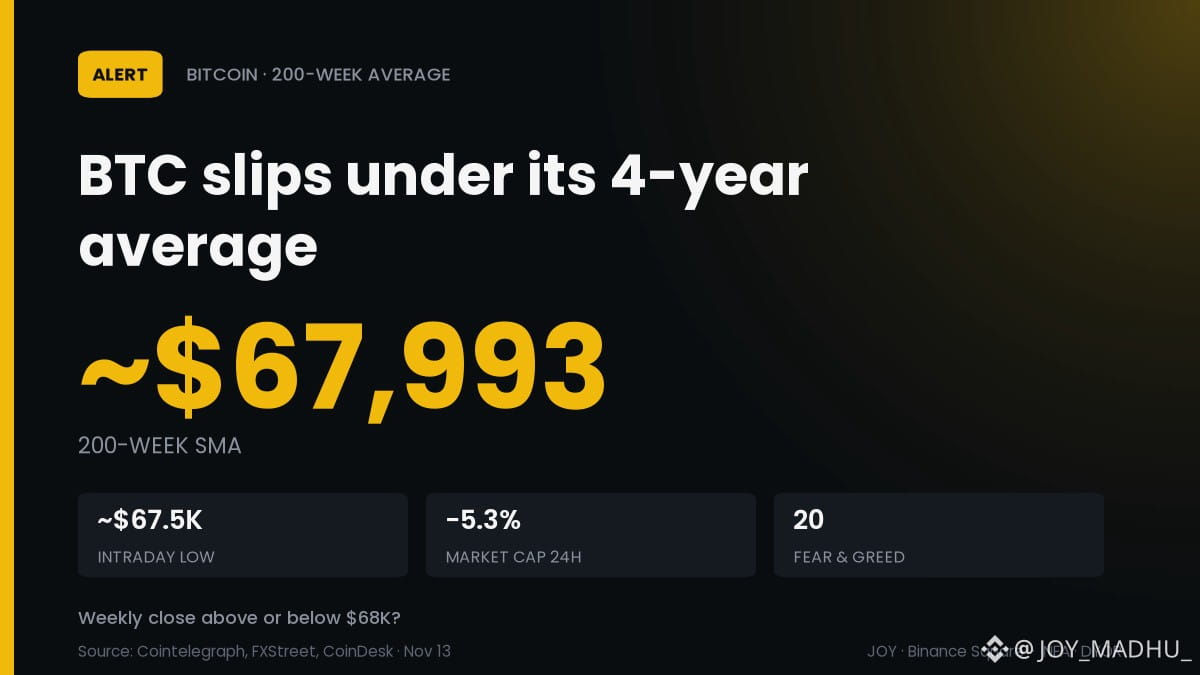
📉 Low near $67.5K vs a 200-week SMA of ~$67,993
📊 Crypto market cap -5.3% in 24h to $2.32T
⚠️ Fear & Greed at 20, its lowest since July
📅 Last touch was Aug 19, 11 weeks ago
My read: a weekly close counts more than an intraday wick. The line is up 22.8% in a year, a higher floor, not a promise.
Sunday's weekly close: above $68K or below it? 👇
$BTC
#BitcoinBreaksBelow200WeekMovingAverage #Bitcoin #CryptoMarket
#BitcoinBreaksBelow200WeekMovingAverage
📏 $68K Line Lost: BTC's First 200-Week Test Since August
Bitcoin slipped under its 200-week average today, the line that marked the 2018 and 2020 bottoms but failed in 2022.
📉 Low near $67.5K vs a 200-week SMA of ~$67,993
📊 Crypto market cap -5.3% in 24h to $2.32T
⚠️ Fear & Greed at 20, its lowest since July
📅 Last touch was Aug 19, 11 weeks ago
My read: a weekly close counts more than an intraday wick. The line is up 22.8% in a year, a higher floor, not a promise.
Sunday's weekly close: above $68K or below it? 👇
$BTC
#BitcoinBreaksBelow200WeekMovingAverage #Bitcoin #CryptoMarket
📏 $68K Line Lost: BTC's First 200-Week Test Since August
Bitcoin slipped under its 200-week average today, the line that marked the 2018 and 2020 bottoms but failed in 2022.
📉 Low near $67.5K vs a 200-week SMA of ~$67,993
📊 Crypto market cap -5.3% in 24h to $2.32T
⚠️ Fear & Greed at 20, its lowest since July
📅 Last touch was Aug 19, 11 weeks ago
My read: a weekly close counts more than an intraday wick. The line is up 22.8% in a year, a higher floor, not a promise.
Sunday's weekly close: above $68K or below it? 👇
$BTC
#BitcoinBreaksBelow200WeekMovingAverage #Bitcoin #CryptoMarket
20

Breaking 🚨 #BTCBREAKSBELOW200WEEKMOVINGAVERAGE 🩸
Bitcoin just hit a critical long-term level!
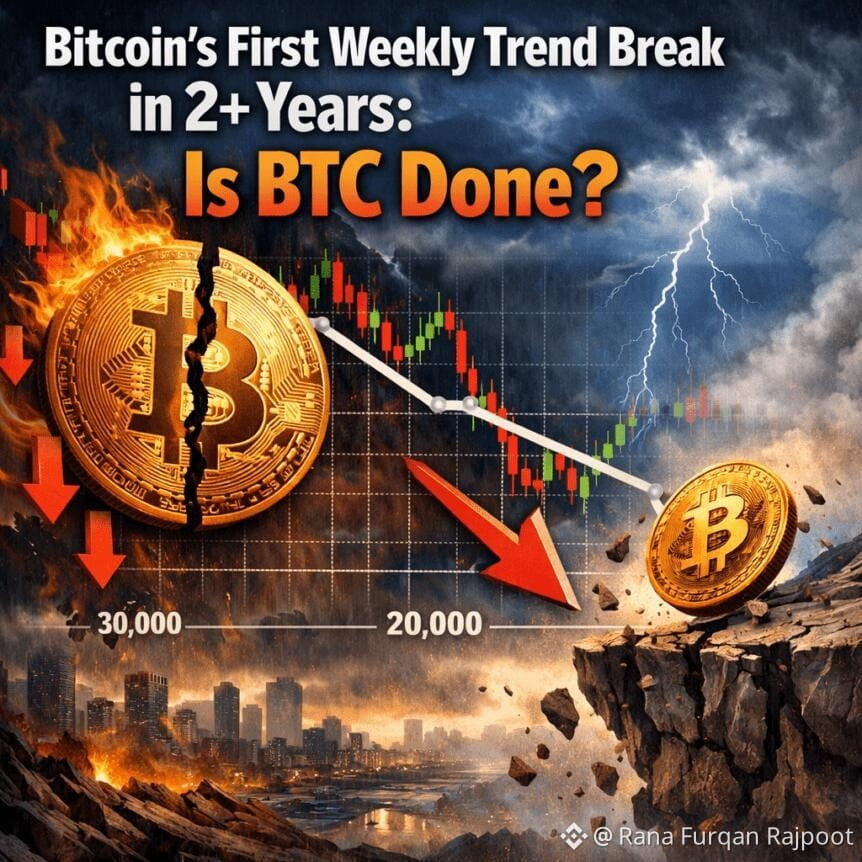
📉 BTC dropped to $67,500, below its 200-Week SMA of $67,993.
⚠️ Why is this important? • 200W SMA is a major long-term market indicator. • Weekly RSI is testing the important 41.5 level. • Analyst Keith Alan warns that losing this RSI support could put $57,700 back in focus.$SOL $ETH $SUI
🔥 THE BIG QUESTION: Is Bitcoin preparing for a recovery, or could more downside follow?
Let's hear your thoughts! 👇
#Bitcoin #CryptoMarket #BitcoinAnalysis
#BitcoinBreaksBelow200WeekMovingAverage #WhatWillDriveCryptoandStocks’NextRebound? #HuangExitNvidiaStrategyInFocus #BTC #AnthropicRejectsIPODelayValuationinQuestion
Breaking 🚨 #BTCBREAKSBELOW200WEEKMOVINGAVERAGE 🩸
Bitcoin just hit a critical long-term level!
📉 BTC dropped to $67,500, below its 200-Week SMA of $67,993.
⚠️ Why is this important? • 200W SMA is a major long-term market indicator. • Weekly RSI is testing the important 41.5 level. • Analyst Keith Alan warns that losing this RSI support could put $57,700 back in focus.$SOL $ETH $SUI
🔥 THE BIG QUESTION: Is Bitcoin preparing for a recovery, or could more downside follow?
Let's hear your thoughts! 👇
#Bitcoin #CryptoMarket #BitcoinAnalysis
#BitcoinBreaksBelow200WeekMovingAverage #WhatWillDriveCryptoandStocks’NextRebound? #HuangExitNvidiaStrategyInFocus #BTC #AnthropicRejectsIPODelayValuationinQuestion
Bitcoin just hit a critical long-term level!
📉 BTC dropped to $67,500, below its 200-Week SMA of $67,993.
⚠️ Why is this important? • 200W SMA is a major long-term market indicator. • Weekly RSI is testing the important 41.5 level. • Analyst Keith Alan warns that losing this RSI support could put $57,700 back in focus.$SOL $ETH $SUI
🔥 THE BIG QUESTION: Is Bitcoin preparing for a recovery, or could more downside follow?
Let's hear your thoughts! 👇
#Bitcoin #CryptoMarket #BitcoinAnalysis
#BitcoinBreaksBelow200WeekMovingAverage #WhatWillDriveCryptoandStocks’NextRebound? #HuangExitNvidiaStrategyInFocus #BTC #AnthropicRejectsIPODelayValuationinQuestion
1
51

·
--
#BitcoinBreaksBelow200WeekMovingAverage A MASSIVE LIQUIDATION CASCADE IS NOT A REBOUND. WHAT WILL BRING BUYERS BACK?
Bitcoin has officially breached its critical 200-week moving average, plummeting toward the mid-$50k zone—its lowest macro level in years—and wiping out a staggering percentage of market capitalization this quarter.
Over $2.5 billion in leveraged futures contracts have been liquidated across the board within a compressed 48-hour window, with Bitcoin long positions bearing the absolute brunt of the pain. Billions more evaporated in cascading stop-losses as the historic moving average support gave way.
Here is the chain of causes as I see it:
Sticky inflation and stubborn macroeconomic data → aggressive central bank posture and delayed rate-cut expectations → surging Dollar Index hitting multi-month highs → broad-based institutional sell-off across both tech equities and digital assets → systemic wiping out of over-leveraged long positions.
My take: breaking a multi-year structural anchor like the 200-week moving average flushes out all remaining speculation, but it doesn't magically summon buyers. And you need sustained buyers for a genuine, durable rebound to materialize.
Here is what I want to see before calling a bottom or a true reversal:
Spot ETF inflows turning decisively green after weeks of relentless institutional outflows. Stablecoin supply contraction completely halting and reversing direction after massive capital flight. The U.S. Dollar Index losing its upward momentum and cooling off alongside improving inflation metrics. Most importantly, Bitcoin needs to reclaim the broken 200-week moving average and the psychological $60k threshold, turning them back into solid support. Below these levels, traders are nervously eyeing lower macro supports.
What’s your strategy? Share it below.
$BTC
{future}(BTCUSDT)
$SOPH
{future}(SOPHUSDT)
$AKE
{future}(AKEUSDT)
#BitcoinBreaksBelow200WeekMovingAverage A MASSIVE LIQUIDATION CASCADE IS NOT A REBOUND. WHAT WILL BRING BUYERS BACK?
Bitcoin has officially breached its critical 200-week moving average, plummeting toward the mid-$50k zone—its lowest macro level in years—and wiping out a staggering percentage of market capitalization this quarter.
Over $2.5 billion in leveraged futures contracts have been liquidated across the board within a compressed 48-hour window, with Bitcoin long positions bearing the absolute brunt of the pain. Billions more evaporated in cascading stop-losses as the historic moving average support gave way.
Here is the chain of causes as I see it:
Sticky inflation and stubborn macroeconomic data → aggressive central bank posture and delayed rate-cut expectations → surging Dollar Index hitting multi-month highs → broad-based institutional sell-off across both tech equities and digital assets → systemic wiping out of over-leveraged long positions.
My take: breaking a multi-year structural anchor like the 200-week moving average flushes out all remaining speculation, but it doesn't magically summon buyers. And you need sustained buyers for a genuine, durable rebound to materialize.
Here is what I want to see before calling a bottom or a true reversal:
Spot ETF inflows turning decisively green after weeks of relentless institutional outflows. Stablecoin supply contraction completely halting and reversing direction after massive capital flight. The U.S. Dollar Index losing its upward momentum and cooling off alongside improving inflation metrics. Most importantly, Bitcoin needs to reclaim the broken 200-week moving average and the psychological $60k threshold, turning them back into solid support. Below these levels, traders are nervously eyeing lower macro supports.
What’s your strategy? Share it below.
$BTC
$SOPH
$AKE
Bitcoin has officially breached its critical 200-week moving average, plummeting toward the mid-$50k zone—its lowest macro level in years—and wiping out a staggering percentage of market capitalization this quarter.
Over $2.5 billion in leveraged futures contracts have been liquidated across the board within a compressed 48-hour window, with Bitcoin long positions bearing the absolute brunt of the pain. Billions more evaporated in cascading stop-losses as the historic moving average support gave way.
Here is the chain of causes as I see it:
Sticky inflation and stubborn macroeconomic data → aggressive central bank posture and delayed rate-cut expectations → surging Dollar Index hitting multi-month highs → broad-based institutional sell-off across both tech equities and digital assets → systemic wiping out of over-leveraged long positions.
My take: breaking a multi-year structural anchor like the 200-week moving average flushes out all remaining speculation, but it doesn't magically summon buyers. And you need sustained buyers for a genuine, durable rebound to materialize.
Here is what I want to see before calling a bottom or a true reversal:
Spot ETF inflows turning decisively green after weeks of relentless institutional outflows. Stablecoin supply contraction completely halting and reversing direction after massive capital flight. The U.S. Dollar Index losing its upward momentum and cooling off alongside improving inflation metrics. Most importantly, Bitcoin needs to reclaim the broken 200-week moving average and the psychological $60k threshold, turning them back into solid support. Below these levels, traders are nervously eyeing lower macro supports.
What’s your strategy? Share it below.
$BTC
$SOPH
$AKE

321

·
--
Bearish
What Happened Today?
{spot}(BTCUSDT)
$BTC fell to $67,500
200-Week SMA: *$67,993*
First test in 11 weeks. Last touch: Aug 19.
$BTC -3.5% in 24h, -16% in 1 month
Fear & Greed: *20 - Extreme Fear*
$1.64B liquidated in 24h, 89% longs
Why 200-Week MA Matters?
It's ∼4 years of price. One full halving cycle.
History:
2018 - Touch = Bottom
2020 - Touch = Bottom
2022 - Broke = 16-month crypto winter
2023 Mar-Oct - Held = New uptrend
2026 Jun-Aug - Held = +40% rally
Now we broke it again.
The Next Line:
Weekly RSI: *41.5*
If weekly close below 41.5 = Next target $57,700 cycle low
If we hold 41.5 + reclaim $67,993 = Bounce to $73K
Daily RSI: 28.4 - Oversold. Bounce possible, but not confirmed.
What To Watch?
Weekly close Sunday is EVERYTHING.
Close above $67,993 = Fake breakdown, bulls alive
Close below $67,993 = Bear market confirmed
My Take:
Don't panic buy. Don't panic sell.
Wait for weekly close. This line decides the next 6 months.
Are we holding or breaking?
Comment "HOLD" or "BREAK"
#bitcoin #BTC #EarningsSeason #BinanceSquareTalks
#BitcoinBreaksBelow200WeekMovingAverage
What Happened Today?
$BTC fell to $67,500
200-Week SMA: *$67,993*
First test in 11 weeks. Last touch: Aug 19.
$BTC -3.5% in 24h, -16% in 1 month
Fear & Greed: *20 - Extreme Fear*
$1.64B liquidated in 24h, 89% longs
Why 200-Week MA Matters?
It's ∼4 years of price. One full halving cycle.
History:
2018 - Touch = Bottom
2020 - Touch = Bottom
2022 - Broke = 16-month crypto winter
2023 Mar-Oct - Held = New uptrend
2026 Jun-Aug - Held = +40% rally
Now we broke it again.
The Next Line:
Weekly RSI: *41.5*
If weekly close below 41.5 = Next target $57,700 cycle low
If we hold 41.5 + reclaim $67,993 = Bounce to $73K
Daily RSI: 28.4 - Oversold. Bounce possible, but not confirmed.
What To Watch?
Weekly close Sunday is EVERYTHING.
Close above $67,993 = Fake breakdown, bulls alive
Close below $67,993 = Bear market confirmed
My Take:
Don't panic buy. Don't panic sell.
Wait for weekly close. This line decides the next 6 months.
Are we holding or breaking?
Comment "HOLD" or "BREAK"
#bitcoin #BTC #EarningsSeason #BinanceSquareTalks
#BitcoinBreaksBelow200WeekMovingAverage
$BTC fell to $67,500
200-Week SMA: *$67,993*
First test in 11 weeks. Last touch: Aug 19.
$BTC -3.5% in 24h, -16% in 1 month
Fear & Greed: *20 - Extreme Fear*
$1.64B liquidated in 24h, 89% longs
Why 200-Week MA Matters?
It's ∼4 years of price. One full halving cycle.
History:
2018 - Touch = Bottom
2020 - Touch = Bottom
2022 - Broke = 16-month crypto winter
2023 Mar-Oct - Held = New uptrend
2026 Jun-Aug - Held = +40% rally
Now we broke it again.
The Next Line:
Weekly RSI: *41.5*
If weekly close below 41.5 = Next target $57,700 cycle low
If we hold 41.5 + reclaim $67,993 = Bounce to $73K
Daily RSI: 28.4 - Oversold. Bounce possible, but not confirmed.
What To Watch?
Weekly close Sunday is EVERYTHING.
Close above $67,993 = Fake breakdown, bulls alive
Close below $67,993 = Bear market confirmed
My Take:
Don't panic buy. Don't panic sell.
Wait for weekly close. This line decides the next 6 months.
Are we holding or breaking?
Comment "HOLD" or "BREAK"
#bitcoin #BTC #EarningsSeason #BinanceSquareTalks
#BitcoinBreaksBelow200WeekMovingAverage
1
109

·
--
Bearish
#BitcoinBreaksBelow200WeekMovingAverage
BITCOIN BROKE BELOW THE 200-WEEK MA. 🚨
This level held for YEARS.
Now it's broken.
Panic? Or the biggest opportunity?
History says:
Every time BTC broke this level, weak hands sold...
and smart money accumulated.
Are you FEARFUL or BUYING THE DIP?
Comment: PANIC 😱 or BUY 💰
#bitcoin #BTC #Crypto #BinanceSquare
#BitcoinBreaksBelow200WeekMovingAverage
BITCOIN BROKE BELOW THE 200-WEEK MA. 🚨
This level held for YEARS.
Now it's broken.
Panic? Or the biggest opportunity?
History says:
Every time BTC broke this level, weak hands sold...
and smart money accumulated.
Are you FEARFUL or BUYING THE DIP?
Comment: PANIC 😱 or BUY 💰
#bitcoin #BTC #Crypto #BinanceSquare
BITCOIN BROKE BELOW THE 200-WEEK MA. 🚨
This level held for YEARS.
Now it's broken.
Panic? Or the biggest opportunity?
History says:
Every time BTC broke this level, weak hands sold...
and smart money accumulated.
Are you FEARFUL or BUYING THE DIP?
Comment: PANIC 😱 or BUY 💰
#bitcoin #BTC #Crypto #BinanceSquare

99

·
--
Bullish
Bitcoin fell as low as $67,652, below its 200-week moving average near $68,000, and under $70,000 for the first time since August 19. The Dollar Index rose above 103, its highest since April 2025, and the US 10-year yield hit 5.125%. More than $1.3B in crypto futures was liquidated in 24 hours, $677M of it bitcoin. US spot bitcoin ETFs are now down $1.56B for 2026 after losing about $2.57B since October 30. October PPI rose 6.5% year over year, just below the 6.6% forecast. Strategy reported a $19.53B quarterly#BitcoinBreaksBelow200WeekMovingAverage #BitcoinBreaksBelow200WeekMovingAverage #HuangExitNvidiaStrategyInFocus $NVDAB
Bitcoin fell as low as $67,652, below its 200-week moving average near $68,000, and under $70,000 for the first time since August 19. The Dollar Index rose above 103, its highest since April 2025, and the US 10-year yield hit 5.125%. More than $1.3B in crypto futures was liquidated in 24 hours, $677M of it bitcoin. US spot bitcoin ETFs are now down $1.56B for 2026 after losing about $2.57B since October 30. October PPI rose 6.5% year over year, just below the 6.6% forecast. Strategy reported a $19.53B quarterly#BitcoinBreaksBelow200WeekMovingAverage #BitcoinBreaksBelow200WeekMovingAverage #HuangExitNvidiaStrategyInFocus $NVDAB
26

BITCOIN AT A CRITICAL TURNING POINT: 200-WEEK MOVING AVERAGE UNDER PRESSURE!Bitcoin is approaching one of the most important levels in its long-term market structure, and the latest price action is giving traders a serious reason to pay attention.
BTC recently dropped toward $67,500, testing its 200-Week Simple Moving Average, currently sitting around $67,993.
This is not just another support level. Historically, the 200-week moving average has played an important role during major Bitcoin market corrections.
Here's what I'm watching right now. 👇
📉 THE BEARISH SCENARIO
Bitcoin is already showing significant weakness, and a confirmed weekly close below the 200-week moving average could signal further downside risk.
The important support zones I'm watching are:
🔻 $67,000 – Immediate support area
🔻 $65,000 – Next important downside target
🔻 $62,300 – Major structural support zone
There is also a deeper downside scenario worth monitoring. Some market analysts have warned that Bitcoin could potentially revisit $57,700 if weekly momentum deteriorates further.
📈 THE BULLISH SCENARIO
However, I wouldn't ignore the possibility of a recovery just yet.
Bitcoin's daily RSI has fallen into oversold territory, suggesting that selling pressure has become stretched.
The 200-week moving average has historically attracted attention from long-term buyers, and a strong reaction from this level could trigger a relief rally.
If BTC successfully reclaims the $70,000 area, the next recovery levels to watch will be $72,000–$73,500.
⚠️ MY TRADING GAMEPLAN
I'm not interested in making emotional decisions during this kind of volatility.
The most important thing right now is the weekly candle close.
A temporary move below the 200-week moving average doesn't automatically confirm a long-term breakdown.
But if Bitcoin closes decisively below this level and fails to recover it, the bearish scenario becomes much more concerning.
For now, I'm watching price action, volume, RSI, and liquidity before considering the next major move.
🔥 THE BIG QUESTION:
Will the 200-week moving average once again become Bitcoin's strongest support, or are we about to see a deeper correction toward $62K and potentially lower?
Are you buying this dip, or waiting for confirmation? Drop your thoughts below! 👇
$BTC $AKE $KGEN
#bitcoinbreaksbelow200weekmovingaverage #BTC #CryptoTrading #BinanceSquare
{future}(KGENUSDT)
{alpha}(560x2c3a8ee94ddd97244a93bc48298f97d2c412f7db)
{spot}(BTCUSDT)
BITCOIN AT A CRITICAL TURNING POINT: 200-WEEK MOVING AVERAGE UNDER PRESSURE!
Bitcoin is approaching one of the most important levels in its long-term market structure, and the latest price action is giving traders a serious reason to pay attention.
BTC recently dropped toward $67,500, testing its 200-Week Simple Moving Average, currently sitting around $67,993.
This is not just another support level. Historically, the 200-week moving average has played an important role during major Bitcoin market corrections.
Here's what I'm watching right now. 👇
📉 THE BEARISH SCENARIO
Bitcoin is already showing significant weakness, and a confirmed weekly close below the 200-week moving average could signal further downside risk.
The important support zones I'm watching are:
🔻 $67,000 – Immediate support area
🔻 $65,000 – Next important downside target
🔻 $62,300 – Major structural support zone
There is also a deeper downside scenario worth monitoring. Some market analysts have warned that Bitcoin could potentially revisit $57,700 if weekly momentum deteriorates further.
📈 THE BULLISH SCENARIO
However, I wouldn't ignore the possibility of a recovery just yet.
Bitcoin's daily RSI has fallen into oversold territory, suggesting that selling pressure has become stretched.
The 200-week moving average has historically attracted attention from long-term buyers, and a strong reaction from this level could trigger a relief rally.
If BTC successfully reclaims the $70,000 area, the next recovery levels to watch will be $72,000–$73,500.
⚠️ MY TRADING GAMEPLAN
I'm not interested in making emotional decisions during this kind of volatility.
The most important thing right now is the weekly candle close.
A temporary move below the 200-week moving average doesn't automatically confirm a long-term breakdown.
But if Bitcoin closes decisively below this level and fails to recover it, the bearish scenario becomes much more concerning.
For now, I'm watching price action, volume, RSI, and liquidity before considering the next major move.
🔥 THE BIG QUESTION:
Will the 200-week moving average once again become Bitcoin's strongest support, or are we about to see a deeper correction toward $62K and potentially lower?
Are you buying this dip, or waiting for confirmation? Drop your thoughts below! 👇
$BTC $AKE $KGEN
#bitcoinbreaksbelow200weekmovingaverage #BTC #CryptoTrading #BinanceSquare
BTC recently dropped toward $67,500, testing its 200-Week Simple Moving Average, currently sitting around $67,993.
This is not just another support level. Historically, the 200-week moving average has played an important role during major Bitcoin market corrections.
Here's what I'm watching right now. 👇
📉 THE BEARISH SCENARIO
Bitcoin is already showing significant weakness, and a confirmed weekly close below the 200-week moving average could signal further downside risk.
The important support zones I'm watching are:
🔻 $67,000 – Immediate support area
🔻 $65,000 – Next important downside target
🔻 $62,300 – Major structural support zone
There is also a deeper downside scenario worth monitoring. Some market analysts have warned that Bitcoin could potentially revisit $57,700 if weekly momentum deteriorates further.
📈 THE BULLISH SCENARIO
However, I wouldn't ignore the possibility of a recovery just yet.
Bitcoin's daily RSI has fallen into oversold territory, suggesting that selling pressure has become stretched.
The 200-week moving average has historically attracted attention from long-term buyers, and a strong reaction from this level could trigger a relief rally.
If BTC successfully reclaims the $70,000 area, the next recovery levels to watch will be $72,000–$73,500.
⚠️ MY TRADING GAMEPLAN
I'm not interested in making emotional decisions during this kind of volatility.
The most important thing right now is the weekly candle close.
A temporary move below the 200-week moving average doesn't automatically confirm a long-term breakdown.
But if Bitcoin closes decisively below this level and fails to recover it, the bearish scenario becomes much more concerning.
For now, I'm watching price action, volume, RSI, and liquidity before considering the next major move.
🔥 THE BIG QUESTION:
Will the 200-week moving average once again become Bitcoin's strongest support, or are we about to see a deeper correction toward $62K and potentially lower?
Are you buying this dip, or waiting for confirmation? Drop your thoughts below! 👇
$BTC $AKE $KGEN
#bitcoinbreaksbelow200weekmovingaverage #BTC #CryptoTrading #BinanceSquare
46

·
--
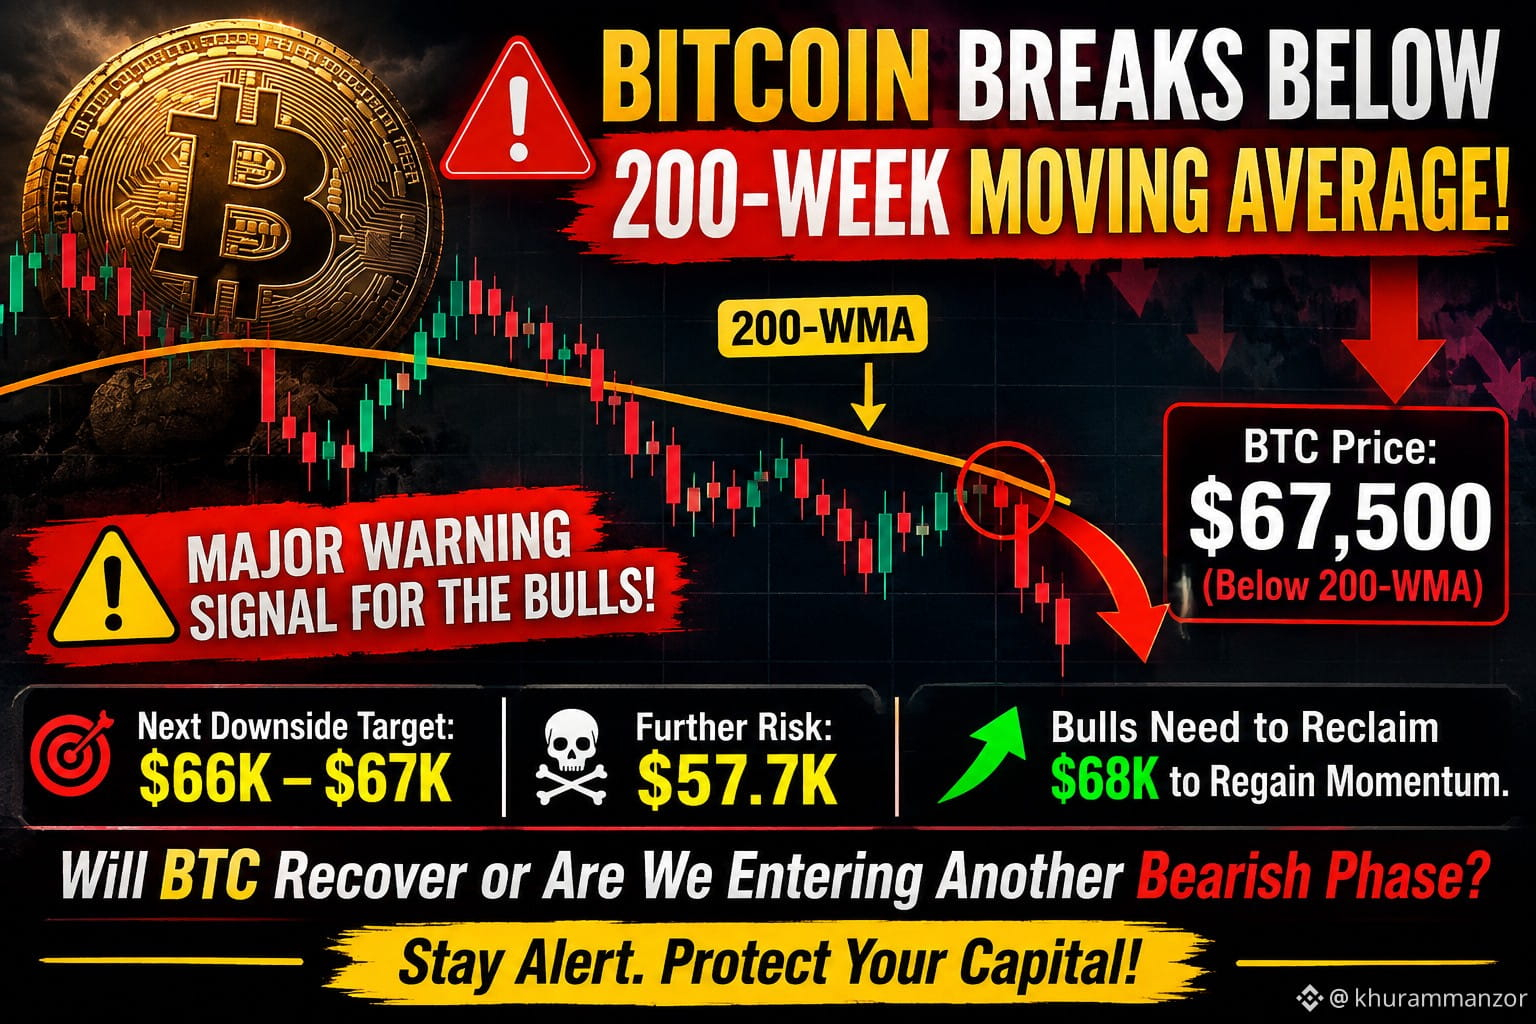
🚨 BITCOIN BREAKS BELOW THE 200-WEEK MOVING AVERAGE! 📉
Bitcoin has dropped to around $67,500, falling below its critical 200-week moving average near $68,000.
⚠️ This is a major warning signal for the bulls!
🔻 Next downside target: $66K–$67K
☠️ Further risk: $57.7K
🚀 Bulls need to reclaim $68K to regain momentum.
$AGT
{alpha}(560x5dbde81fce337ff4bcaaee4ca3466c00aecae274)
Will BTC recover or are we entering another major bearish phase?
Stay alert. Protect your capital!
#BTC #AGT #BitcoinBreaksBelow200WeekMovingAverage #WhatWillDriveCryptoandStocks’NextRebound?
🚨 BITCOIN BREAKS BELOW THE 200-WEEK MOVING AVERAGE! 📉
Bitcoin has dropped to around $67,500, falling below its critical 200-week moving average near $68,000.
⚠️ This is a major warning signal for the bulls!
🔻 Next downside target: $66K–$67K
☠️ Further risk: $57.7K
🚀 Bulls need to reclaim $68K to regain momentum.
$AGT
Will BTC recover or are we entering another major bearish phase?
Stay alert. Protect your capital!
#BTC #AGT #BitcoinBreaksBelow200WeekMovingAverage #WhatWillDriveCryptoandStocks’NextRebound?
Bitcoin has dropped to around $67,500, falling below its critical 200-week moving average near $68,000.
⚠️ This is a major warning signal for the bulls!
🔻 Next downside target: $66K–$67K
☠️ Further risk: $57.7K
🚀 Bulls need to reclaim $68K to regain momentum.
$AGT
Will BTC recover or are we entering another major bearish phase?
Stay alert. Protect your capital!
#BTC #AGT #BitcoinBreaksBelow200WeekMovingAverage #WhatWillDriveCryptoandStocks’NextRebound?
181

·
--
Bearish
#BitcoinBreaksBelow200WeekMovingAverage
Bitcoin (BTC) has officially slipped below its critical 200-week moving average, falling to roughly $67,500 and breaching the ~$68,000 long-term support floor for the first time in 11 weeks.
📉 What’s Driving the Drop?
• 💵 Surging US Dollar: The US Dollar Index (DXY) climbed above 103 to a 19-month high, putting heavy downward pressure on risk assets.
• 📈 Rising Bond Yields: Global yields are spiking—with the US 10-year Treasury yield hitting 5.125%—as hotter inflation data fuels bets on tighter Federal Reserve policy.
• 💥 Massive Liquidations: Over $1.3 billion in leveraged crypto futures were wiped out in 24 hours, triggering cascading sell orders across Bitcoin, Ether, and Solana.
🔍 Why the 200-Week MA Matters
• 🛡️ Historical Floor: Traders treat the 200-week moving average as Bitcoin's ultimate bear-market safety net.
• ⚠️ What’s Next: Analysts warn that failing to reclaim ~$68,000 on the weekly close could open the door to a retest of the $57,700 cycle low. Conversely, past cycles show that dips below this line often mark generational accumulation zones.
$BTC $ETH
#bitcoin
{future}(BTCUSDT)
#BitcoinBreaksBelow200WeekMovingAverage
Bitcoin (BTC) has officially slipped below its critical 200-week moving average, falling to roughly $67,500 and breaching the ~$68,000 long-term support floor for the first time in 11 weeks.
📉 What’s Driving the Drop?
• 💵 Surging US Dollar: The US Dollar Index (DXY) climbed above 103 to a 19-month high, putting heavy downward pressure on risk assets.
• 📈 Rising Bond Yields: Global yields are spiking—with the US 10-year Treasury yield hitting 5.125%—as hotter inflation data fuels bets on tighter Federal Reserve policy.
• 💥 Massive Liquidations: Over $1.3 billion in leveraged crypto futures were wiped out in 24 hours, triggering cascading sell orders across Bitcoin, Ether, and Solana.
🔍 Why the 200-Week MA Matters
• 🛡️ Historical Floor: Traders treat the 200-week moving average as Bitcoin's ultimate bear-market safety net.
• ⚠️ What’s Next: Analysts warn that failing to reclaim ~$68,000 on the weekly close could open the door to a retest of the $57,700 cycle low. Conversely, past cycles show that dips below this line often mark generational accumulation zones.
$BTC $ETH
#bitcoin
Bitcoin (BTC) has officially slipped below its critical 200-week moving average, falling to roughly $67,500 and breaching the ~$68,000 long-term support floor for the first time in 11 weeks.
📉 What’s Driving the Drop?
• 💵 Surging US Dollar: The US Dollar Index (DXY) climbed above 103 to a 19-month high, putting heavy downward pressure on risk assets.
• 📈 Rising Bond Yields: Global yields are spiking—with the US 10-year Treasury yield hitting 5.125%—as hotter inflation data fuels bets on tighter Federal Reserve policy.
• 💥 Massive Liquidations: Over $1.3 billion in leveraged crypto futures were wiped out in 24 hours, triggering cascading sell orders across Bitcoin, Ether, and Solana.
🔍 Why the 200-Week MA Matters
• 🛡️ Historical Floor: Traders treat the 200-week moving average as Bitcoin's ultimate bear-market safety net.
• ⚠️ What’s Next: Analysts warn that failing to reclaim ~$68,000 on the weekly close could open the door to a retest of the $57,700 cycle low. Conversely, past cycles show that dips below this line often mark generational accumulation zones.
$BTC $ETH
#bitcoin
1
127

#BitcoinBreaksBelow200WeekMovingAverage
🚨 Bitcoin Breaks Below the 200-Week Moving Average
Bitcoin has fallen to around $67,500, briefly trading below its 200-week SMA near $68,000 — a long-term trend level closely watched by crypto traders.
📉 The move comes amid broader risk-off pressure, weaker institutional demand, rising bond yields and renewed expectations for tighter U.S. monetary policy. Leverage has also amplified the sell-off, with large amounts of long positions liquidated.
🔎 Why it matters:
The 200-week average has historically acted as an important support/resistance zone during major Bitcoin cycles. Holding this area could help stabilize sentiment, while a sustained weekly close below it would strengthen the bearish technical picture.
⚠️ Bottom line: BTC is currently testing a major long-term support zone. Traders will be watching the weekly close and momentum indicators closely rather than treating a brief intraday break as confirmation of a larger trend.
#Bitcoin #BTC #CryptoMarket #BitcoinPrice
$AGT $JCT $BULLA
{future}(BULLAUSDT)
{future}(JCTUSDT)
{future}(AGTUSDT)
#BitcoinBreaksBelow200WeekMovingAverage
🚨 Bitcoin Breaks Below the 200-Week Moving Average
Bitcoin has fallen to around $67,500, briefly trading below its 200-week SMA near $68,000 — a long-term trend level closely watched by crypto traders.
📉 The move comes amid broader risk-off pressure, weaker institutional demand, rising bond yields and renewed expectations for tighter U.S. monetary policy. Leverage has also amplified the sell-off, with large amounts of long positions liquidated.
🔎 Why it matters:
The 200-week average has historically acted as an important support/resistance zone during major Bitcoin cycles. Holding this area could help stabilize sentiment, while a sustained weekly close below it would strengthen the bearish technical picture.
⚠️ Bottom line: BTC is currently testing a major long-term support zone. Traders will be watching the weekly close and momentum indicators closely rather than treating a brief intraday break as confirmation of a larger trend.
#Bitcoin #BTC #CryptoMarket #BitcoinPrice
$AGT $JCT $BULLA
🚨 Bitcoin Breaks Below the 200-Week Moving Average
Bitcoin has fallen to around $67,500, briefly trading below its 200-week SMA near $68,000 — a long-term trend level closely watched by crypto traders.
📉 The move comes amid broader risk-off pressure, weaker institutional demand, rising bond yields and renewed expectations for tighter U.S. monetary policy. Leverage has also amplified the sell-off, with large amounts of long positions liquidated.
🔎 Why it matters:
The 200-week average has historically acted as an important support/resistance zone during major Bitcoin cycles. Holding this area could help stabilize sentiment, while a sustained weekly close below it would strengthen the bearish technical picture.
⚠️ Bottom line: BTC is currently testing a major long-term support zone. Traders will be watching the weekly close and momentum indicators closely rather than treating a brief intraday break as confirmation of a larger trend.
#Bitcoin #BTC #CryptoMarket #BitcoinPrice
$AGT $JCT $BULLA

141

·
--
Bullish
#BitcoinBreaksBelow200WeekMovingAverage
Bitcoin briefly dropped to 67,500, slipping below its 200-week moving average near 67,993 — a level traders have watched closely for years.
Now the market faces a critical decision. 👇
🎯 BTC TRADE WATCH
🔴 SHORT SETUP
Trigger: BTC fails to reclaim the $68K zone.
Watch: Selling volume and weak retests.
Downside risk: 60K–57.7K zone.
🟢 LONG SETUP
Trigger: BTC reclaims 68K and holds it on a retest.
Watch: Strong spot buying and improving momentum.
Confirmation: Higher lows on the lower timeframes.
⚠️ Weekly RSI near 41.5 is another important level. A breakdown could increase downside risk, according to analyst Keith Alan.
$PEPE $NEAR $SOXLB
{spot}(SOXLBUSDT)
{future}(NEARUSDT)
{spot}(PEPEUSDT)
#BitcoinBreaksBelow200WeekMovingAverage
Bitcoin briefly dropped to 67,500, slipping below its 200-week moving average near 67,993 — a level traders have watched closely for years.
Now the market faces a critical decision. 👇
🎯 BTC TRADE WATCH
🔴 SHORT SETUP
Trigger: BTC fails to reclaim the $68K zone.
Watch: Selling volume and weak retests.
Downside risk: 60K–57.7K zone.
🟢 LONG SETUP
Trigger: BTC reclaims 68K and holds it on a retest.
Watch: Strong spot buying and improving momentum.
Confirmation: Higher lows on the lower timeframes.
⚠️ Weekly RSI near 41.5 is another important level. A breakdown could increase downside risk, according to analyst Keith Alan.
$PEPE $NEAR $SOXLB
Bitcoin briefly dropped to 67,500, slipping below its 200-week moving average near 67,993 — a level traders have watched closely for years.
Now the market faces a critical decision. 👇
🎯 BTC TRADE WATCH
🔴 SHORT SETUP
Trigger: BTC fails to reclaim the $68K zone.
Watch: Selling volume and weak retests.
Downside risk: 60K–57.7K zone.
🟢 LONG SETUP
Trigger: BTC reclaims 68K and holds it on a retest.
Watch: Strong spot buying and improving momentum.
Confirmation: Higher lows on the lower timeframes.
⚠️ Weekly RSI near 41.5 is another important level. A breakdown could increase downside risk, according to analyst Keith Alan.
$PEPE $NEAR $SOXLB

1
241

·
--
$BTC 报 69,502 美元,24小时下跌 4.1%,日内低点 67,922。
这次下跌不是单一利空:美元指数升破 103,创 2025年4月以来新高;美国10年期国债收益率升至 5.125%;24小时全网爆仓超过 13 亿美元,其中 BTC 占 6.77 亿。
这是 8月19日以来首次跌破 7 万,日内还一度跌破约 6.8 万的 200 周均线。
你更看重哪个:美元走强,还是杠杆出清?
#BitcoinBreaksBelow200WeekMovingAverage #Bitcoin
$BTC 报 69,502 美元,24小时下跌 4.1%,日内低点 67,922。
这次下跌不是单一利空:美元指数升破 103,创 2025年4月以来新高;美国10年期国债收益率升至 5.125%;24小时全网爆仓超过 13 亿美元,其中 BTC 占 6.77 亿。
这是 8月19日以来首次跌破 7 万,日内还一度跌破约 6.8 万的 200 周均线。
你更看重哪个:美元走强,还是杠杆出清?
#BitcoinBreaksBelow200WeekMovingAverage #Bitcoin
这次下跌不是单一利空:美元指数升破 103,创 2025年4月以来新高;美国10年期国债收益率升至 5.125%;24小时全网爆仓超过 13 亿美元,其中 BTC 占 6.77 亿。
这是 8月19日以来首次跌破 7 万,日内还一度跌破约 6.8 万的 200 周均线。
你更看重哪个:美元走强,还是杠杆出清?
#BitcoinBreaksBelow200WeekMovingAverage #Bitcoin

20
·
--
#bitcoinbreaksbelow200weekmovingaverage
🚨 LE BITCOIN PASSE SOUS SA MOYENNE MOBILE SUR 200 SEMAINES (~68 000 $), TANDIS QUE LE DOLLAR DÉPASSE 103 ET QUE LES RENDEMENTS GRIMPENT ! 📉⚠️
Le vendredi 13 novembre, le Bitcoin ($BTC) a franchi à la baisse l’une de ses lignes de tendance historiques les plus importantes, plongeant jusqu’à 67 640–67 652 $, et passant sous sa moyenne mobile sur 200 semaines (~68 000 $).
En baisse d’environ 16 % au cours du mois dernier et de 17 % ce trimestre, le $BTC a effacé ses gains depuis août, alors que le resserrement de la liquidité mondiale et la hausse des rendements entraînent une réduction généralisée des risques sur l’ensemble des classes d’actifs.
📌 Qu’est-ce qui a provoqué la cassure sous les 68 000 $ ?
💵 Hausse du dollar et des rendements des bons du Trésor : l’indice du dollar américain (DXY) a dépassé 103 (un sommet inédit depuis 19 mois, en avril 2025), tandis que le rendement des bons du Trésor à 10 ans a atteint 5,125 %, porté par les anticipations croissantes d’une hausse de 50 points de base du taux de la Fed en décembre, après la publication mardi de chiffres de l’inflation supérieurs aux attentes.
💥 Vague de liquidations dépassant 1,3 milliard de dollars : plus de 1,3 milliard de dollars de contrats à terme crypto à effet de levier ont été liquidés en 24 heures, dont 677 millions de dollars de positions longues sur le Bitcoin — ce qui a accéléré la chute après la rupture du seuil des 70 000 $.
📉 Baisse de l’activité on-chain et de la liquidité : l’offre de stablecoins a diminué de 14,2 milliards de dollars au cours des 30 derniers jours, tandis que le Bull Score Index de CryptoQuant est tombé à zéro, signe d’une faible demande au comptant malgré la présence d’ordres d’achat entre 68 000 et 72 500 $.
Qu'elle est votre stratégie ? partagez en commentaires👇
$BARD
{future}(BARDUSDT)
$SOPH
{future}(SOPHUSDT)
$AKE
{future}(AKEUSDT)
#bitcoinbreaksbelow200weekmovingaverage
🚨 LE BITCOIN PASSE SOUS SA MOYENNE MOBILE SUR 200 SEMAINES (~68 000 $), TANDIS QUE LE DOLLAR DÉPASSE 103 ET QUE LES RENDEMENTS GRIMPENT ! 📉⚠️
Le vendredi 13 novembre, le Bitcoin ($BTC) a franchi à la baisse l’une de ses lignes de tendance historiques les plus importantes, plongeant jusqu’à 67 640–67 652 $, et passant sous sa moyenne mobile sur 200 semaines (~68 000 $).
En baisse d’environ 16 % au cours du mois dernier et de 17 % ce trimestre, le $BTC a effacé ses gains depuis août, alors que le resserrement de la liquidité mondiale et la hausse des rendements entraînent une réduction généralisée des risques sur l’ensemble des classes d’actifs.
📌 Qu’est-ce qui a provoqué la cassure sous les 68 000 $ ?
💵 Hausse du dollar et des rendements des bons du Trésor : l’indice du dollar américain (DXY) a dépassé 103 (un sommet inédit depuis 19 mois, en avril 2025), tandis que le rendement des bons du Trésor à 10 ans a atteint 5,125 %, porté par les anticipations croissantes d’une hausse de 50 points de base du taux de la Fed en décembre, après la publication mardi de chiffres de l’inflation supérieurs aux attentes.
💥 Vague de liquidations dépassant 1,3 milliard de dollars : plus de 1,3 milliard de dollars de contrats à terme crypto à effet de levier ont été liquidés en 24 heures, dont 677 millions de dollars de positions longues sur le Bitcoin — ce qui a accéléré la chute après la rupture du seuil des 70 000 $.
📉 Baisse de l’activité on-chain et de la liquidité : l’offre de stablecoins a diminué de 14,2 milliards de dollars au cours des 30 derniers jours, tandis que le Bull Score Index de CryptoQuant est tombé à zéro, signe d’une faible demande au comptant malgré la présence d’ordres d’achat entre 68 000 et 72 500 $.
Qu'elle est votre stratégie ? partagez en commentaires👇
$BARD
$SOPH
$AKE
🚨 LE BITCOIN PASSE SOUS SA MOYENNE MOBILE SUR 200 SEMAINES (~68 000 $), TANDIS QUE LE DOLLAR DÉPASSE 103 ET QUE LES RENDEMENTS GRIMPENT ! 📉⚠️
Le vendredi 13 novembre, le Bitcoin ($BTC) a franchi à la baisse l’une de ses lignes de tendance historiques les plus importantes, plongeant jusqu’à 67 640–67 652 $, et passant sous sa moyenne mobile sur 200 semaines (~68 000 $).
En baisse d’environ 16 % au cours du mois dernier et de 17 % ce trimestre, le $BTC a effacé ses gains depuis août, alors que le resserrement de la liquidité mondiale et la hausse des rendements entraînent une réduction généralisée des risques sur l’ensemble des classes d’actifs.
📌 Qu’est-ce qui a provoqué la cassure sous les 68 000 $ ?
💵 Hausse du dollar et des rendements des bons du Trésor : l’indice du dollar américain (DXY) a dépassé 103 (un sommet inédit depuis 19 mois, en avril 2025), tandis que le rendement des bons du Trésor à 10 ans a atteint 5,125 %, porté par les anticipations croissantes d’une hausse de 50 points de base du taux de la Fed en décembre, après la publication mardi de chiffres de l’inflation supérieurs aux attentes.
💥 Vague de liquidations dépassant 1,3 milliard de dollars : plus de 1,3 milliard de dollars de contrats à terme crypto à effet de levier ont été liquidés en 24 heures, dont 677 millions de dollars de positions longues sur le Bitcoin — ce qui a accéléré la chute après la rupture du seuil des 70 000 $.
📉 Baisse de l’activité on-chain et de la liquidité : l’offre de stablecoins a diminué de 14,2 milliards de dollars au cours des 30 derniers jours, tandis que le Bull Score Index de CryptoQuant est tombé à zéro, signe d’une faible demande au comptant malgré la présence d’ordres d’achat entre 68 000 et 72 500 $.
Qu'elle est votre stratégie ? partagez en commentaires👇
$BARD
$SOPH
$AKE
64

·
--
#bitcoinbreaksbelow200weekmovingaverage
Bitcoin, 13 Kasım 2026 itibarıyla 67.500–67.652 dolar seviyelerine gerileyerek yaklaşık 67.993 dolar seviyesindeki 200 haftalık basit hareketli ortalamasının (200W SMA) altına sarktı. 📉₿ Bu kırılım, Bitcoin'in yaklaşık üç ay sonra ilk kez bu kritik uzun vadeli trend çizgisini aşağı yönlü test etmesi anlamına geliyor. 🚨📊
Düşüşü Tetikleyen Temel Faktörler
Güçlenen Dolar ve Tahvil Faizleri. ABD Dolar Endeksi'nin (DXY) 103 seviyesini aşarak 19 ayın zirvesine çıkması ve ABD 10 yıllık tahvil faizlerinin %5,12–5,15 bandına tırmanması riskli varlıklar üzerinde yoğun satış baskısı yarattı. 💵📈Teknoloji Piyasası Şoku ve Jeopolitik Gerilim. Nvidia CEO'su Jensen Huang'ın sürpriz istifası Asya borsaları ile Nasdaq vadeli işlemlerini aşağı çekerken, Orta Doğu'daki gerilimle petrolün yeniden yükselmesi enflasyon endişelerini körükledi. 💻🛢️Yüksek Kaldıraç Tasfiyeleri ve ETF Çıkışları. Son 24 saatte kripto piyasasında yaklaşık 1,6 milyar dolarlık vadeli işlem pozisyonu (yaklaşık 915 milyon doları Bitcoin) tasfiye edildi ve spot Bitcoin ETF'lerindeki sermaye çıkışları devam etti. 💥💸
Teknik Görünüm ve Kritik Seviyeler
57.700 Dolar Riski. Piyasa analistleri, haftalık kapanışın 200 haftalık ortalamanın (67.993 dolar) altında kalması ve haftalık RSI göstergesinin 41,5 desteğini kırması durumunda düşüşün 57.700 dolarlık döngü dibine kadar derinleşebileceği uyarısında bulunuyor. 🔻⚠️Tepki Yükselişi Şartı. Vadeli işlem fonlama oranlarının bir ay sonra ilk kez negatife dönmesi aşırı satıma işaret etse de, alıcıların yeniden kontrolü ele alması için fiyatın haftalık kapanışta 68.000 dolar üzerindeki 200 haftalık ortalamayı geri kazanması gerekiyor. 🔄🛡️
$BTC $SOL $ZEC
{future}(ZECUSDT)
{future}(SOLUSDT)
{future}(BTCUSDT)
#bitcoinbreaksbelow200weekmovingaverage
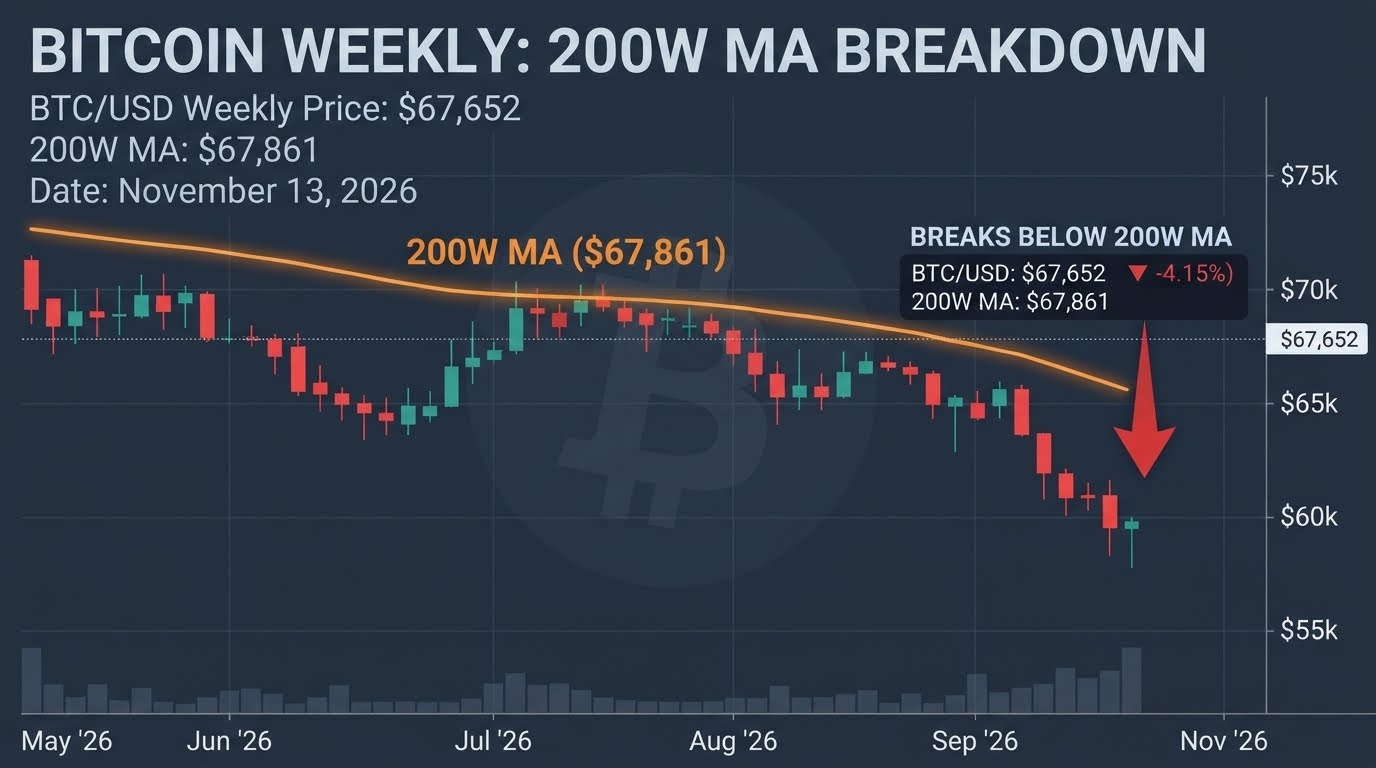
Bitcoin, 13 Kasım 2026 itibarıyla 67.500–67.652 dolar seviyelerine gerileyerek yaklaşık 67.993 dolar seviyesindeki 200 haftalık basit hareketli ortalamasının (200W SMA) altına sarktı. 📉₿ Bu kırılım, Bitcoin'in yaklaşık üç ay sonra ilk kez bu kritik uzun vadeli trend çizgisini aşağı yönlü test etmesi anlamına geliyor. 🚨📊
Düşüşü Tetikleyen Temel Faktörler
Güçlenen Dolar ve Tahvil Faizleri. ABD Dolar Endeksi'nin (DXY) 103 seviyesini aşarak 19 ayın zirvesine çıkması ve ABD 10 yıllık tahvil faizlerinin %5,12–5,15 bandına tırmanması riskli varlıklar üzerinde yoğun satış baskısı yarattı. 💵📈Teknoloji Piyasası Şoku ve Jeopolitik Gerilim. Nvidia CEO'su Jensen Huang'ın sürpriz istifası Asya borsaları ile Nasdaq vadeli işlemlerini aşağı çekerken, Orta Doğu'daki gerilimle petrolün yeniden yükselmesi enflasyon endişelerini körükledi. 💻🛢️Yüksek Kaldıraç Tasfiyeleri ve ETF Çıkışları. Son 24 saatte kripto piyasasında yaklaşık 1,6 milyar dolarlık vadeli işlem pozisyonu (yaklaşık 915 milyon doları Bitcoin) tasfiye edildi ve spot Bitcoin ETF'lerindeki sermaye çıkışları devam etti. 💥💸
Teknik Görünüm ve Kritik Seviyeler
57.700 Dolar Riski. Piyasa analistleri, haftalık kapanışın 200 haftalık ortalamanın (67.993 dolar) altında kalması ve haftalık RSI göstergesinin 41,5 desteğini kırması durumunda düşüşün 57.700 dolarlık döngü dibine kadar derinleşebileceği uyarısında bulunuyor. 🔻⚠️Tepki Yükselişi Şartı. Vadeli işlem fonlama oranlarının bir ay sonra ilk kez negatife dönmesi aşırı satıma işaret etse de, alıcıların yeniden kontrolü ele alması için fiyatın haftalık kapanışta 68.000 dolar üzerindeki 200 haftalık ortalamayı geri kazanması gerekiyor. 🔄🛡️
$BTC $SOL $ZEC
Bitcoin, 13 Kasım 2026 itibarıyla 67.500–67.652 dolar seviyelerine gerileyerek yaklaşık 67.993 dolar seviyesindeki 200 haftalık basit hareketli ortalamasının (200W SMA) altına sarktı. 📉₿ Bu kırılım, Bitcoin'in yaklaşık üç ay sonra ilk kez bu kritik uzun vadeli trend çizgisini aşağı yönlü test etmesi anlamına geliyor. 🚨📊
Düşüşü Tetikleyen Temel Faktörler
Güçlenen Dolar ve Tahvil Faizleri. ABD Dolar Endeksi'nin (DXY) 103 seviyesini aşarak 19 ayın zirvesine çıkması ve ABD 10 yıllık tahvil faizlerinin %5,12–5,15 bandına tırmanması riskli varlıklar üzerinde yoğun satış baskısı yarattı. 💵📈Teknoloji Piyasası Şoku ve Jeopolitik Gerilim. Nvidia CEO'su Jensen Huang'ın sürpriz istifası Asya borsaları ile Nasdaq vadeli işlemlerini aşağı çekerken, Orta Doğu'daki gerilimle petrolün yeniden yükselmesi enflasyon endişelerini körükledi. 💻🛢️Yüksek Kaldıraç Tasfiyeleri ve ETF Çıkışları. Son 24 saatte kripto piyasasında yaklaşık 1,6 milyar dolarlık vadeli işlem pozisyonu (yaklaşık 915 milyon doları Bitcoin) tasfiye edildi ve spot Bitcoin ETF'lerindeki sermaye çıkışları devam etti. 💥💸
Teknik Görünüm ve Kritik Seviyeler
57.700 Dolar Riski. Piyasa analistleri, haftalık kapanışın 200 haftalık ortalamanın (67.993 dolar) altında kalması ve haftalık RSI göstergesinin 41,5 desteğini kırması durumunda düşüşün 57.700 dolarlık döngü dibine kadar derinleşebileceği uyarısında bulunuyor. 🔻⚠️Tepki Yükselişi Şartı. Vadeli işlem fonlama oranlarının bir ay sonra ilk kez negatife dönmesi aşırı satıma işaret etse de, alıcıların yeniden kontrolü ele alması için fiyatın haftalık kapanışta 68.000 dolar üzerindeki 200 haftalık ortalamayı geri kazanması gerekiyor. 🔄🛡️
$BTC $SOL $ZEC
199

🚨 L’HEURE DE VÉRITÉ : LE BITCOIN TESTE SA MM SUR 200 SEMAINES 🚨
Nous testons officiellement l’un des indicateurs à long terme les plus critiques du marché des cryptomonnaies. Aujourd’hui, le Bitcoin est descendu jusqu’à la zone des $67,500, retestant directement la moyenne mobile sur 200 semaines, située autour de $67,760 à $67,975.
Voici la vérité sans filtre depuis le bureau d’un trader professionnel :
📉 Le scénario baissier : Si la clôture hebdomadaire s’établit nettement sous la MM sur 200 semaines, la tendance haussière de fond est menacée. La prochaine grande zone de support se situe entre $66,000 et $67,000. Si elle cède, le dernier plancher structurel se trouve à $62,300.
📈 Le scénario haussier : Cette même moyenne mobile a déjà absorbé la baisse de juillet et lancé le rallye d’août. De plus, le RSI journalier est actuellement en territoire de survente profonde (à 26). Historiquement, les mèches de capitulation sous cette moyenne mobile lente piègent les vendeurs tardifs avant un retournement.
Le plan de jeu :
Ne cédez pas à la panique en réagissant au bruit des fluctuations intrajournalières. Une seule mèche journalière ne signifie pas grand-chose : tout se jouera à la clôture hebdomadaire qui approche. Protégez votre capital, attendez une confirmation et observez la réaction du marché à cette ligne décisive.
Vous achetez ce retest ou vous attendez des niveaux plus bas ? Partagez votre stratégie ci-dessous.
#BitcoinBreaksBelow200WeekMovingAverage
$AKE
{future}(AKEUSDT)
$SOPH
{future}(SOPHUSDT)
🚨 L’HEURE DE VÉRITÉ : LE BITCOIN TESTE SA MM SUR 200 SEMAINES 🚨
Nous testons officiellement l’un des indicateurs à long terme les plus critiques du marché des cryptomonnaies. Aujourd’hui, le Bitcoin est descendu jusqu’à la zone des $67,500, retestant directement la moyenne mobile sur 200 semaines, située autour de $67,760 à $67,975.
Voici la vérité sans filtre depuis le bureau d’un trader professionnel :
📉 Le scénario baissier : Si la clôture hebdomadaire s’établit nettement sous la MM sur 200 semaines, la tendance haussière de fond est menacée. La prochaine grande zone de support se situe entre $66,000 et $67,000. Si elle cède, le dernier plancher structurel se trouve à $62,300.
📈 Le scénario haussier : Cette même moyenne mobile a déjà absorbé la baisse de juillet et lancé le rallye d’août. De plus, le RSI journalier est actuellement en territoire de survente profonde (à 26). Historiquement, les mèches de capitulation sous cette moyenne mobile lente piègent les vendeurs tardifs avant un retournement.
Le plan de jeu :
Ne cédez pas à la panique en réagissant au bruit des fluctuations intrajournalières. Une seule mèche journalière ne signifie pas grand-chose : tout se jouera à la clôture hebdomadaire qui approche. Protégez votre capital, attendez une confirmation et observez la réaction du marché à cette ligne décisive.
Vous achetez ce retest ou vous attendez des niveaux plus bas ? Partagez votre stratégie ci-dessous.
#BitcoinBreaksBelow200WeekMovingAverage
$AKE
$SOPH
Nous testons officiellement l’un des indicateurs à long terme les plus critiques du marché des cryptomonnaies. Aujourd’hui, le Bitcoin est descendu jusqu’à la zone des $67,500, retestant directement la moyenne mobile sur 200 semaines, située autour de $67,760 à $67,975.
Voici la vérité sans filtre depuis le bureau d’un trader professionnel :
📉 Le scénario baissier : Si la clôture hebdomadaire s’établit nettement sous la MM sur 200 semaines, la tendance haussière de fond est menacée. La prochaine grande zone de support se situe entre $66,000 et $67,000. Si elle cède, le dernier plancher structurel se trouve à $62,300.
📈 Le scénario haussier : Cette même moyenne mobile a déjà absorbé la baisse de juillet et lancé le rallye d’août. De plus, le RSI journalier est actuellement en territoire de survente profonde (à 26). Historiquement, les mèches de capitulation sous cette moyenne mobile lente piègent les vendeurs tardifs avant un retournement.
Le plan de jeu :
Ne cédez pas à la panique en réagissant au bruit des fluctuations intrajournalières. Une seule mèche journalière ne signifie pas grand-chose : tout se jouera à la clôture hebdomadaire qui approche. Protégez votre capital, attendez une confirmation et observez la réaction du marché à cette ligne décisive.
Vous achetez ce retest ou vous attendez des niveaux plus bas ? Partagez votre stratégie ci-dessous.
#BitcoinBreaksBelow200WeekMovingAverage
$AKE
$SOPH

101
·
--
#BitcoinBreaksBelow200WeekMovingAverage
Le bitcoin a brièvement chuté à 67 500, passant sous sa moyenne mobile sur 200 semaines, proche de 67 993 — un niveau que les traders surveillent de près depuis des années.
Le marché doit maintenant prendre une décision cruciale. 👇
🎯 SURVEILLANCE DU BTC
🔴 CONFIGURATION VENDEUSE
Déclencheur : le BTC ne parvient pas à repasser au-dessus de la zone des 68 000 $.
À surveiller : le volume vendeur et les retests peu convaincants.
Risque de baisse : zone des 60 000–57 700 $.
🟢 CONFIGURATION ACHETEUSE
Déclencheur : le BTC repasse au-dessus de 68 000 $ et s’y maintient lors d’un retest.
À surveiller : de forts achats au comptant et une dynamique en amélioration.
Confirmation : des creux de plus en plus hauts sur les unités de temps inférieures.
⚠️ Le RSI hebdomadaire, proche de 41,5, est un autre niveau important. Une cassure à la baisse pourrait accroître le risque de baisse, selon l’analyste Keith Alan.
$AKE
{future}(AKEUSDT)
$BARD
{future}(BARDUSDT)
$SOPH
{future}(SOPHUSDT)
#BitcoinBreaksBelow200WeekMovingAverage
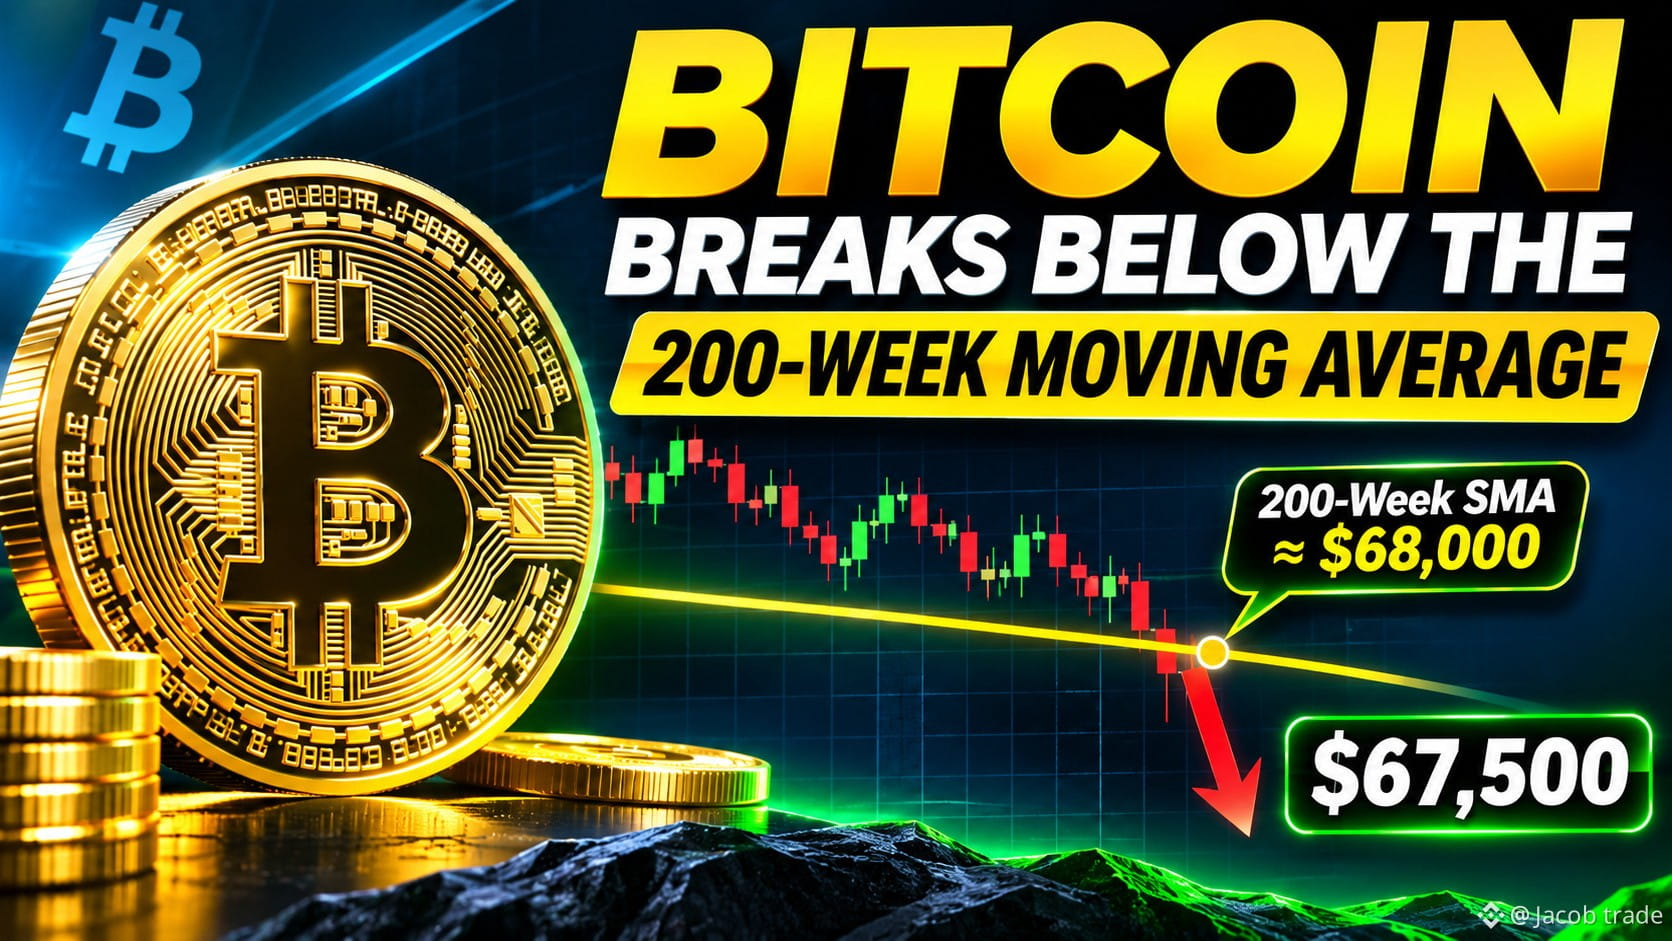
Le bitcoin a brièvement chuté à 67 500, passant sous sa moyenne mobile sur 200 semaines, proche de 67 993 — un niveau que les traders surveillent de près depuis des années.
Le marché doit maintenant prendre une décision cruciale. 👇
🎯 SURVEILLANCE DU BTC
🔴 CONFIGURATION VENDEUSE
Déclencheur : le BTC ne parvient pas à repasser au-dessus de la zone des 68 000 $.
À surveiller : le volume vendeur et les retests peu convaincants.
Risque de baisse : zone des 60 000–57 700 $.
🟢 CONFIGURATION ACHETEUSE
Déclencheur : le BTC repasse au-dessus de 68 000 $ et s’y maintient lors d’un retest.
À surveiller : de forts achats au comptant et une dynamique en amélioration.
Confirmation : des creux de plus en plus hauts sur les unités de temps inférieures.
⚠️ Le RSI hebdomadaire, proche de 41,5, est un autre niveau important. Une cassure à la baisse pourrait accroître le risque de baisse, selon l’analyste Keith Alan.
$AKE
$BARD
$SOPH
Le bitcoin a brièvement chuté à 67 500, passant sous sa moyenne mobile sur 200 semaines, proche de 67 993 — un niveau que les traders surveillent de près depuis des années.
Le marché doit maintenant prendre une décision cruciale. 👇
🎯 SURVEILLANCE DU BTC
🔴 CONFIGURATION VENDEUSE
Déclencheur : le BTC ne parvient pas à repasser au-dessus de la zone des 68 000 $.
À surveiller : le volume vendeur et les retests peu convaincants.
Risque de baisse : zone des 60 000–57 700 $.
🟢 CONFIGURATION ACHETEUSE
Déclencheur : le BTC repasse au-dessus de 68 000 $ et s’y maintient lors d’un retest.
À surveiller : de forts achats au comptant et une dynamique en amélioration.
Confirmation : des creux de plus en plus hauts sur les unités de temps inférieures.
⚠️ Le RSI hebdomadaire, proche de 41,5, est un autre niveau important. Une cassure à la baisse pourrait accroître le risque de baisse, selon l’analyste Keith Alan.
$AKE
$BARD
$SOPH
77

·
--
今晚21:30,PPI开牌,$BTC 这口气能不能喘过来就看这一锤子了
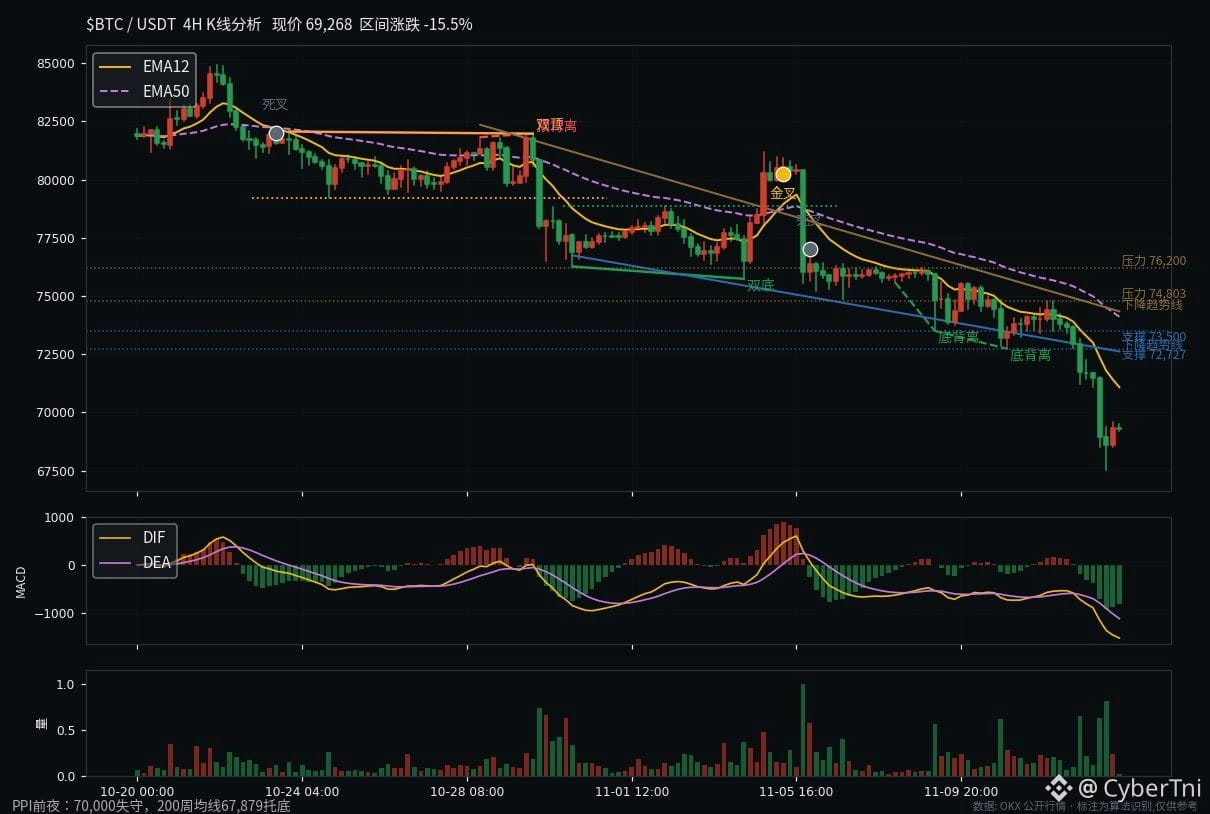
中午留了钩子,说PPI开牌前先把三条线对清楚,现在兑现。先看三个数:今晚21:30美国10月PPI,整体环比预期+0.4%,9月是+1.3%;核心环比预期+0.3%,9月是+0.7%;同比反而要从6.3%抬到6.6%,2022年11月以来最高。环比降温、同比抬头,今晚最拧巴的地方就在这,基数效应在捣鬼。
再看周二CPI那张牌:整体+0.4%超了预期的+0.3%,核心+0.3%也超了+0.2%。PPI要是再超预期,12月加息25个基点基本定价的前提下,50个基点的概率就得往上抬。美元已经19个月新高,$BTC 今天最低杀到67,510,现价69,268,200周均线67,879就在脚底下。
三条路我先摆出来:符合预期,67,500到70,000之间继续磨,70,000收不回去不谈反转;超预期,67,879一破,下一个能讲故事的整数位只剩65,000;低于预期,美元松一口气,$BTC 先看能不能站回70,000。
有一点我得承认,我算不明白的是服务项价格,医疗、金融服务这些数直接喂给PCE,CPI里已经偏热,PPI里要是再热,美联储12月那张牌就真不好打了。$ETH 今天最低也到过1,963,跟着$BTC 一起等答案,现货ETF五连流出抽走14.4亿,场外没有新钱接盘。
PPI这张牌你们怎么读?评论区帮我补一补,我21:30回来对账。
#WhatWillDriveCryptoandStocksNextRebound #BitcoinBreaksBelow200WeekMovingAverage #BTC #CryptoNews
今晚21:30,PPI开牌,$BTC 这口气能不能喘过来就看这一锤子了
中午留了钩子,说PPI开牌前先把三条线对清楚,现在兑现。先看三个数:今晚21:30美国10月PPI,整体环比预期+0.4%,9月是+1.3%;核心环比预期+0.3%,9月是+0.7%;同比反而要从6.3%抬到6.6%,2022年11月以来最高。环比降温、同比抬头,今晚最拧巴的地方就在这,基数效应在捣鬼。
再看周二CPI那张牌:整体+0.4%超了预期的+0.3%,核心+0.3%也超了+0.2%。PPI要是再超预期,12月加息25个基点基本定价的前提下,50个基点的概率就得往上抬。美元已经19个月新高,$BTC 今天最低杀到67,510,现价69,268,200周均线67,879就在脚底下。
三条路我先摆出来:符合预期,67,500到70,000之间继续磨,70,000收不回去不谈反转;超预期,67,879一破,下一个能讲故事的整数位只剩65,000;低于预期,美元松一口气,$BTC 先看能不能站回70,000。
有一点我得承认,我算不明白的是服务项价格,医疗、金融服务这些数直接喂给PCE,CPI里已经偏热,PPI里要是再热,美联储12月那张牌就真不好打了。$ETH 今天最低也到过1,963,跟着$BTC 一起等答案,现货ETF五连流出抽走14.4亿,场外没有新钱接盘。
PPI这张牌你们怎么读?评论区帮我补一补,我21:30回来对账。
#WhatWillDriveCryptoandStocksNextRebound #BitcoinBreaksBelow200WeekMovingAverage #BTC #CryptoNews
中午留了钩子,说PPI开牌前先把三条线对清楚,现在兑现。先看三个数:今晚21:30美国10月PPI,整体环比预期+0.4%,9月是+1.3%;核心环比预期+0.3%,9月是+0.7%;同比反而要从6.3%抬到6.6%,2022年11月以来最高。环比降温、同比抬头,今晚最拧巴的地方就在这,基数效应在捣鬼。
再看周二CPI那张牌:整体+0.4%超了预期的+0.3%,核心+0.3%也超了+0.2%。PPI要是再超预期,12月加息25个基点基本定价的前提下,50个基点的概率就得往上抬。美元已经19个月新高,$BTC 今天最低杀到67,510,现价69,268,200周均线67,879就在脚底下。
三条路我先摆出来:符合预期,67,500到70,000之间继续磨,70,000收不回去不谈反转;超预期,67,879一破,下一个能讲故事的整数位只剩65,000;低于预期,美元松一口气,$BTC 先看能不能站回70,000。
有一点我得承认,我算不明白的是服务项价格,医疗、金融服务这些数直接喂给PCE,CPI里已经偏热,PPI里要是再热,美联储12月那张牌就真不好打了。$ETH 今天最低也到过1,963,跟着$BTC 一起等答案,现货ETF五连流出抽走14.4亿,场外没有新钱接盘。
PPI这张牌你们怎么读?评论区帮我补一补,我21:30回来对账。
#WhatWillDriveCryptoandStocksNextRebound #BitcoinBreaksBelow200WeekMovingAverage #BTC #CryptoNews
347
Log in to explore more content
Join global crypto users on Binance Square
⚡️ Get latest and useful information about crypto.
💬 Trusted by the world’s largest crypto exchange.
👍 Discover real insights from verified creators.
Email / Phone number
Trending Topics
1
#USPPIMissMayEaseBTCPressure
81 views
41 Discussing
2
#WhatWillDriveCryptoandStocks’NextRebound?
77,855 views
1,088 Discussing
3
#BitcoinBreaksBelow200WeekMovingAverage
4,333 views
147 Discussing
4
#SpaceXTeslaMergerTalksWouldCombine30220BTC
1,176 views
57 Discussing
5
#Anthropic’s6xIPODemandSignalsPotentialRecordRaise
24,892 views
509 Discussing
6
#USCryptoETFsLose$1.48BInFiveDays
647 views
21 Discussing
7
#KoreaDigitalAssetBasicActFinalDraftExpectedEarlyJanuary
803 views
12 Discussing
8
#RippleRLUSDMarketCapSurpassesPayPalPYUSD
748 views
50 Discussing
9
#JaneStreetNearlyOctuplesFidelityBitcoinETFHoldings
9,180 views
163 Discussing
10
#HuangExitNvidiaStrategyInFocus
230,322 views
1,871 Discussing