bitcoinbreaksbelow200weekmovingaverage

KarmaTrade
·
--
Bullish
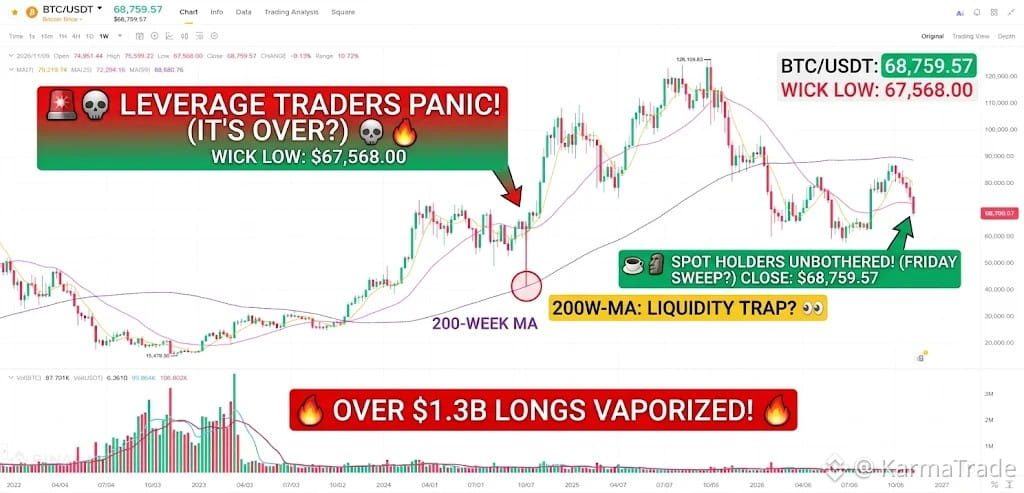
🚨 TIMELINE MELTDOWN: BITCOIN TOUCHES THE 200-WEEK MA! 😱📉 Every leverage trader on Crypto Twitter right now: "IT’S OVER! PACK IT UP! ZERO IS COMING!" 💀🔥 Meanwhile, spot holders watching BTC wick down to $67,568 and immediately bounce back toward $68,750: "Oh look, the classic Friday liquidation sweep." ☕🗿 Let’s be real: Over $1.3B in leveraged longs just got vaporized so Wall Street could grab cheap liquidity. An intraday wick below the 200-Week Moving Average (~$68K) is literally just a trap for late shorters—only the weekly close actually matters. While the timeline panics over 4H red candles, high-timeframe spot bags ($BTC, $XRP,$PYTH) stay completely unbothered. 🛡️⚡ Are you panic-selling the bottom wick, or laughing at the leverage wipeout? Drop your move below! 👇😂 $BTC $XRP $PYTH #bitcoinbreaksbelow200weekmovingaverage #BinanceSquare #crypto #altcoins {spot}(BTCUSDT)
🚨 TIMELINE MELTDOWN: BITCOIN TOUCHES THE 200-WEEK MA! 😱📉

Every leverage trader on Crypto Twitter right now:
"IT’S OVER! PACK IT UP! ZERO IS COMING!" 💀🔥

Meanwhile, spot holders watching BTC wick down to $67,568 and immediately bounce back toward $68,750:
"Oh look, the classic Friday liquidation sweep." ☕🗿

Let’s be real:

Over $1.3B in leveraged longs just got vaporized so Wall Street could grab cheap liquidity.

An intraday wick below the 200-Week Moving Average (~$68K) is literally just a trap for late shorters—only the weekly close actually matters.

While the timeline panics over 4H red candles, high-timeframe spot bags ($BTC , $XRP ,$PYTH ) stay completely unbothered. 🛡️⚡

Are you panic-selling the bottom wick, or laughing at the leverage wipeout? Drop your move below! 👇😂

$BTC $XRP $PYTH

#bitcoinbreaksbelow200weekmovingaverage #BinanceSquare #crypto #altcoins
🚨 THE MOMENT OF TRUTH: BITCOIN TESTS THE 200-WEEK MA 🚨 ​We are officially testing one of the most critical long-term indicators in crypto. Today, Bitcoin flushed down to the $67,500 zone, directly retesting the 200-Week Moving Average sitting around $67,760 to $67,975. ​Here is the unfiltered truth from a professional trader's desk: ​📉 The Bear Case: If we print a definitive weekly close below the 200-WMA, the structural uptrend is at risk. The next major support band rests between $66,000 and $67,000, and if that gives way, the final structural floor is $62,300. ​📈 The Bull Case: This exact same moving average caught the July sell-off and launched the August rally. Furthermore, the daily RSI is currently deeply oversold (registering at 26). Historically, capitulation wicks below this slow-moving average trap late shorts before a reversal. ​The Gameplan: Do not panic trade intraday noise. A single daily wick means little—the upcoming weekly close is everything. Protect your capital, wait for confirmation, and watch how the market reacts at this line in the sand. ​Are you buying this retest or waiting for lower levels? Drop your strategy below. 👇 $BTC $AKE $KGEN {future}(KGENUSDT) {future}(AKEUSDT) {future}(BTCUSDT) #bitcoinbreaksbelow200weekmovingaverage ​ #BTC #CryptoTrading #BinanceSquare
🚨 THE MOMENT OF TRUTH: BITCOIN TESTS THE 200-WEEK MA 🚨

​We are officially testing one of the most critical long-term indicators in crypto. Today, Bitcoin flushed down to the $67,500 zone, directly retesting the 200-Week Moving Average sitting around $67,760 to $67,975.

​Here is the unfiltered truth from a professional trader's desk:

​📉 The Bear Case: If we print a definitive weekly close below the 200-WMA, the structural uptrend is at risk. The next major support band rests between $66,000 and $67,000, and if that gives way, the final structural floor is $62,300.

​📈 The Bull Case: This exact same moving average caught the July sell-off and launched the August rally. Furthermore, the daily RSI is currently deeply oversold (registering at 26). Historically, capitulation wicks below this slow-moving average trap late shorts before a reversal.

​The Gameplan:

Do not panic trade intraday noise. A single daily wick means little—the upcoming weekly close is everything. Protect your capital, wait for confirmation, and watch how the market reacts at this line in the sand.

​Are you buying this retest or waiting for lower levels? Drop your strategy below. 👇
$BTC $AKE $KGEN

#bitcoinbreaksbelow200weekmovingaverage ​ #BTC #CryptoTrading #BinanceSquare
·
--
Bearish
Verified
#bitcoinbreaksbelow200weekmovingaverage 🚨 BITCOIN BREAKS BELOW ITS 200-WEEK MOVING AVERAGE (~$68,000) AS DOLLAR TOPS 103 & YIELDS SURGE! 📉⚠️ Bitcoin ($BTC) breached one of its most critical historical trendlines on Friday, November 13, dipping as low as $67,640 – $67,652 and slipping below its 200-week moving average (~$68,000). Now down roughly 16% over the past month and 17% this quarter, $BTC has erased its post-August gains as tightening global liquidity and rising yields trigger broad cross-asset de-risking. 📌 What Drove the Breakdown Below $68,000? 💵 Dollar & Treasury Yield Spike: The U.S. Dollar Index (DXY) climbed above 103 (a 19-month high since April 2025) while the 10-year Treasury yield hit 5.125%, fueled by rising bets on a 50 bps December Fed rate hike after Tuesday's hot inflation print. 💥 $1.3B+ Liquidation Cascade: Over $1.3 Billion in leveraged crypto futures were wiped out in 24 hours—including $677 Million in Bitcoin longs—accelerating the flush once $70,000 gave way. $ETH {future}(ETHUSDT) 📉 On-Chain & Liquidity Drain: Stablecoin supply contracted by $14.2 Billion over the past 30 days, while CryptoQuant’s Bull Score Index dropped to zero, reflecting thin spot demand despite resting buy clusters between $68,000 and $72,500. $XRP {future}(XRPUSDT) 📊 Key Technical Scenarios to Watch Before the Weekly Close Historically, the 200-week moving average has served as a generational bear-market floor—meaning how $BTC finishes the weekly candle matters far more than an intraday wick: $ZEC {future}(ZECUSDT) 🔴 Bearish Breakdown (Confirmed Weekly Close Below $68,000): A decisive weekly close below the 200-week MA—especially with weekly RSI slipping under 41.5—opens the door to deeper downside targets at $60,000 and the $57,700 cycle low. #SpaceXTeslaMergerTalksWouldCombine30220BTC #KoreaDigitalAssetBasicActFinalDraftExpectedEarlyJanuary #CryptoNews #Binance
#bitcoinbreaksbelow200weekmovingaverage
🚨 BITCOIN BREAKS BELOW ITS 200-WEEK MOVING AVERAGE (~$68,000) AS DOLLAR TOPS 103 & YIELDS SURGE! 📉⚠️

Bitcoin ($BTC) breached one of its most critical historical trendlines on Friday, November 13, dipping as low as $67,640 – $67,652 and slipping below its 200-week moving average (~$68,000).

Now down roughly 16% over the past month and 17% this quarter, $BTC has erased its post-August gains as tightening global liquidity and rising yields trigger broad cross-asset de-risking.

📌 What Drove the Breakdown Below $68,000?
💵 Dollar & Treasury Yield Spike: The U.S. Dollar Index (DXY) climbed above 103 (a 19-month high since April 2025) while the 10-year Treasury yield hit 5.125%, fueled by rising bets on a 50 bps December Fed rate hike after Tuesday's hot inflation print.

💥 $1.3B+ Liquidation Cascade: Over $1.3 Billion in leveraged crypto futures were wiped out in 24 hours—including $677 Million in Bitcoin longs—accelerating the flush once $70,000 gave way.
$ETH
📉 On-Chain & Liquidity Drain: Stablecoin supply contracted by $14.2 Billion over the past 30 days, while CryptoQuant’s Bull Score Index dropped to zero, reflecting thin spot demand despite resting buy clusters between $68,000 and $72,500.
$XRP
📊 Key Technical Scenarios to Watch Before the Weekly Close
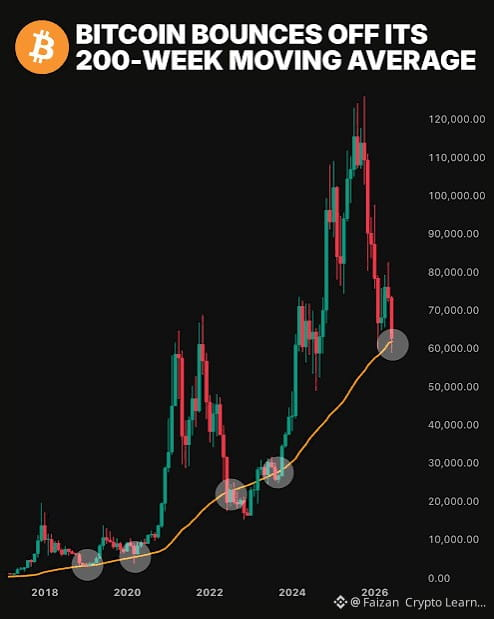
Historically, the 200-week moving average has served as a generational bear-market floor—meaning how $BTC finishes the weekly candle matters far more than an intraday wick:
$ZEC
🔴 Bearish Breakdown (Confirmed Weekly Close Below $68,000): A decisive weekly close below the 200-week MA—especially with weekly RSI slipping under 41.5—opens the door to deeper downside targets at $60,000 and the $57,700 cycle low.

#SpaceXTeslaMergerTalksWouldCombine30220BTC #KoreaDigitalAssetBasicActFinalDraftExpectedEarlyJanuary #CryptoNews #Binance
SHERAZ FAHEEM 01:
A well-designed Digital Asset Basic Act could help reduce uncertainty for exchanges, developers, institutions, and everyday investors.
#bitcoinbreaksbelow200weekmovingaverage 🚨 Bitcoin Loses Its 200-Week Moving Average — Is a Deeper Correction Coming? Bitcoin has broken below its 200-week moving average, one of the most closely watched long-term indicators in the crypto market. This level has historically acted as an important support zone during major market corrections. Losing it could signal weakening long-term momentum and increase uncertainty among investors. Why It Matters: Bearish pressure: $BTC trading below the 200-week MA raises concerns about further downside. Critical support: Bulls need to reclaim this level to restore confidence. Market sentiment: A sustained breakdown could trigger additional selling pressure across altcoins. My Take: Bitcoin's next move is critical. If buyers fail to reclaim the 200-week moving average, the market could face another wave of volatility. However, a quick recovery above this level could turn the breakdown into a potential bear trap. Will BTC reclaim the 200-week moving average, or are bears taking control? #bitcoin #BTC #CryptoMarket
#bitcoinbreaksbelow200weekmovingaverage
🚨 Bitcoin Loses Its 200-Week Moving Average — Is a Deeper Correction Coming?
Bitcoin has broken below its 200-week moving average, one of the most closely watched long-term indicators in the crypto market.
This level has historically acted as an important support zone during major market corrections. Losing it could signal weakening long-term momentum and increase uncertainty among investors.
Why It Matters:
Bearish pressure: $BTC trading below the 200-week MA raises concerns about further downside.
Critical support: Bulls need to reclaim this level to restore confidence.
Market sentiment: A sustained breakdown could trigger additional selling pressure across altcoins.
My Take: Bitcoin's next move is critical. If buyers fail to reclaim the 200-week moving average, the market could face another wave of volatility. However, a quick recovery above this level could turn the breakdown into a potential bear trap.
Will BTC reclaim the 200-week moving average, or are bears taking control?
#bitcoin #BTC #CryptoMarket
·
--
Verified
#BitcoinBreaksBelow200WeekMovingAverage 🚨 BITCOIN DROPS BELOW $70K — 200-WEEK MOVING AVERAGE UNDER PRESSURE Bitcoin (BTC) fell below $70,000 on Friday, November 13, briefly touching approximately $67,555 on Coinbase, its lowest level since August 2026. What Triggered the Sell-Off? 💵 The US Dollar Index climbed to a 19-month high, putting pressure on risk assets. 📉 Rising interest-rate expectations increased uncertainty across financial markets. 🏦 Traders increasingly priced in a possible Federal Reserve rate hike in December. ⚡ Approximately $1.4B–$1.6B in crypto positions were liquidated within 24 hours, with leveraged long positions accounting for most of the losses. Why the 200-Week Moving Average Matters Bitcoin's 200-week moving average was around $67,760–$68,000. BTC briefly traded below this historically important long-term indicator. However, an intraday breakdown does not confirm a sustained bearish trend. Key Levels to Watch 🔴 Bearish Scenario: A sustained weekly close below the 200-week moving average could increase the risk of further downside. 🟢 Bullish Scenario: A recovery above the $68K–$70K area could suggest that selling pressure is easing. Market Outlook The upcoming weekly candle close, US economic data, ETF flows and Federal Reserve expectations will be important in determining Bitcoin's next direction. A breakdown below the 200-week moving average does not automatically confirm a new bear market. Is Bitcoin preparing for a deeper correction, or could this be a major market shakeout? #Binance #JaneStreetNearlyOctuplesFidelityBitcoinETFHoldings #RippleRLUSDMarketCapSurpassesPayPalPYUSD #Anthropic’s6xIPODemandSignalsPotentialRecordRaise
#BitcoinBreaksBelow200WeekMovingAverage
🚨 BITCOIN DROPS BELOW $70K — 200-WEEK MOVING AVERAGE UNDER PRESSURE
Bitcoin (BTC) fell below $70,000 on Friday, November 13, briefly touching approximately $67,555 on Coinbase, its lowest level since August 2026.
What Triggered the Sell-Off?
💵 The US Dollar Index climbed to a 19-month high, putting pressure on risk assets.
📉 Rising interest-rate expectations increased uncertainty across financial markets.
🏦 Traders increasingly priced in a possible Federal Reserve rate hike in December.
⚡ Approximately $1.4B–$1.6B in crypto positions were liquidated within 24 hours, with leveraged long positions accounting for most of the losses.
Why the 200-Week Moving Average Matters
Bitcoin's 200-week moving average was around $67,760–$68,000.
BTC briefly traded below this historically important long-term indicator. However, an intraday breakdown does not confirm a sustained bearish trend.
Key Levels to Watch
🔴 Bearish Scenario: A sustained weekly close below the 200-week moving average could increase the risk of further downside.
🟢 Bullish Scenario: A recovery above the $68K–$70K area could suggest that selling pressure is easing.
Market Outlook
The upcoming weekly candle close, US economic data, ETF flows and Federal Reserve expectations will be important in determining Bitcoin's next direction.
A breakdown below the 200-week moving average does not automatically confirm a new bear market.
Is Bitcoin preparing for a deeper correction, or could this be a major market shakeout?
#Binance #JaneStreetNearlyOctuplesFidelityBitcoinETFHoldings #RippleRLUSDMarketCapSurpassesPayPalPYUSD #Anthropic’s6xIPODemandSignalsPotentialRecordRaise
Bitcoin has fallen below the critical 200-week moving average, a significant technical indicator that has historically acted as a long-term support level. This breach often signals a shift in market sentiment and can precede extended periods of bearish price action. Traders and investors are closely watching to see if this is a temporary dip or the start of a more prolonged downturn. The market is now focused on whether $BTC can reclaim this crucial level or if further downside is expected. This level is a key barometer for the long-term health of the Bitcoin market. Disclaimer: This is not investment advice. Always do your own research. #BitcoinBreaksBelow200WeekMovingAverage
Bitcoin has fallen below the critical 200-week moving average, a significant technical indicator that has historically acted as a long-term support level. This breach often signals a shift in market sentiment and can precede extended periods of bearish price action. Traders and investors are closely watching to see if this is a temporary dip or the start of a more prolonged downturn. The market is now focused on whether $BTC can reclaim this crucial level or if further downside is expected. This level is a key barometer for the long-term health of the Bitcoin market.

Disclaimer: This is not investment advice. Always do your own research.

#BitcoinBreaksBelow200WeekMovingAverage
🚨 BITCOIN FALLS TO $67,652 EVEN ITS 200-WEEK AVERAGE IS UNDER PRESSURE! The crypto market is facing another serious test. Bitcoin has dropped below its 200-week moving average near $68,000, a level many long-term traders watch closely. What's adding to the pressure? 📉 ETF outflows: Bitcoin ETFs have recorded around $1.56B in outflows during 2026, weakening the demand picture. 💵 Macro pressure: A stronger dollar and rising bond yields are making risk assets less attractive. ⚠️ Liquidations: Heavy futures liquidations are accelerating downside moves. 🔻 Altcoins: $ETH has slipped below $2,000, while $XRP and $SOL are also under pressure. 🏢 Strategy: Its reported quarterly profit was largely driven by unrealized Bitcoin gains, while its upcoming MSCI index removal adds another concern around potential passive fund flows. Meanwhile, US producer-price inflation rose 6.5% year over year, slightly below expectations. My take: This is a combination of macro pressure, weaker institutional flows and excessive leverage. I'm watching whether BTC can reclaim $68K or establish support below it. Do you think $68K becomes resistance now, or can Bitcoin recover it? #CryptoMarketMoves #ETFoutflows #MarketUpdate #BitcoinBreaksBelow200WeekMovingAverage #JaneStreetNearlyOctuplesFidelityBitcoinETFHoldings
🚨 BITCOIN FALLS TO $67,652 EVEN ITS 200-WEEK AVERAGE IS UNDER PRESSURE!

The crypto market is facing another serious test.

Bitcoin has dropped below its 200-week moving average near $68,000, a level many long-term traders watch closely.

What's adding to the pressure?

📉 ETF outflows: Bitcoin ETFs have recorded around $1.56B in outflows during 2026, weakening the demand picture.

💵 Macro pressure: A stronger dollar and rising bond yields are making risk assets less attractive.

⚠️ Liquidations: Heavy futures liquidations are accelerating downside moves.

🔻 Altcoins: $ETH has slipped below $2,000, while $XRP and $SOL are also under pressure.

🏢 Strategy: Its reported quarterly profit was largely driven by unrealized Bitcoin gains, while its upcoming MSCI index removal adds another concern around potential passive fund flows.

Meanwhile, US producer-price inflation rose 6.5% year over year, slightly below expectations.

My take: This is a combination of macro pressure, weaker institutional flows and excessive leverage. I'm watching whether BTC can reclaim $68K or establish support below it.

Do you think $68K becomes resistance now, or can Bitcoin recover it?

#CryptoMarketMoves #ETFoutflows #MarketUpdate #BitcoinBreaksBelow200WeekMovingAverage #JaneStreetNearlyOctuplesFidelityBitcoinETFHoldings
BITCOIN AT A CRITICAL TURNING POINT: 200-WEEK MOVING AVERAGE UNDER PRESSURE!Bitcoin is approaching one of the most important levels in its long-term market structure, and the latest price action is giving traders a serious reason to pay attention. BTC recently dropped toward $67,500, testing its 200-Week Simple Moving Average, currently sitting around $67,993. This is not just another support level. Historically, the 200-week moving average has played an important role during major Bitcoin market corrections. Here's what I'm watching right now. 👇 📉 THE BEARISH SCENARIO Bitcoin is already showing significant weakness, and a confirmed weekly close below the 200-week moving average could signal further downside risk. The important support zones I'm watching are: 🔻 $67,000 – Immediate support area 🔻 $65,000 – Next important downside target 🔻 $62,300 – Major structural support zone There is also a deeper downside scenario worth monitoring. Some market analysts have warned that Bitcoin could potentially revisit $57,700 if weekly momentum deteriorates further. 📈 THE BULLISH SCENARIO However, I wouldn't ignore the possibility of a recovery just yet. Bitcoin's daily RSI has fallen into oversold territory, suggesting that selling pressure has become stretched. The 200-week moving average has historically attracted attention from long-term buyers, and a strong reaction from this level could trigger a relief rally. If BTC successfully reclaims the $70,000 area, the next recovery levels to watch will be $72,000–$73,500. ⚠️ MY TRADING GAMEPLAN I'm not interested in making emotional decisions during this kind of volatility. The most important thing right now is the weekly candle close. A temporary move below the 200-week moving average doesn't automatically confirm a long-term breakdown. But if Bitcoin closes decisively below this level and fails to recover it, the bearish scenario becomes much more concerning. For now, I'm watching price action, volume, RSI, and liquidity before considering the next major move. 🔥 THE BIG QUESTION: Will the 200-week moving average once again become Bitcoin's strongest support, or are we about to see a deeper correction toward $62K and potentially lower? Are you buying this dip, or waiting for confirmation? Drop your thoughts below! 👇 $BTC $AKE $KGEN #bitcoinbreaksbelow200weekmovingaverage #BTC #CryptoTrading #BinanceSquare {future}(KGENUSDT) {alpha}(560x2c3a8ee94ddd97244a93bc48298f97d2c412f7db) {spot}(BTCUSDT)

BITCOIN AT A CRITICAL TURNING POINT: 200-WEEK MOVING AVERAGE UNDER PRESSURE!

Bitcoin is approaching one of the most important levels in its long-term market structure, and the latest price action is giving traders a serious reason to pay attention.
BTC recently dropped toward $67,500, testing its 200-Week Simple Moving Average, currently sitting around $67,993.
This is not just another support level. Historically, the 200-week moving average has played an important role during major Bitcoin market corrections.
Here's what I'm watching right now. 👇
📉 THE BEARISH SCENARIO
Bitcoin is already showing significant weakness, and a confirmed weekly close below the 200-week moving average could signal further downside risk.
The important support zones I'm watching are:
🔻 $67,000 – Immediate support area
🔻 $65,000 – Next important downside target
🔻 $62,300 – Major structural support zone
There is also a deeper downside scenario worth monitoring. Some market analysts have warned that Bitcoin could potentially revisit $57,700 if weekly momentum deteriorates further.
📈 THE BULLISH SCENARIO
However, I wouldn't ignore the possibility of a recovery just yet.
Bitcoin's daily RSI has fallen into oversold territory, suggesting that selling pressure has become stretched.
The 200-week moving average has historically attracted attention from long-term buyers, and a strong reaction from this level could trigger a relief rally.
If BTC successfully reclaims the $70,000 area, the next recovery levels to watch will be $72,000–$73,500.
⚠️ MY TRADING GAMEPLAN
I'm not interested in making emotional decisions during this kind of volatility.
The most important thing right now is the weekly candle close.
A temporary move below the 200-week moving average doesn't automatically confirm a long-term breakdown.
But if Bitcoin closes decisively below this level and fails to recover it, the bearish scenario becomes much more concerning.
For now, I'm watching price action, volume, RSI, and liquidity before considering the next major move.
🔥 THE BIG QUESTION:
Will the 200-week moving average once again become Bitcoin's strongest support, or are we about to see a deeper correction toward $62K and potentially lower?
Are you buying this dip, or waiting for confirmation? Drop your thoughts below! 👇
$BTC $AKE $KGEN
#bitcoinbreaksbelow200weekmovingaverage #BTC #CryptoTrading #BinanceSquare
🚨One intraday print below the 200-week average is not a confirmed weekly breakdown. #bitcoinbreaksbelow200weekmovingaverage On November 13, Bitcoin briefly traded around $67,500, slipping below the reported 200-week simple moving average near $67,993. But the Square 6H most searched later shows BTC at $69,626.5 — back above that reference level by roughly 2.4%. The accurate description is a retest with a brief breach, not yet a confirmed loss on the weekly close. The 200-week average matters because traders watch it as a long-term cycle reference. It has acted as support or resistance in previous bear-market periods. But it is not a guaranteed floor, and history does not promise that it will hold every time. One analyst has outlined a possible $57,700 revisit if weekly RSI loses 41.5. That is a conditional scenario, not a price target or certainty. The evidence that matters now is the weekly close, whether BTC can hold the reclaim, and whether ETF demand stops deteriorating. Also, do not confuse the 200-week average with the 200-day average. They are different indicators. Not financial advice. $BTC {future}(BTCUSDT) #BitcoinBreaksBelow200WeekMovingAverage #USPPIMissMayEaseBTCPressure #WhatWillDriveCryptoandStocks’NextRebound? #SpaceXTeslaMergerTalksWouldCombine30220BTC
🚨One intraday print below the 200-week average is not a confirmed weekly breakdown.
#bitcoinbreaksbelow200weekmovingaverage

On November 13, Bitcoin briefly traded around $67,500, slipping below the reported 200-week simple moving average near $67,993.
But the Square 6H most searched later shows BTC at $69,626.5 — back above that reference level by roughly 2.4%.

The accurate description is a retest with a brief breach, not yet a confirmed loss on the weekly close.

The 200-week average matters because traders watch it as a long-term cycle reference. It has acted as support or resistance in previous bear-market periods. But it is not a guaranteed floor, and history does not promise that it will hold every time.

One analyst has outlined a possible $57,700 revisit if weekly RSI loses 41.5. That is a conditional scenario, not a price target or certainty.

The evidence that matters now is the weekly close, whether BTC can hold the reclaim, and whether ETF demand stops deteriorating.

Also, do not confuse the 200-week average with the 200-day average. They are different indicators.

Not financial advice.
$BTC
#BitcoinBreaksBelow200WeekMovingAverage #USPPIMissMayEaseBTCPressure #WhatWillDriveCryptoandStocks’NextRebound? #SpaceXTeslaMergerTalksWouldCombine30220BTC
Article
At first, I was ready to start scaling into spot right hereI’ve been staring at the weekly chart for the last three hours after $BTC slipped under $68,000, and honestly, I can't tell if I'm watching a generational buy zone or a slow-motion liquidity trap. My timeline is a complete split-screen right now. Half of CT is popping champagne because we finally tagged the 200-week moving average, and the other half is already calling for an immediate flush to $57,700. At first, I was ready to start scaling into spot right here. Then I pulled up the stablecoin flow data next to the order books, and my whole thesis started feeling a lot shakier 🧵👇 Everyone treats the 200-week MA—currently sitting right around $67,993—like some kind of magical concrete floor. From my experience watching previous cycles, it almost never works that cleanly in real time. In March 2020, we wicked violently below it during the liquidity crunch. In June 2022, $BTC broke underneath it and spent months grinding sideways before a real recovery even started. An intraday dip to $67,500 doesn't break the long-term chart by itself. What actually matters is where Sunday’s weekly candle closes—and right now, the mechanics underneath this bounce look super conflicted. Here is the exact loop playing out right now: US 10-year Treasury yields spike past 5.12%, tech equities wobble, and institutional desks automatically de-risk. Because traditional markets close and crypto runs 24/7, $BTC becomes the easiest ATM on earth to sell for instant cash. When that selling hits spot exchanges, it slams directly into a massive wall of resting buy orders sitting between $68,000 and $72,500. Combine that with a daily RSI buried under 30 and CryptoQuant’s Bull Score Index literally sitting at zero, and you get the exact recipe for a sharp relief bounce. Even $BNB and a few large-cap exchange tokens are holding up surprisingly well once the forced leverage clears out. But here’s what keeps nagging at me... 🤔 For a 200-week MA bounce to actually hold, fresh stablecoin inflows have to outpace institutional redemptions. Right now, that constraint is actively breaking. Over the last 30 days, total stablecoin supply shrank by roughly $14.2 billion. In past bull-market dips, buyers stepped in immediately because billions in USDT andUSDC were sitting on the sidelines waiting for a discount. Today, money isn't rotating out of $BTC into stables to wait for lower prices—it is leaving the crypto ecosystem altogether. If resting spot bids absorb this wave of selling, who is left to push price higher when there’s no fresh dry powder coming in behind them? I’m also looking at the weekly RSI hovering right around 41.5. If we fail to reclaim $68,000 by Sunday night and that weekly momentum slips, there is barely any structural liquidity between here and the $57,700–$60,000 pocket. Honestly, I’m torn. Buying washed-out sentiment at a multi-year moving average has paid me more times than not, yet buying into a $14 billion liquidity drain feels like stepping in front of a train just because the chart looks oversold. I’m sitting on my hands until Sunday’s close to see whether the spot order book wall wins, or if macro gravity pulls us straight into that $60k gap. How are you playing this—do you trust the 200-week MA order book support right here, or does shrinking stablecoin supply keep you sidelined until $60k? Let me know what you're seeing 👇 #BitcoinBreaksBelow200WeekMovingAverage #BTC #CryptoMarket #Write2Earn Not financial advice. Always DYOR.


At first, I was ready to start scaling into spot right here

I’ve been staring at the weekly chart for the last three hours after $BTC slipped under $68,000, and honestly, I can't tell if I'm watching a generational buy zone or a slow-motion liquidity trap.
My timeline is a complete split-screen right now. Half of CT is popping champagne because we finally tagged the 200-week moving average, and the other half is already calling for an immediate flush to $57,700.
At first, I was ready to start scaling into spot right here. Then I pulled up the stablecoin flow data next to the order books, and my whole thesis started feeling a lot shakier 🧵👇
Everyone treats the 200-week MA—currently sitting right around $67,993—like some kind of magical concrete floor.
From my experience watching previous cycles, it almost never works that cleanly in real time. In March 2020, we wicked violently below it during the liquidity crunch. In June 2022, $BTC broke underneath it and spent months grinding sideways before a real recovery even started.
An intraday dip to $67,500 doesn't break the long-term chart by itself. What actually matters is where Sunday’s weekly candle closes—and right now, the mechanics underneath this bounce look super conflicted.
Here is the exact loop playing out right now: US 10-year Treasury yields spike past 5.12%, tech equities wobble, and institutional desks automatically de-risk. Because traditional markets close and crypto runs 24/7, $BTC becomes the easiest ATM on earth to sell for instant cash.
When that selling hits spot exchanges, it slams directly into a massive wall of resting buy orders sitting between $68,000 and $72,500. Combine that with a daily RSI buried under 30 and CryptoQuant’s Bull Score Index literally sitting at zero, and you get the exact recipe for a sharp relief bounce.
Even $BNB and a few large-cap exchange tokens are holding up surprisingly well once the forced leverage clears out.
But here’s what keeps nagging at me... 🤔
For a 200-week MA bounce to actually hold, fresh stablecoin inflows have to outpace institutional redemptions. Right now, that constraint is actively breaking.
Over the last 30 days, total stablecoin supply shrank by roughly $14.2 billion. In past bull-market dips, buyers stepped in immediately because billions in USDT andUSDC were sitting on the sidelines waiting for a discount.
Today, money isn't rotating out of $BTC into stables to wait for lower prices—it is leaving the crypto ecosystem altogether. If resting spot bids absorb this wave of selling, who is left to push price higher when there’s no fresh dry powder coming in behind them?
I’m also looking at the weekly RSI hovering right around 41.5. If we fail to reclaim $68,000 by Sunday night and that weekly momentum slips, there is barely any structural liquidity between here and the $57,700–$60,000 pocket.
Honestly, I’m torn. Buying washed-out sentiment at a multi-year moving average has paid me more times than not, yet buying into a $14 billion liquidity drain feels like stepping in front of a train just because the chart looks oversold.
I’m sitting on my hands until Sunday’s close to see whether the spot order book wall wins, or if macro gravity pulls us straight into that $60k gap.
How are you playing this—do you trust the 200-week MA order book support right here, or does shrinking stablecoin supply keep you sidelined until $60k? Let me know what you're seeing 👇
#BitcoinBreaksBelow200WeekMovingAverage #BTC #CryptoMarket #Write2Earn
Not financial advice. Always DYOR.
#bitcoinbreaksbelow200weekmovingaverage 🚨 Bitcoin Breaks Below Its 200-Week Moving Average Bitcoin has moved below its 200-week moving average, putting one of the market’s most closely watched long-term trend indicators under pressure. The 200-week MA has historically been an important reference during major Bitcoin corrections. A sustained break below it could reinforce bearish sentiment and increase caution among traders, while a quick recovery above the level would weaken the bearish signal. For now, traders are watching the weekly close closely. Holding below the 200-week MA would be more significant than a brief intraday move beneath it. Bottom line: The near-term setup is bearish, but confirmation depends on whether Bitcoin can reclaim the 200-week moving average. #BTCMarket #BitcoinAnalysis #CryptoTrends #MarketStructure $BULLA $BANANAS31 $ERA {future}(ERAUSDT) {future}(BANANAS31USDT) {future}(BULLAUSDT)
#bitcoinbreaksbelow200weekmovingaverage
🚨 Bitcoin Breaks Below Its 200-Week Moving Average
Bitcoin has moved below its 200-week moving average, putting one of the market’s most closely watched long-term trend indicators under pressure.
The 200-week MA has historically been an important reference during major Bitcoin corrections. A sustained break below it could reinforce bearish sentiment and increase caution among traders, while a quick recovery above the level would weaken the bearish signal.
For now, traders are watching the weekly close closely. Holding below the 200-week MA would be more significant than a brief intraday move beneath it.
Bottom line: The near-term setup is bearish, but confirmation depends on whether Bitcoin can reclaim the 200-week moving average.
#BTCMarket #BitcoinAnalysis #CryptoTrends #MarketStructure
$BULLA $BANANAS31 $ERA
"BTC fell below its 200-week average. Should I wait?" (200-week average = mean price of the last ~4 years.) You don't need to guess the bottom. A small fixed amount on the same day each month does the timing. $BTC Fixed monthly or wait for a bounce? #BitcoinBreaksBelow200WeekMovingAverage #Bitcoin
"BTC fell below its 200-week average. Should I wait?"
(200-week average = mean price of the last ~4 years.)
You don't need to guess the bottom. A small fixed amount on the same day each month does the timing.
$BTC
Fixed monthly or wait for a bounce?
#BitcoinBreaksBelow200WeekMovingAverage #Bitcoin
#bitcoinbreaksbelow200weekmovingaverage Bitcoin just dropped below its 200-week moving average for the first time in 11 weeks, hitting a low near $67,500. This major price line sits around $68,000 and usually acts as a safety net during market drops. A stronger US dollar, high bond yields, and heavy money outflows from Bitcoin ETFs pushed the price down. Over $1.3 billion in crypto trades got wiped out in one day. Traders are now watching closely to see if Bitcoin bounces back or falls toward $57,700. $SOL $BTC $ETH {future}(ETHUSDT) {future}(SOLUSDT) {future}(BTCUSDT)
#bitcoinbreaksbelow200weekmovingaverage
Bitcoin just dropped below its 200-week moving average for the first time in 11 weeks, hitting a low near $67,500. This major price line sits around $68,000 and usually acts as a safety net during market drops. A stronger US dollar, high bond yields, and heavy money outflows from Bitcoin ETFs pushed the price down. Over $1.3 billion in crypto trades got wiped out in one day. Traders are now watching closely to see if Bitcoin bounces back or falls toward $57,700.
$SOL $BTC $ETH
#bitcoinbreaksbelow200weekmovingaverage Bitcoin’s 200-week line is under pressure. But is the breakdown confirmed? 🔍 On Nov 13, BTC briefly fell to about $67,500, below the 200-week SMA near $67,993 — its first test since Aug 19, according to Cointelegraph. That is a serious retest, not yet proof of a lasting weekly breakdown. Cross-check: • The 200-week MA averages roughly four years of prices. Bitcoinomics’ CoinMetrics-based series shows BTC has closed below it on 8.2% of days since 2014; in 2022, one stretch lasted 318 days. So “historical floor” does not mean unbreakable. • Keith Alan says a weekly RSI loss below 41.5 could expose the $57,700 cycle low. That is a conditional risk scenario, not a forecast. • The key test is whether BTC reclaims and holds ~$68K, or closes the week below it and fails to recover. My take: Watch the weekly close, RSI and spot demand—not one intraday wick. Is this a bear trap or a deeper cycle reset? $BTC {future}(BTCUSDT) #BitcoinAnalysis #CryptoMarket
#bitcoinbreaksbelow200weekmovingaverage
Bitcoin’s 200-week line is under pressure. But is the breakdown confirmed? 🔍
On Nov 13, BTC briefly fell to about $67,500, below the 200-week SMA near $67,993 — its first test since Aug 19, according to Cointelegraph. That is a serious retest, not yet proof of a lasting weekly breakdown.
Cross-check:
• The 200-week MA averages roughly four years of prices. Bitcoinomics’ CoinMetrics-based series shows BTC has closed below it on 8.2% of days since 2014; in 2022, one stretch lasted 318 days. So “historical floor” does not mean unbreakable.
• Keith Alan says a weekly RSI loss below 41.5 could expose the $57,700 cycle low. That is a conditional risk scenario, not a forecast.
• The key test is whether BTC reclaims and holds ~$68K, or closes the week below it and fails to recover.
My take: Watch the weekly close, RSI and spot demand—not one intraday wick. Is this a bear trap or a deeper cycle reset?
$BTC
#BitcoinAnalysis #CryptoMarket
#bitcoinbreaksbelow200weekmovingaverage Bitcoin dropped to $67,500 on Friday, briefly breaking below its 200-week moving average near $68,000 for the first time in 11 weeks. This key line tracks four-year price trends and usually acts as a major safety net during market drops. Heavy ETF outflows, tech stock losses after Nvidia's CEO resigned, and fears of a December interest rate hike caused the fall. Buyers quickly pushed Bitcoin back near $69,800, though analysts warn prices could drop toward $63,000 if selling continues. $BTC $BNB $XRP {future}(XRPUSDT) {future}(BNBUSDT) {future}(BTCUSDT)
#bitcoinbreaksbelow200weekmovingaverage
Bitcoin dropped to $67,500 on Friday, briefly breaking below its 200-week moving average near $68,000 for the first time in 11 weeks. This key line tracks four-year price trends and usually acts as a major safety net during market drops.

Heavy ETF outflows, tech stock losses after Nvidia's CEO resigned, and fears of a December interest rate hike caused the fall. Buyers quickly pushed Bitcoin back near $69,800, though analysts warn prices could drop toward $63,000 if selling continues.
$BTC $BNB $XRP
#BitcoinBreaksBelow200WeekMovingAverage 📏 $68K Line Lost: BTC's First 200-Week Test Since August Bitcoin slipped under its 200-week average today, the line that marked the 2018 and 2020 bottoms but failed in 2022. 📉 Low near $67.5K vs a 200-week SMA of ~$67,993 📊 Crypto market cap -5.3% in 24h to $2.32T ⚠️ Fear & Greed at 20, its lowest since July 📅 Last touch was Aug 19, 11 weeks ago My read: a weekly close counts more than an intraday wick. The line is up 22.8% in a year, a higher floor, not a promise. Sunday's weekly close: above $68K or below it? 👇 $BTC #BitcoinBreaksBelow200WeekMovingAverage #Bitcoin #CryptoMarket
#BitcoinBreaksBelow200WeekMovingAverage
📏 $68K Line Lost: BTC's First 200-Week Test Since August

Bitcoin slipped under its 200-week average today, the line that marked the 2018 and 2020 bottoms but failed in 2022.

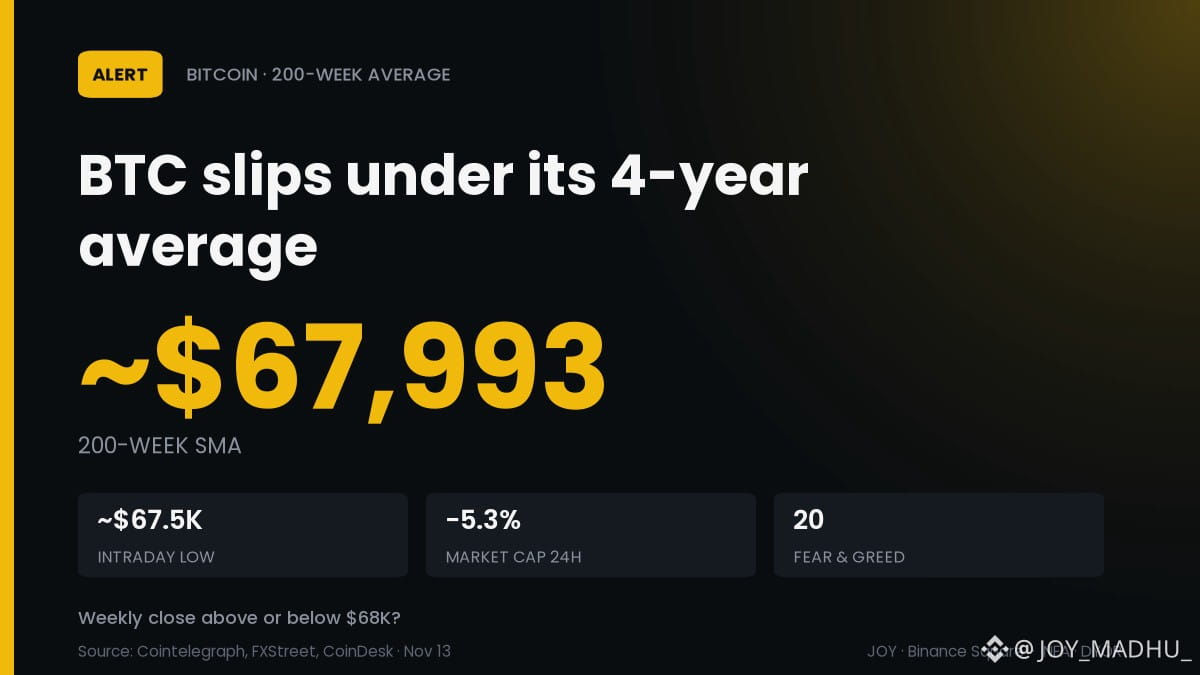
📉 Low near $67.5K vs a 200-week SMA of ~$67,993
📊 Crypto market cap -5.3% in 24h to $2.32T
⚠️ Fear & Greed at 20, its lowest since July
📅 Last touch was Aug 19, 11 weeks ago

My read: a weekly close counts more than an intraday wick. The line is up 22.8% in a year, a higher floor, not a promise.

Sunday's weekly close: above $68K or below it? 👇

$BTC
#BitcoinBreaksBelow200WeekMovingAverage #Bitcoin #CryptoMarket
Binance Market Update: Bitcoin Drops Below $67,652 as ETF Outflows Reach $1.56 Billion Bitcoin is facing strong selling pressure after falling to $67,652 on November 13, 2026. The price dropped below its important 200-week moving average, raising concerns about a possible further decline. The US Dollar Index (DXY) has also moved above 103, making the situation more challenging for cryptocurrencies. A stronger dollar and rising US bond yields are encouraging investors to become more cautious about risky assets like Bitcoin. Another major concern is Bitcoin ETF withdrawals. US spot Bitcoin ETFs have recorded approximately $1.56 billion in net outflows in 2026, showing weaker institutional demand. What Happens Next? Bitcoin needs to recover the $68,000 level to improve market confidence. If selling continues, analysts warn that the price could move toward $57,700. However, this is only a possible scenario, not a confirmed prediction. Final Thoughts Bitcoin is under pressure from falling prices, a stronger US dollar, rising bond yields, and large ETF outflows. Investors are now watching the $68,000 level closely to see whether Bitcoin can recover or continue falling. $BTC $BNB $ETH #USPPIMissMayEaseBTCPressure #WhatWillDriveCryptoandStocks’NextRebound? #BitcoinBreaksBelow200WeekMovingAverage
Binance Market Update: Bitcoin Drops Below $67,652 as ETF Outflows Reach $1.56 Billion

Bitcoin is facing strong selling pressure after falling to $67,652 on November 13, 2026. The price dropped below its important 200-week moving average, raising concerns about a possible further decline.
The US Dollar Index (DXY) has also moved above 103, making the situation more challenging for cryptocurrencies. A stronger dollar and rising US bond yields are encouraging investors to become more cautious about risky assets like Bitcoin.
Another major concern is Bitcoin ETF withdrawals. US spot Bitcoin ETFs have recorded approximately $1.56 billion in net outflows in 2026, showing weaker institutional demand.

What Happens Next?

Bitcoin needs to recover the $68,000 level to improve market confidence. If selling continues, analysts warn that the price could move toward $57,700. However, this is only a possible scenario, not a confirmed prediction.

Final Thoughts

Bitcoin is under pressure from falling prices, a stronger US dollar, rising bond yields, and large ETF outflows. Investors are now watching the $68,000 level closely to see whether Bitcoin can recover or continue falling.
$BTC $BNB $ETH
#USPPIMissMayEaseBTCPressure #WhatWillDriveCryptoandStocks’NextRebound? #BitcoinBreaksBelow200WeekMovingAverage
Bitcoin Up or Down - November 13, 9:50AM-9:55AM ET

Bitcoin Up or Down - November 13, 9:50AM-9:55AM ET

98%Up1%Down
Volume $5,369,334.87
·
--
Bullish
Bitcoin fell as low as $67,652, below its 200-week moving average near $68,000, and under $70,000 for the first time since August 19. The Dollar Index rose above 103, its highest since April 2025, and the US 10-year yield hit 5.125%. More than $1.3B in crypto futures was liquidated in 24 hours, $677M of it bitcoin. US spot bitcoin ETFs are now down $1.56B for 2026 after losing about $2.57B since October 30. October PPI rose 6.5% year over year, just below the 6.6% forecast. Strategy reported a $19.53B quarterly#BitcoinBreaksBelow200WeekMovingAverage #BitcoinBreaksBelow200WeekMovingAverage #HuangExitNvidiaStrategyInFocus $NVDAB
Log in to explore more content
Join global crypto users on Binance Square
⚡️ Get latest and useful information about crypto.
💬 Trusted by the world’s largest crypto exchange.
👍 Discover real insights from verified creators.
Email / Phone number