

Rishu Kumar Gupta
128 Posts

Rishu Kumar Gupta
Report
Block User
Frequent Trader
4.7 Years
11 Following
26 Followers
29 Liked
Posts
All
Videos
$NEAR hit the trigger. Now comes the part most people skip.
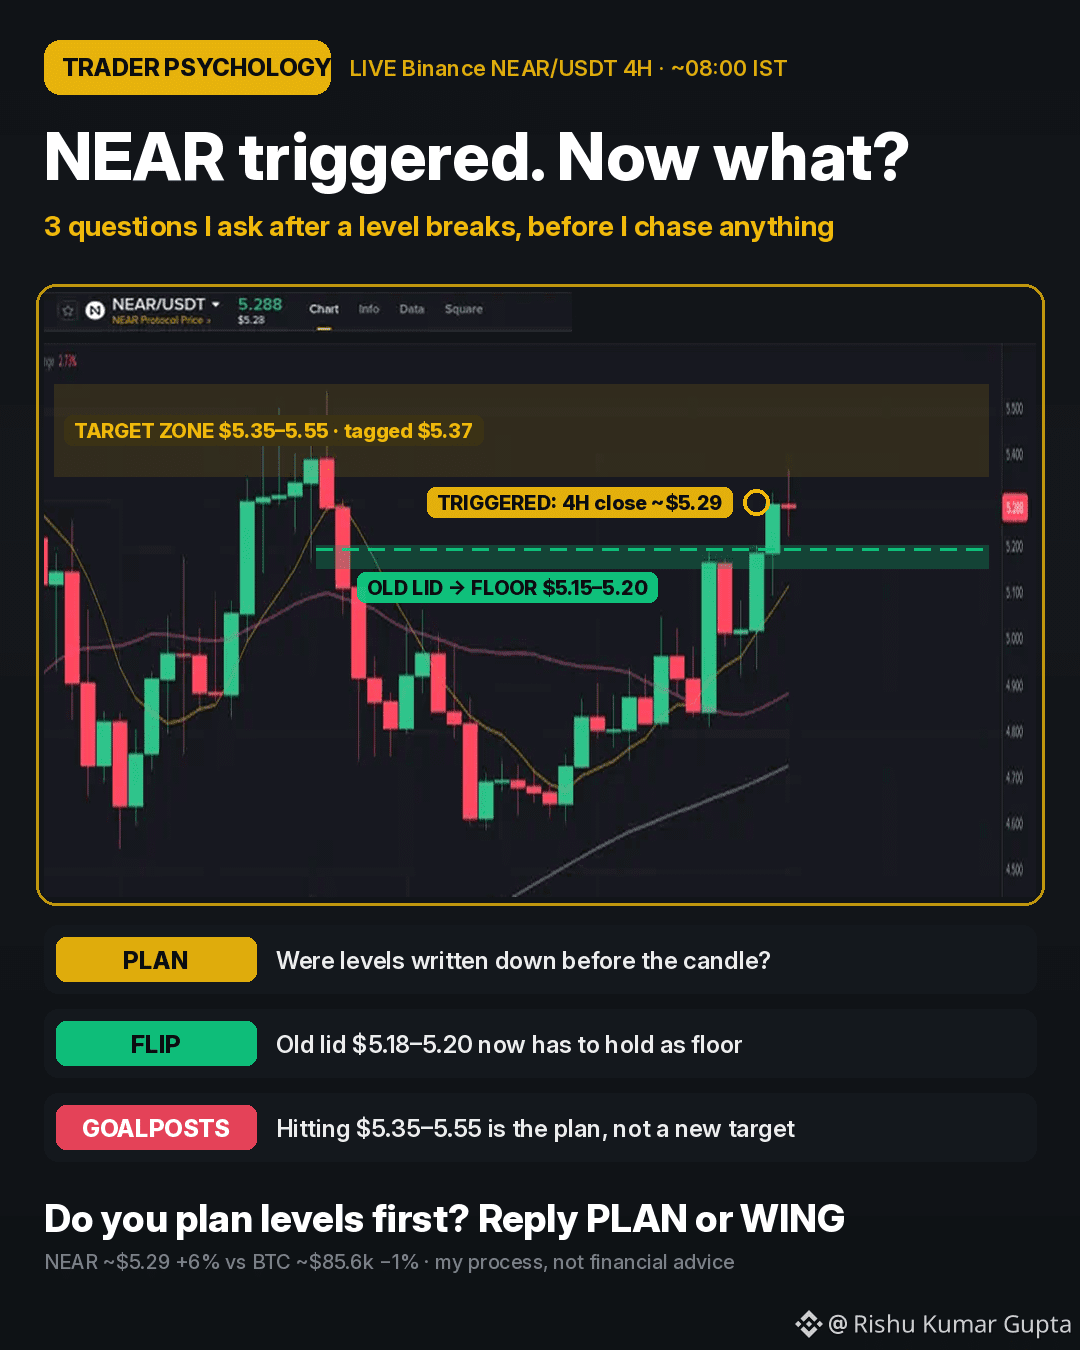
At 00:00 IST I posted the NEAR setup: TRIGGER was a 4H close above ~$5.20.
The 01:30 to 05:30 IST candle closed ~$5.29. Since then NEAR tagged $5.37, the bottom of the $5.35 to $5.55 zone I flagged, and sits ~$5.29 (+6% 24h) while $BTC is ~$85.6k (-1%).
A trigger isn't the finish line. My 3-question filter after a level breaks:
1. PLAN: Were the level, target and invalidation written down before the candle? If not, I'm reacting, not trading.
2. FLIP: The old lid $5.18 to $5.20 now has to act as the floor. A 4H close back under ~$5.15 would make this look like a fakeout.
3. GOALPOSTS: $5.35 to $5.55 is where earlier rallies stalled. Reaching it is the plan working, not a cue to invent a bigger target.
Contrast: $RLC is up ~88% in 24h on a near-vertical chart. There was no level to plan around before that move, so chasing it is a different decision from following a level mapped in advance.
Not financial advice, just my own process.
Do you write levels down before the move? Reply PLAN or WING.
#NEAR #TradingPsychology #BinanceSquare
$NEAR hit the trigger. Now comes the part most people skip.
At 00:00 IST I posted the NEAR setup: TRIGGER was a 4H close above ~$5.20.
The 01:30 to 05:30 IST candle closed ~$5.29. Since then NEAR tagged $5.37, the bottom of the $5.35 to $5.55 zone I flagged, and sits ~$5.29 (+6% 24h) while $BTC is ~$85.6k (-1%).
A trigger isn't the finish line. My 3-question filter after a level breaks:
1. PLAN: Were the level, target and invalidation written down before the candle? If not, I'm reacting, not trading.
2. FLIP: The old lid $5.18 to $5.20 now has to act as the floor. A 4H close back under ~$5.15 would make this look like a fakeout.
3. GOALPOSTS: $5.35 to $5.55 is where earlier rallies stalled. Reaching it is the plan working, not a cue to invent a bigger target.
Contrast: $RLC is up ~88% in 24h on a near-vertical chart. There was no level to plan around before that move, so chasing it is a different decision from following a level mapped in advance.
Not financial advice, just my own process.
Do you write levels down before the move? Reply PLAN or WING.
#NEAR #TradingPsychology #BinanceSquare
At 00:00 IST I posted the NEAR setup: TRIGGER was a 4H close above ~$5.20.
The 01:30 to 05:30 IST candle closed ~$5.29. Since then NEAR tagged $5.37, the bottom of the $5.35 to $5.55 zone I flagged, and sits ~$5.29 (+6% 24h) while $BTC is ~$85.6k (-1%).
A trigger isn't the finish line. My 3-question filter after a level breaks:
1. PLAN: Were the level, target and invalidation written down before the candle? If not, I'm reacting, not trading.
2. FLIP: The old lid $5.18 to $5.20 now has to act as the floor. A 4H close back under ~$5.15 would make this look like a fakeout.
3. GOALPOSTS: $5.35 to $5.55 is where earlier rallies stalled. Reaching it is the plan working, not a cue to invent a bigger target.
Contrast: $RLC is up ~88% in 24h on a near-vertical chart. There was no level to plan around before that move, so chasing it is a different decision from following a level mapped in advance.
Not financial advice, just my own process.
Do you write levels down before the move? Reply PLAN or WING.
#NEAR #TradingPsychology #BinanceSquare
341
Article
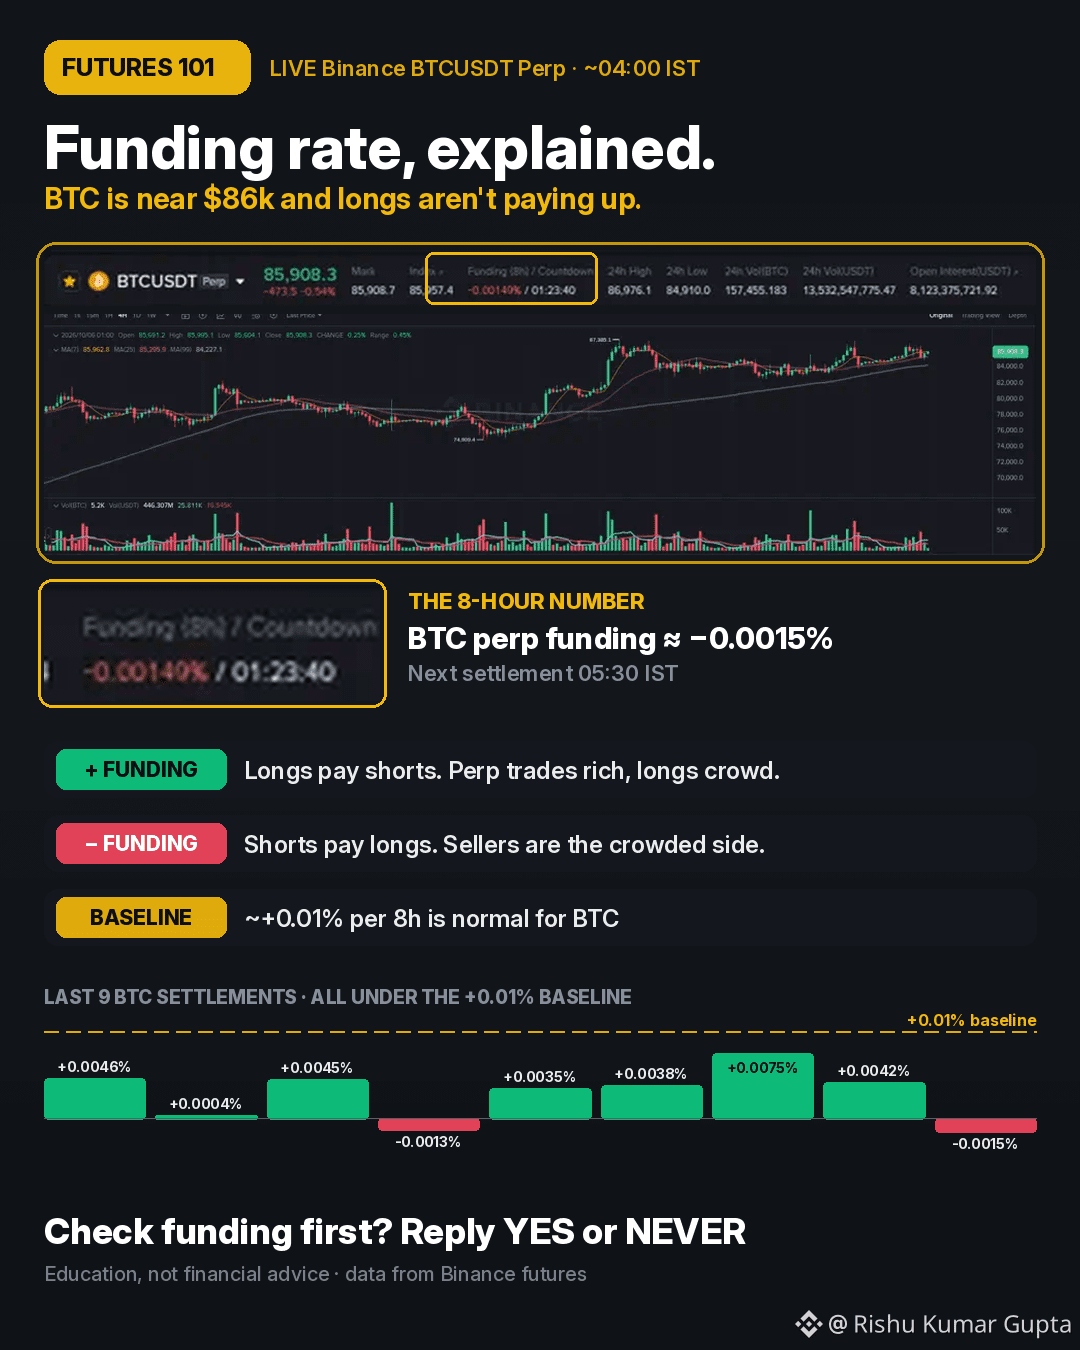
Funding Rate, Explained: BTC Sits Near $86k and Longs Aren't Paying UpEvery 8 hours, Binance perpetual futures settle a small payment between longs and shorts. That payment is the funding rate, and it's one of the quickest ways to see how crowded a trade is.
What funding actually is
A perpetual contract never expires, so it needs a way to stay close to spot. Funding does that job.
- Positive funding: longs pay shorts. The perp is trading rich because more traders want to be long.
- Negative funding: shorts pay longs. Sellers are the ones crowding in.
- On Binance the payment happens at 00:00, 08:00 and 16:00 UTC, which is 05:30, 13:30 and 21:30 IST.
- The usual "neutral" reading on BTC is around +0.01% per 8 hours. Readings far above that mean leverage is leaning long.
Where $BTC is right now (Binance, ~04:00 IST Tuesday)
- Price ~$86.0k, 24h range ~$85.0k to ~$87.0k
- Current funding about -0.0015%, slightly negative
- The last nine settlements ranged from about -0.0015% to +0.0075%. Every one of them sat below the +0.01% baseline.
So BTC climbed back to the mid-$80k area this week without longs paying a premium to hold it. $ETH is near flat (~+0.002%) and $SOL is slightly negative too.
How to read it
1. Flat or negative funding during a rally usually means spot demand is doing more of the work than leveraged longs.
2. Very high funding (several times the baseline) is a crowding warning. Those are the setups where a dip can turn into a long squeeze.
3. Funding is a context tool, not a signal. It tells you who is paying to hold a position, not where price goes next.
Common mistakes
- Treating negative funding as an automatic buy signal. Shorts can stay paid for a long time.
- Ignoring funding on a long hold. At high rates, the fee adds up across three settlements a day.
- Reading one print. The trend across several settlements tells you more than a single number.
Where to find it: on any Binance futures pair, the header shows "Funding / Countdown" next to Mark and Index price.
Not financial advice, just a way to read the market's positioning.
Do you check funding before you enter a futures trade? Reply YES or NEVER.
#FundingRate #BinanceSquare #CryptoEducation
Funding Rate, Explained: BTC Sits Near $86k and Longs Aren't Paying Up
Every 8 hours, Binance perpetual futures settle a small payment between longs and shorts. That payment is the funding rate, and it's one of the quickest ways to see how crowded a trade is.
What funding actually is
A perpetual contract never expires, so it needs a way to stay close to spot. Funding does that job.
- Positive funding: longs pay shorts. The perp is trading rich because more traders want to be long.
- Negative funding: shorts pay longs. Sellers are the ones crowding in.
- On Binance the payment happens at 00:00, 08:00 and 16:00 UTC, which is 05:30, 13:30 and 21:30 IST.
- The usual "neutral" reading on BTC is around +0.01% per 8 hours. Readings far above that mean leverage is leaning long.
Where $BTC is right now (Binance, ~04:00 IST Tuesday)
- Price ~$86.0k, 24h range ~$85.0k to ~$87.0k
- Current funding about -0.0015%, slightly negative
- The last nine settlements ranged from about -0.0015% to +0.0075%. Every one of them sat below the +0.01% baseline.
So BTC climbed back to the mid-$80k area this week without longs paying a premium to hold it. $ETH is near flat (~+0.002%) and $SOL is slightly negative too.
How to read it
1. Flat or negative funding during a rally usually means spot demand is doing more of the work than leveraged longs.
2. Very high funding (several times the baseline) is a crowding warning. Those are the setups where a dip can turn into a long squeeze.
3. Funding is a context tool, not a signal. It tells you who is paying to hold a position, not where price goes next.
Common mistakes
- Treating negative funding as an automatic buy signal. Shorts can stay paid for a long time.
- Ignoring funding on a long hold. At high rates, the fee adds up across three settlements a day.
- Reading one print. The trend across several settlements tells you more than a single number.
Where to find it: on any Binance futures pair, the header shows "Funding / Countdown" next to Mark and Index price.
Not financial advice, just a way to read the market's positioning.
Do you check funding before you enter a futures trade? Reply YES or NEVER.
#FundingRate #BinanceSquare #CryptoEducation
What funding actually is
A perpetual contract never expires, so it needs a way to stay close to spot. Funding does that job.
- Positive funding: longs pay shorts. The perp is trading rich because more traders want to be long.
- Negative funding: shorts pay longs. Sellers are the ones crowding in.
- On Binance the payment happens at 00:00, 08:00 and 16:00 UTC, which is 05:30, 13:30 and 21:30 IST.
- The usual "neutral" reading on BTC is around +0.01% per 8 hours. Readings far above that mean leverage is leaning long.
Where $BTC is right now (Binance, ~04:00 IST Tuesday)
- Price ~$86.0k, 24h range ~$85.0k to ~$87.0k
- Current funding about -0.0015%, slightly negative
- The last nine settlements ranged from about -0.0015% to +0.0075%. Every one of them sat below the +0.01% baseline.
So BTC climbed back to the mid-$80k area this week without longs paying a premium to hold it. $ETH is near flat (~+0.002%) and $SOL is slightly negative too.
How to read it
1. Flat or negative funding during a rally usually means spot demand is doing more of the work than leveraged longs.
2. Very high funding (several times the baseline) is a crowding warning. Those are the setups where a dip can turn into a long squeeze.
3. Funding is a context tool, not a signal. It tells you who is paying to hold a position, not where price goes next.
Common mistakes
- Treating negative funding as an automatic buy signal. Shorts can stay paid for a long time.
- Ignoring funding on a long hold. At high rates, the fee adds up across three settlements a day.
- Reading one print. The trend across several settlements tells you more than a single number.
Where to find it: on any Binance futures pair, the header shows "Funding / Countdown" next to Mark and Index price.
Not financial advice, just a way to read the market's positioning.
Do you check funding before you enter a futures trade? Reply YES or NEVER.
#FundingRate #BinanceSquare #CryptoEducation
44
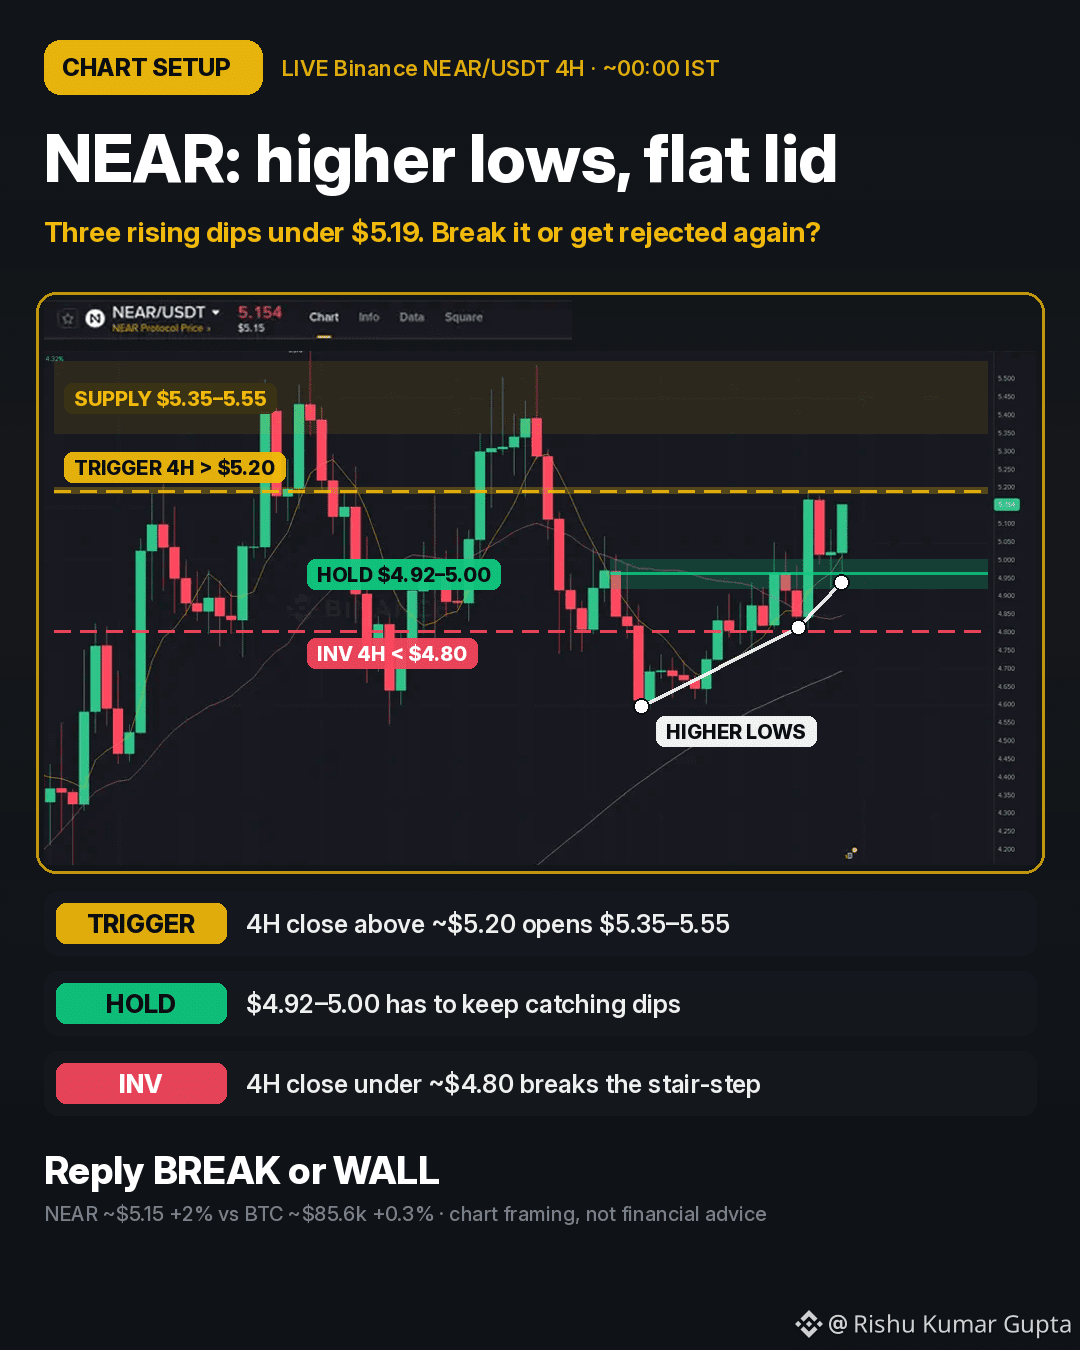
$NEAR keeps printing higher lows under one lid.
Binance spot, ~00:00 IST Tuesday:
$NEAR ~$5.15 (+2.6% 24h) while $BTC ~$85.6k (+0.3%) and most alts sit red.
On the 4H chart:
Oct 3 low ~$4.59, Oct 5 low ~$4.81, and today's dips stopped near $4.92 to $4.94. Each pullback is getting bought higher.
The lid is $5.18 to $5.19: the Sep 29 wick and Monday's high. Price has pushed into it and hasn't closed a 4H candle above it yet.
How I'm framing it:
TRIGGER: a 4H close above ~$5.20 opens the $5.35 to $5.55 zone where the Sep 28 and Oct 1 rallies stalled
HOLD: $4.92 to $5.00 has to keep catching dips for the higher-low structure to stay intact
INV: a 4H close under ~$4.80 breaks the stair-step and puts NEAR back in last week's range
Rising lows into flat resistance is a pattern that can go either way. Waiting for the close beats guessing the wick.
Not financial advice, just how I'm reading the chart.
Reply BREAK if you think $5.20 goes, or WALL if the lid holds again.
#NEAR #ChartSetup #BinanceSquare
$NEAR keeps printing higher lows under one lid.
Binance spot, ~00:00 IST Tuesday:
$NEAR ~$5.15 (+2.6% 24h) while $BTC ~$85.6k (+0.3%) and most alts sit red.
On the 4H chart:
Oct 3 low ~$4.59, Oct 5 low ~$4.81, and today's dips stopped near $4.92 to $4.94. Each pullback is getting bought higher.
The lid is $5.18 to $5.19: the Sep 29 wick and Monday's high. Price has pushed into it and hasn't closed a 4H candle above it yet.
How I'm framing it:
TRIGGER: a 4H close above ~$5.20 opens the $5.35 to $5.55 zone where the Sep 28 and Oct 1 rallies stalled
HOLD: $4.92 to $5.00 has to keep catching dips for the higher-low structure to stay intact
INV: a 4H close under ~$4.80 breaks the stair-step and puts NEAR back in last week's range
Rising lows into flat resistance is a pattern that can go either way. Waiting for the close beats guessing the wick.
Not financial advice, just how I'm reading the chart.
Reply BREAK if you think $5.20 goes, or WALL if the lid holds again.
#NEAR #ChartSetup #BinanceSquare
Binance spot, ~00:00 IST Tuesday:
$NEAR ~$5.15 (+2.6% 24h) while $BTC ~$85.6k (+0.3%) and most alts sit red.
On the 4H chart:
Oct 3 low ~$4.59, Oct 5 low ~$4.81, and today's dips stopped near $4.92 to $4.94. Each pullback is getting bought higher.
The lid is $5.18 to $5.19: the Sep 29 wick and Monday's high. Price has pushed into it and hasn't closed a 4H candle above it yet.
How I'm framing it:
TRIGGER: a 4H close above ~$5.20 opens the $5.35 to $5.55 zone where the Sep 28 and Oct 1 rallies stalled
HOLD: $4.92 to $5.00 has to keep catching dips for the higher-low structure to stay intact
INV: a 4H close under ~$4.80 breaks the stair-step and puts NEAR back in last week's range
Rising lows into flat resistance is a pattern that can go either way. Waiting for the close beats guessing the wick.
Not financial advice, just how I'm reading the chart.
Reply BREAK if you think $5.20 goes, or WALL if the lid holds again.
#NEAR #ChartSetup #BinanceSquare
102
US session is open and $BTC is back on this morning's breakout lid (~$85.6k, +0.6% 24h).
HOLD: $85.4–85.5k stays the floor
RES: $86.7–87.0k day high
INV: 4H close under ~$85.1k = fakeout
Not financial advice. Reply HOLD or FADE.
#BTC #USSession #BinanceSquare
US session is open and $BTC is back on this morning's breakout lid (~$85.6k, +0.6% 24h).
HOLD: $85.4–85.5k stays the floor
RES: $86.7–87.0k day high
INV: 4H close under ~$85.1k = fakeout
Not financial advice. Reply HOLD or FADE.
#BTC #USSession #BinanceSquare
HOLD: $85.4–85.5k stays the floor
RES: $86.7–87.0k day high
INV: 4H close under ~$85.1k = fakeout
Not financial advice. Reply HOLD or FADE.
#BTC #USSession #BinanceSquare
102
Article
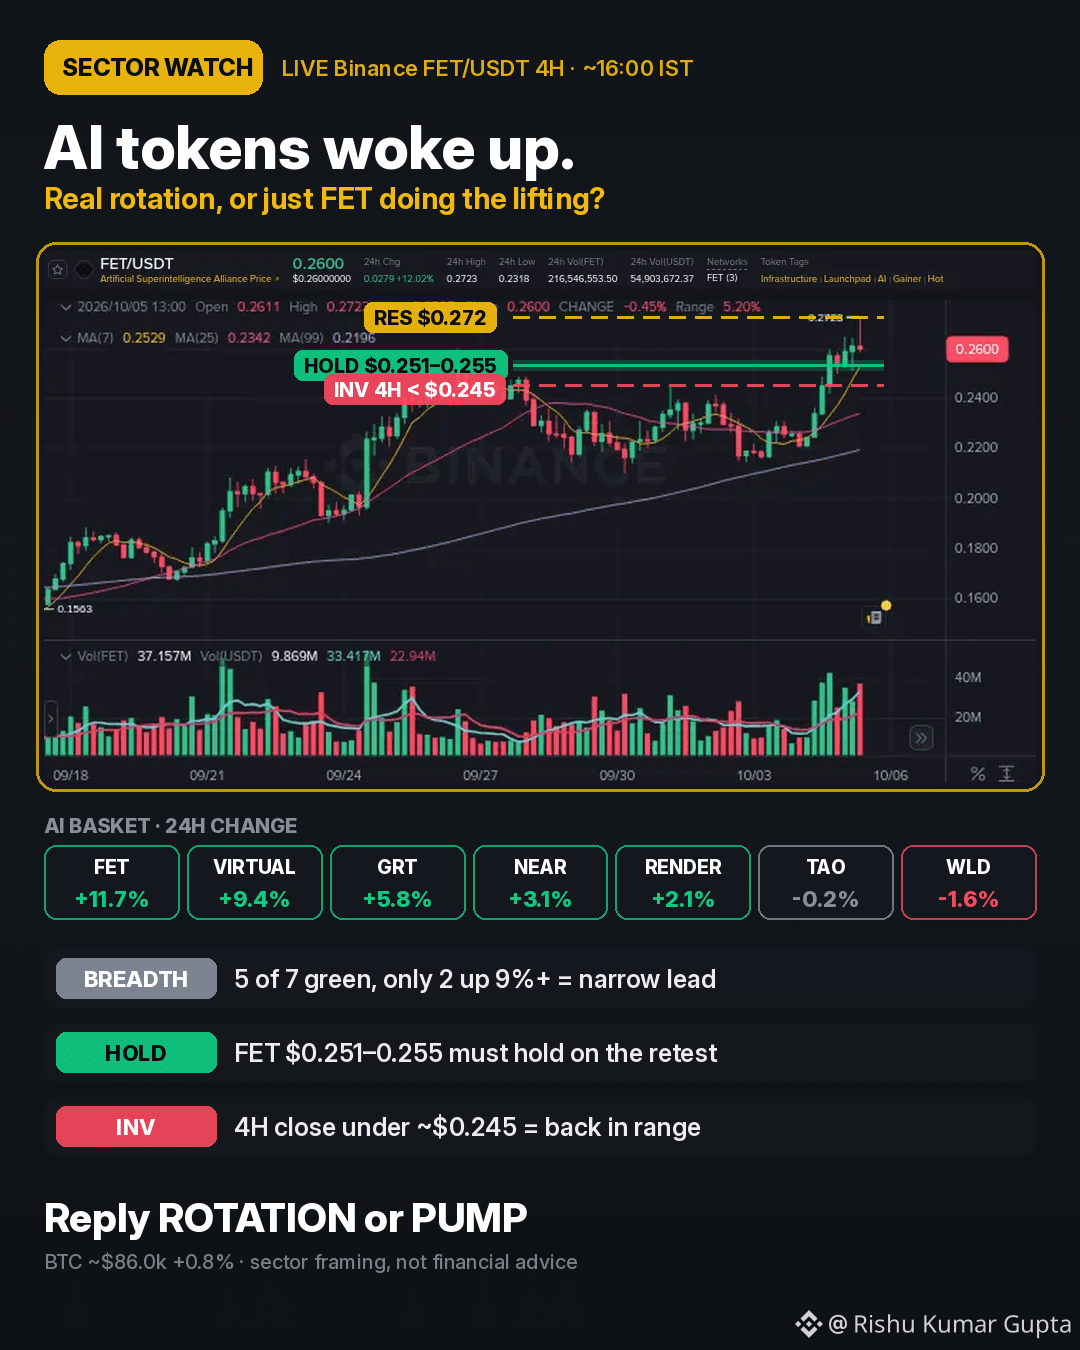
AI Tokens Woke Up Monday. Real Rotation or Just FET?The AI corner of the market is the loudest thing on the Binance board this afternoon, while the majors barely move.
Binance spot, ~16:00 IST Monday, 24h change:
$FET ~$0.260 (+12%), day range ~$0.251 to ~$0.272
$VIRTUAL ~$0.865 (+9.4%)
GRT +5.8%, NEAR +3.1%, RENDER +2.1%
$TAO ~$303 (flat), WLD -1.6%
BTC ~$86.0k (+0.8%), ETH ~$2,714 (+0.4%)
So is this an "AI season" or one or two names doing the heavy lifting? Here is the simple check I use before calling anything a sector move.
1) BREADTH: how many names are actually moving?
A real sector rotation usually lifts most of the basket, not just the leader. Today 5 of the 7 AI names I track are green, but only FET and VIRTUAL are up more than 9%; the other five sit between -1.6% and +5.8%. TAO, one of the largest AI names, is flat and WLD is red. That is narrow leadership, not a full rotation yet.
2) LEADER STRUCTURE: is the leader breaking something that matters?
FET is the cleanest chart in the group. On the daily, the September high sat near $0.260 (Sep 26). Today FET printed ~$0.272, above that level, and is now pulling back to test it. On the 4H, it climbed steadily from ~$0.221 on Sunday with rising volume.
How I'm framing FET:
HOLD: $0.251 to $0.255, today's 4H lows, is the area buyers need to defend on this retest
RES: the ~$0.272 day high is the line to clear for continuation
INV: a 4H close back under ~$0.245 puts price back inside the late-September range and makes the breakout look like a fakeout
3) FOLLOWERS: does the second tier confirm?
VIRTUAL has also stepped up, from ~$0.79 on Sunday to ~$0.87, pressing its 24h high near ~$0.886. If the move spreads into names like TAO and RENDER over the next sessions, the rotation story gets stronger. If FET and VIRTUAL fade while the rest stay flat, it was a two-coin pump, and those usually give back part of the move.
What I'm NOT doing: chasing a +12% candle on the day it prints. Big one-day moves often retrace before they continue, and the retest is where the idea gets proven or rejected.
Quick checklist you can reuse for any sector:
- Count green names in the basket, not just the top gainer
- Find the leader's key level and watch the retest
- Wait for the second tier to confirm before calling it a season
Not financial advice, just how I'm reading the board.
Which side are you on: ROTATION (it spreads) or PUMP (it fades)? Reply below.
#AI #Altcoins #BinanceSquare
AI Tokens Woke Up Monday. Real Rotation or Just FET?
The AI corner of the market is the loudest thing on the Binance board this afternoon, while the majors barely move.
Binance spot, ~16:00 IST Monday, 24h change:
$FET ~$0.260 (+12%), day range ~$0.251 to ~$0.272
$VIRTUAL ~$0.865 (+9.4%)
GRT +5.8%, NEAR +3.1%, RENDER +2.1%
$TAO ~$303 (flat), WLD -1.6%
BTC ~$86.0k (+0.8%), ETH ~$2,714 (+0.4%)
So is this an "AI season" or one or two names doing the heavy lifting? Here is the simple check I use before calling anything a sector move.
1) BREADTH: how many names are actually moving?
A real sector rotation usually lifts most of the basket, not just the leader. Today 5 of the 7 AI names I track are green, but only FET and VIRTUAL are up more than 9%; the other five sit between -1.6% and +5.8%. TAO, one of the largest AI names, is flat and WLD is red. That is narrow leadership, not a full rotation yet.
2) LEADER STRUCTURE: is the leader breaking something that matters?
FET is the cleanest chart in the group. On the daily, the September high sat near $0.260 (Sep 26). Today FET printed ~$0.272, above that level, and is now pulling back to test it. On the 4H, it climbed steadily from ~$0.221 on Sunday with rising volume.
How I'm framing FET:
HOLD: $0.251 to $0.255, today's 4H lows, is the area buyers need to defend on this retest
RES: the ~$0.272 day high is the line to clear for continuation
INV: a 4H close back under ~$0.245 puts price back inside the late-September range and makes the breakout look like a fakeout
3) FOLLOWERS: does the second tier confirm?
VIRTUAL has also stepped up, from ~$0.79 on Sunday to ~$0.87, pressing its 24h high near ~$0.886. If the move spreads into names like TAO and RENDER over the next sessions, the rotation story gets stronger. If FET and VIRTUAL fade while the rest stay flat, it was a two-coin pump, and those usually give back part of the move.
What I'm NOT doing: chasing a +12% candle on the day it prints. Big one-day moves often retrace before they continue, and the retest is where the idea gets proven or rejected.
Quick checklist you can reuse for any sector:
- Count green names in the basket, not just the top gainer
- Find the leader's key level and watch the retest
- Wait for the second tier to confirm before calling it a season
Not financial advice, just how I'm reading the board.
Which side are you on: ROTATION (it spreads) or PUMP (it fades)? Reply below.
#AI #Altcoins #BinanceSquare
Binance spot, ~16:00 IST Monday, 24h change:
$FET ~$0.260 (+12%), day range ~$0.251 to ~$0.272
$VIRTUAL ~$0.865 (+9.4%)
GRT +5.8%, NEAR +3.1%, RENDER +2.1%
$TAO ~$303 (flat), WLD -1.6%
BTC ~$86.0k (+0.8%), ETH ~$2,714 (+0.4%)
So is this an "AI season" or one or two names doing the heavy lifting? Here is the simple check I use before calling anything a sector move.
1) BREADTH: how many names are actually moving?
A real sector rotation usually lifts most of the basket, not just the leader. Today 5 of the 7 AI names I track are green, but only FET and VIRTUAL are up more than 9%; the other five sit between -1.6% and +5.8%. TAO, one of the largest AI names, is flat and WLD is red. That is narrow leadership, not a full rotation yet.
2) LEADER STRUCTURE: is the leader breaking something that matters?
FET is the cleanest chart in the group. On the daily, the September high sat near $0.260 (Sep 26). Today FET printed ~$0.272, above that level, and is now pulling back to test it. On the 4H, it climbed steadily from ~$0.221 on Sunday with rising volume.
How I'm framing FET:
HOLD: $0.251 to $0.255, today's 4H lows, is the area buyers need to defend on this retest
RES: the ~$0.272 day high is the line to clear for continuation
INV: a 4H close back under ~$0.245 puts price back inside the late-September range and makes the breakout look like a fakeout
3) FOLLOWERS: does the second tier confirm?
VIRTUAL has also stepped up, from ~$0.79 on Sunday to ~$0.87, pressing its 24h high near ~$0.886. If the move spreads into names like TAO and RENDER over the next sessions, the rotation story gets stronger. If FET and VIRTUAL fade while the rest stay flat, it was a two-coin pump, and those usually give back part of the move.
What I'm NOT doing: chasing a +12% candle on the day it prints. Big one-day moves often retrace before they continue, and the retest is where the idea gets proven or rejected.
Quick checklist you can reuse for any sector:
- Count green names in the basket, not just the top gainer
- Find the leader's key level and watch the retest
- Wait for the second tier to confirm before calling it a season
Not financial advice, just how I'm reading the board.
Which side are you on: ROTATION (it spreads) or PUMP (it fades)? Reply below.
#AI #Altcoins #BinanceSquare
422
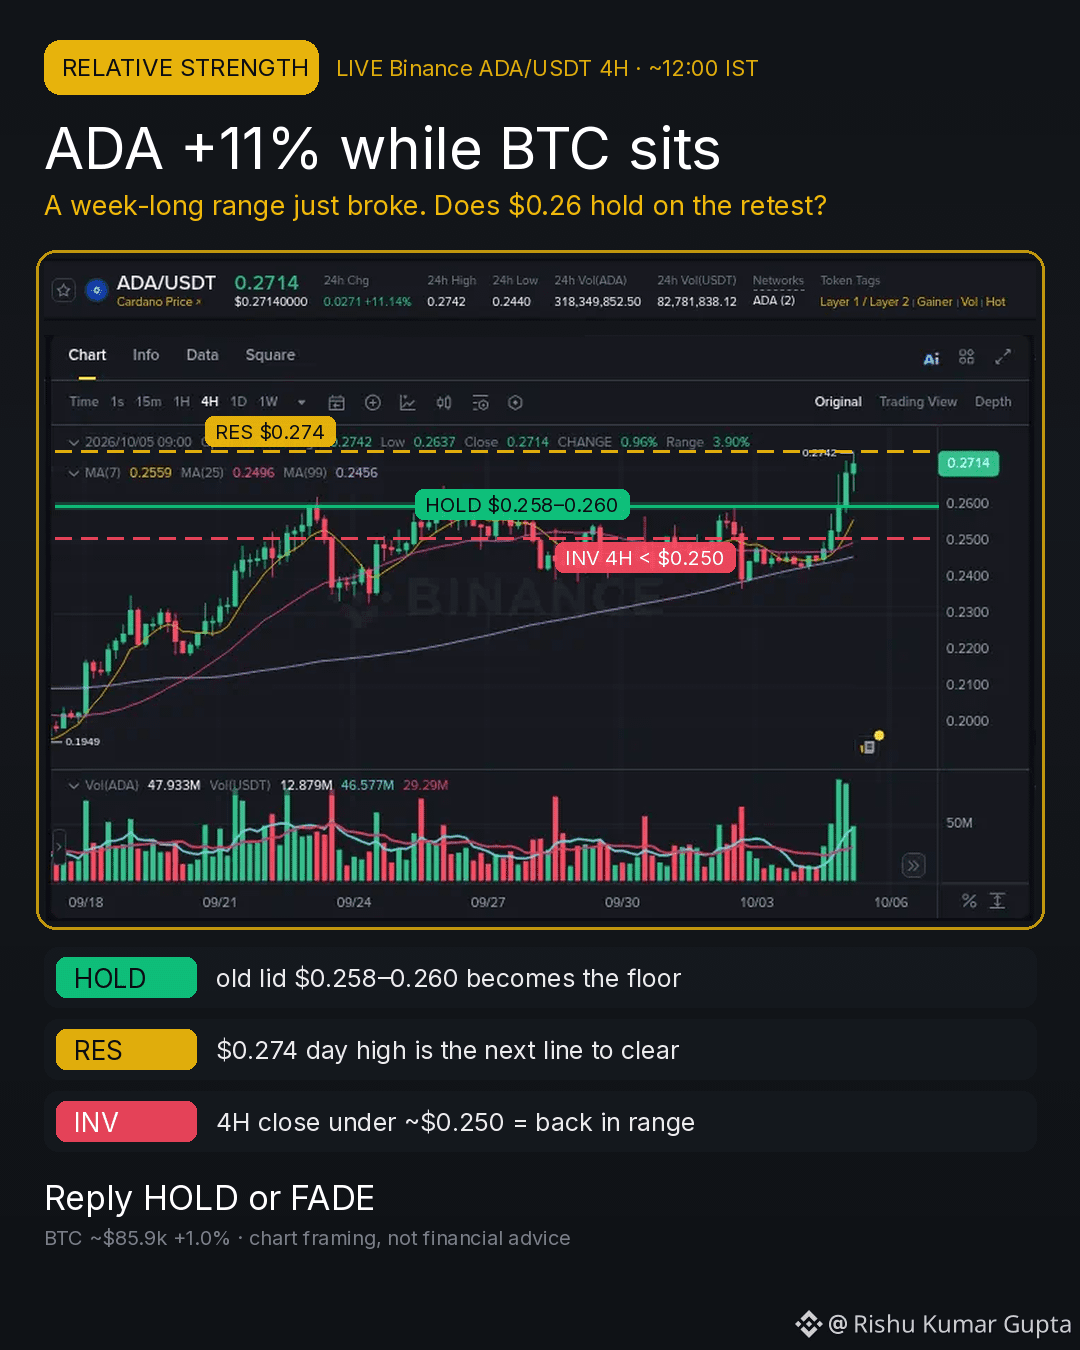
$ADA just did what BTC didn't today.
Binance spot, ~12:00 IST Monday, 24h change:
$ADA ~$0.271 (+11%), day range ~$0.244 to ~$0.274
$BTC ~$85.9k (+1.0%), pulled back from ~$87k
ETH ~$2,714 (+0.8%), BNB ~$793 (+0.6%)
On the 4H chart, ADA spent about a week boxed between ~$0.24 and ~$0.26. Overnight it closed above the old lid near $0.260 and kept going, with 4H volume several times bigger than the quiet weekend candles.
How I'm reading it:
HOLD: the old lid at $0.258 to $0.260 should act as the floor on the first pullback
RES: the $0.274 day high is the line buyers have to clear next
INV: a 4H close back under ~$0.250 puts it back inside the range and makes this a fakeout
Big single-day moves often retrace before they continue, so chasing the green candle isn't the plan. The retest is where the idea gets tested.
Not financial advice, just how I'm framing the chart.
Reply HOLD if you think $0.26 holds, or FADE if you think it slips back into the range.
#ADA #Altcoins #BinanceSquare
$ADA just did what BTC didn't today.
Binance spot, ~12:00 IST Monday, 24h change:
$ADA ~$0.271 (+11%), day range ~$0.244 to ~$0.274
$BTC ~$85.9k (+1.0%), pulled back from ~$87k
ETH ~$2,714 (+0.8%), BNB ~$793 (+0.6%)
On the 4H chart, ADA spent about a week boxed between ~$0.24 and ~$0.26. Overnight it closed above the old lid near $0.260 and kept going, with 4H volume several times bigger than the quiet weekend candles.
How I'm reading it:
HOLD: the old lid at $0.258 to $0.260 should act as the floor on the first pullback
RES: the $0.274 day high is the line buyers have to clear next
INV: a 4H close back under ~$0.250 puts it back inside the range and makes this a fakeout
Big single-day moves often retrace before they continue, so chasing the green candle isn't the plan. The retest is where the idea gets tested.
Not financial advice, just how I'm framing the chart.
Reply HOLD if you think $0.26 holds, or FADE if you think it slips back into the range.
#ADA #Altcoins #BinanceSquare
Binance spot, ~12:00 IST Monday, 24h change:
$ADA ~$0.271 (+11%), day range ~$0.244 to ~$0.274
$BTC ~$85.9k (+1.0%), pulled back from ~$87k
ETH ~$2,714 (+0.8%), BNB ~$793 (+0.6%)
On the 4H chart, ADA spent about a week boxed between ~$0.24 and ~$0.26. Overnight it closed above the old lid near $0.260 and kept going, with 4H volume several times bigger than the quiet weekend candles.
How I'm reading it:
HOLD: the old lid at $0.258 to $0.260 should act as the floor on the first pullback
RES: the $0.274 day high is the line buyers have to clear next
INV: a 4H close back under ~$0.250 puts it back inside the range and makes this a fakeout
Big single-day moves often retrace before they continue, so chasing the green candle isn't the plan. The retest is where the idea gets tested.
Not financial advice, just how I'm framing the chart.
Reply HOLD if you think $0.26 holds, or FADE if you think it slips back into the range.
#ADA #Altcoins #BinanceSquare
114
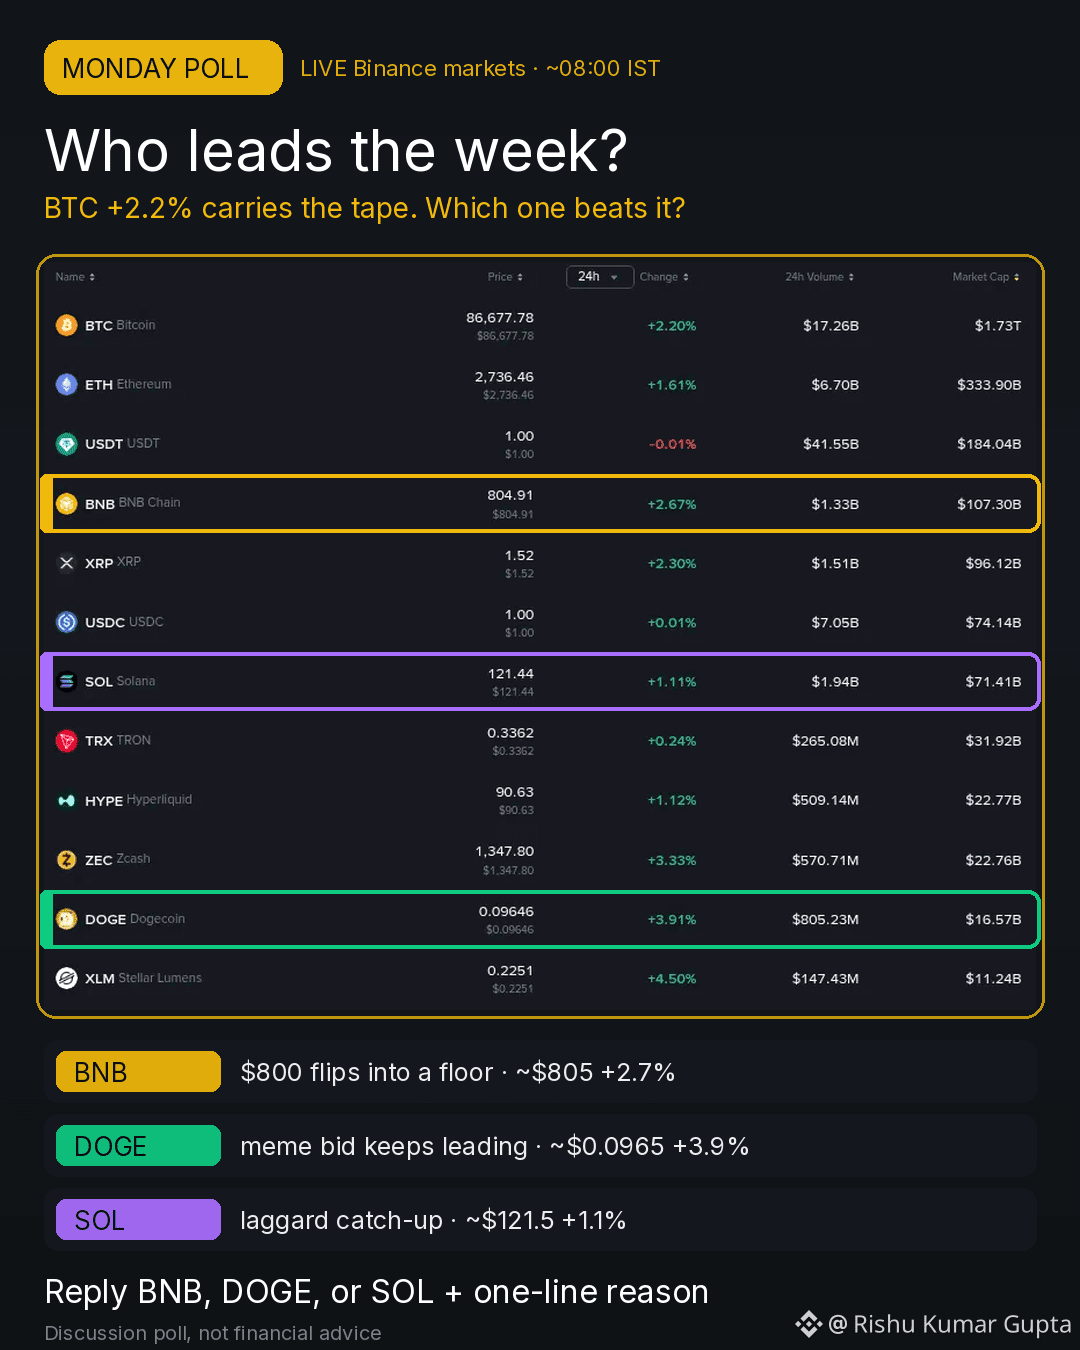
Monday poll: which one leads the week?
Binance spot, ~08:00 IST Monday, 24h change:
$BNB ~$805 (+2.7%), back above the $800 round number, day high ~$810
$DOGE ~$0.0965 (+3.9%), the hottest of these three
$SOL ~$121.5 (+1.1%), the laggard, still under its ~$122.3 day high
BTC ~$86.7k (+2.2%) and ETH ~$2,737 (+1.6%) are carrying the whole tape, so the question isn't "what goes up", it's which one beats BTC from here.
Pick one and give your reason in one line:
BNB, if $800 flips into a floor
DOGE, if the meme bid keeps leading
SOL, if laggards get the catch-up rotation
My own filter before picking: a leader should hold its breakout level on the first pullback. A 4H close back under $800 for BNB, or DOGE giving back today's whole move, would tell me that option is just noise.
Poll for discussion, not financial advice.
Reply BNB, DOGE, or SOL below.
#BinanceSquare #Altcoins #CryptoPoll
Monday poll: which one leads the week?
Binance spot, ~08:00 IST Monday, 24h change:
$BNB ~$805 (+2.7%), back above the $800 round number, day high ~$810
$DOGE ~$0.0965 (+3.9%), the hottest of these three
$SOL ~$121.5 (+1.1%), the laggard, still under its ~$122.3 day high
BTC ~$86.7k (+2.2%) and ETH ~$2,737 (+1.6%) are carrying the whole tape, so the question isn't "what goes up", it's which one beats BTC from here.
Pick one and give your reason in one line:
BNB, if $800 flips into a floor
DOGE, if the meme bid keeps leading
SOL, if laggards get the catch-up rotation
My own filter before picking: a leader should hold its breakout level on the first pullback. A 4H close back under $800 for BNB, or DOGE giving back today's whole move, would tell me that option is just noise.
Poll for discussion, not financial advice.
Reply BNB, DOGE, or SOL below.
#BinanceSquare #Altcoins #CryptoPoll
Binance spot, ~08:00 IST Monday, 24h change:
$BNB ~$805 (+2.7%), back above the $800 round number, day high ~$810
$DOGE ~$0.0965 (+3.9%), the hottest of these three
$SOL ~$121.5 (+1.1%), the laggard, still under its ~$122.3 day high
BTC ~$86.7k (+2.2%) and ETH ~$2,737 (+1.6%) are carrying the whole tape, so the question isn't "what goes up", it's which one beats BTC from here.
Pick one and give your reason in one line:
BNB, if $800 flips into a floor
DOGE, if the meme bid keeps leading
SOL, if laggards get the catch-up rotation
My own filter before picking: a leader should hold its breakout level on the first pullback. A 4H close back under $800 for BNB, or DOGE giving back today's whole move, would tell me that option is just noise.
Poll for discussion, not financial advice.
Reply BNB, DOGE, or SOL below.
#BinanceSquare #Altcoins #CryptoPoll
104
Article
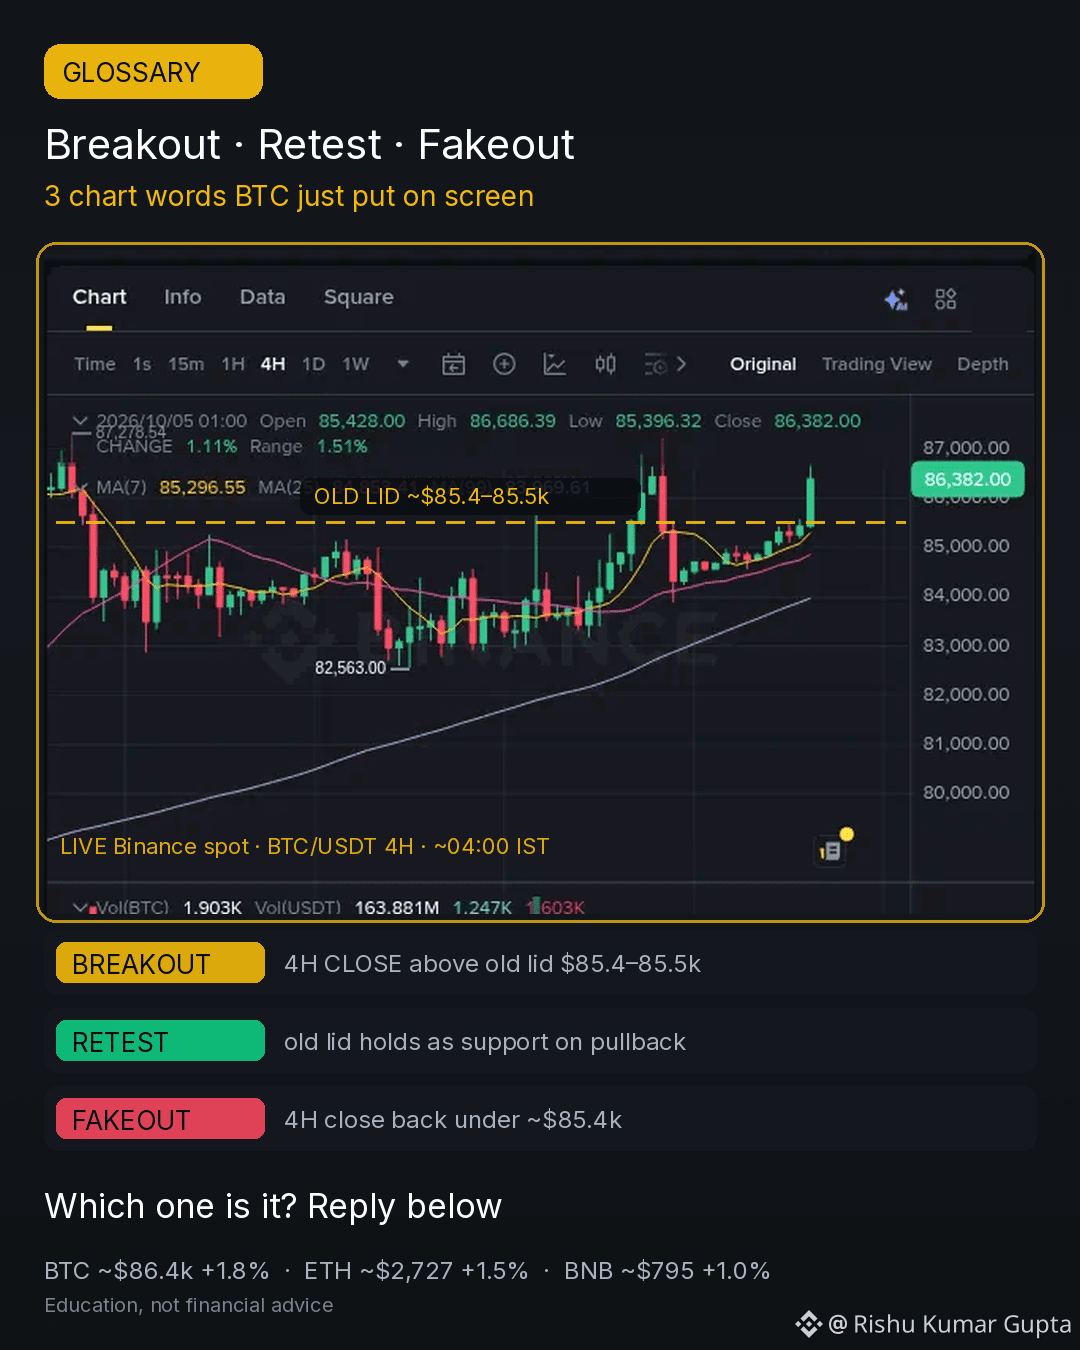
Breakout, Retest, Fakeout: 3 Chart Words BTC Just Put on Screen$BTC woke up overnight. After sitting in a tight ~$85.1–85.5k box for most of Sunday, the current 4H candle on Binance spot pushed to ~$86.7k. Right now it trades ~$86.4k (+1.8% in 24h).
That move is a clean live example of three words beginners see on Square every day but rarely get defined plainly.
1) BREAKOUT
Price CLOSES beyond a level that capped it before. The key word is close. A wick above resistance is not a breakout; a candle close on your chosen timeframe is. Here the lid was ~$85.4–85.5k (Sunday's highs). The 4H candle that closes at 05:30 IST is the first real test of whether this counts.
2) RETEST
After a breakout, price often comes back to touch the old level from the other side, so old resistance gets tested as support. For BTC that zone is ~$85.4–85.5k. Holding it on a pullback is what turns a breakout into a trend, which is why many traders wait for the retest instead of chasing the first green candle.
3) FAKEOUT
Price breaks the level, then closes back inside the old range, and late buyers get trapped. For this move, 4H closes back under ~$85.4k would be the fakeout signal.
How to use the three words together
- Mark the level before the move, not after it.
- Pick your timeframe first. A 15m breakout means little to a 4H plan.
- Write your invalidation: the close that would make it a fakeout.
- Size so that being wrong is boring.
Live snapshot (Binance spot, ~04:00 IST Monday): $BTC ~$86.4k (+1.8%) · $ETH ~$2,727 (+1.5%) · $BNB ~$795 (+1.0%)
This is a vocabulary lesson with a live chart, not financial advice.
Which one does this move become: BREAKOUT, RETEST, or FAKEOUT? Reply below.
#Bitcoin #CryptoEducation #BinanceSquare
Breakout, Retest, Fakeout: 3 Chart Words BTC Just Put on Screen
$BTC woke up overnight. After sitting in a tight ~$85.1–85.5k box for most of Sunday, the current 4H candle on Binance spot pushed to ~$86.7k. Right now it trades ~$86.4k (+1.8% in 24h).
That move is a clean live example of three words beginners see on Square every day but rarely get defined plainly.
1) BREAKOUT
Price CLOSES beyond a level that capped it before. The key word is close. A wick above resistance is not a breakout; a candle close on your chosen timeframe is. Here the lid was ~$85.4–85.5k (Sunday's highs). The 4H candle that closes at 05:30 IST is the first real test of whether this counts.
2) RETEST
After a breakout, price often comes back to touch the old level from the other side, so old resistance gets tested as support. For BTC that zone is ~$85.4–85.5k. Holding it on a pullback is what turns a breakout into a trend, which is why many traders wait for the retest instead of chasing the first green candle.
3) FAKEOUT
Price breaks the level, then closes back inside the old range, and late buyers get trapped. For this move, 4H closes back under ~$85.4k would be the fakeout signal.
How to use the three words together
- Mark the level before the move, not after it.
- Pick your timeframe first. A 15m breakout means little to a 4H plan.
- Write your invalidation: the close that would make it a fakeout.
- Size so that being wrong is boring.
Live snapshot (Binance spot, ~04:00 IST Monday): $BTC ~$86.4k (+1.8%) · $ETH ~$2,727 (+1.5%) · $BNB ~$795 (+1.0%)
This is a vocabulary lesson with a live chart, not financial advice.
Which one does this move become: BREAKOUT, RETEST, or FAKEOUT? Reply below.
#Bitcoin #CryptoEducation #BinanceSquare
That move is a clean live example of three words beginners see on Square every day but rarely get defined plainly.
1) BREAKOUT
Price CLOSES beyond a level that capped it before. The key word is close. A wick above resistance is not a breakout; a candle close on your chosen timeframe is. Here the lid was ~$85.4–85.5k (Sunday's highs). The 4H candle that closes at 05:30 IST is the first real test of whether this counts.
2) RETEST
After a breakout, price often comes back to touch the old level from the other side, so old resistance gets tested as support. For BTC that zone is ~$85.4–85.5k. Holding it on a pullback is what turns a breakout into a trend, which is why many traders wait for the retest instead of chasing the first green candle.
3) FAKEOUT
Price breaks the level, then closes back inside the old range, and late buyers get trapped. For this move, 4H closes back under ~$85.4k would be the fakeout signal.
How to use the three words together
- Mark the level before the move, not after it.
- Pick your timeframe first. A 15m breakout means little to a 4H plan.
- Write your invalidation: the close that would make it a fakeout.
- Size so that being wrong is boring.
Live snapshot (Binance spot, ~04:00 IST Monday): $BTC ~$86.4k (+1.8%) · $ETH ~$2,727 (+1.5%) · $BNB ~$795 (+1.0%)
This is a vocabulary lesson with a live chart, not financial advice.
Which one does this move become: BREAKOUT, RETEST, or FAKEOUT? Reply below.
#Bitcoin #CryptoEducation #BinanceSquare
99
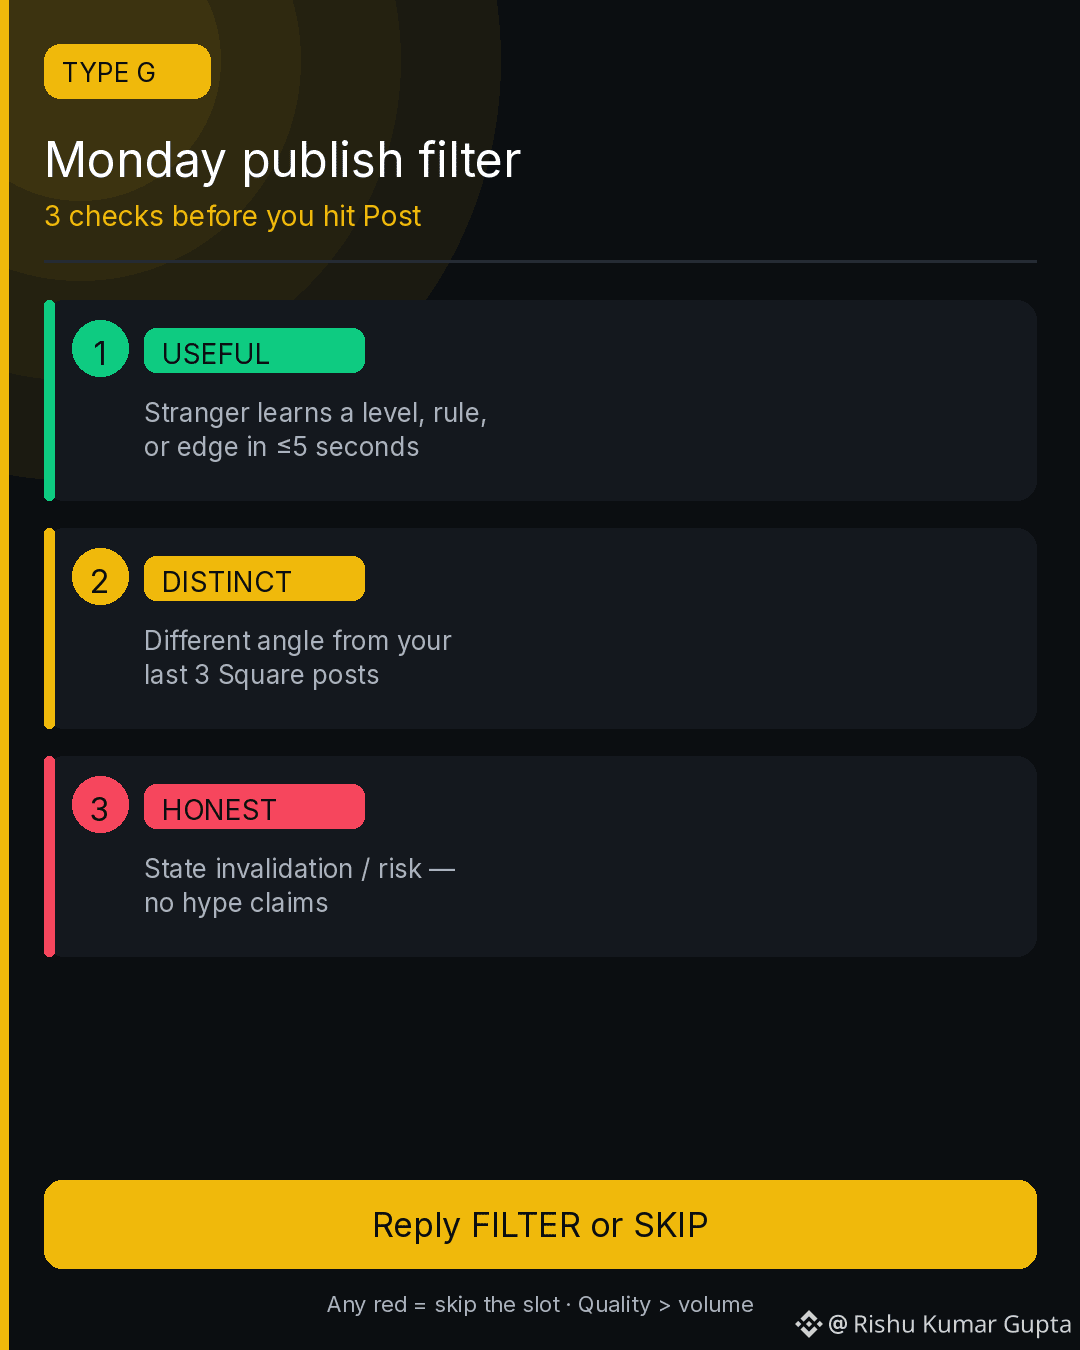
Monday publish filter — 3 checks before Post
Week starts quiet (tape not the story). Before you spam Square this week:
1) USEFUL — would a stranger learn a level, rule, or edge in 5 seconds?
2) DISTINCT — is this a different angle than your last 3 posts?
3) HONEST — did you write the invalidate / risk line, or is it just hype?
Any red = skip the slot. Quality > volume still wins Write-to-Earn long-term.
Reply FILTER or SKIP
#BinanceSquare #Crypto #Creators
Monday publish filter — 3 checks before Post
Week starts quiet (tape not the story). Before you spam Square this week:
1) USEFUL — would a stranger learn a level, rule, or edge in 5 seconds?
2) DISTINCT — is this a different angle than your last 3 posts?
3) HONEST — did you write the invalidate / risk line, or is it just hype?
Any red = skip the slot. Quality > volume still wins Write-to-Earn long-term.
Reply FILTER or SKIP
#BinanceSquare #Crypto #Creators
Week starts quiet (tape not the story). Before you spam Square this week:
1) USEFUL — would a stranger learn a level, rule, or edge in 5 seconds?
2) DISTINCT — is this a different angle than your last 3 posts?
3) HONEST — did you write the invalidate / risk line, or is it just hype?
Any red = skip the slot. Quality > volume still wins Write-to-Earn long-term.
Reply FILTER or SKIP
#BinanceSquare #Crypto #Creators
27
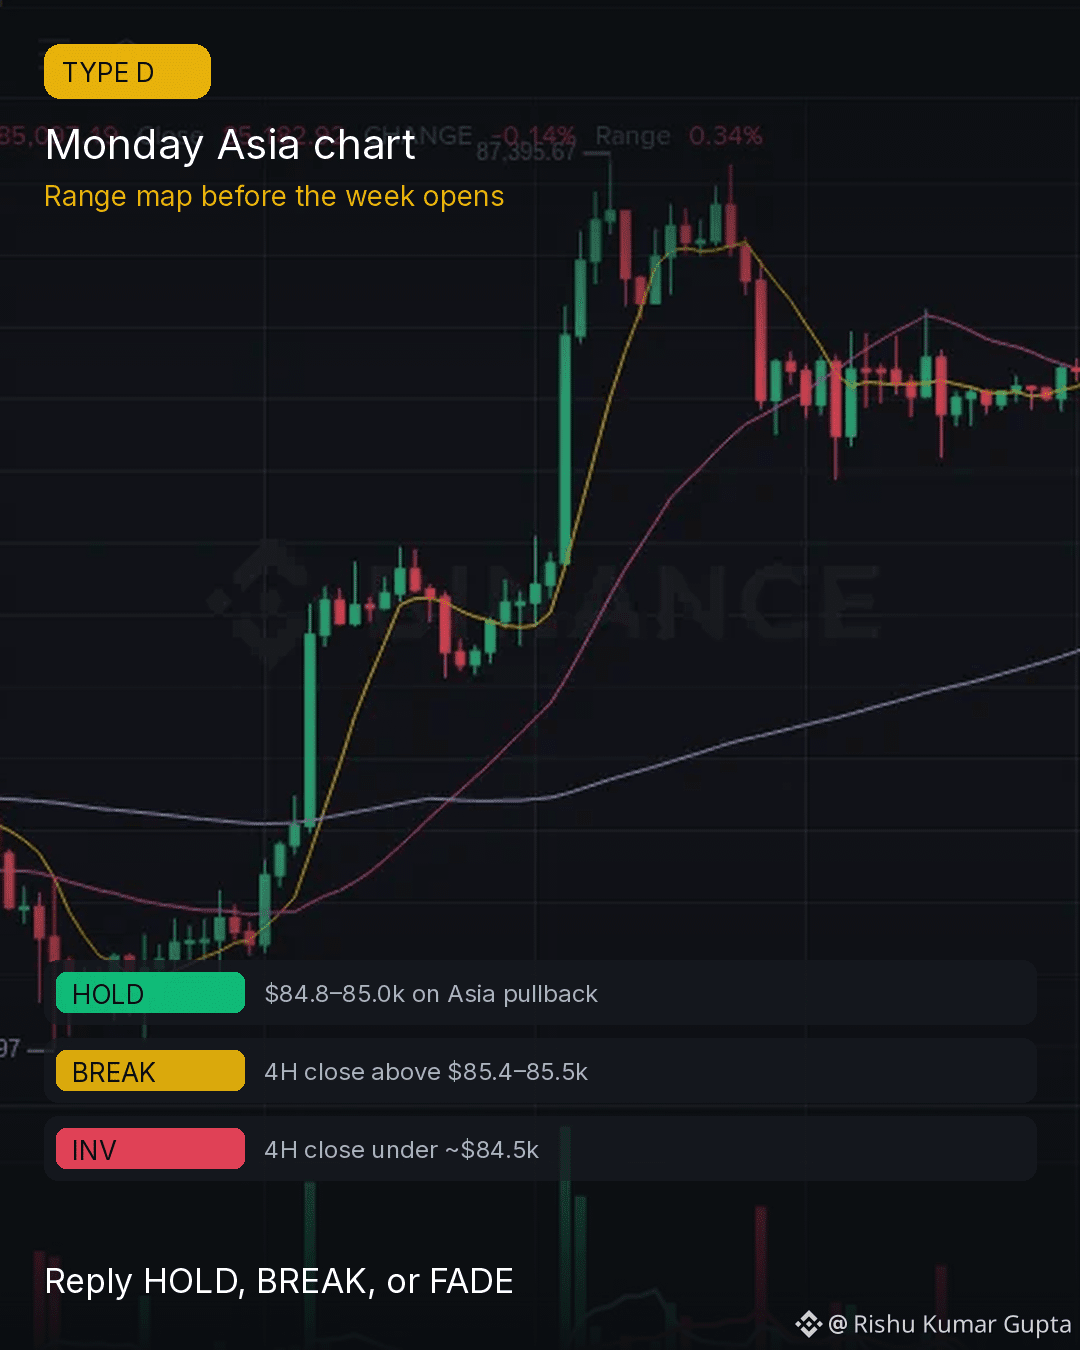
Monday Asia chart — range before the week
$BTC coiled ~$85.2k (+0.5%) into Sunday night. Clean map for Asia open → Monday:
1) HOLD — defend $84.8–85.0k on the first Asia pullback
2) BREAK — only if 4H closes above ~$85.4–85.5k (today’s high zone)
3) INV — 4H close back under ~$84.5k = shelf failed, cut size
Thin weekend volume ≠ conviction. Let Asia print the first reaction before you size the week.
Live: $BTC ~$85.2k (+0.5%) · $ETH ~$2,698 (+0.6%) · $BNB ~$787 (+1.3%)
Reply HOLD, BREAK, or FADE
#Bitcoin #Crypto #BinanceSquare
Monday Asia chart — range before the week
$BTC coiled ~$85.2k (+0.5%) into Sunday night. Clean map for Asia open → Monday:
1) HOLD — defend $84.8–85.0k on the first Asia pullback
2) BREAK — only if 4H closes above ~$85.4–85.5k (today’s high zone)
3) INV — 4H close back under ~$84.5k = shelf failed, cut size
Thin weekend volume ≠ conviction. Let Asia print the first reaction before you size the week.
Live: $BTC ~$85.2k (+0.5%) · $ETH ~$2,698 (+0.6%) · $BNB ~$787 (+1.3%)
Reply HOLD, BREAK, or FADE
#Bitcoin #Crypto #BinanceSquare
$BTC coiled ~$85.2k (+0.5%) into Sunday night. Clean map for Asia open → Monday:
1) HOLD — defend $84.8–85.0k on the first Asia pullback
2) BREAK — only if 4H closes above ~$85.4–85.5k (today’s high zone)
3) INV — 4H close back under ~$84.5k = shelf failed, cut size
Thin weekend volume ≠ conviction. Let Asia print the first reaction before you size the week.
Live: $BTC ~$85.2k (+0.5%) · $ETH ~$2,698 (+0.6%) · $BNB ~$787 (+1.3%)
Reply HOLD, BREAK, or FADE
#Bitcoin #Crypto #BinanceSquare
47
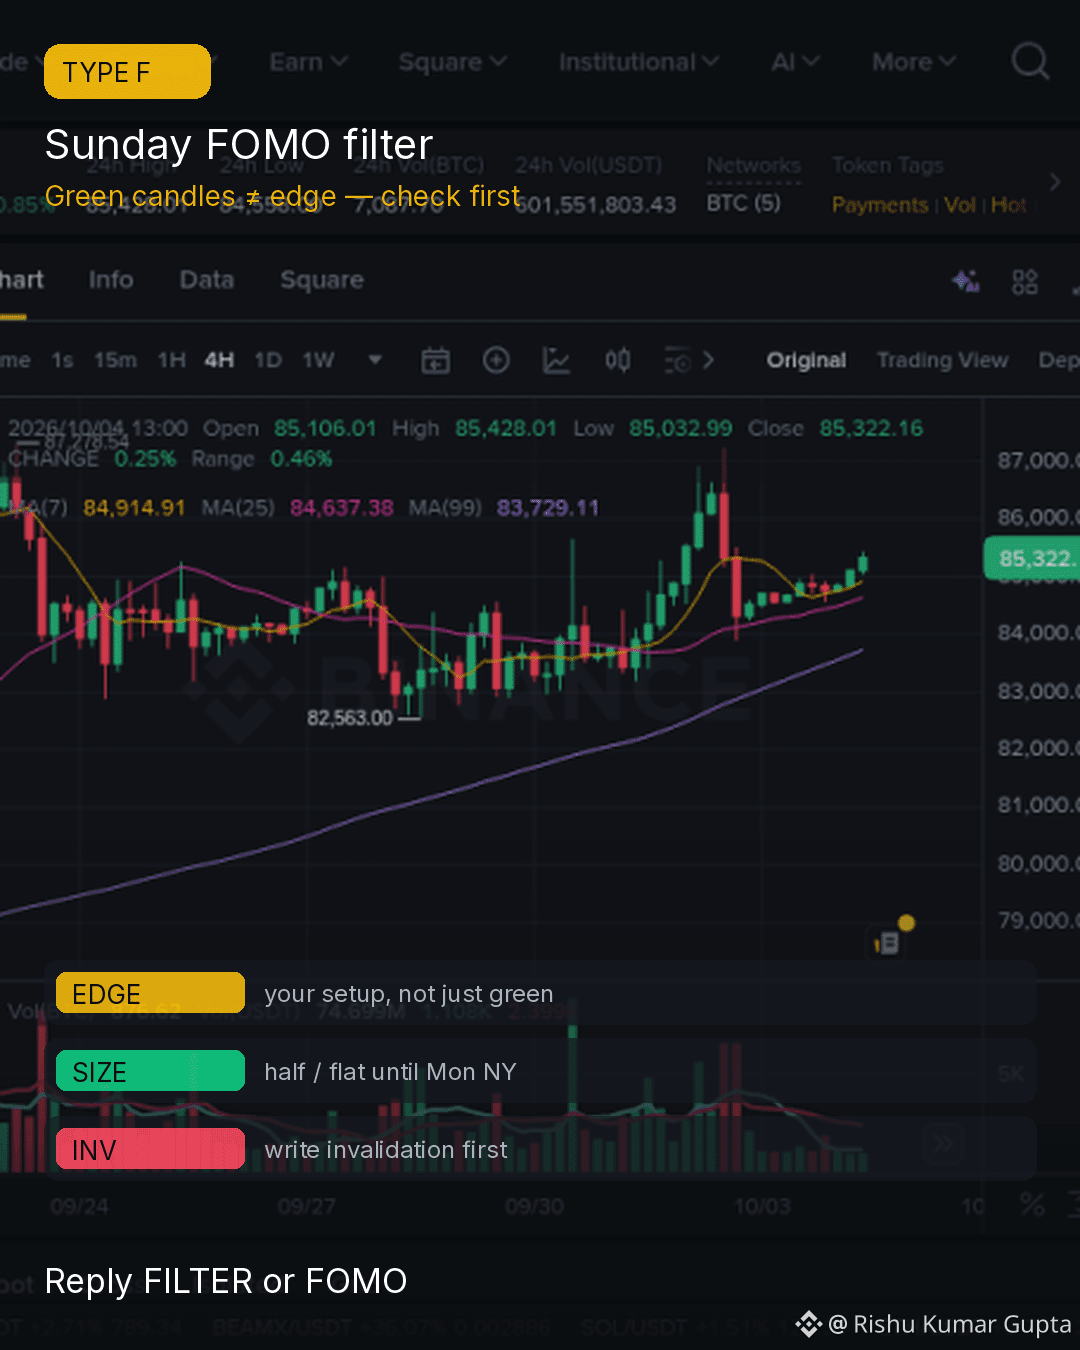
Sunday FOMO filter — green ≠ edge
$BTC is grinding ~$85.3k (+0.8%) on thin Sunday liquidity. Before you size the bounce into Monday:
1) EDGE — is this YOUR written setup, or just green candles feeling good?
2) SIZE — half size (or flat) until Monday NY prints a clean reaction
3) INV — write the invalidation first (e.g. 4H close back under ~$84.2–84.5k)
If you skip the filter, you're funding someone else's exit.
Live: $BTC ~$85.3k (+0.8%) · $ETH ~$2,704 (+0.7%) · $BNB ~$789 (+2.6%)
Reply FILTER or FOMO
#Bitcoin #Crypto #BinanceSquare
Sunday FOMO filter — green ≠ edge
$BTC is grinding ~$85.3k (+0.8%) on thin Sunday liquidity. Before you size the bounce into Monday:
1) EDGE — is this YOUR written setup, or just green candles feeling good?
2) SIZE — half size (or flat) until Monday NY prints a clean reaction
3) INV — write the invalidation first (e.g. 4H close back under ~$84.2–84.5k)
If you skip the filter, you're funding someone else's exit.
Live: $BTC ~$85.3k (+0.8%) · $ETH ~$2,704 (+0.7%) · $BNB ~$789 (+2.6%)
Reply FILTER or FOMO
#Bitcoin #Crypto #BinanceSquare
$BTC is grinding ~$85.3k (+0.8%) on thin Sunday liquidity. Before you size the bounce into Monday:
1) EDGE — is this YOUR written setup, or just green candles feeling good?
2) SIZE — half size (or flat) until Monday NY prints a clean reaction
3) INV — write the invalidation first (e.g. 4H close back under ~$84.2–84.5k)
If you skip the filter, you're funding someone else's exit.
Live: $BTC ~$85.3k (+0.8%) · $ETH ~$2,704 (+0.7%) · $BNB ~$789 (+2.6%)
Reply FILTER or FOMO
#Bitcoin #Crypto #BinanceSquare
76
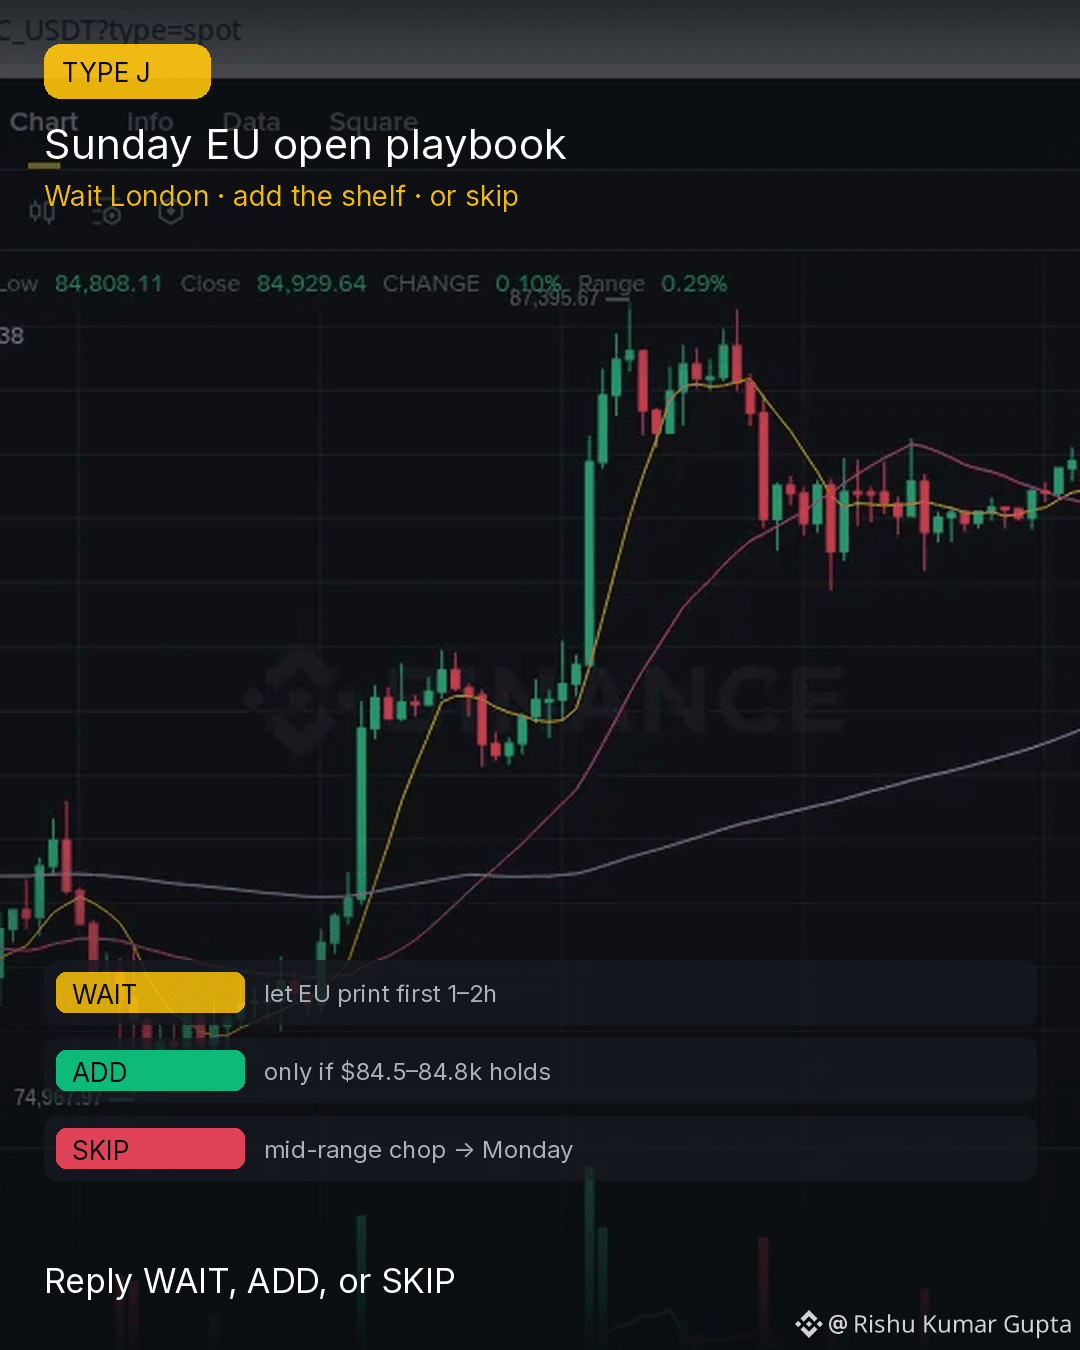
Sunday EU open playbook — wait, add the shelf, or skip?
$BTC is still mid-range (~$84.9k, +0.3%) after the Fri spike/fade. London is the first real liquidity print of the week. Before you size:
1) WAIT — let EU print the first 1–2 hours; no fresh size until a clean 4H level reacts
2) ADD — only if $84.5–84.8k holds as demand into London (weekend shelf)
3) SKIP — mid-range chop with no sweep/hold = save size for Monday NY
INV: 4H close back under ~$83.5k breaks the shelf — cut, don’t average Sunday.
Session playbook ≠ FOMO. Plan the reaction, don’t invent the move.
Live: $BTC ~$84.9k (+0.3%) · $ETH ~$2,692 (+0.5%) · $BNB ~$788 (+2.8%)
Reply WAIT, ADD, or SKIP
#Bitcoin #Crypto #BinanceSquare
Sunday EU open playbook — wait, add the shelf, or skip?
$BTC is still mid-range (~$84.9k, +0.3%) after the Fri spike/fade. London is the first real liquidity print of the week. Before you size:
1) WAIT — let EU print the first 1–2 hours; no fresh size until a clean 4H level reacts
2) ADD — only if $84.5–84.8k holds as demand into London (weekend shelf)
3) SKIP — mid-range chop with no sweep/hold = save size for Monday NY
INV: 4H close back under ~$83.5k breaks the shelf — cut, don’t average Sunday.
Session playbook ≠ FOMO. Plan the reaction, don’t invent the move.
Live: $BTC ~$84.9k (+0.3%) · $ETH ~$2,692 (+0.5%) · $BNB ~$788 (+2.8%)
Reply WAIT, ADD, or SKIP
#Bitcoin #Crypto #BinanceSquare
$BTC is still mid-range (~$84.9k, +0.3%) after the Fri spike/fade. London is the first real liquidity print of the week. Before you size:
1) WAIT — let EU print the first 1–2 hours; no fresh size until a clean 4H level reacts
2) ADD — only if $84.5–84.8k holds as demand into London (weekend shelf)
3) SKIP — mid-range chop with no sweep/hold = save size for Monday NY
INV: 4H close back under ~$83.5k breaks the shelf — cut, don’t average Sunday.
Session playbook ≠ FOMO. Plan the reaction, don’t invent the move.
Live: $BTC ~$84.9k (+0.3%) · $ETH ~$2,692 (+0.5%) · $BNB ~$788 (+2.8%)
Reply WAIT, ADD, or SKIP
#Bitcoin #Crypto #BinanceSquare
87
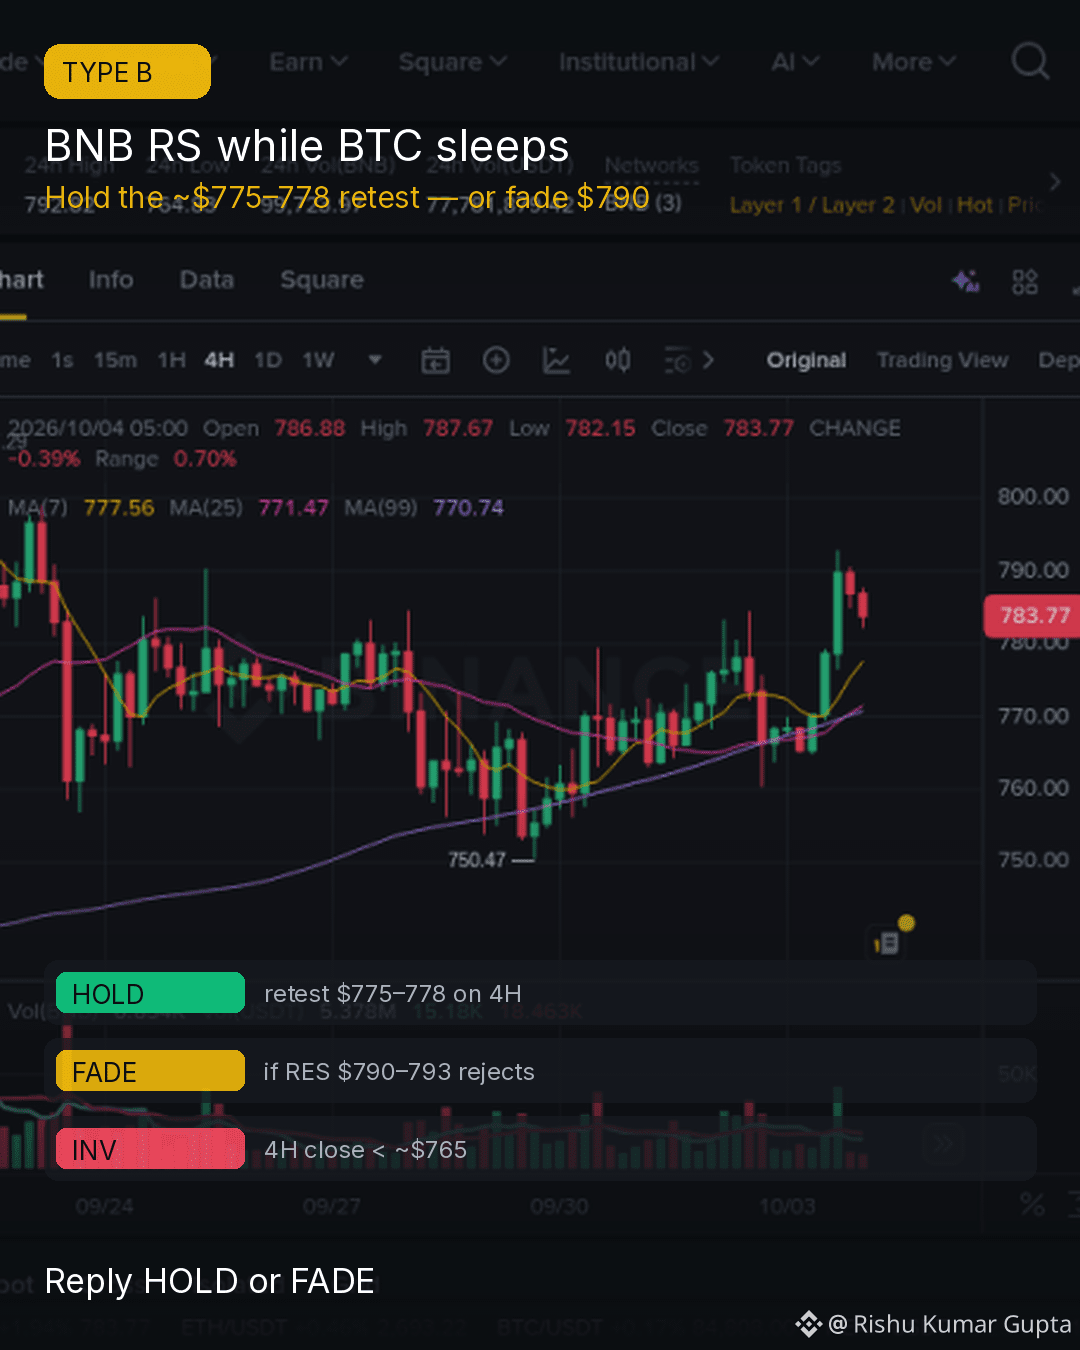
BNB still showing RS while BTC sleeps — hold the pullback or fade $790?
$BNB is ~+2% on the day vs $BTC basically flat. Weekend bid pushed into ~$793, then cooled to ~$784. Before Monday size:
1) HOLD — buy the retest if $775–778 holds on 4H (prior shelf + weekend base)
2) FADE — if $790–793 rejects again into the open, treat it as supply not a breakout
3) INV — 4H close back under ~$765 kills the RS idea; cut, don’t average
RS ≠ chase. Wait for the retest or the clean reject.
Live: $BNB ~$784 (+2.0%) · $BTC ~$84.8k (+0.2%) · $ETH ~$2,693 (+0.5%)
Reply HOLD or FADE
#BNB #Crypto #BinanceSquare
BNB still showing RS while BTC sleeps — hold the pullback or fade $790?
$BNB is ~+2% on the day vs $BTC basically flat. Weekend bid pushed into ~$793, then cooled to ~$784. Before Monday size:
1) HOLD — buy the retest if $775–778 holds on 4H (prior shelf + weekend base)
2) FADE — if $790–793 rejects again into the open, treat it as supply not a breakout
3) INV — 4H close back under ~$765 kills the RS idea; cut, don’t average
RS ≠ chase. Wait for the retest or the clean reject.
Live: $BNB ~$784 (+2.0%) · $BTC ~$84.8k (+0.2%) · $ETH ~$2,693 (+0.5%)
Reply HOLD or FADE
#BNB #Crypto #BinanceSquare
$BNB is ~+2% on the day vs $BTC basically flat. Weekend bid pushed into ~$793, then cooled to ~$784. Before Monday size:
1) HOLD — buy the retest if $775–778 holds on 4H (prior shelf + weekend base)
2) FADE — if $790–793 rejects again into the open, treat it as supply not a breakout
3) INV — 4H close back under ~$765 kills the RS idea; cut, don’t average
RS ≠ chase. Wait for the retest or the clean reject.
Live: $BNB ~$784 (+2.0%) · $BTC ~$84.8k (+0.2%) · $ETH ~$2,693 (+0.5%)
Reply HOLD or FADE
#BNB #Crypto #BinanceSquare
110
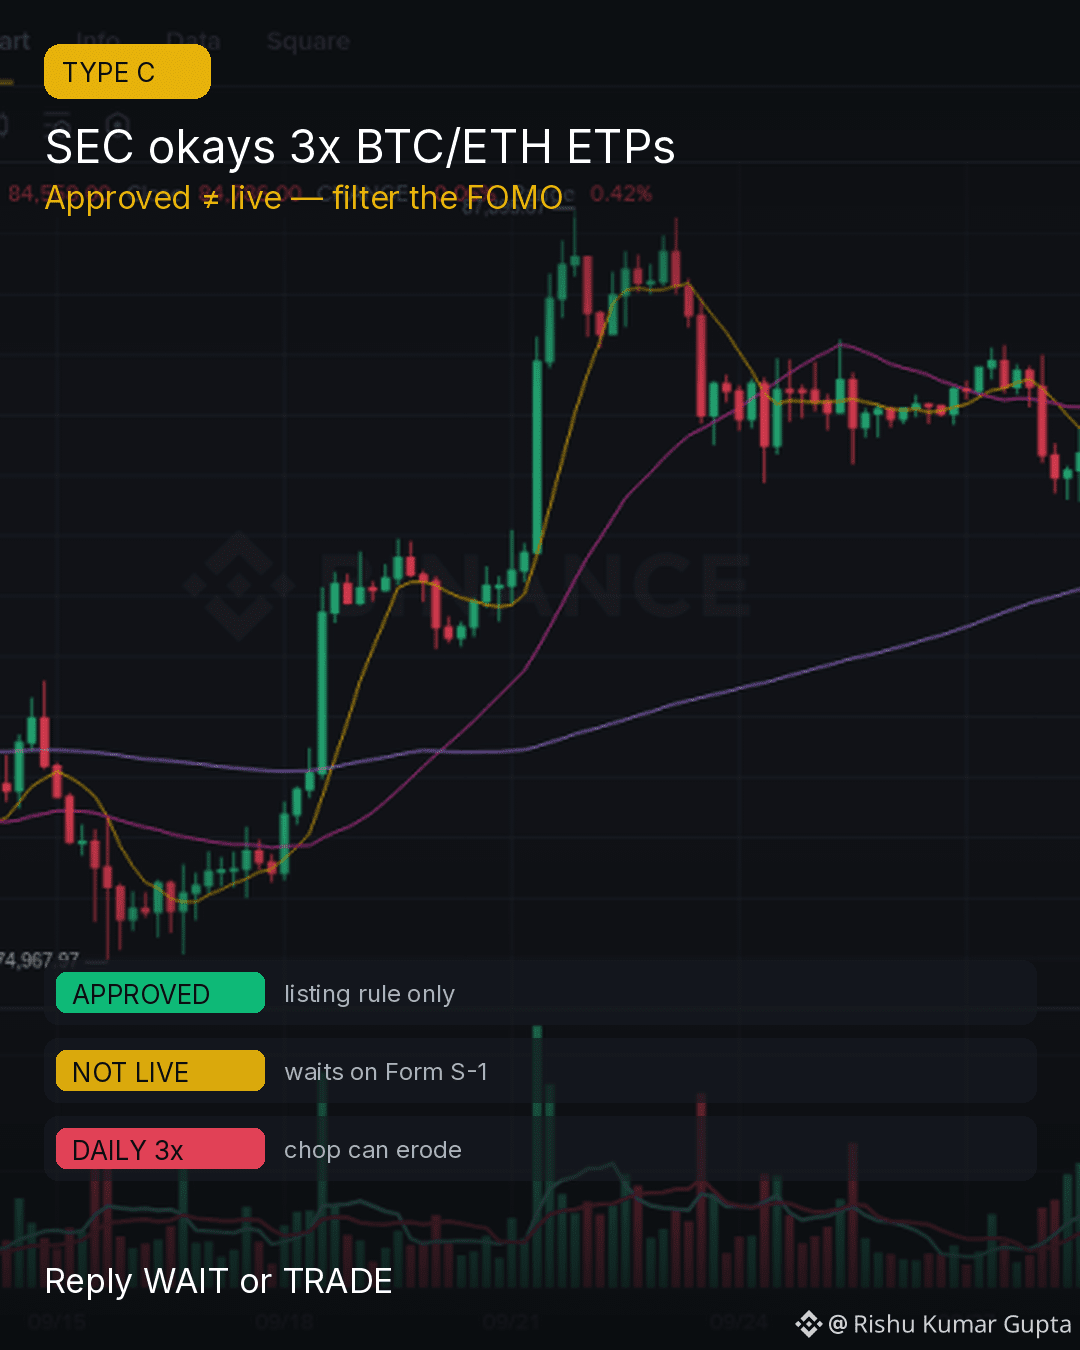
SEC green-lights 3x BTC/ETH ETPs — but not live yet
On Oct 2 the SEC approved a Cboe listing rule for Volatility Shares 3x Bitcoin and 3x Ether ETPs (plus gold/silver/oil/natgas). Important filter before the FOMO replies:
1) APPROVED ≠ LIVE — trading waits until the Form S-1 is effective (no launch date in the filing)
2) DAILY RESET — 3x is a one-day target; chop can erode multi-day returns even if spot ends flat
3) FUTURES PATH — these are futures-based, not spot ETFs; roll costs matter over time
Headline risk ≠ trade signal. Wait for the S-1 gun, then size like any high-decay leverage tool.
Live: $BTC ~$84.8k (+0.3%) · $ETH ~$2,688 (+0.8%) · $BNB ~$788 (+2.8%)
Reply WAIT or TRADE
#BTC #Crypto #BinanceSquare
SEC green-lights 3x BTC/ETH ETPs — but not live yet
On Oct 2 the SEC approved a Cboe listing rule for Volatility Shares 3x Bitcoin and 3x Ether ETPs (plus gold/silver/oil/natgas). Important filter before the FOMO replies:
1) APPROVED ≠ LIVE — trading waits until the Form S-1 is effective (no launch date in the filing)
2) DAILY RESET — 3x is a one-day target; chop can erode multi-day returns even if spot ends flat
3) FUTURES PATH — these are futures-based, not spot ETFs; roll costs matter over time
Headline risk ≠ trade signal. Wait for the S-1 gun, then size like any high-decay leverage tool.
Live: $BTC ~$84.8k (+0.3%) · $ETH ~$2,688 (+0.8%) · $BNB ~$788 (+2.8%)
Reply WAIT or TRADE
#BTC #Crypto #BinanceSquare
On Oct 2 the SEC approved a Cboe listing rule for Volatility Shares 3x Bitcoin and 3x Ether ETPs (plus gold/silver/oil/natgas). Important filter before the FOMO replies:
1) APPROVED ≠ LIVE — trading waits until the Form S-1 is effective (no launch date in the filing)
2) DAILY RESET — 3x is a one-day target; chop can erode multi-day returns even if spot ends flat
3) FUTURES PATH — these are futures-based, not spot ETFs; roll costs matter over time
Headline risk ≠ trade signal. Wait for the S-1 gun, then size like any high-decay leverage tool.
Live: $BTC ~$84.8k (+0.3%) · $ETH ~$2,688 (+0.8%) · $BNB ~$788 (+2.8%)
Reply WAIT or TRADE
#BTC #Crypto #BinanceSquare
64
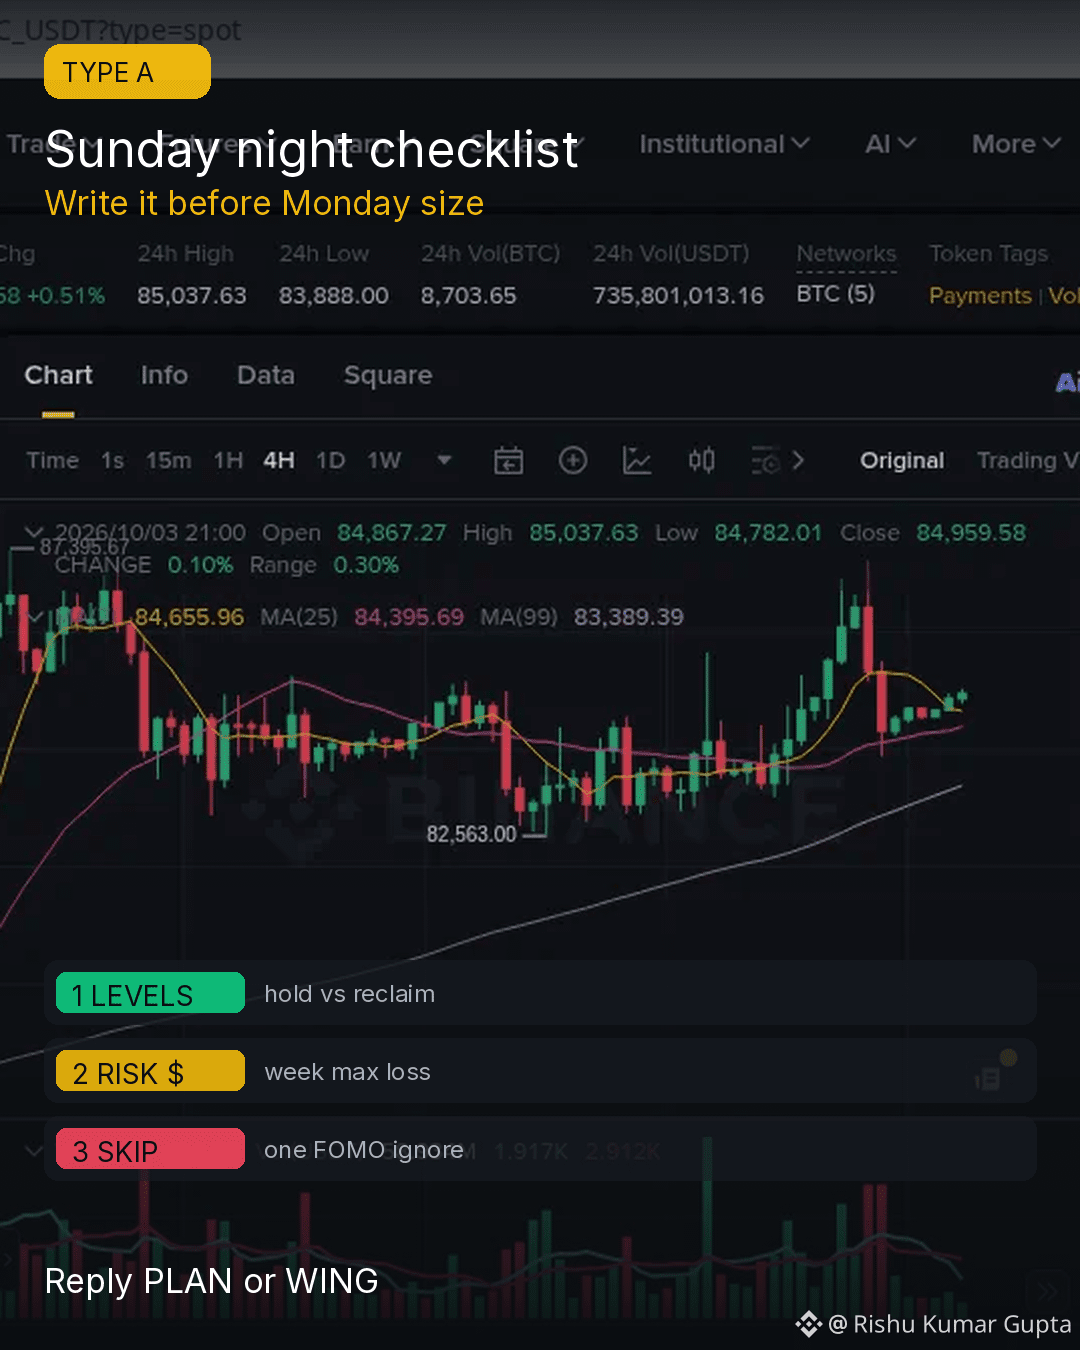
Sunday night checklist — before Monday size
Weekend bounce into ~$85k doesn't reset the plan. Before Asia/EU Monday liquidity, write these three:
1) LEVELS — which $BTC shelf still matters for you ($84.2–84.5k hold vs $85.5–86k reclaim)
2) RISK $ — max loss for the week, not "feel it out"
3) SKIP LIST — one setup you'll ignore even if it looks juicy (FOMO ≠ edge)
If you can't write it in 60 seconds, you're not ready to size.
Live: $BTC ~$85.0k (+0.5%) · $ETH ~$2,685 (+0.2%) · $BNB ~$790 (+2.7%)
Reply PLAN or WING
#BTC #Crypto #BinanceSquare
Sunday night checklist — before Monday size
Weekend bounce into ~$85k doesn't reset the plan. Before Asia/EU Monday liquidity, write these three:
1) LEVELS — which $BTC shelf still matters for you ($84.2–84.5k hold vs $85.5–86k reclaim)
2) RISK $ — max loss for the week, not "feel it out"
3) SKIP LIST — one setup you'll ignore even if it looks juicy (FOMO ≠ edge)
If you can't write it in 60 seconds, you're not ready to size.
Live: $BTC ~$85.0k (+0.5%) · $ETH ~$2,685 (+0.2%) · $BNB ~$790 (+2.7%)
Reply PLAN or WING
#BTC #Crypto #BinanceSquare
Weekend bounce into ~$85k doesn't reset the plan. Before Asia/EU Monday liquidity, write these three:
1) LEVELS — which $BTC shelf still matters for you ($84.2–84.5k hold vs $85.5–86k reclaim)
2) RISK $ — max loss for the week, not "feel it out"
3) SKIP LIST — one setup you'll ignore even if it looks juicy (FOMO ≠ edge)
If you can't write it in 60 seconds, you're not ready to size.
Live: $BTC ~$85.0k (+0.5%) · $ETH ~$2,685 (+0.2%) · $BNB ~$790 (+2.7%)
Reply PLAN or WING
#BTC #Crypto #BinanceSquare
1
108
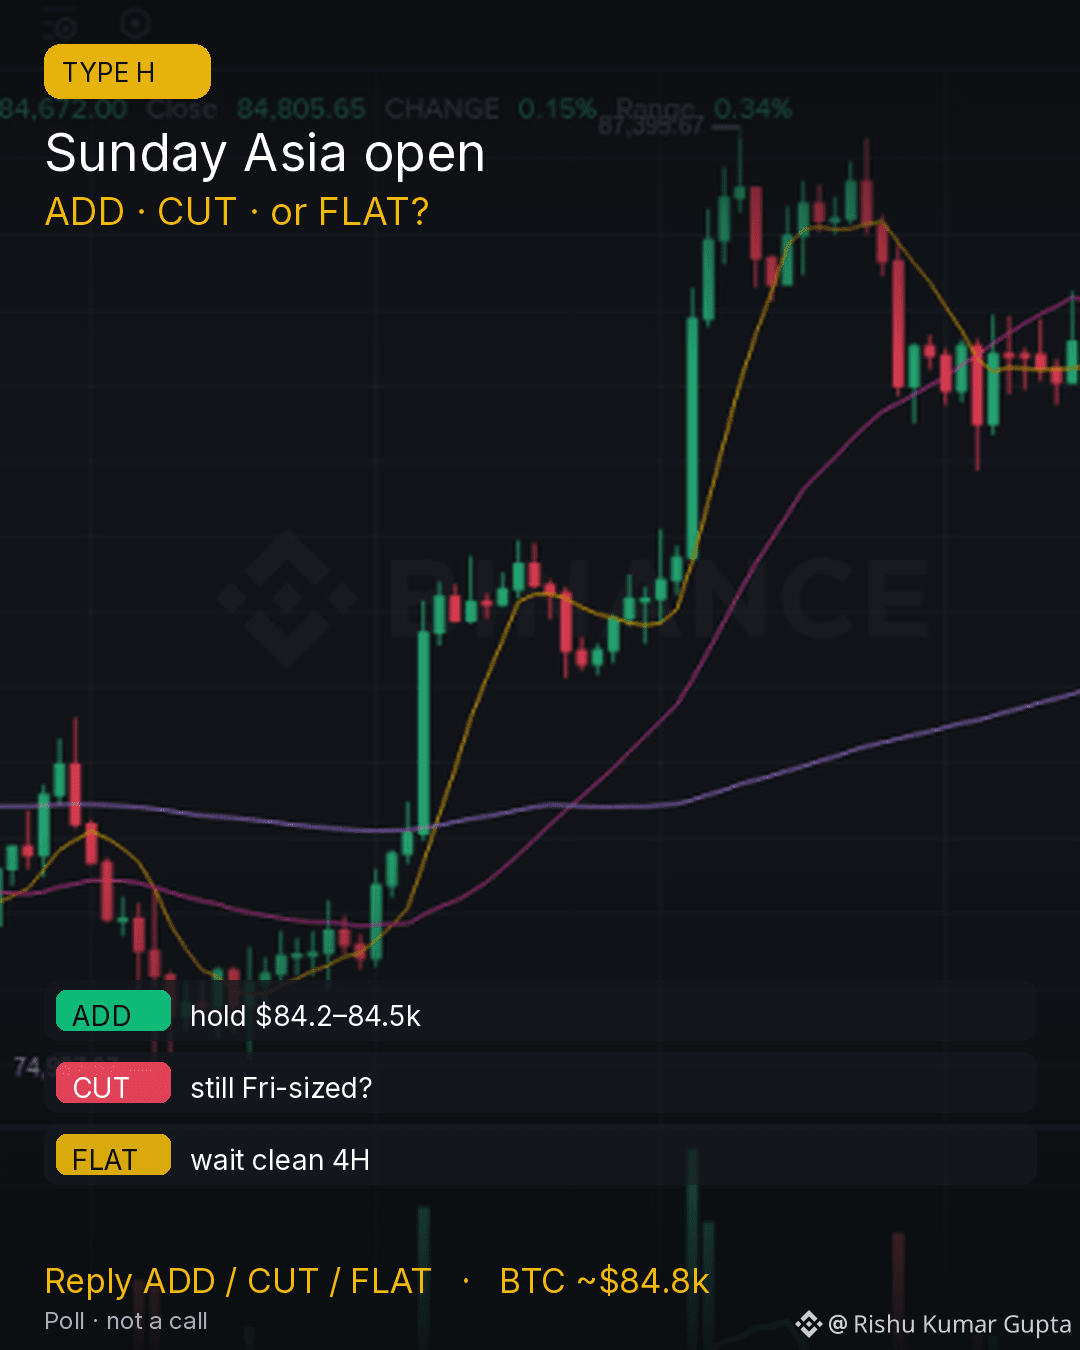
Sunday Asia open — ADD, CUT, or FLAT?
Weekend tape cooled from the $86k+ rejection. Into Sunday Asia I'm not trading the vibe — I'm picking a bias:
ADD — only if $84.2–84.5k holds and you already sized for thin books
CUT — if you're still carrying Friday size into a soft weekend grind
FLAT — default for most: wait for Asia to print the first clean 4H impulse
No prediction. Just your plan before the open.
Live: $BTC ~$84.8k (−1.5%) · $ETH ~$2,682 (−1.6%) · $SOL ~$119.5 (−1.6%)
Reply ADD, CUT, or FLAT
#BTC #Crypto #BinanceSquare
Sunday Asia open — ADD, CUT, or FLAT?
Weekend tape cooled from the $86k+ rejection. Into Sunday Asia I'm not trading the vibe — I'm picking a bias:
ADD — only if $84.2–84.5k holds and you already sized for thin books
CUT — if you're still carrying Friday size into a soft weekend grind
FLAT — default for most: wait for Asia to print the first clean 4H impulse
No prediction. Just your plan before the open.
Live: $BTC ~$84.8k (−1.5%) · $ETH ~$2,682 (−1.6%) · $SOL ~$119.5 (−1.6%)
Reply ADD, CUT, or FLAT
#BTC #Crypto #BinanceSquare
Weekend tape cooled from the $86k+ rejection. Into Sunday Asia I'm not trading the vibe — I'm picking a bias:
ADD — only if $84.2–84.5k holds and you already sized for thin books
CUT — if you're still carrying Friday size into a soft weekend grind
FLAT — default for most: wait for Asia to print the first clean 4H impulse
No prediction. Just your plan before the open.
Live: $BTC ~$84.8k (−1.5%) · $ETH ~$2,682 (−1.6%) · $SOL ~$119.5 (−1.6%)
Reply ADD, CUT, or FLAT
#BTC #Crypto #BinanceSquare
77
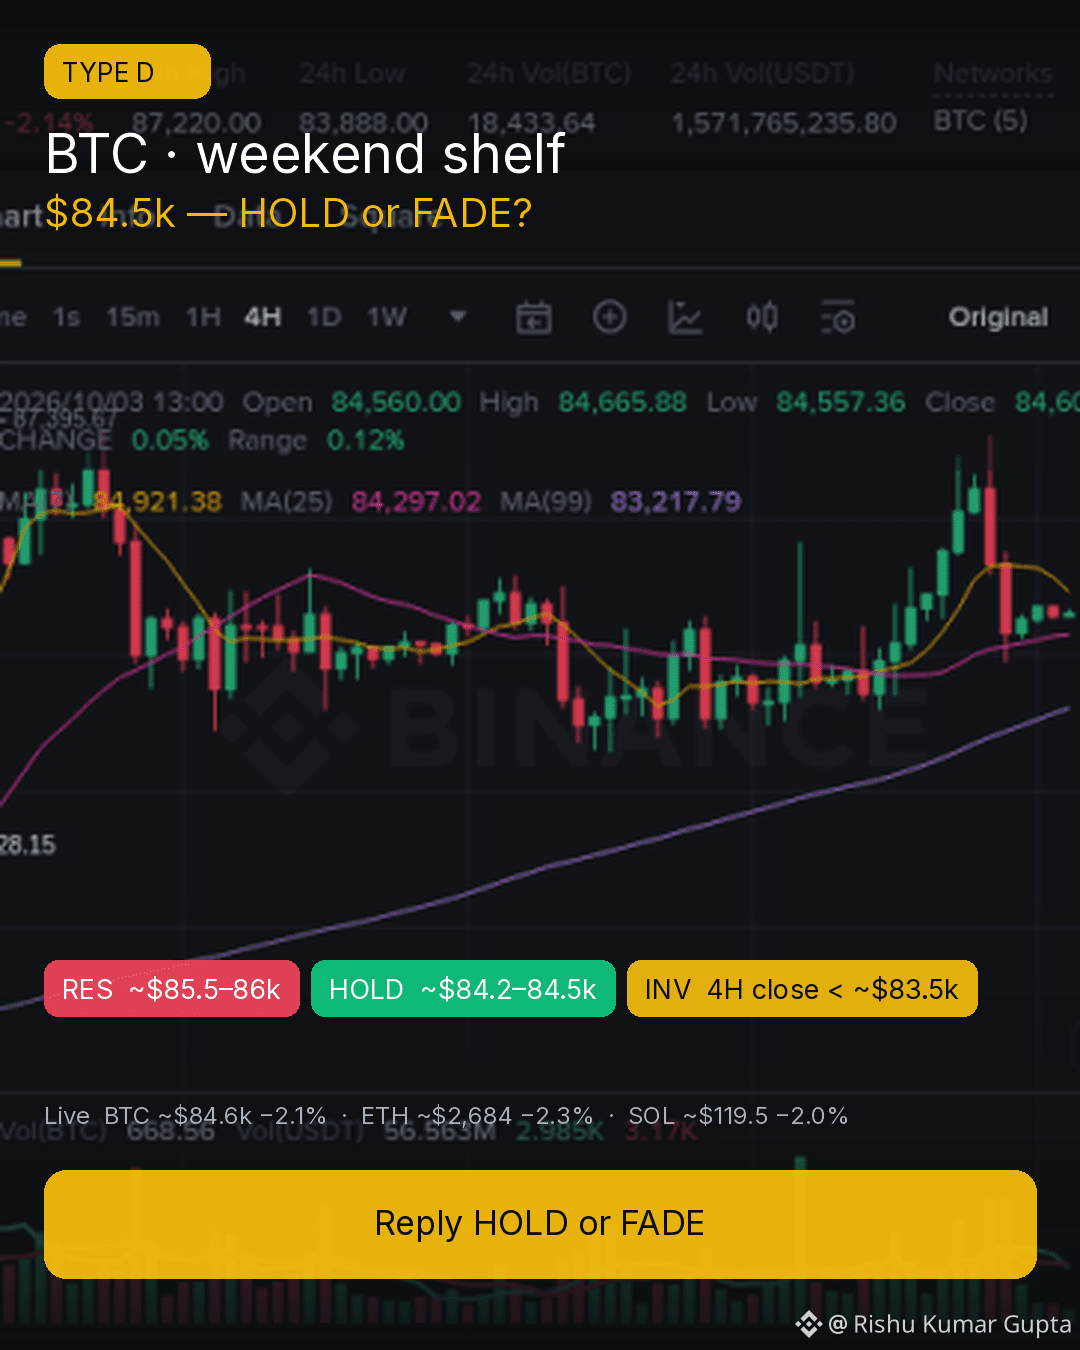
BTC weekend shelf: hold $84.5k or fade the bounce?
Compression after yesterday's $87k wick rejection. Into the US weekend window I'm watching:
RES ~$85.5–86k — reclaim needs a clean 4H close, not a wick
HOLD ~$84.2–84.5k — overnight base still intact
INV — 4H close below ~$83.5k opens a run toward the prior $83k shelf
Not a chase setup. Size down if you trade weekends — books are thinner.
Live: $BTC ~$84.6k (−2.1%) · $ETH ~$2,684 (−2.3%) · $SOL ~$119.5 (−2.0%)
Reply HOLD or FADE
#BTC #Crypto #BinanceSquare
BTC weekend shelf: hold $84.5k or fade the bounce?
Compression after yesterday's $87k wick rejection. Into the US weekend window I'm watching:
RES ~$85.5–86k — reclaim needs a clean 4H close, not a wick
HOLD ~$84.2–84.5k — overnight base still intact
INV — 4H close below ~$83.5k opens a run toward the prior $83k shelf
Not a chase setup. Size down if you trade weekends — books are thinner.
Live: $BTC ~$84.6k (−2.1%) · $ETH ~$2,684 (−2.3%) · $SOL ~$119.5 (−2.0%)
Reply HOLD or FADE
#BTC #Crypto #BinanceSquare
Compression after yesterday's $87k wick rejection. Into the US weekend window I'm watching:
RES ~$85.5–86k — reclaim needs a clean 4H close, not a wick
HOLD ~$84.2–84.5k — overnight base still intact
INV — 4H close below ~$83.5k opens a run toward the prior $83k shelf
Not a chase setup. Size down if you trade weekends — books are thinner.
Live: $BTC ~$84.6k (−2.1%) · $ETH ~$2,684 (−2.3%) · $SOL ~$119.5 (−2.0%)
Reply HOLD or FADE
#BTC #Crypto #BinanceSquare
131
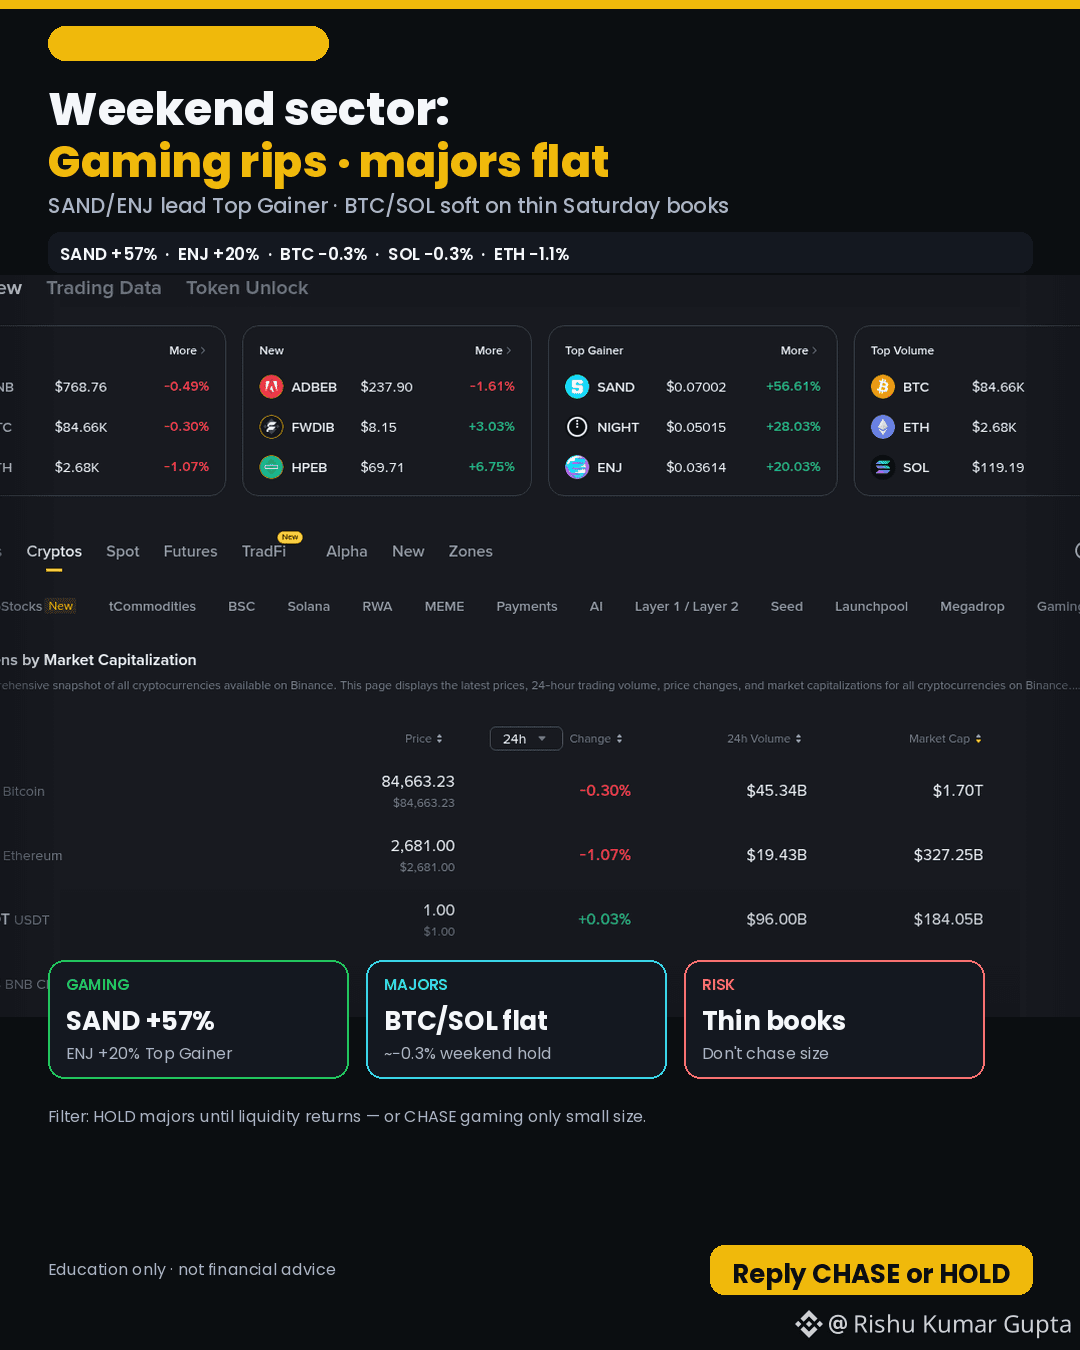
Weekend sector check: Gaming ripping · majors flat
Live (Binance): $SAND ~$0.069 (+55% 24h) leads Top Gainer while $BTC ~$84.7k (−0.3%) and $SOL ~$119 (−0.5%) hold soft on thin Saturday books.
Gaming is the sleeve, not the tape. Prefer HOLD majors until liquidity returns — or CHASE only small size.
Reply CHASE or HOLD
$SAND $BTC $SOL
#BinanceSquare #Crypto #Weekend
Weekend sector check: Gaming ripping · majors flat
Live (Binance): $SAND ~$0.069 (+55% 24h) leads Top Gainer while $BTC ~$84.7k (−0.3%) and $SOL ~$119 (−0.5%) hold soft on thin Saturday books.
Gaming is the sleeve, not the tape. Prefer HOLD majors until liquidity returns — or CHASE only small size.
Reply CHASE or HOLD
$SAND $BTC $SOL
#BinanceSquare #Crypto #Weekend
Live (Binance): $SAND ~$0.069 (+55% 24h) leads Top Gainer while $BTC ~$84.7k (−0.3%) and $SOL ~$119 (−0.5%) hold soft on thin Saturday books.
Gaming is the sleeve, not the tape. Prefer HOLD majors until liquidity returns — or CHASE only small size.
Reply CHASE or HOLD
$SAND $BTC $SOL
#BinanceSquare #Crypto #Weekend
344
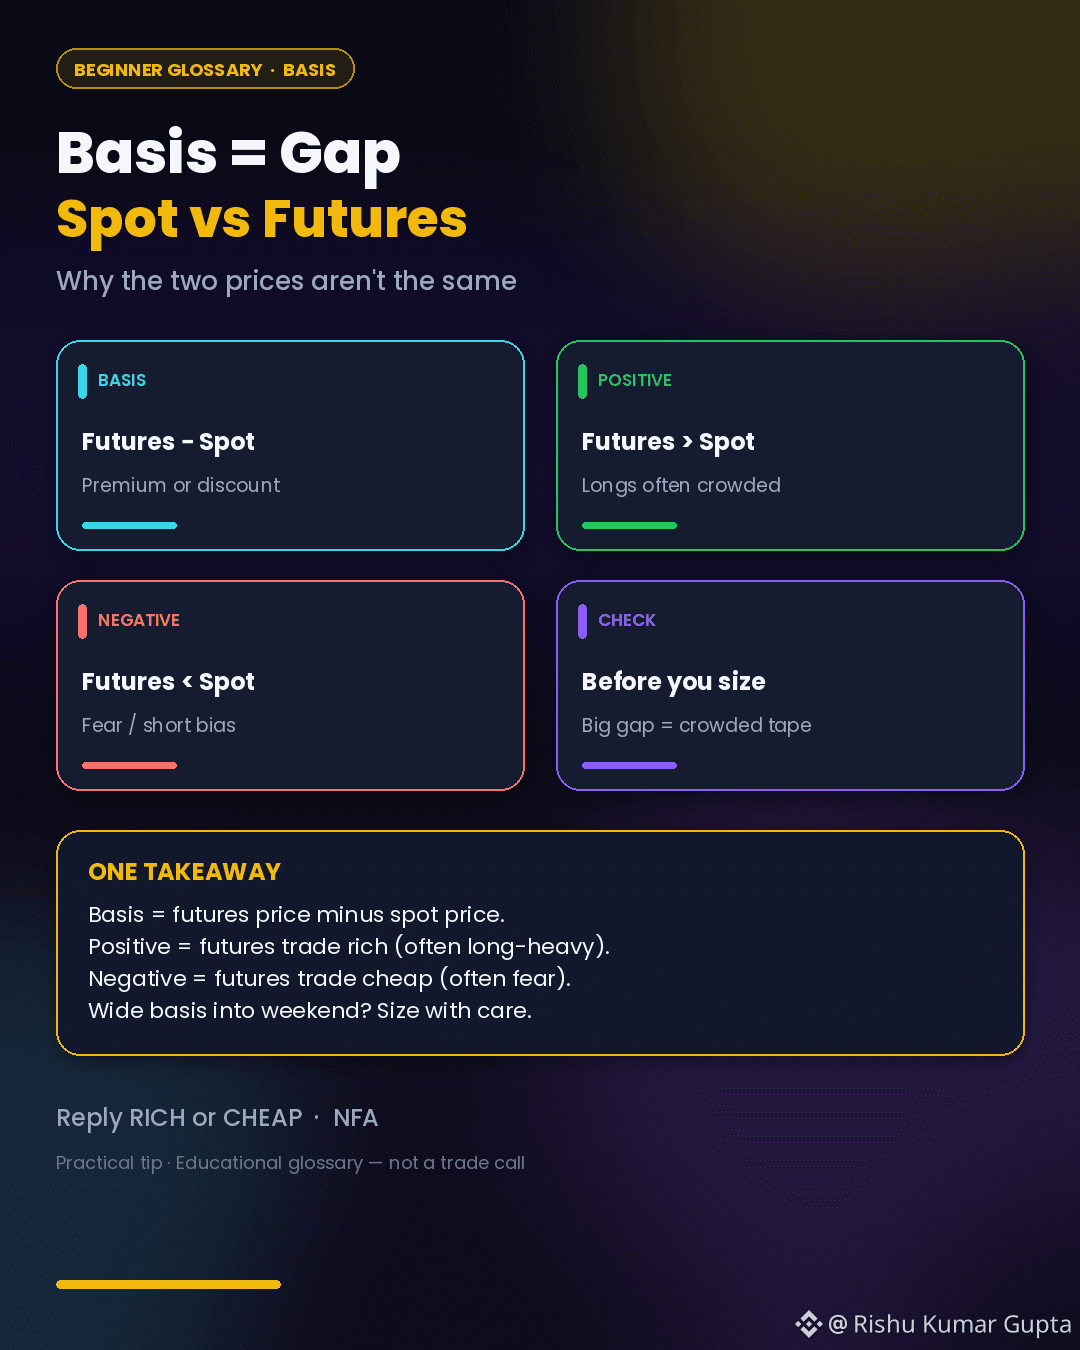
Basis = the gap between futures and spot.
Futures − Spot:
• Positive (rich) → futures above spot — longs often crowded
• Negative (cheap) → futures below spot — fear / short bias
Wide basis into a weekend? Size with care — thin books amplify the gap.
Live context: $BTC ~$84.6k (−0.2%) · $ETH ~$2,667 (−1.3%) · $SOL ~$118.4
Reply RICH or CHEAP — is futures trading above or below spot on your pair?
NFA · education only
#crypto #trading #BinanceSquare
Basis = the gap between futures and spot.
Futures − Spot:
• Positive (rich) → futures above spot — longs often crowded
• Negative (cheap) → futures below spot — fear / short bias
Wide basis into a weekend? Size with care — thin books amplify the gap.
Live context: $BTC ~$84.6k (−0.2%) · $ETH ~$2,667 (−1.3%) · $SOL ~$118.4
Reply RICH or CHEAP — is futures trading above or below spot on your pair?
NFA · education only
#crypto #trading #BinanceSquare
Futures − Spot:
• Positive (rich) → futures above spot — longs often crowded
• Negative (cheap) → futures below spot — fear / short bias
Wide basis into a weekend? Size with care — thin books amplify the gap.
Live context: $BTC ~$84.6k (−0.2%) · $ETH ~$2,667 (−1.3%) · $SOL ~$118.4
Reply RICH or CHEAP — is futures trading above or below spot on your pair?
NFA · education only
#crypto #trading #BinanceSquare
53
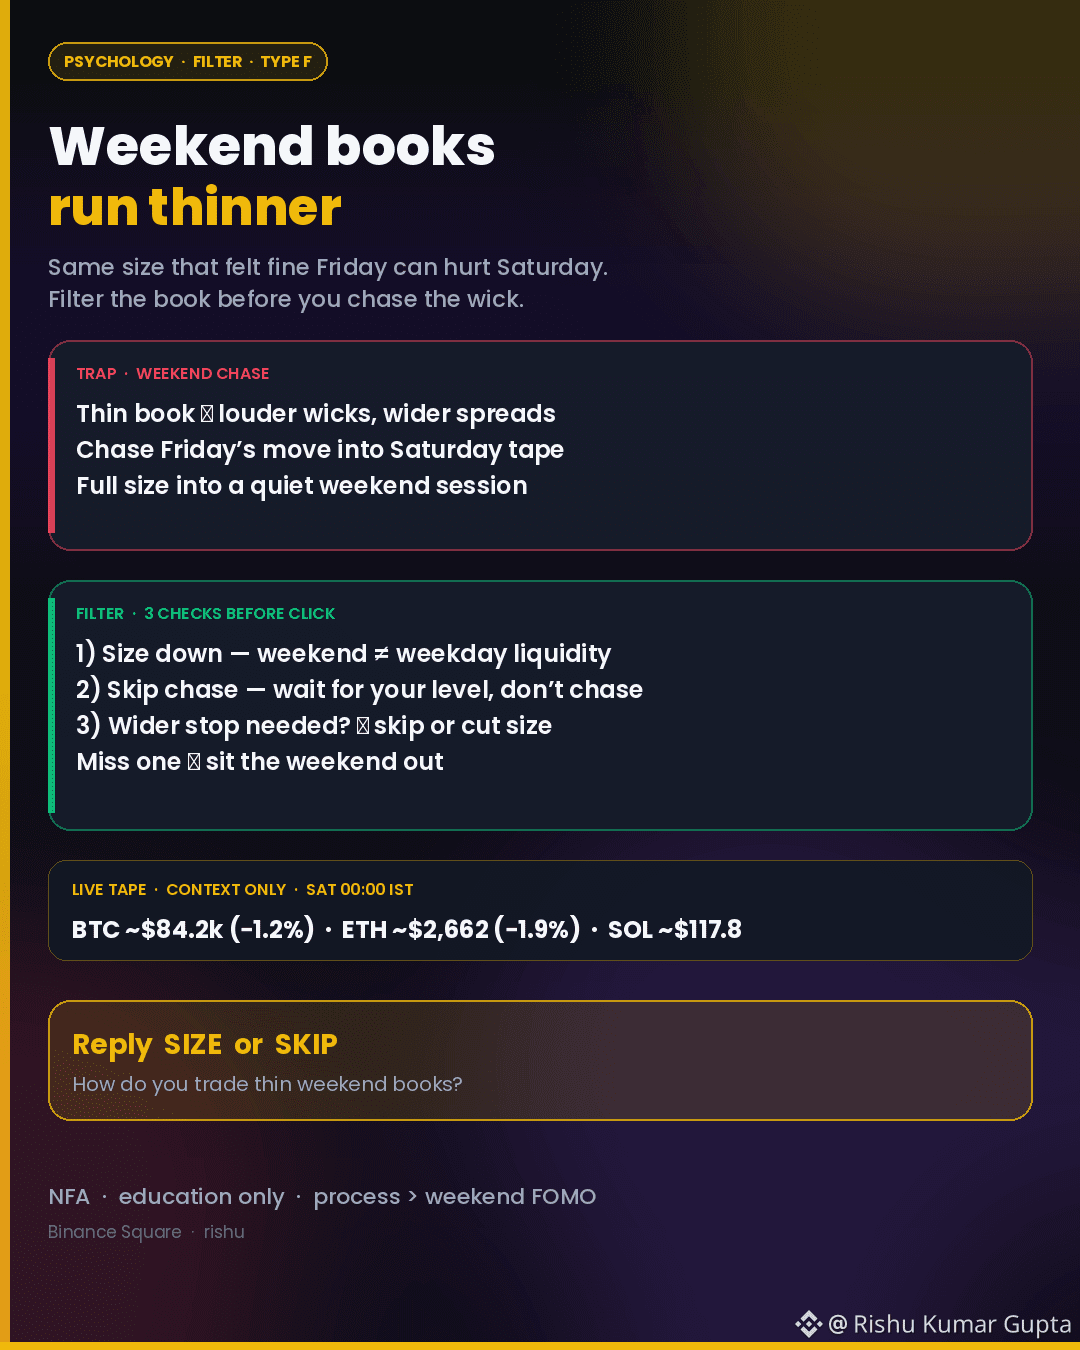
Weekend books run thinner.
Same size that felt fine Friday can hurt Saturday — louder wicks, wider spreads.
Filter before you click:
1) Size down — weekend ≠ weekday liquidity
2) Skip chase — wait for your level
3) Wider stop needed? → skip or cut size
Miss one → sit the weekend out.
Live tape (context): $BTC ~$84.2k (−1.2%) · $ETH ~$2,662 (−1.9%) · $SOL ~$117.8
Reply SIZE or SKIP — how do you trade thin weekend books?
NFA · education only
#crypto #trading #BinanceSquare
Weekend books run thinner.
Same size that felt fine Friday can hurt Saturday — louder wicks, wider spreads.
Filter before you click:
1) Size down — weekend ≠ weekday liquidity
2) Skip chase — wait for your level
3) Wider stop needed? → skip or cut size
Miss one → sit the weekend out.
Live tape (context): $BTC ~$84.2k (−1.2%) · $ETH ~$2,662 (−1.9%) · $SOL ~$117.8
Reply SIZE or SKIP — how do you trade thin weekend books?
NFA · education only
#crypto #trading #BinanceSquare
Same size that felt fine Friday can hurt Saturday — louder wicks, wider spreads.
Filter before you click:
1) Size down — weekend ≠ weekday liquidity
2) Skip chase — wait for your level
3) Wider stop needed? → skip or cut size
Miss one → sit the weekend out.
Live tape (context): $BTC ~$84.2k (−1.2%) · $ETH ~$2,662 (−1.9%) · $SOL ~$117.8
Reply SIZE or SKIP — how do you trade thin weekend books?
NFA · education only
#crypto #trading #BinanceSquare
132
Log in to explore more content
Join global crypto users on Binance Square
⚡️ Get latest and useful information about crypto.
💬 Trusted by the world’s largest crypto exchange.
👍 Discover real insights from verified creators.
Email / Phone number
Trending Topics
BinanceLaunchesBinanceIntelligence
16,775 views
230 Discussing
🚨 BINANCE JUST PUT AI DIRECTLY INSIDE THE EXCHANGE — AND THIS COULD CHANGE HOW RETAIL TRADES.
Binance has officially launched Binance Intelligence, a new AI layer built into the Binance ecosystem. It combines three products:
Binance AI for everyday users,
Binance AI Pro for automated trading workflows,
and Agent OS for developers building financial agents.
The part traders should care about?
Binance AI can surface market briefs, smart alerts, PnL recaps and personalized information, while AI Pro is designed to turn a plain-English trading idea into a visual strategy workflow.
That means the next phase of exchange competition may not be:
lowest fees vs deepest liquidity.
It could be:
who gives traders the best AI execution layer.
If Binance Intelligence actually drives heavier user activity, automated strategies and higher trading frequency, watch $BNB first.
AI adoption ↑
→ Binance engagement ↑
→ trading activity ↑
→ ecosystem narrative strengthens.
The catalyst I’d watch now:
global rollout + AI Pro launch + measurable user adoption.
Because once AI stops just telling you what the market is doing…
…and starts helping build the trade itself?
That’s when this gets much bigger than another chatbot. 👀
#binancelaunchesbinanceintelligence #EvernorthXRPTreasuryCompletesSPACMerger #ADAGains10%Above$0.27 #ETHUp70%InQ3ButLiquidityFalls #EthStakingExitQueueHits2026High
KimHotbae
·16 Likes
·21.2k views
EvernorthXRPTreasuryCompletesSPACMerger
18,921 views
170 Discussing
ADAGains10%Above$0.27
26,328 views
196 Discussing