
raintures
95 Posts

raintures
 Square Verified
I'm Rain | | Alpha Content |
28 Following
1.1K+ Followers
1.4K+ Liked
Posts
PINNED

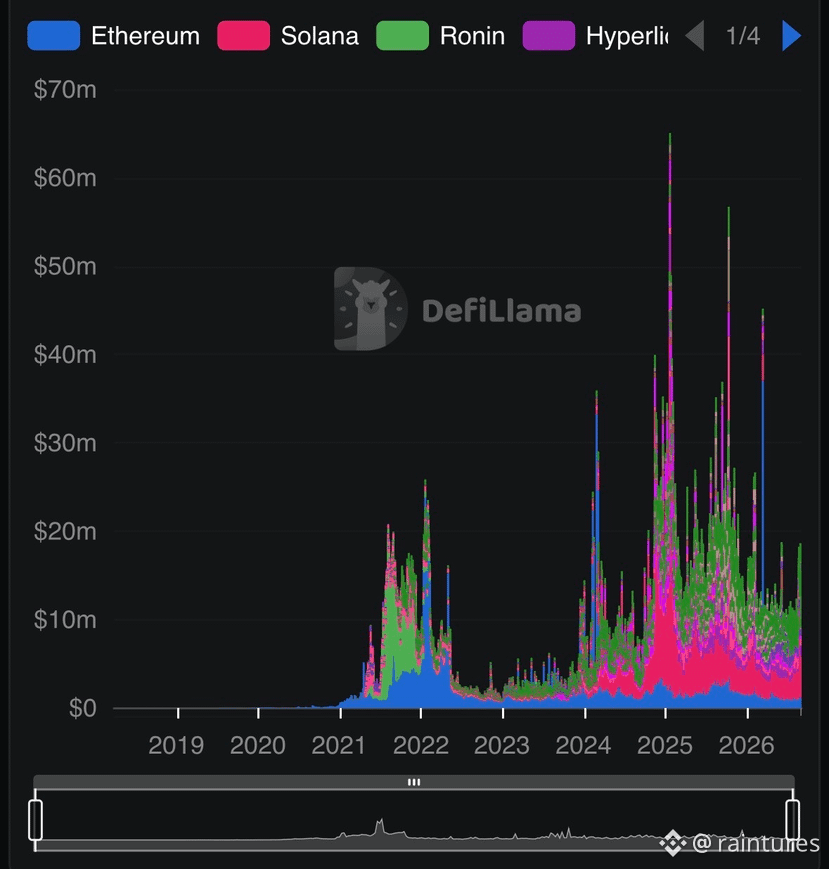
Robinhood chain outearned $ETH in daily app revenue.
$2.66m vs $1.28m, two months after launch.
The number is concrete but it's a 24h snapshot on a metric that already strips stablecoins, liquid staking and gas from the comparison.
Zoom out to 7 days and ethereum's back on top, $11.91m vs $9.34m.
30 days it's not close, $45.8m vs $23.23m.
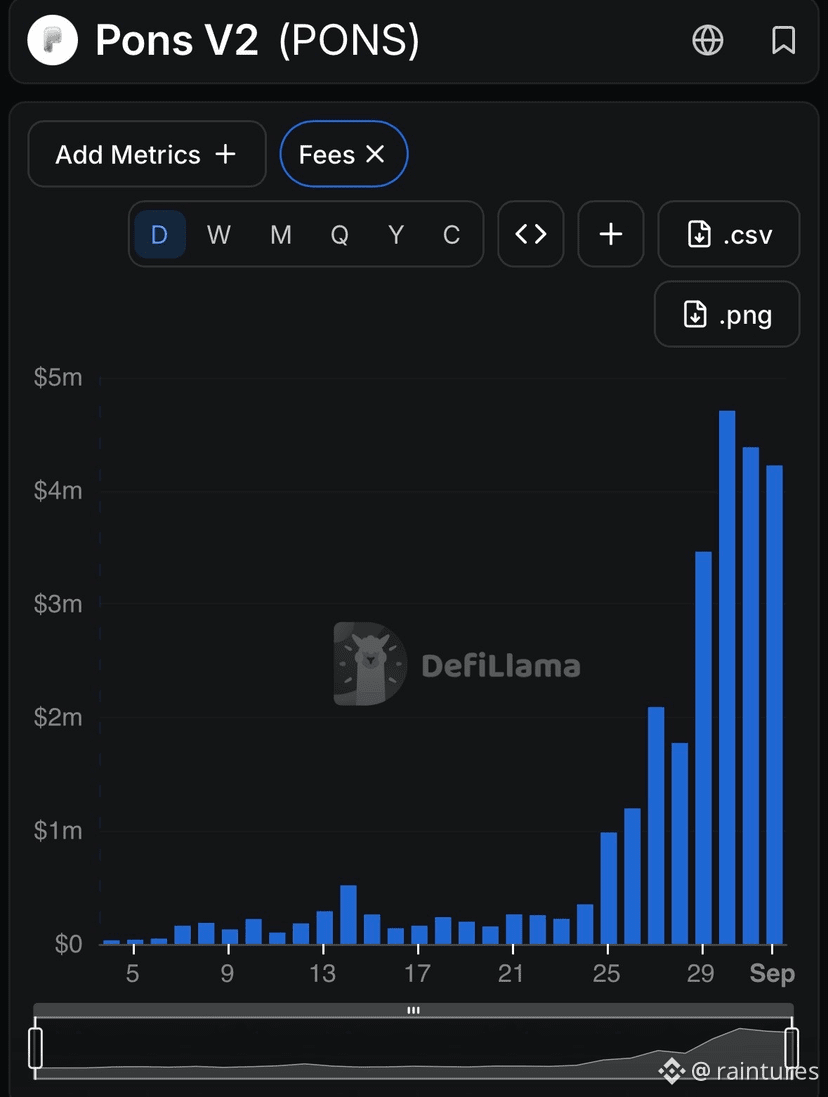
What's actually driving the daily win is pons: a memecoin launchpad that lives only on this chain and pulled $5.34m in fees in 24h on its own, more than double the entire ethereum figure it's being compared against.
Robinhood itself sees none of that app revenue.
It collects gas, $963k over 24h, and even that gets trimmed 10% under the arbitrum expansion program license before it lands.
$2.66m vs $1.28m, two months after launch.
The number is concrete but it's a 24h snapshot on a metric that already strips stablecoins, liquid staking and gas from the comparison.
Zoom out to 7 days and ethereum's back on top, $11.91m vs $9.34m.
30 days it's not close, $45.8m vs $23.23m.
What's actually driving the daily win is pons: a memecoin launchpad that lives only on this chain and pulled $5.34m in fees in 24h on its own, more than double the entire ethereum figure it's being compared against.
Robinhood itself sees none of that app revenue.
It collects gas, $963k over 24h, and even that gets trimmed 10% under the arbitrum expansion program license before it lands.
The ETF data is getting interesting precisely because the headline is stronger than the underlying picture.
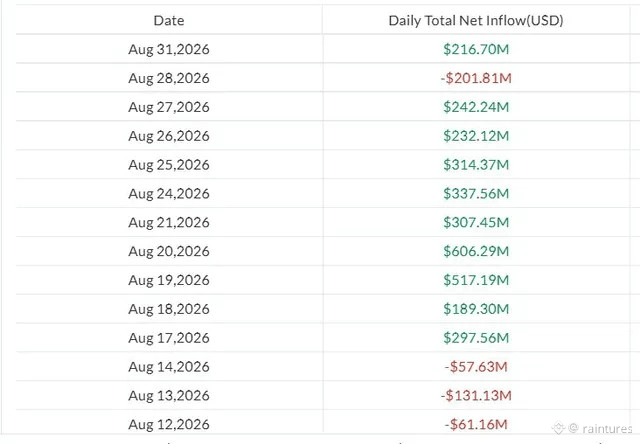
$BTC ETFs took in $216.7M on Monday, but $205.9M came from BlackRock.
That means roughly 95% of the day’s inflows were concentrated in a single fund.
Meanwhile, $ETH has now recorded 11 straight inflow sessions, with $XRP and $SOL at 10.
That broader persistence matters more to me than any single Bitcoin flow figure.
But there is also a divergence worth watching: Solana’s latest inflow dropped to just $925K, down sharply from $18.1M on Friday.
How much of this market strength is broad-based accumulation, and how much is simply a few large funds carrying the tape?
$BTC ETFs took in $216.7M on Monday, but $205.9M came from BlackRock.
That means roughly 95% of the day’s inflows were concentrated in a single fund.
Meanwhile, $ETH has now recorded 11 straight inflow sessions, with $XRP and $SOL at 10.
That broader persistence matters more to me than any single Bitcoin flow figure.
But there is also a divergence worth watching: Solana’s latest inflow dropped to just $925K, down sharply from $18.1M on Friday.
How much of this market strength is broad-based accumulation, and how much is simply a few large funds carrying the tape?
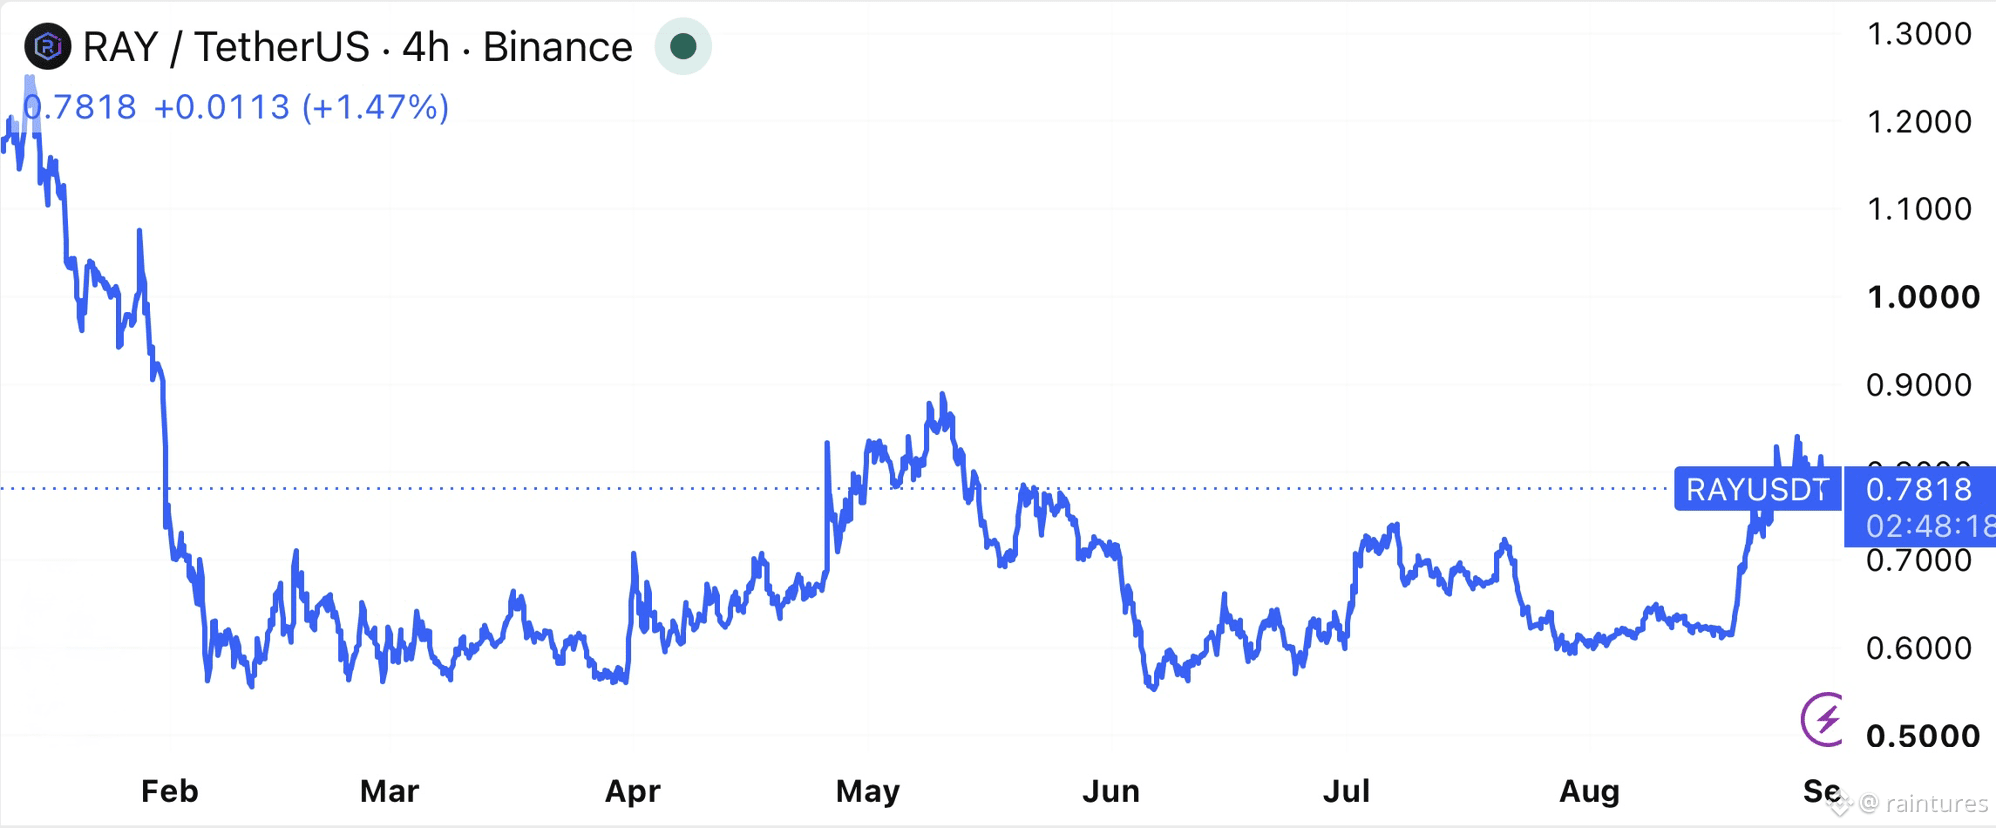
$RAY is cooling down after a powerful breakout
Price recently surged from the $0.59 region to a local high near $0.85 before pulling back toward $0.78. This looks more like a healthy consolidation than a full trend reversal so far.
$RAY remains well above its 30 day and 200 day moving averages, while RSI sits near 65 and keeps momentum in bullish territory. Trading volume has also increased by roughly 88%, showing that market interest is still strong.
The key level to watch now is $0.76. Holding this area could open the door for another test of $0.85. A clean breakout above that resistance may bring $0.90 into focus, while losing $0.76 could lead to a deeper retest near $0.68.
Momentum is strong, but confirmation still matters
Price recently surged from the $0.59 region to a local high near $0.85 before pulling back toward $0.78. This looks more like a healthy consolidation than a full trend reversal so far.
$RAY remains well above its 30 day and 200 day moving averages, while RSI sits near 65 and keeps momentum in bullish territory. Trading volume has also increased by roughly 88%, showing that market interest is still strong.
The key level to watch now is $0.76. Holding this area could open the door for another test of $0.85. A clean breakout above that resistance may bring $0.90 into focus, while losing $0.76 could lead to a deeper retest near $0.68.
Momentum is strong, but confirmation still matters
$BTC is doing something I find more interesting than simply “going up”.
- Oil is repricing geopolitical risk
- Equities are absorbing the shock
- BTC meanwhile, barely flinches
That does not make Bitcoin a safe haven yet.
The sample is too small, and crypto has a long history of breaking its own narratives when conditions get worse.
But the divergence matters.
If BTC keeps holding up while traditional risk markets price in higher geopolitical and energy risk, the correlation story around Bitcoin may be changing in real time.
What happens when the next serious risk-off move hits?
- Oil is repricing geopolitical risk
- Equities are absorbing the shock
- BTC meanwhile, barely flinches
That does not make Bitcoin a safe haven yet.
The sample is too small, and crypto has a long history of breaking its own narratives when conditions get worse.
But the divergence matters.
If BTC keeps holding up while traditional risk markets price in higher geopolitical and energy risk, the correlation story around Bitcoin may be changing in real time.
What happens when the next serious risk-off move hits?
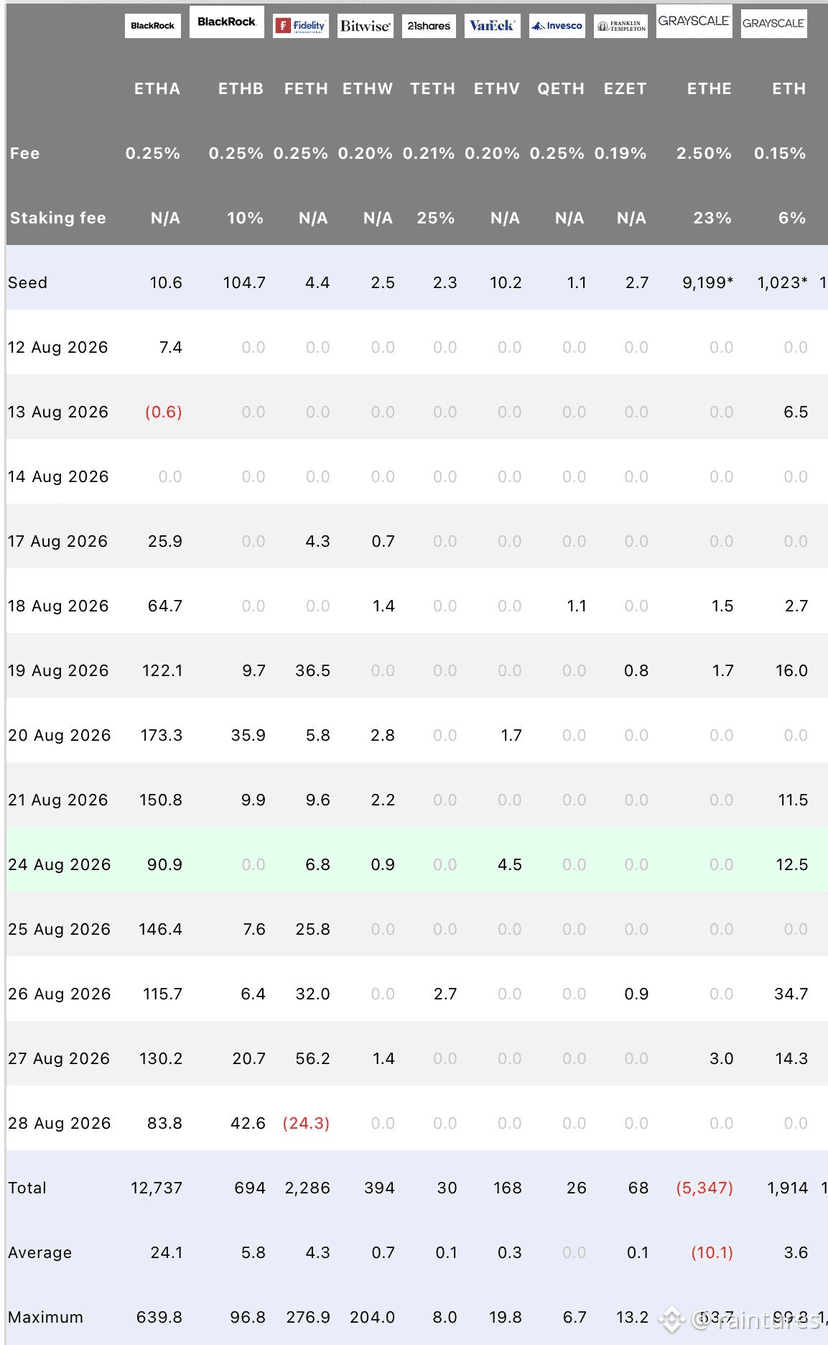
$ETH has a strange problem right now…
The spot demand looks strong, but the price still cannot break free.
ETH has seen 12 straight days of spot ETF inflows, with more than $1.5B entering during the streak.
BlackRock alone accounted for roughly $1B of purchases without a negative day.
Yet on Binance, the taker buy/sell ratio has fallen to 0.81: aggressive market selling is outweighing buying by roughly 23%.
That makes the $2.26K–$2.35K realized-price cluster the level I would watch most closely.
ETH holding above it suggests the market is absorbing that supply.
Losing it while aggressive selling persists would tell a very different story.
For me, $2.53K is the real short-term test. Until ETH clears it convincingly, ETF inflows alone are not enough confirmation that buyers have regained control.
Is ETH quietly absorbing a wall of supply before the next leg higher?
The spot demand looks strong, but the price still cannot break free.
ETH has seen 12 straight days of spot ETF inflows, with more than $1.5B entering during the streak.
BlackRock alone accounted for roughly $1B of purchases without a negative day.
Yet on Binance, the taker buy/sell ratio has fallen to 0.81: aggressive market selling is outweighing buying by roughly 23%.
That makes the $2.26K–$2.35K realized-price cluster the level I would watch most closely.
ETH holding above it suggests the market is absorbing that supply.
Losing it while aggressive selling persists would tell a very different story.
For me, $2.53K is the real short-term test. Until ETH clears it convincingly, ETF inflows alone are not enough confirmation that buyers have regained control.
Is ETH quietly absorbing a wall of supply before the next leg higher?
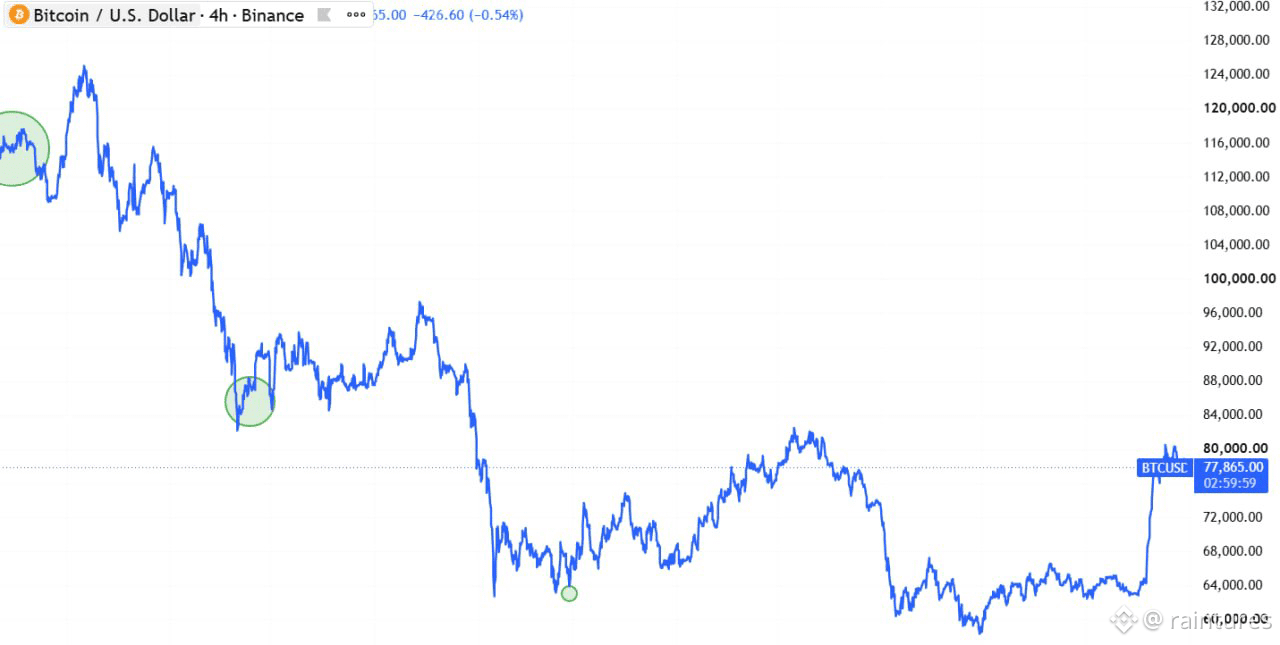
Bitcoin’s pullback matters less than what is happening underneath it.
$BTC pushed above $81K before falling back below $78K after Jackson Hole, with a more hawkish Fed message putting pressure on risk assets.
But I think the more interesting signal is the divergence between short-term price action and the structural developments underneath it.
Meanwhile, traditional finance keeps moving deeper into crypto infrastructure: SBI is investing $270M into Ajaib, Visa is expanding stablecoin payment initiatives in Korea, and BitGo is acquiring NYDIG’s trading business.
So while the market is reacting to rates and taking profits, the institutional build-out continues in the background.
Are we focusing too much on this week’s price action while missing where the underlying infrastructure is heading?
$BTC pushed above $81K before falling back below $78K after Jackson Hole, with a more hawkish Fed message putting pressure on risk assets.
But I think the more interesting signal is the divergence between short-term price action and the structural developments underneath it.
Meanwhile, traditional finance keeps moving deeper into crypto infrastructure: SBI is investing $270M into Ajaib, Visa is expanding stablecoin payment initiatives in Korea, and BitGo is acquiring NYDIG’s trading business.
So while the market is reacting to rates and taking profits, the institutional build-out continues in the background.
Are we focusing too much on this week’s price action while missing where the underlying infrastructure is heading?
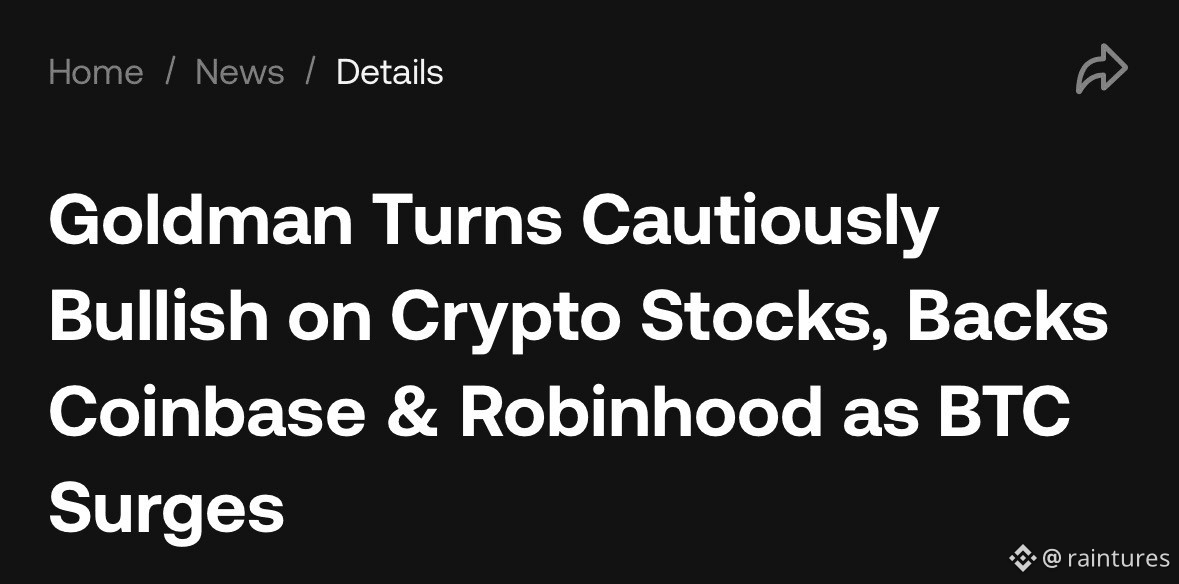
Goldman Sachs tuned cautiously bullish on crypto stocks for H2 as $BTC and alts rise.
According to their latest research crypto trading volumes fell 30% in July and another 21% in August, extending the contraction beyond previous cycles.
Yet market cap has rebounded roughly 21% to $2.8T in just a week, while total trading activity remains around 75% below its peak.
This divergence is the key.
If market cap can hold these levels, Goldman sees room for volumes to catch up as the institutional picture is changing too:
- 35% of institutions still cite regulation as the biggest barrier
- 32% see regulatory clarity as the main catalyst for adoption
According to their latest research crypto trading volumes fell 30% in July and another 21% in August, extending the contraction beyond previous cycles.
Yet market cap has rebounded roughly 21% to $2.8T in just a week, while total trading activity remains around 75% below its peak.
This divergence is the key.
If market cap can hold these levels, Goldman sees room for volumes to catch up as the institutional picture is changing too:
- 35% of institutions still cite regulation as the biggest barrier
- 32% see regulatory clarity as the main catalyst for adoption
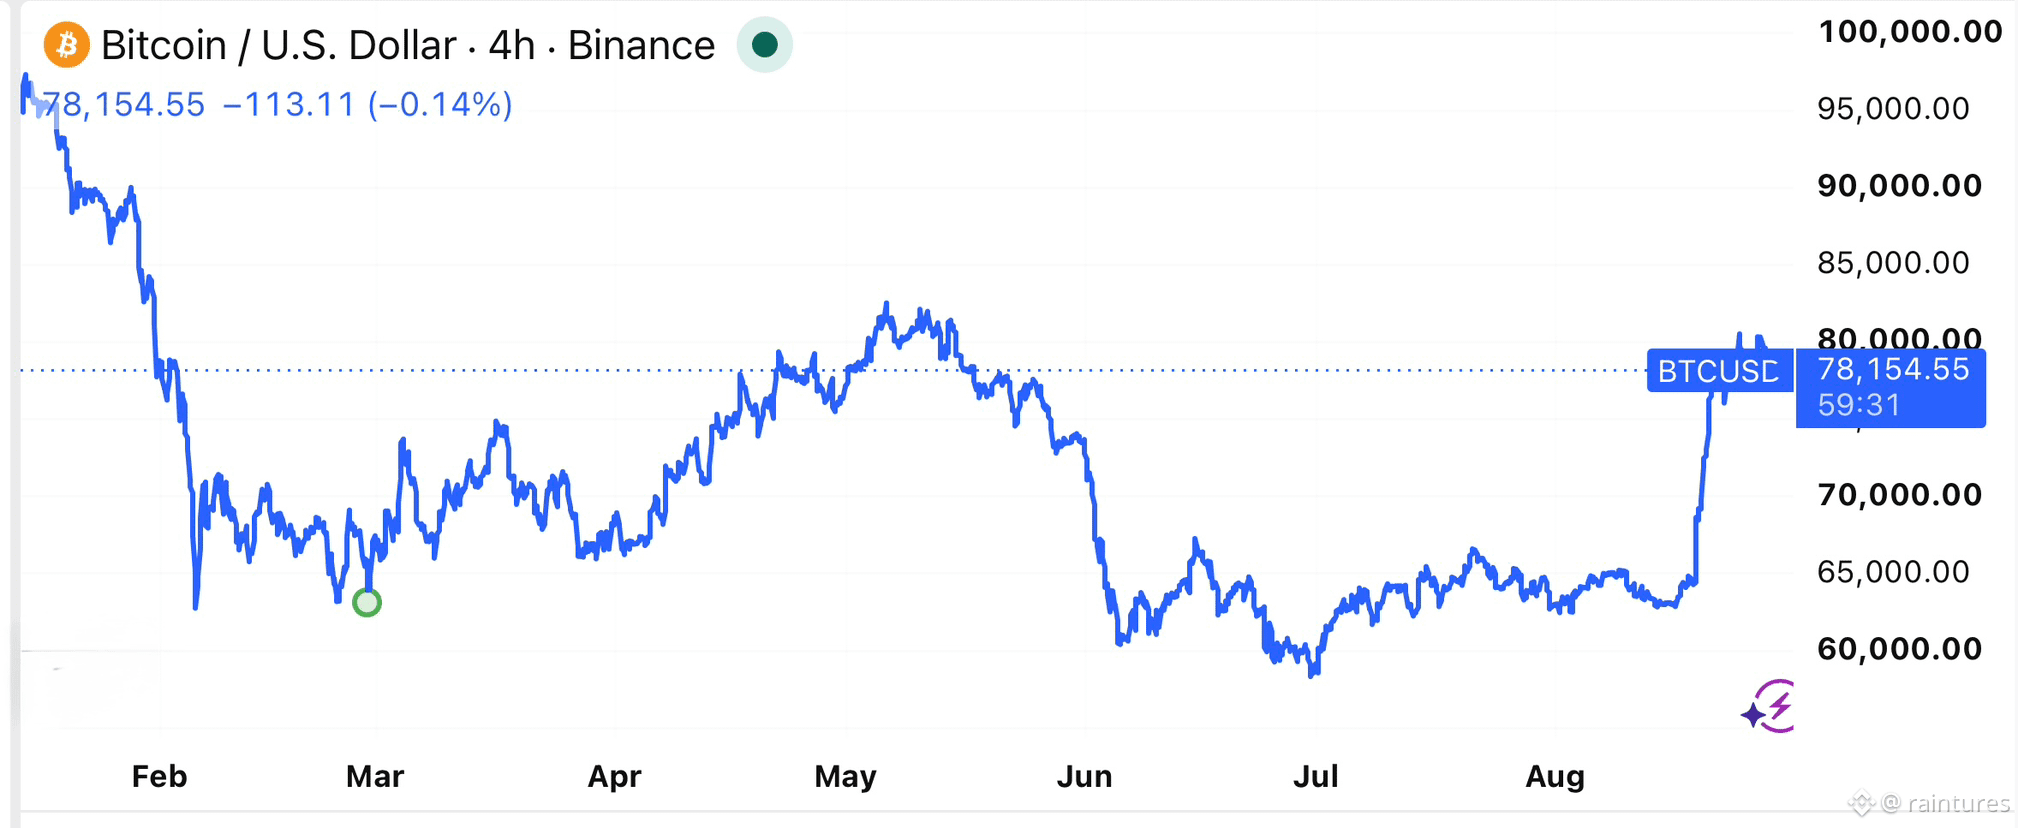
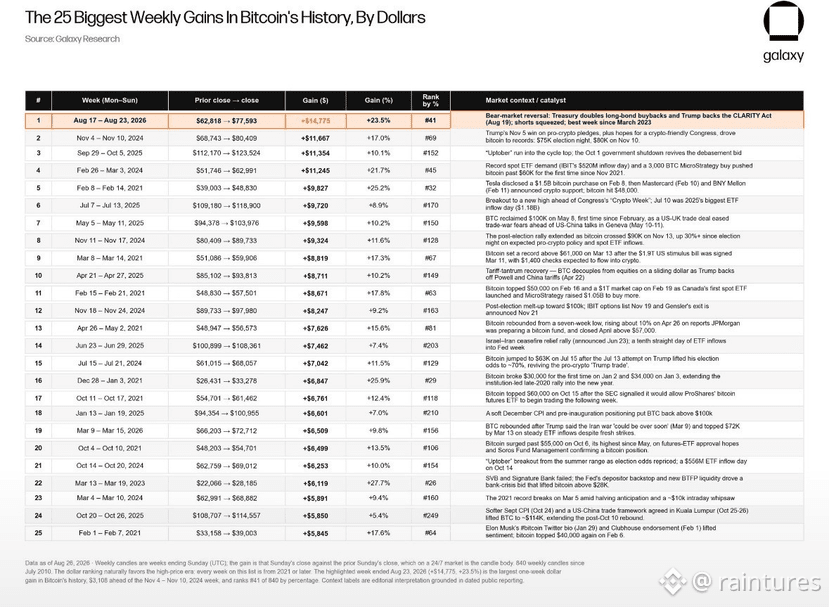
$BTC added $14,775 in seven days, closing at $77,593 after a 23.5% weekly gain.
By percentage, it was Bitcoin’s strongest week since March 2023.
Several forces hit at once: the Treasury increased long-duration bond buybacks, Trump pushed for the CLARITY Act, and roughly $2.7B in crypto shorts were liquidated.
But ETF flows give the move more substance.
US spot Bitcoin ETFs recorded their strongest weekly inflows since October 2025.
That is important because ETF demand had been a persistent drag on Bitcoin throughout much of 2026.
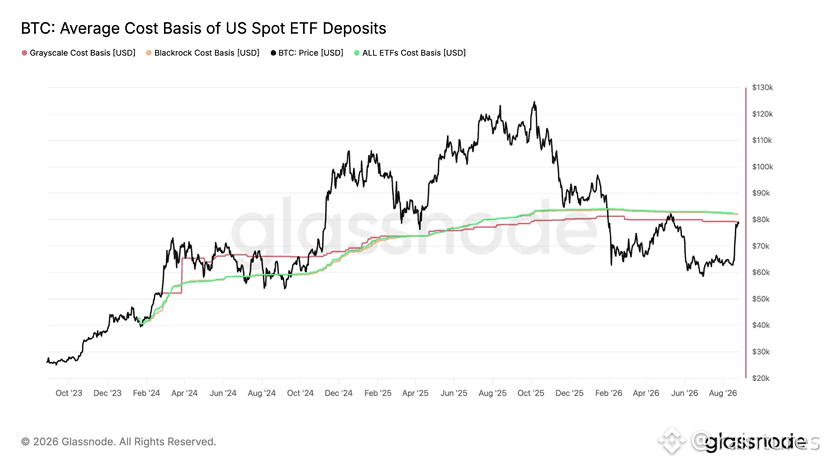
There’s still a catch: ETF holders have an estimated average cost of $84,029, meaning the group remains underwater around current prices.
For me, September becomes the real test.
Can ETF demand keep absorbing supply after the short squeeze is gone?
By percentage, it was Bitcoin’s strongest week since March 2023.
Several forces hit at once: the Treasury increased long-duration bond buybacks, Trump pushed for the CLARITY Act, and roughly $2.7B in crypto shorts were liquidated.
But ETF flows give the move more substance.
US spot Bitcoin ETFs recorded their strongest weekly inflows since October 2025.
That is important because ETF demand had been a persistent drag on Bitcoin throughout much of 2026.
There’s still a catch: ETF holders have an estimated average cost of $84,029, meaning the group remains underwater around current prices.
For me, September becomes the real test.
Can ETF demand keep absorbing supply after the short squeeze is gone?
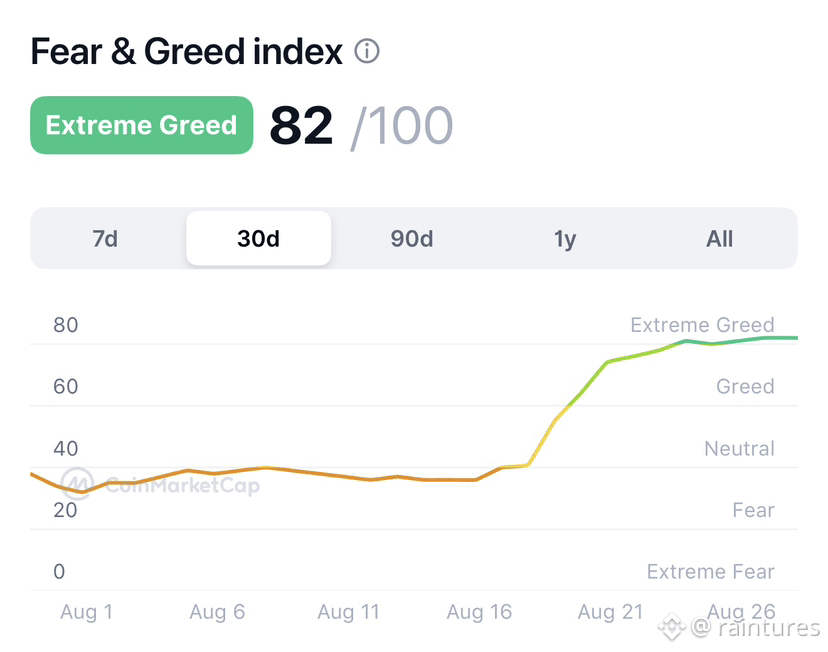
Extreme greed is back. Is the top already in?
The Crypto Fear and Greed Index just hit 82 as $BTC reclaimed $80K. Some see a local top, but strong bull markets can stay overheated much longer than expected
Greed is a warning, not a sell signal
The Crypto Fear and Greed Index just hit 82 as $BTC reclaimed $80K. Some see a local top, but strong bull markets can stay overheated much longer than expected
Greed is a warning, not a sell signal
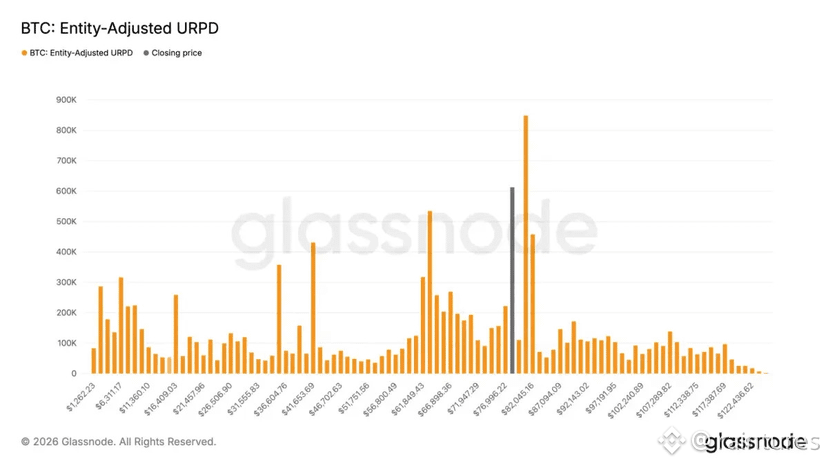
$BTC biggest test is right where everyone is watching: $80K.
Around 5% of BTC supply is concentrated at $80K, while roughly 8% sits between $80K–$82K.
The largest supply wall at any comparable range.
What makes it more interesting is that U.S. spot ETF holders also have an average cost basis around $80K–$82K.
So if BTC pushes into this zone, I’d expect a meaningful battle between holders looking to break even and buyers willing to absorb that supply.
The technical picture adds another layer: the 50-week moving average is around $81,081, and BTC has been below it since November 2025.
Historically, reclaiming this trend line has mattered.
BTC moved back above it in May 2020 and March 2023, with both recoveries preceding much larger upside moves.
If BTC reclaims $82K decisively, does that change the market structure enough to open the door for the next major leg higher?
Around 5% of BTC supply is concentrated at $80K, while roughly 8% sits between $80K–$82K.
The largest supply wall at any comparable range.
What makes it more interesting is that U.S. spot ETF holders also have an average cost basis around $80K–$82K.
So if BTC pushes into this zone, I’d expect a meaningful battle between holders looking to break even and buyers willing to absorb that supply.
The technical picture adds another layer: the 50-week moving average is around $81,081, and BTC has been below it since November 2025.
Historically, reclaiming this trend line has mattered.
BTC moved back above it in May 2020 and March 2023, with both recoveries preceding much larger upside moves.
If BTC reclaims $82K decisively, does that change the market structure enough to open the door for the next major leg higher?
Onchain data explains why $BTC can touch $80k but the hard part is staying there.
All major holder cohorts are now sitting in aggregate profit, which creates a much larger pool of potential sellers.
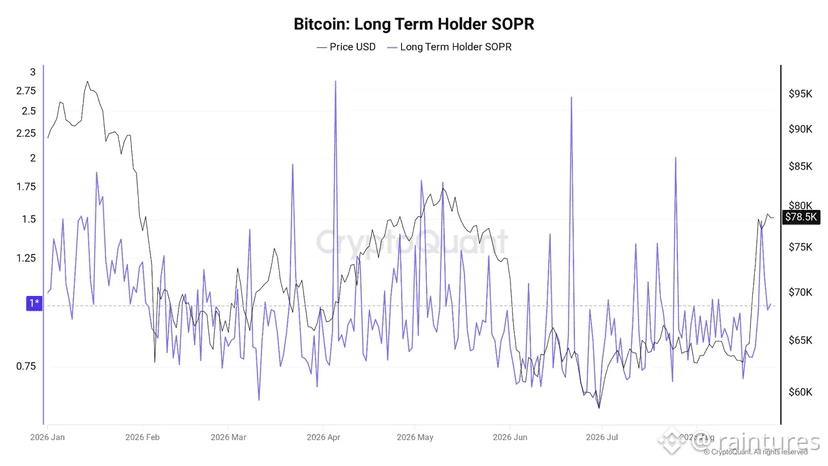
Long-term holder SOPR jumped to 1.48, while short-term holders are now realizing profits at a faster rate.
At the same time, the Coinbase premium remains negative at -0.015.
It suggests US spot demand still hasn’t fully returned, even after BTC’s 25%+ weekly move.
So the key variable now is whether fresh demand can absorb the BTC being sold by profitable holders.
If ETF inflows continue while the Coinbase premium turns sustainably positive, the structure changes quite a bit.
$80K is the headline level. Is new demand strong enough to turn it into support
All major holder cohorts are now sitting in aggregate profit, which creates a much larger pool of potential sellers.
Long-term holder SOPR jumped to 1.48, while short-term holders are now realizing profits at a faster rate.
At the same time, the Coinbase premium remains negative at -0.015.
It suggests US spot demand still hasn’t fully returned, even after BTC’s 25%+ weekly move.
So the key variable now is whether fresh demand can absorb the BTC being sold by profitable holders.
If ETF inflows continue while the Coinbase premium turns sustainably positive, the structure changes quite a bit.
$80K is the headline level. Is new demand strong enough to turn it into support
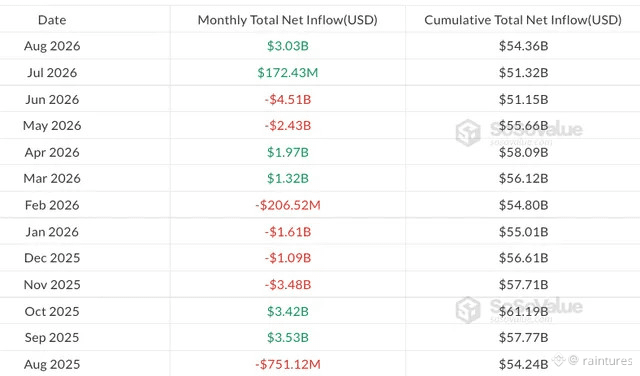
Bitcoin ETF flows are finally starting to tell a different story in 2026.
US spot $BTC ETFs just posted their 7th consecutive day of inflows, adding another $314M on Tuesday.
August inflows have now reached $3.03B, leaving the month only $390M short of October 2025’s total with four sessions still left.
More importantly, the rebound has cut the 2026 net outflow deficit by more than half, from much deeper levels to around $2.26B.
Total ETF assets are now back above $99B, while $ETH ETFs are also showing strong demand, with roughly $1B of inflows over the same seven-day streak.
If ETF flows keep accelerating even through pullbacks, how much further can recovery run?
US spot $BTC ETFs just posted their 7th consecutive day of inflows, adding another $314M on Tuesday.
August inflows have now reached $3.03B, leaving the month only $390M short of October 2025’s total with four sessions still left.
More importantly, the rebound has cut the 2026 net outflow deficit by more than half, from much deeper levels to around $2.26B.
Total ETF assets are now back above $99B, while $ETH ETFs are also showing strong demand, with roughly $1B of inflows over the same seven-day streak.
If ETF flows keep accelerating even through pullbacks, how much further can recovery run?
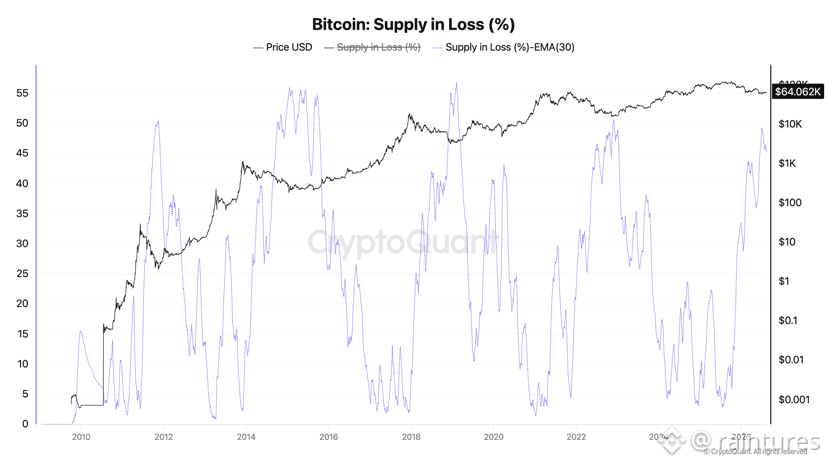
Nearly half of $BTC supply is underwater now.
Around 45–46% of BTC sits at an unrealized loss, a zone historically associated with deep bear-market stress rather than cycle tops.
But price still trades below the 20D and 50D EMAs, with $61K–$62K acting as the line I’d watch.
To me, that creates a strange setup: onchain pain already looks advanced, while the chart still leaves room for another leg lower toward the low-$50Ks if support fails.
How much more selling can the market absorb before loss turns into capitulation?
Around 45–46% of BTC sits at an unrealized loss, a zone historically associated with deep bear-market stress rather than cycle tops.
But price still trades below the 20D and 50D EMAs, with $61K–$62K acting as the line I’d watch.
To me, that creates a strange setup: onchain pain already looks advanced, while the chart still leaves room for another leg lower toward the low-$50Ks if support fails.
How much more selling can the market absorb before loss turns into capitulation?
$84.6M in short liquidations sit less than 4% above where $BTC is trading right now.
That's the part of this hyperliquid standoff that gets buried under the headline framing.
Yes, short notional outweighs long notional by roughly 60%, four whale addresses are carrying $249.4m in short exposure against two addresses holding $99m long.
And yes, btc is down 20.6% over 90 days while the s&p climbed 4.8% and euro stoxx put up 12.5%. on paper that reads as bears in control.
But look at where the liquidation prices actually sit.
The shorts cluster between $64,600 and $66,545, some running 40x leverage, barely above spot. the longs don't liquidate until $61,200 to $61,831, a much wider cushion.
That’s an asymmetric setup: a small push up unwinds a quarter billion in shorts fast, a much larger drop is needed to touch the longs at all.
Positioning looks bearish but liquidation geometry looks like a coiled spring pointed the other way.
Which one actually moves price first here?
That's the part of this hyperliquid standoff that gets buried under the headline framing.
Yes, short notional outweighs long notional by roughly 60%, four whale addresses are carrying $249.4m in short exposure against two addresses holding $99m long.
And yes, btc is down 20.6% over 90 days while the s&p climbed 4.8% and euro stoxx put up 12.5%. on paper that reads as bears in control.
But look at where the liquidation prices actually sit.
The shorts cluster between $64,600 and $66,545, some running 40x leverage, barely above spot. the longs don't liquidate until $61,200 to $61,831, a much wider cushion.
That’s an asymmetric setup: a small push up unwinds a quarter billion in shorts fast, a much larger drop is needed to touch the longs at all.
Positioning looks bearish but liquidation geometry looks like a coiled spring pointed the other way.
Which one actually moves price first here?
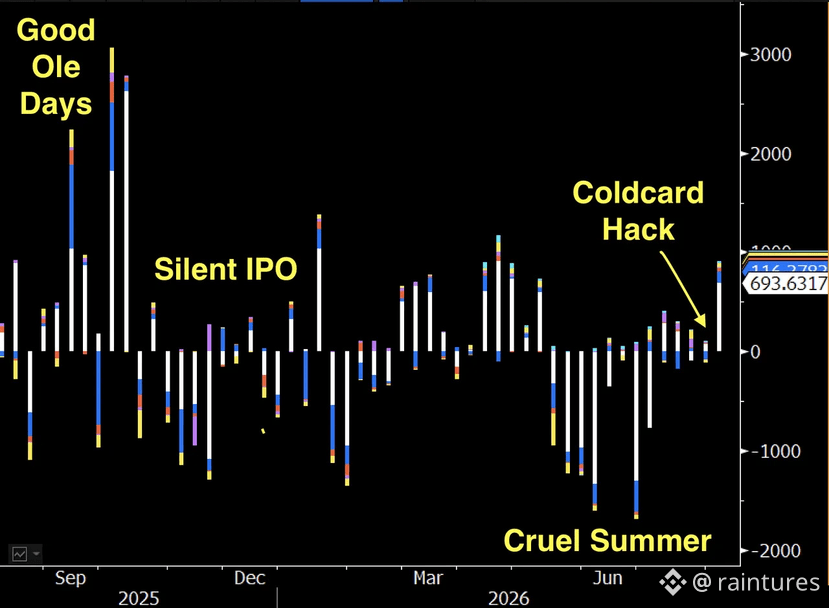
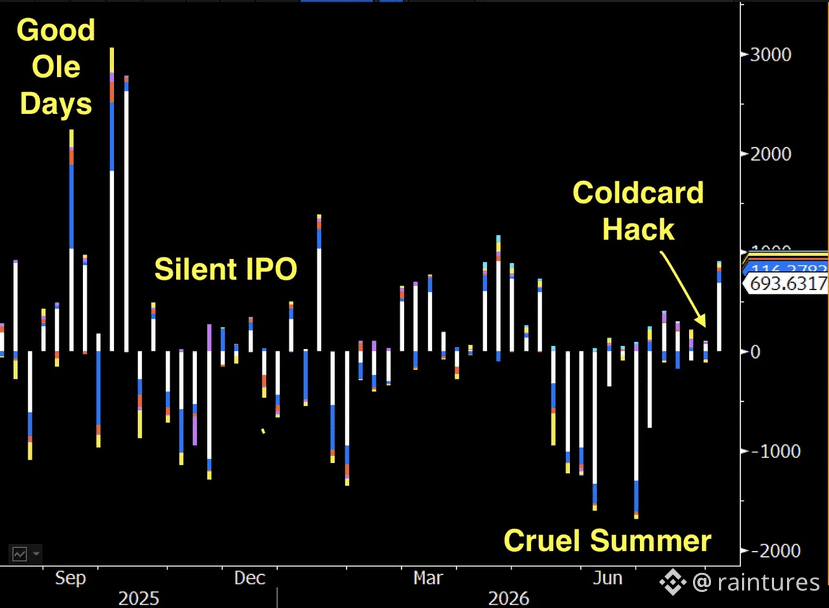
The $1B week matters more because of what came before it.
US spot $BTC ETFs posted their strongest weekly inflows since April and their third-best week since last October.
After months of inconsistent demand, institutional flows suddenly have some weight again.
What I find interesting is the timing. Bitcoin has spent months absorbing distribution from older holders without getting the price expansion those inflows would normally suggest.
If that supply overhang is thinning while ETF demand starts accelerating again, the same $1B of buying can have a very different effect on price.
There’s also the Coldcard angle.
I wouldn’t claim the $116M exploit caused these flows, but repeated self-custody failures could gradually make ETFs more attractive to investors who want BTC exposure without handling key security themselves.
The number I’m watching now goes beyond this week’s $1B.
It’s whether another few weeks confirm that institutional demand has actually changed direction.
How much sell-side absorption is left before those ETF flows finally start showing up in price?
US spot $BTC ETFs posted their strongest weekly inflows since April and their third-best week since last October.
After months of inconsistent demand, institutional flows suddenly have some weight again.
What I find interesting is the timing. Bitcoin has spent months absorbing distribution from older holders without getting the price expansion those inflows would normally suggest.
If that supply overhang is thinning while ETF demand starts accelerating again, the same $1B of buying can have a very different effect on price.
There’s also the Coldcard angle.
I wouldn’t claim the $116M exploit caused these flows, but repeated self-custody failures could gradually make ETFs more attractive to investors who want BTC exposure without handling key security themselves.
The number I’m watching now goes beyond this week’s $1B.
It’s whether another few weeks confirm that institutional demand has actually changed direction.
How much sell-side absorption is left before those ETF flows finally start showing up in price?
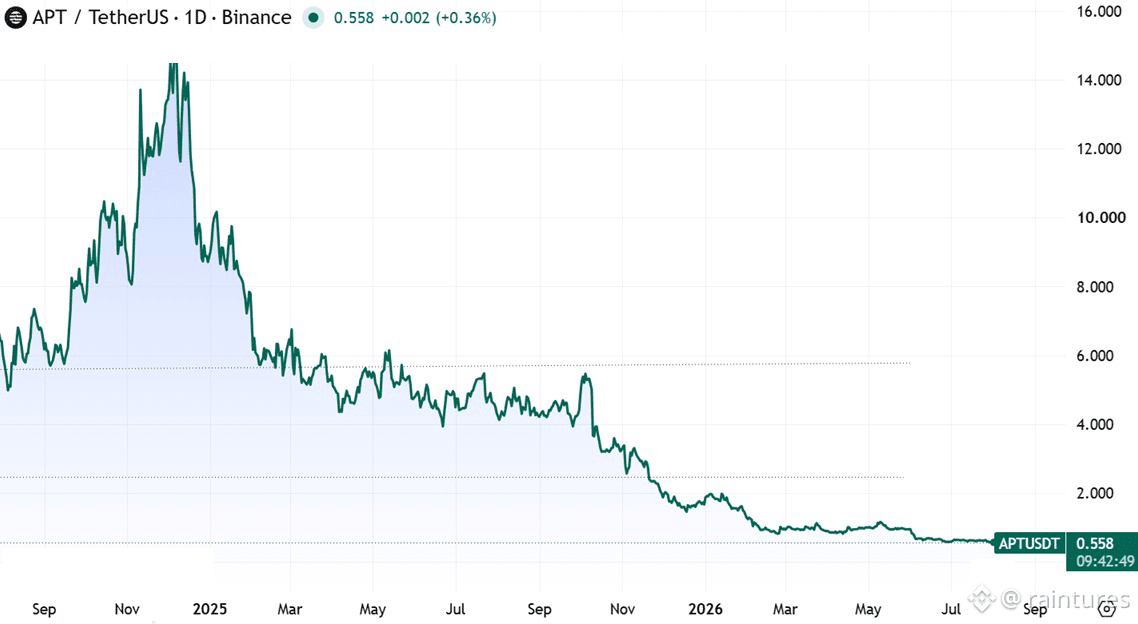
$APT has been chopping in 0.55/0.60 range for weeks while the market's attention drifted.
That kind of tight, low volatility consolidation after a run usually reads as accumulation.
Meanwhile the build never stopped on Aptos
Confidential apt went live on mainnet in april, giving the chain native private transactions.
Mastercard signed on for real world payment rails.
X chain accounts now let sui, solana and ethereum wallets interact with aptos directly through derived account abstraction.
Chainspect clocked over 4.5 billion cumulative transactions, roughly one for every other person on earth.
Price is quiet but roadmap is not.
Ranges like this tend to resolve once the market catches up to what's actually shipping.
Not financial advice, watching the chart and the changelog side by side and liking what I see.
#APTOS #APT
That kind of tight, low volatility consolidation after a run usually reads as accumulation.
Meanwhile the build never stopped on Aptos
Confidential apt went live on mainnet in april, giving the chain native private transactions.
Mastercard signed on for real world payment rails.
X chain accounts now let sui, solana and ethereum wallets interact with aptos directly through derived account abstraction.
Chainspect clocked over 4.5 billion cumulative transactions, roughly one for every other person on earth.
Price is quiet but roadmap is not.
Ranges like this tend to resolve once the market catches up to what's actually shipping.
Not financial advice, watching the chart and the changelog side by side and liking what I see.
#APTOS #APT
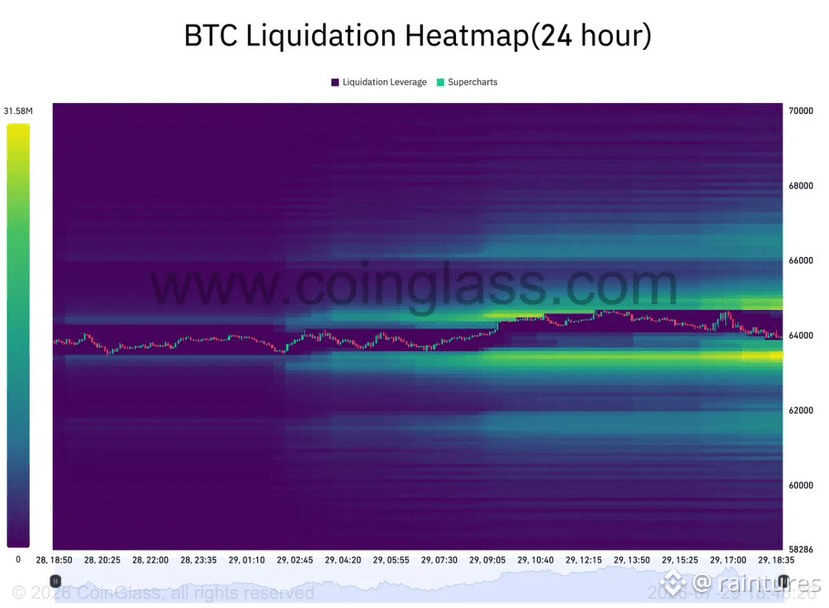
The market has plenty of narratives. Conviction remains the missing piece.
$BTC continues to trade around $64K while markets digest one of the most divided FOMC meetings in recent memory, higher oil prices and renewed weakness across tech equities.
What caught my attention goes beyond price action.
Spot volumes have fallen to their lowest level since mid-2023, CME open interest remains subdued, and perpetual positioning has largely stalled.
When participation looks this light, macro headlines tend to move markets more than usual because there are fewer strong positions absorbing the flow.
Will tonight’s Fed decision finally bring fresh conviction, or simply reinforce the range traders have been stuck in?
$BTC continues to trade around $64K while markets digest one of the most divided FOMC meetings in recent memory, higher oil prices and renewed weakness across tech equities.
What caught my attention goes beyond price action.
Spot volumes have fallen to their lowest level since mid-2023, CME open interest remains subdued, and perpetual positioning has largely stalled.
When participation looks this light, macro headlines tend to move markets more than usual because there are fewer strong positions absorbing the flow.
Will tonight’s Fed decision finally bring fresh conviction, or simply reinforce the range traders have been stuck in?
Everything is waiting for tonight’s Fed decision.
The Nasdaq is heading for a sixth straight red session, Treasury yields remain around 4.6%, and crypto isn’t acting as a hedge.
$BTC is hovering near $64K while $ETH is giving back part of July’s strong gains.
To me, today’s price action feels less about crypto-specific narratives and more about macro uncertainty.
Between the Fed, Powell’s comments and earnings from Meta and Microsoft, there’s little incentive for markets to take aggressive risk beforehand.
When macro events dominate the tape like this, how much attention should we really pay to short-term crypto price moves?
The Nasdaq is heading for a sixth straight red session, Treasury yields remain around 4.6%, and crypto isn’t acting as a hedge.
$BTC is hovering near $64K while $ETH is giving back part of July’s strong gains.
To me, today’s price action feels less about crypto-specific narratives and more about macro uncertainty.
Between the Fed, Powell’s comments and earnings from Meta and Microsoft, there’s little incentive for markets to take aggressive risk beforehand.
When macro events dominate the tape like this, how much attention should we really pay to short-term crypto price moves?
$ETH is starting to separate from $BTC again.
And corporate balance sheets are reinforcing the move.
Bitmine added nearly 10,000 ETH last week, taking its treasury to 5.79M ETH: roughly 4.8% of supply.
About 85% is already staked, with projected annualized rewards near $299M once deployment is complete.
At the same time, ETH gained ~2.4% over the week while BTC slipped ~0.7%, pushing ETH/BTC to a three-month high.
What I find more interesting is the divergence in corporate strategy: Bitmine is still accumulating aggressively, while Strategy has paused BTC purchases and raised its dollar reserve to $3.75B.
If this gap in treasury behavior persists, does ETH start attracting a different class of corporate allocator than Bitcoin?
And corporate balance sheets are reinforcing the move.
Bitmine added nearly 10,000 ETH last week, taking its treasury to 5.79M ETH: roughly 4.8% of supply.
About 85% is already staked, with projected annualized rewards near $299M once deployment is complete.
At the same time, ETH gained ~2.4% over the week while BTC slipped ~0.7%, pushing ETH/BTC to a three-month high.
What I find more interesting is the divergence in corporate strategy: Bitmine is still accumulating aggressively, while Strategy has paused BTC purchases and raised its dollar reserve to $3.75B.
If this gap in treasury behavior persists, does ETH start attracting a different class of corporate allocator than Bitcoin?
Log in to explore more content