
PB2111
19 Posts

PB2111
Report
Block User
trader, investor
High-Frequency Trader
5.7 Years
8 Following
6 Followers
8 Liked
Posts
All
Quotes
·
--
BTC at $59,300: Midday rebound loses steam despite funding just turning positive
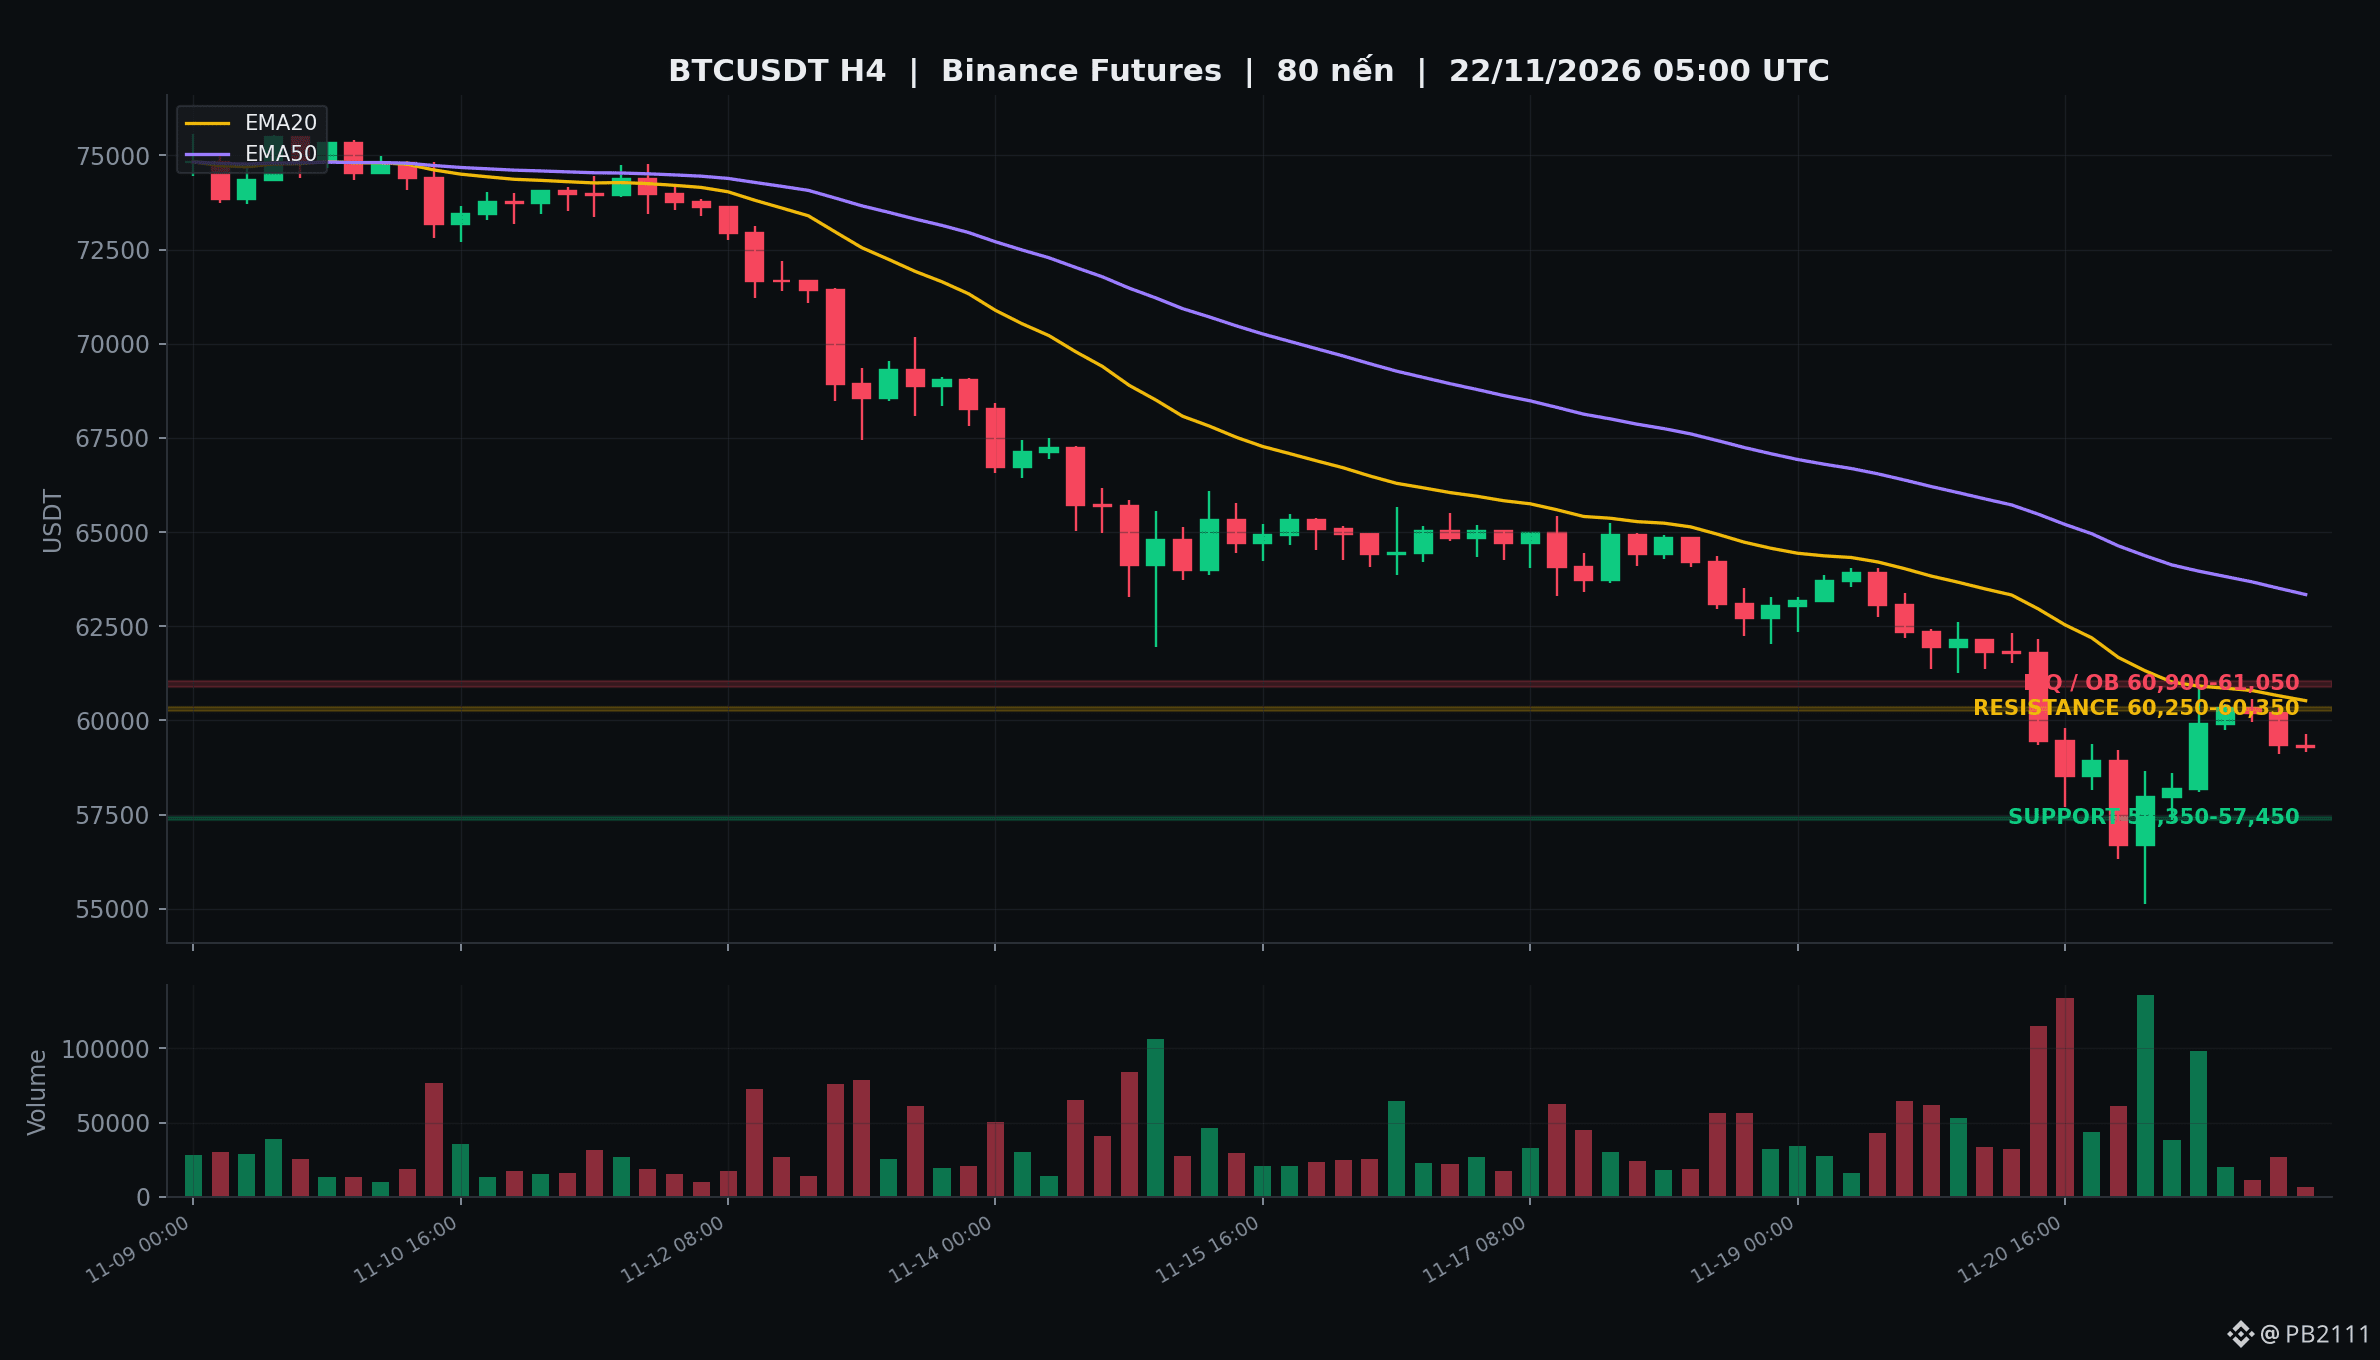
As of 12:00, $BTC was trading around $59,307.80, up 5.4% over 24 hours but down about $858 from the $60,165.80 recorded at 08:00. $ETH was at $1,663.94, up 6.6%, also edging down from $1,682.77. The Fear & Greed Index remained at 11, in the extreme fear zone.
The rebound from the two-year low of $55,127 is losing steam mid-session. According to a report from CryptoQuant, investors realized more than $11.3 billion in losses over seven days, around eight times the gains realized over the same period; QCP Capital believes this was mainly short-covering, not necessarily fresh buying demand. Spot BTC ETFs continued to see net outflows for a third consecutive session, at around $582 million per session, according to SoSoValue.
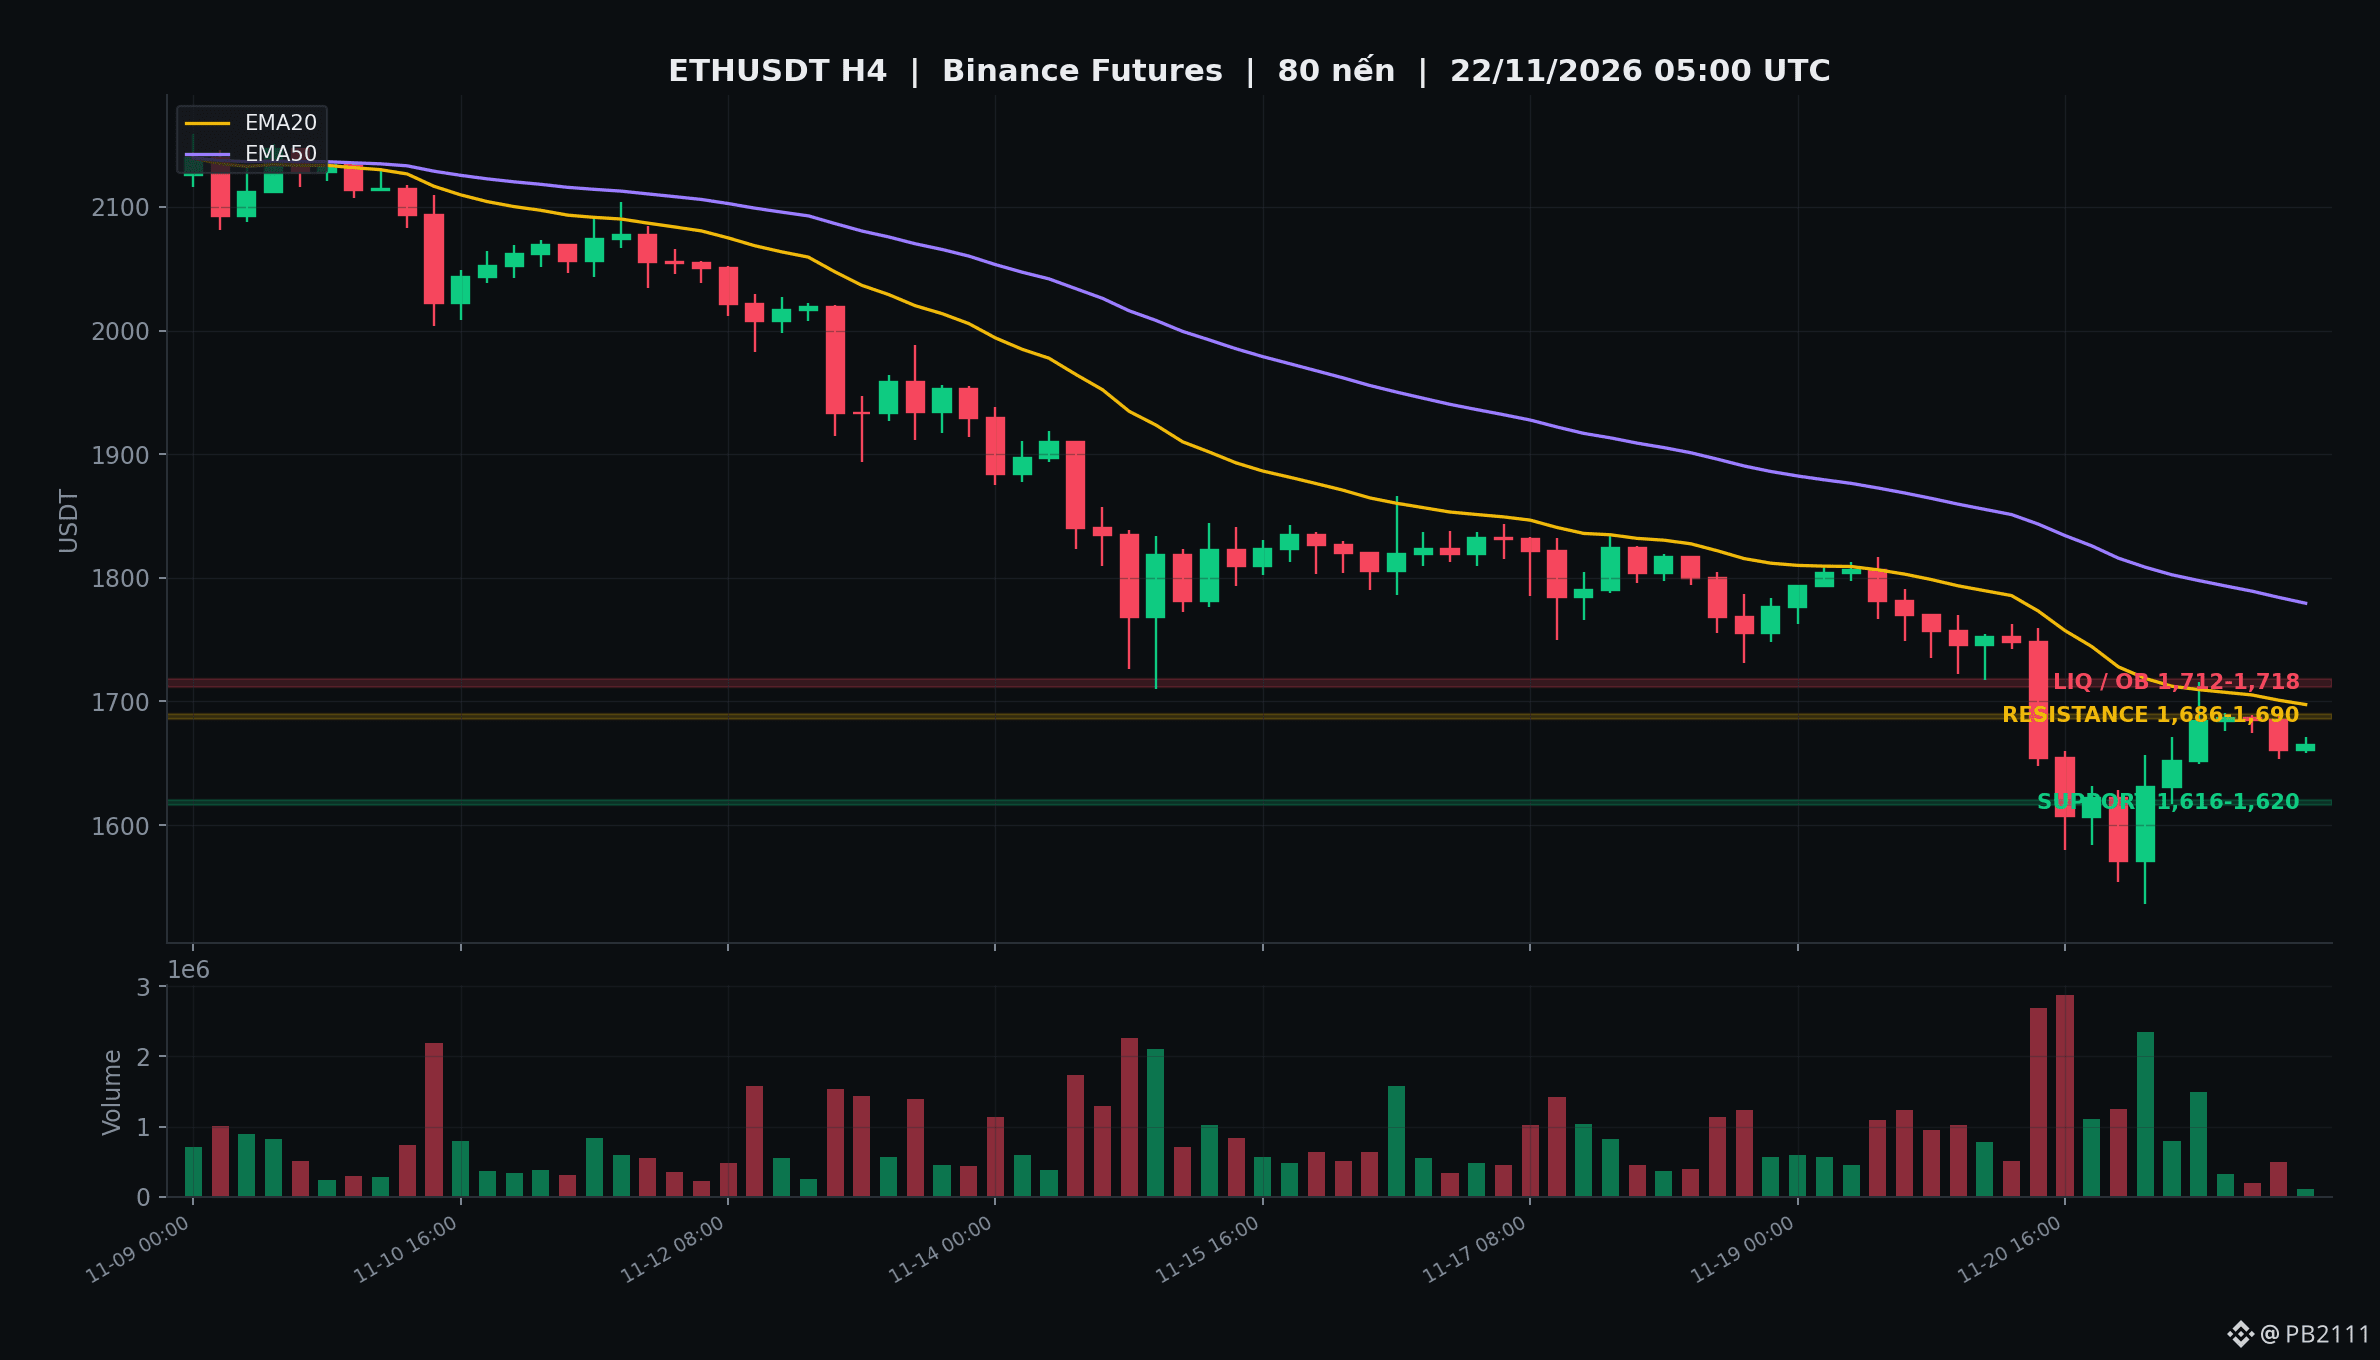
For BTC, 8-hour funding flipped from -0.0010% this morning to +0.0070%, with OI at 91,338 BTC. A notable signal is that the cost of holding positions has turned positive again. If support at 57,350–57,450 holds, the recovery structure remains intact; resistance at 60,250–60,350 coincides with the 60,978 high, with liquidity above at 60,900–61,050. For ETH, funding is +0.0003%, OI is around 2.32 million ETH, support is at 1,616–1,620, resistance at 1,686–1,690, and liquidity at 1,712–1,718.
Attached are H4 charts for BTCUSDT and ETHUSDT: EMA20/50, volume, the support zones at 57,350–57,450 (1,616–1,620 for ETH), resistance at 60,250–60,350 (1,686–1,690), and liquidity at 60,900–61,050 (1,712–1,718) are all clearly shown on the H4 timeframe.
Hold scenario: If BTC holds 57,350–57,450, it still has room to move toward 60,250–60,350. Breakdown scenario: A drop below 57,350 could lead to a retest of the 55,127 low; if ETH falls below 1,616, it could return to 1,543.
As long as ETF flows remain net negative, the recovery is still vulnerable to breaking down. Which scenario do you lean toward: holding or breaking down? $BTC $ETH #Bitcoin #Crypto #MarketAnalysis
BTC at $59,300: Midday rebound loses steam despite funding just turning positive
As of 12:00, $BTC was trading around $59,307.80, up 5.4% over 24 hours but down about $858 from the $60,165.80 recorded at 08:00. $ETH was at $1,663.94, up 6.6%, also edging down from $1,682.77. The Fear & Greed Index remained at 11, in the extreme fear zone.
The rebound from the two-year low of $55,127 is losing steam mid-session. According to a report from CryptoQuant, investors realized more than $11.3 billion in losses over seven days, around eight times the gains realized over the same period; QCP Capital believes this was mainly short-covering, not necessarily fresh buying demand. Spot BTC ETFs continued to see net outflows for a third consecutive session, at around $582 million per session, according to SoSoValue.
For BTC, 8-hour funding flipped from -0.0010% this morning to +0.0070%, with OI at 91,338 BTC. A notable signal is that the cost of holding positions has turned positive again. If support at 57,350–57,450 holds, the recovery structure remains intact; resistance at 60,250–60,350 coincides with the 60,978 high, with liquidity above at 60,900–61,050. For ETH, funding is +0.0003%, OI is around 2.32 million ETH, support is at 1,616–1,620, resistance at 1,686–1,690, and liquidity at 1,712–1,718.
Attached are H4 charts for BTCUSDT and ETHUSDT: EMA20/50, volume, the support zones at 57,350–57,450 (1,616–1,620 for ETH), resistance at 60,250–60,350 (1,686–1,690), and liquidity at 60,900–61,050 (1,712–1,718) are all clearly shown on the H4 timeframe.
Hold scenario: If BTC holds 57,350–57,450, it still has room to move toward 60,250–60,350. Breakdown scenario: A drop below 57,350 could lead to a retest of the 55,127 low; if ETH falls below 1,616, it could return to 1,543.
As long as ETF flows remain net negative, the recovery is still vulnerable to breaking down. Which scenario do you lean toward: holding or breaking down? $BTC $ETH #Bitcoin #Crypto #MarketAnalysis
As of 12:00, $BTC was trading around $59,307.80, up 5.4% over 24 hours but down about $858 from the $60,165.80 recorded at 08:00. $ETH was at $1,663.94, up 6.6%, also edging down from $1,682.77. The Fear & Greed Index remained at 11, in the extreme fear zone.
The rebound from the two-year low of $55,127 is losing steam mid-session. According to a report from CryptoQuant, investors realized more than $11.3 billion in losses over seven days, around eight times the gains realized over the same period; QCP Capital believes this was mainly short-covering, not necessarily fresh buying demand. Spot BTC ETFs continued to see net outflows for a third consecutive session, at around $582 million per session, according to SoSoValue.
For BTC, 8-hour funding flipped from -0.0010% this morning to +0.0070%, with OI at 91,338 BTC. A notable signal is that the cost of holding positions has turned positive again. If support at 57,350–57,450 holds, the recovery structure remains intact; resistance at 60,250–60,350 coincides with the 60,978 high, with liquidity above at 60,900–61,050. For ETH, funding is +0.0003%, OI is around 2.32 million ETH, support is at 1,616–1,620, resistance at 1,686–1,690, and liquidity at 1,712–1,718.
Attached are H4 charts for BTCUSDT and ETHUSDT: EMA20/50, volume, the support zones at 57,350–57,450 (1,616–1,620 for ETH), resistance at 60,250–60,350 (1,686–1,690), and liquidity at 60,900–61,050 (1,712–1,718) are all clearly shown on the H4 timeframe.
Hold scenario: If BTC holds 57,350–57,450, it still has room to move toward 60,250–60,350. Breakdown scenario: A drop below 57,350 could lead to a retest of the 55,127 low; if ETH falls below 1,616, it could return to 1,543.
As long as ETF flows remain net negative, the recovery is still vulnerable to breaking down. Which scenario do you lean toward: holding or breaking down? $BTC $ETH #Bitcoin #Crypto #MarketAnalysis
336
·
--
$BTC surged back above $60,000 after hitting a two-year low of $55,127
Last night, $BTC rebounded more than 9% from the low of $55,127 to $60,166, closing the 24-hour period up 1.98%. $ETH rose 3.73% to $1,682.77. Fear & Greed remains at 11, in the extreme fear zone. According to reports, around $1.8 billion in positions were liquidated over 24 hours, mostly long positions, alongside more than $1.1 billion in net outflows from BTC spot ETFs this week.
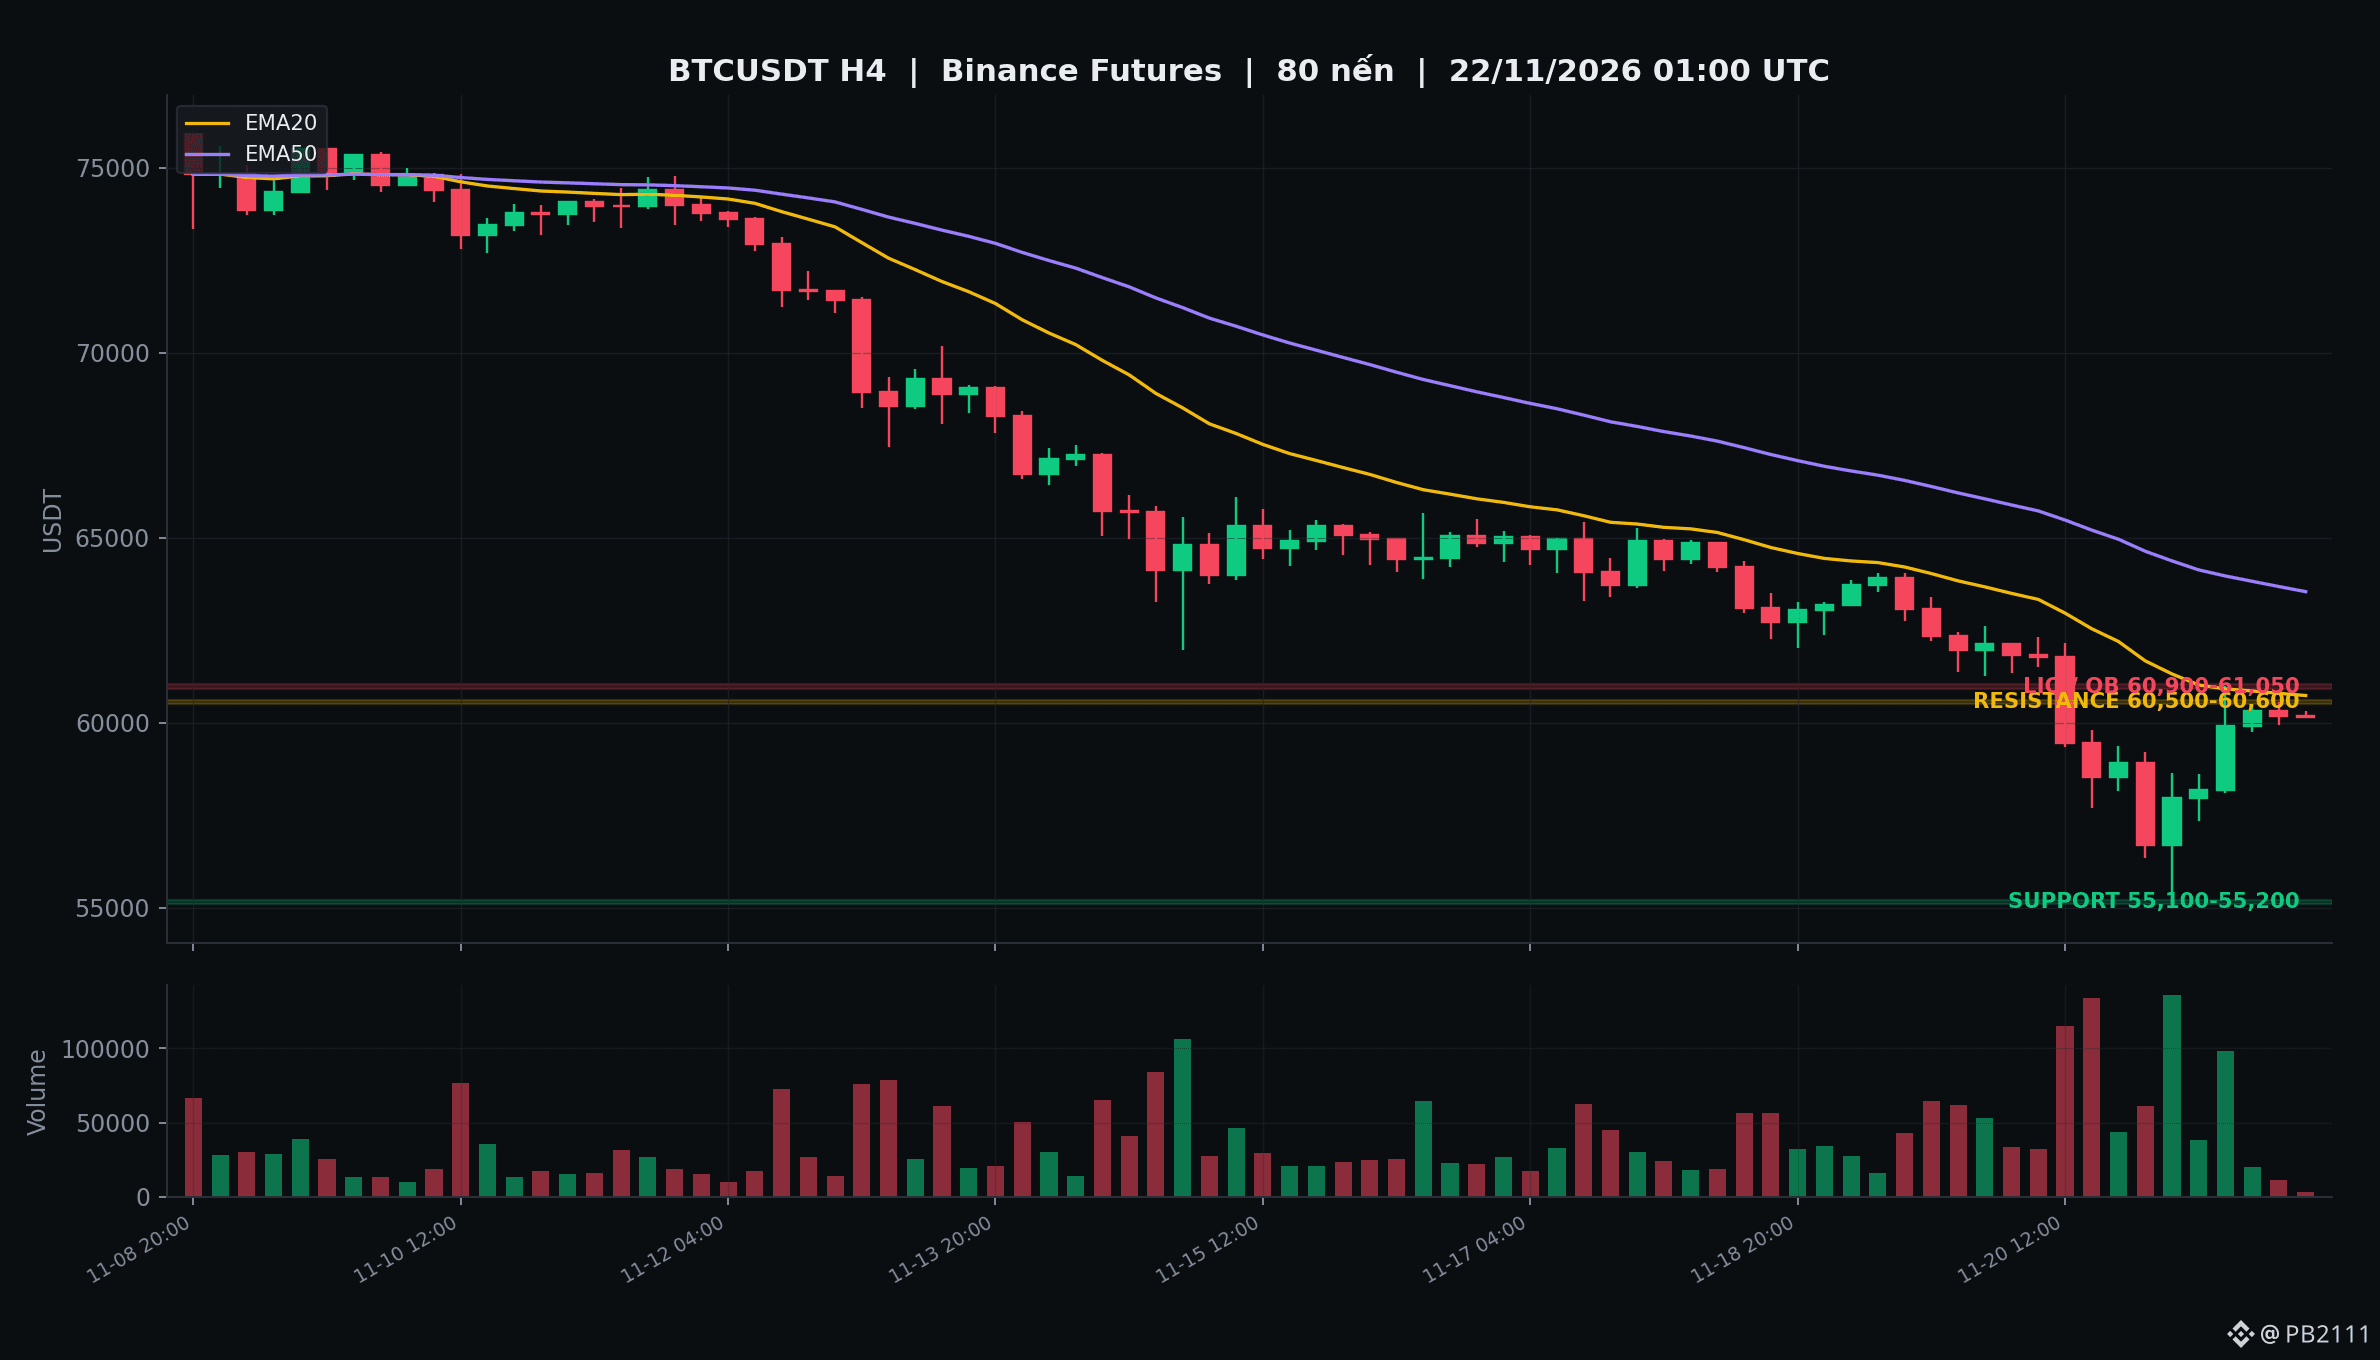
$BTC analysis: The price is near resistance at $60,500–$60,600. This was previously a level where heavy selling occurred, so holding above it is necessary for buying momentum to continue. The estimated liquidity zone above is $60,900–$61,050, where take-profit orders and old stop-loss orders from the downturn are concentrated. Key support remains at $55,100–$55,200, matching last night's low; a break below this zone would mean the rebound has failed. Funding at -0.001%/8h suggests the market is leaning slightly toward sellers. OI is down slightly to 91,674 BTC, and forced selling pressure has eased.
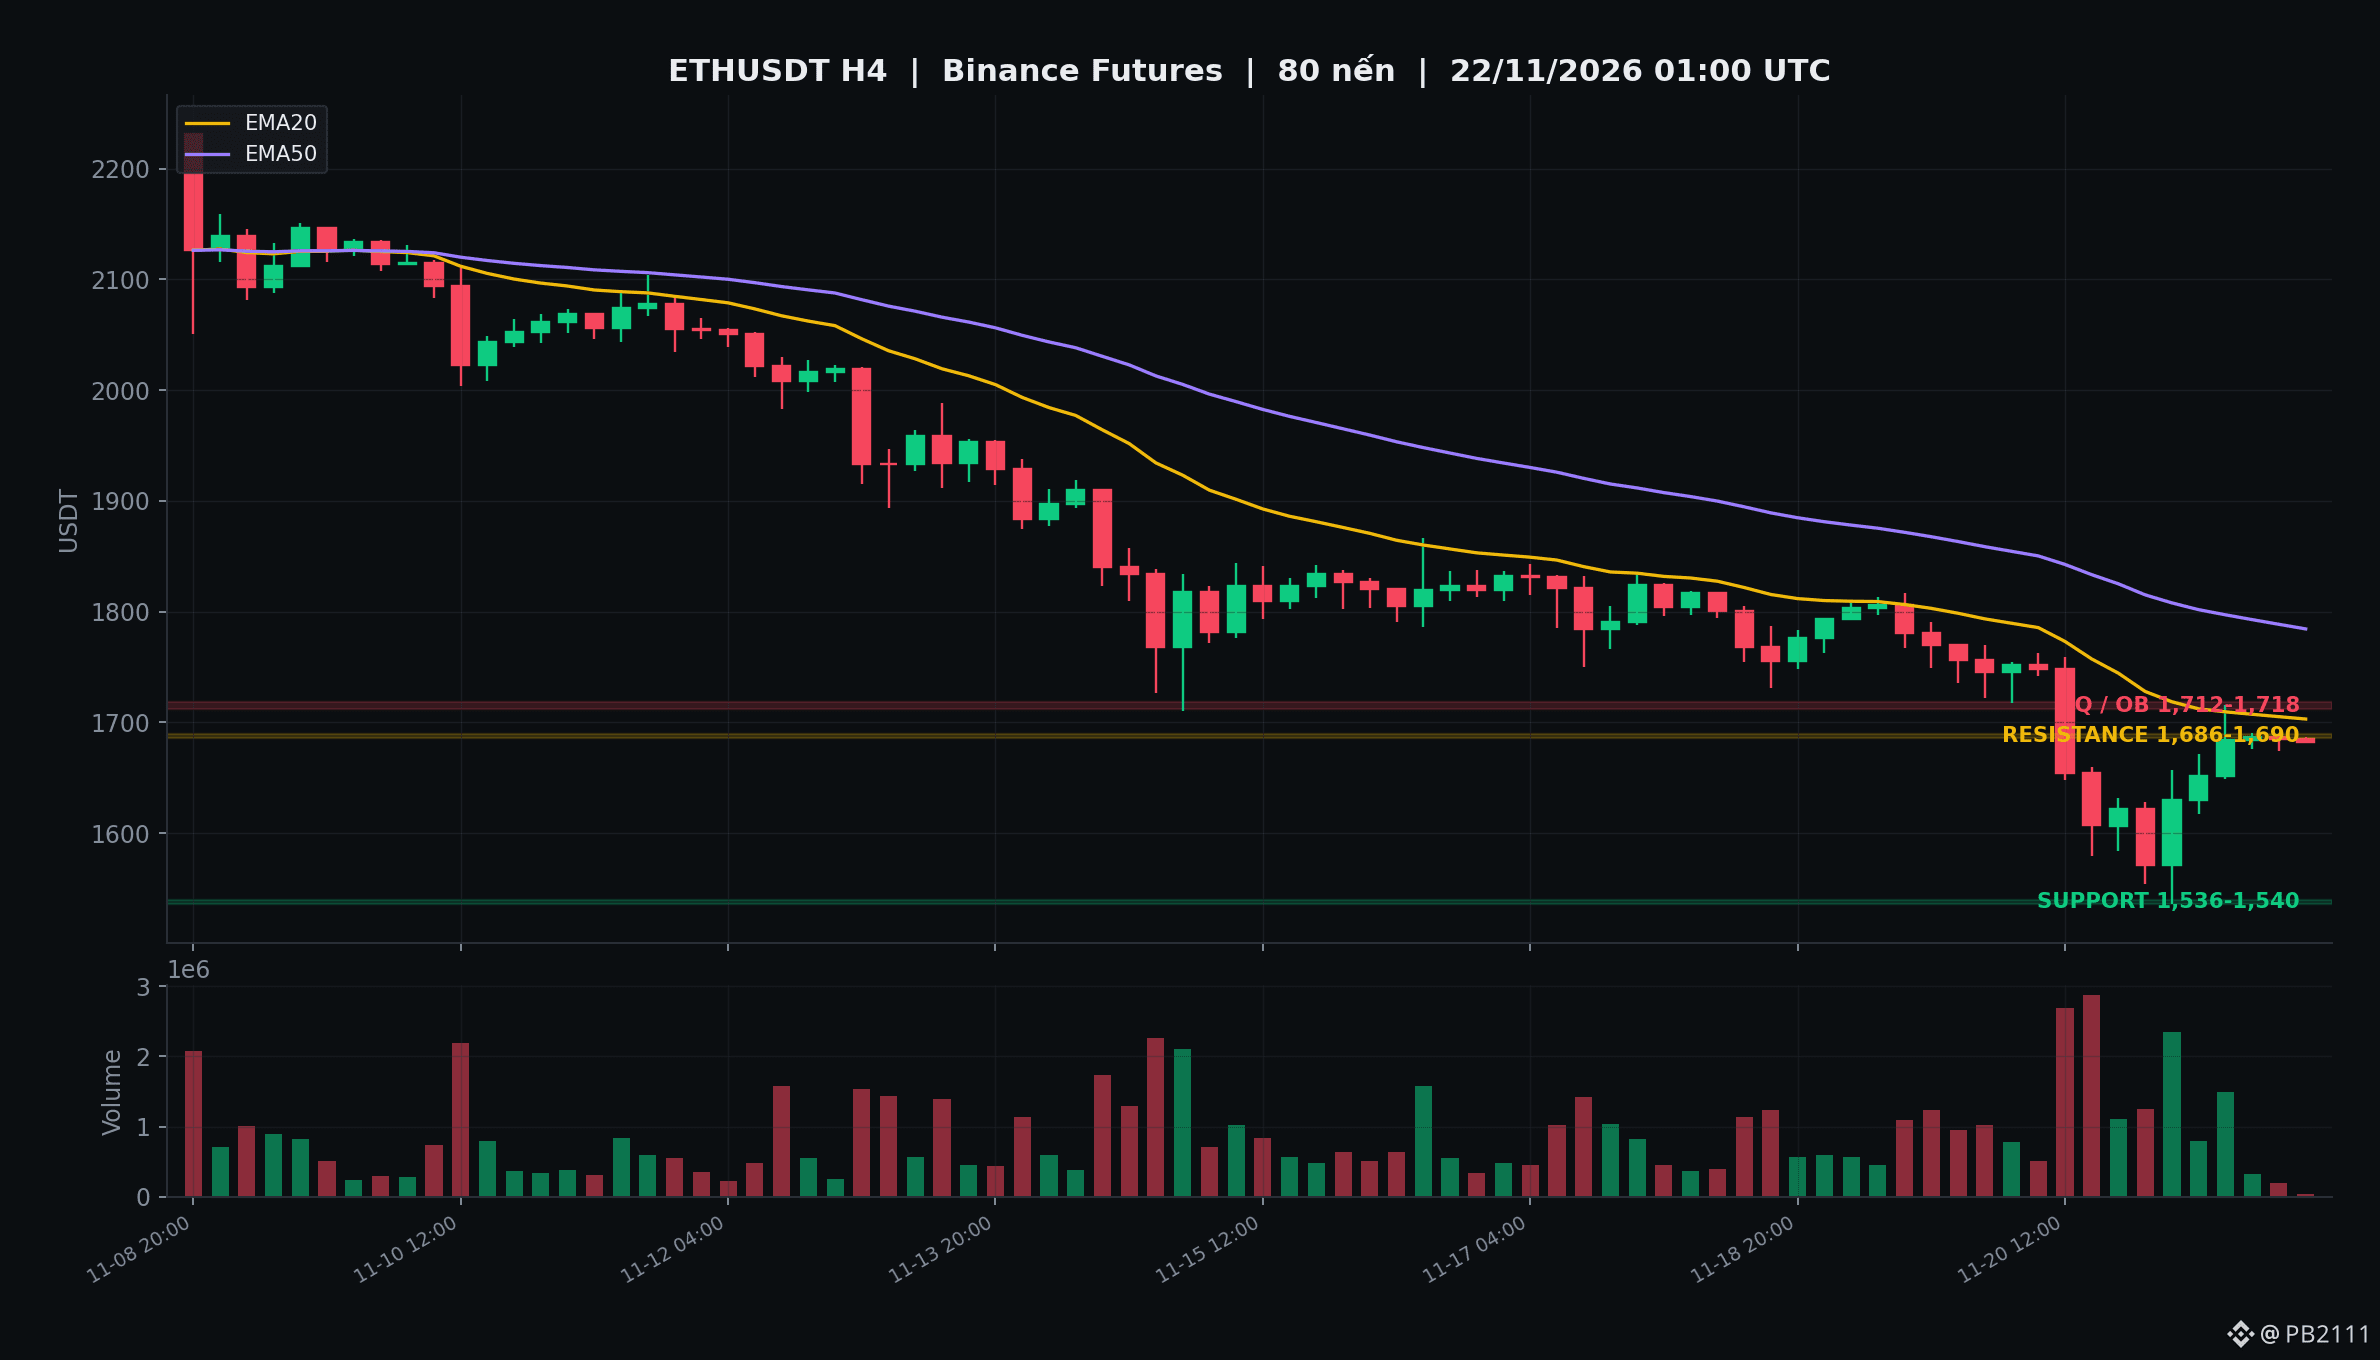
$ETH rebounded from a low of $1,536 to $1,682.77 but is still right up against resistance at $1,686–$1,690. The liquidity zone above is $1,712–$1,718. Support is at $1,536–$1,540. Funding is +0.001%/8h, with OI at around 2.32 million ETH.
Attached are H4 charts for BTCUSDT and ETHUSDT: all 24-hour candles, EMA20/EMA50, and volume. Support zones are $55,100–$55,200 (BTC) and $1,536–$1,540 (ETH); resistance zones are $60,500–$60,600 and $1,686–$1,690; liquidity zones are $60,900–$61,050 and $1,712–$1,718.
Two scenarios: if $BTC holds above $60,000 and breaks through $60,600, the price could test the $60,900–$61,050 liquidity zone. If it falls back below $55,100, the rebound scenario is invalidated, and the previous low should be watched.
The rebound is mainly due to deleveraging, not necessarily fresh buying demand; keep an eye on ETF flows and tech stocks. Which price zone are you watching today? $BTC $ETH #Bitcoin #Crypto #MarketAnalysis
$BTC surged back above $60,000 after hitting a two-year low of $55,127
Last night, $BTC rebounded more than 9% from the low of $55,127 to $60,166, closing the 24-hour period up 1.98%. $ETH rose 3.73% to $1,682.77. Fear & Greed remains at 11, in the extreme fear zone. According to reports, around $1.8 billion in positions were liquidated over 24 hours, mostly long positions, alongside more than $1.1 billion in net outflows from BTC spot ETFs this week.
$BTC analysis: The price is near resistance at $60,500–$60,600. This was previously a level where heavy selling occurred, so holding above it is necessary for buying momentum to continue. The estimated liquidity zone above is $60,900–$61,050, where take-profit orders and old stop-loss orders from the downturn are concentrated. Key support remains at $55,100–$55,200, matching last night's low; a break below this zone would mean the rebound has failed. Funding at -0.001%/8h suggests the market is leaning slightly toward sellers. OI is down slightly to 91,674 BTC, and forced selling pressure has eased.
$ETH rebounded from a low of $1,536 to $1,682.77 but is still right up against resistance at $1,686–$1,690. The liquidity zone above is $1,712–$1,718. Support is at $1,536–$1,540. Funding is +0.001%/8h, with OI at around 2.32 million ETH.
Attached are H4 charts for BTCUSDT and ETHUSDT: all 24-hour candles, EMA20/EMA50, and volume. Support zones are $55,100–$55,200 (BTC) and $1,536–$1,540 (ETH); resistance zones are $60,500–$60,600 and $1,686–$1,690; liquidity zones are $60,900–$61,050 and $1,712–$1,718.
Two scenarios: if $BTC holds above $60,000 and breaks through $60,600, the price could test the $60,900–$61,050 liquidity zone. If it falls back below $55,100, the rebound scenario is invalidated, and the previous low should be watched.
The rebound is mainly due to deleveraging, not necessarily fresh buying demand; keep an eye on ETF flows and tech stocks. Which price zone are you watching today? $BTC $ETH #Bitcoin #Crypto #MarketAnalysis
Last night, $BTC rebounded more than 9% from the low of $55,127 to $60,166, closing the 24-hour period up 1.98%. $ETH rose 3.73% to $1,682.77. Fear & Greed remains at 11, in the extreme fear zone. According to reports, around $1.8 billion in positions were liquidated over 24 hours, mostly long positions, alongside more than $1.1 billion in net outflows from BTC spot ETFs this week.
$BTC analysis: The price is near resistance at $60,500–$60,600. This was previously a level where heavy selling occurred, so holding above it is necessary for buying momentum to continue. The estimated liquidity zone above is $60,900–$61,050, where take-profit orders and old stop-loss orders from the downturn are concentrated. Key support remains at $55,100–$55,200, matching last night's low; a break below this zone would mean the rebound has failed. Funding at -0.001%/8h suggests the market is leaning slightly toward sellers. OI is down slightly to 91,674 BTC, and forced selling pressure has eased.
$ETH rebounded from a low of $1,536 to $1,682.77 but is still right up against resistance at $1,686–$1,690. The liquidity zone above is $1,712–$1,718. Support is at $1,536–$1,540. Funding is +0.001%/8h, with OI at around 2.32 million ETH.
Attached are H4 charts for BTCUSDT and ETHUSDT: all 24-hour candles, EMA20/EMA50, and volume. Support zones are $55,100–$55,200 (BTC) and $1,536–$1,540 (ETH); resistance zones are $60,500–$60,600 and $1,686–$1,690; liquidity zones are $60,900–$61,050 and $1,712–$1,718.
Two scenarios: if $BTC holds above $60,000 and breaks through $60,600, the price could test the $60,900–$61,050 liquidity zone. If it falls back below $55,100, the rebound scenario is invalidated, and the previous low should be watched.
The rebound is mainly due to deleveraging, not necessarily fresh buying demand; keep an eye on ETF flows and tech stocks. Which price zone are you watching today? $BTC $ETH #Bitcoin #Crypto #MarketAnalysis
1
389
·
--
BTC rebounds to 57.8k after sweeping 55.1k: can it hold?
BTC is at 57,821 USD, down 6.4% in 24 hours, after falling from a high of 62,320 to a low of 55,126. The Fear & Greed Index is at 12, in the extreme fear zone. According to a CoinGlass report, around 2.4 billion USD worth of positions were liquidated today.
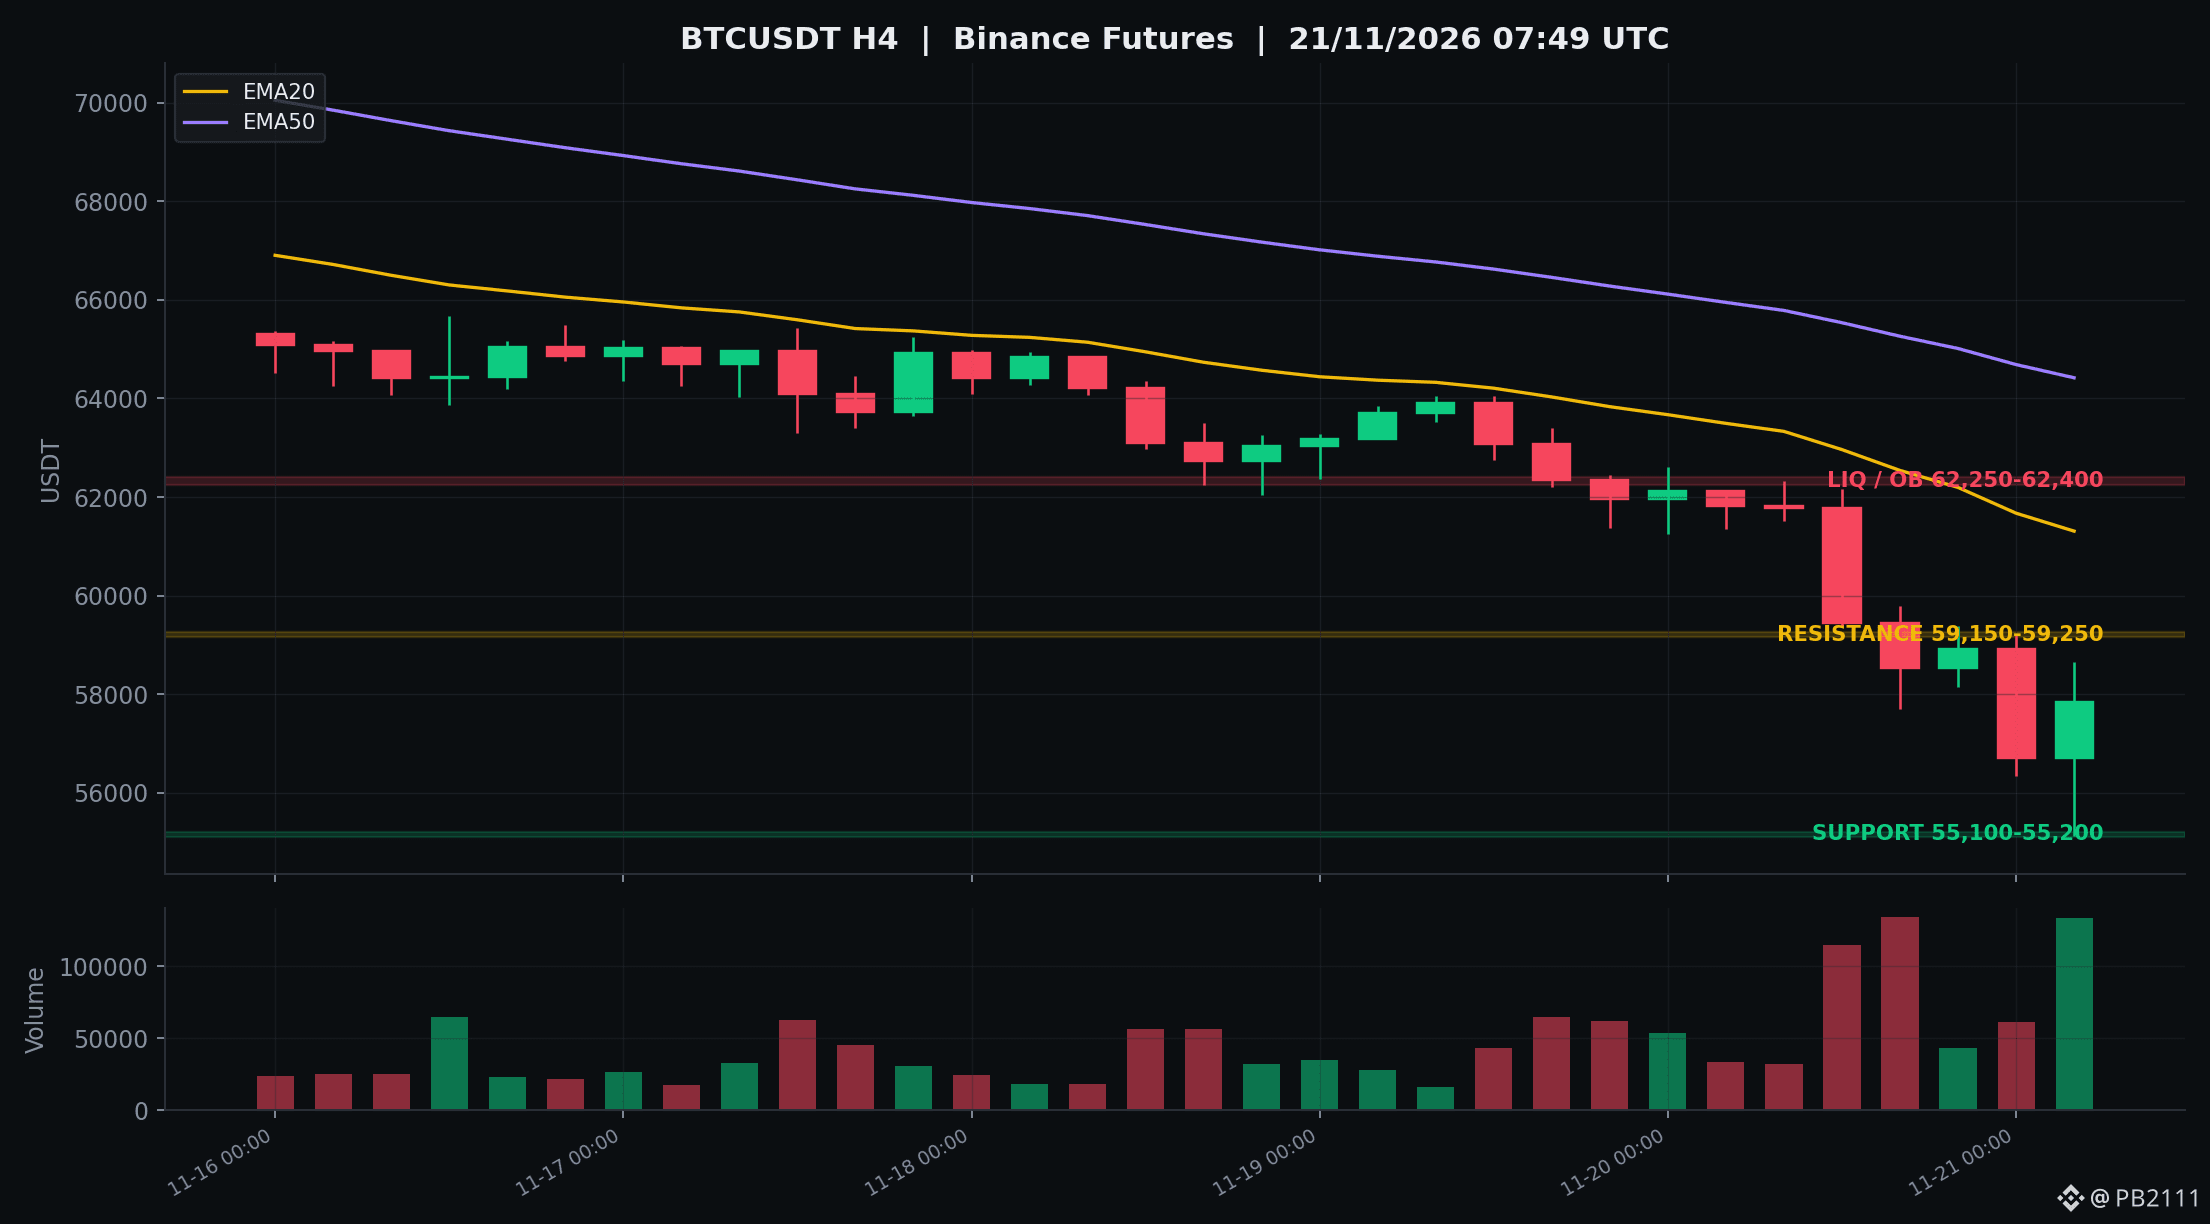
The BTC H4 chart shows the 62k range breaking on heavy volume, followed by the morning candle on 21/11 sweeping 55,126 before bouncing back. The 55,100–55,200 zone is the nearest support, as it marks the 24-hour low and the area where longs were stopped out. Resistance is near 59,150–59,250, the price zone where selling occurred before the drop. Greater liquidity lies at 62,250–62,400. BTC funding is +0.0015% every 8h, close to neutral. OI is still at 94,291 BTC, meaning positions have not been fully cleared out.
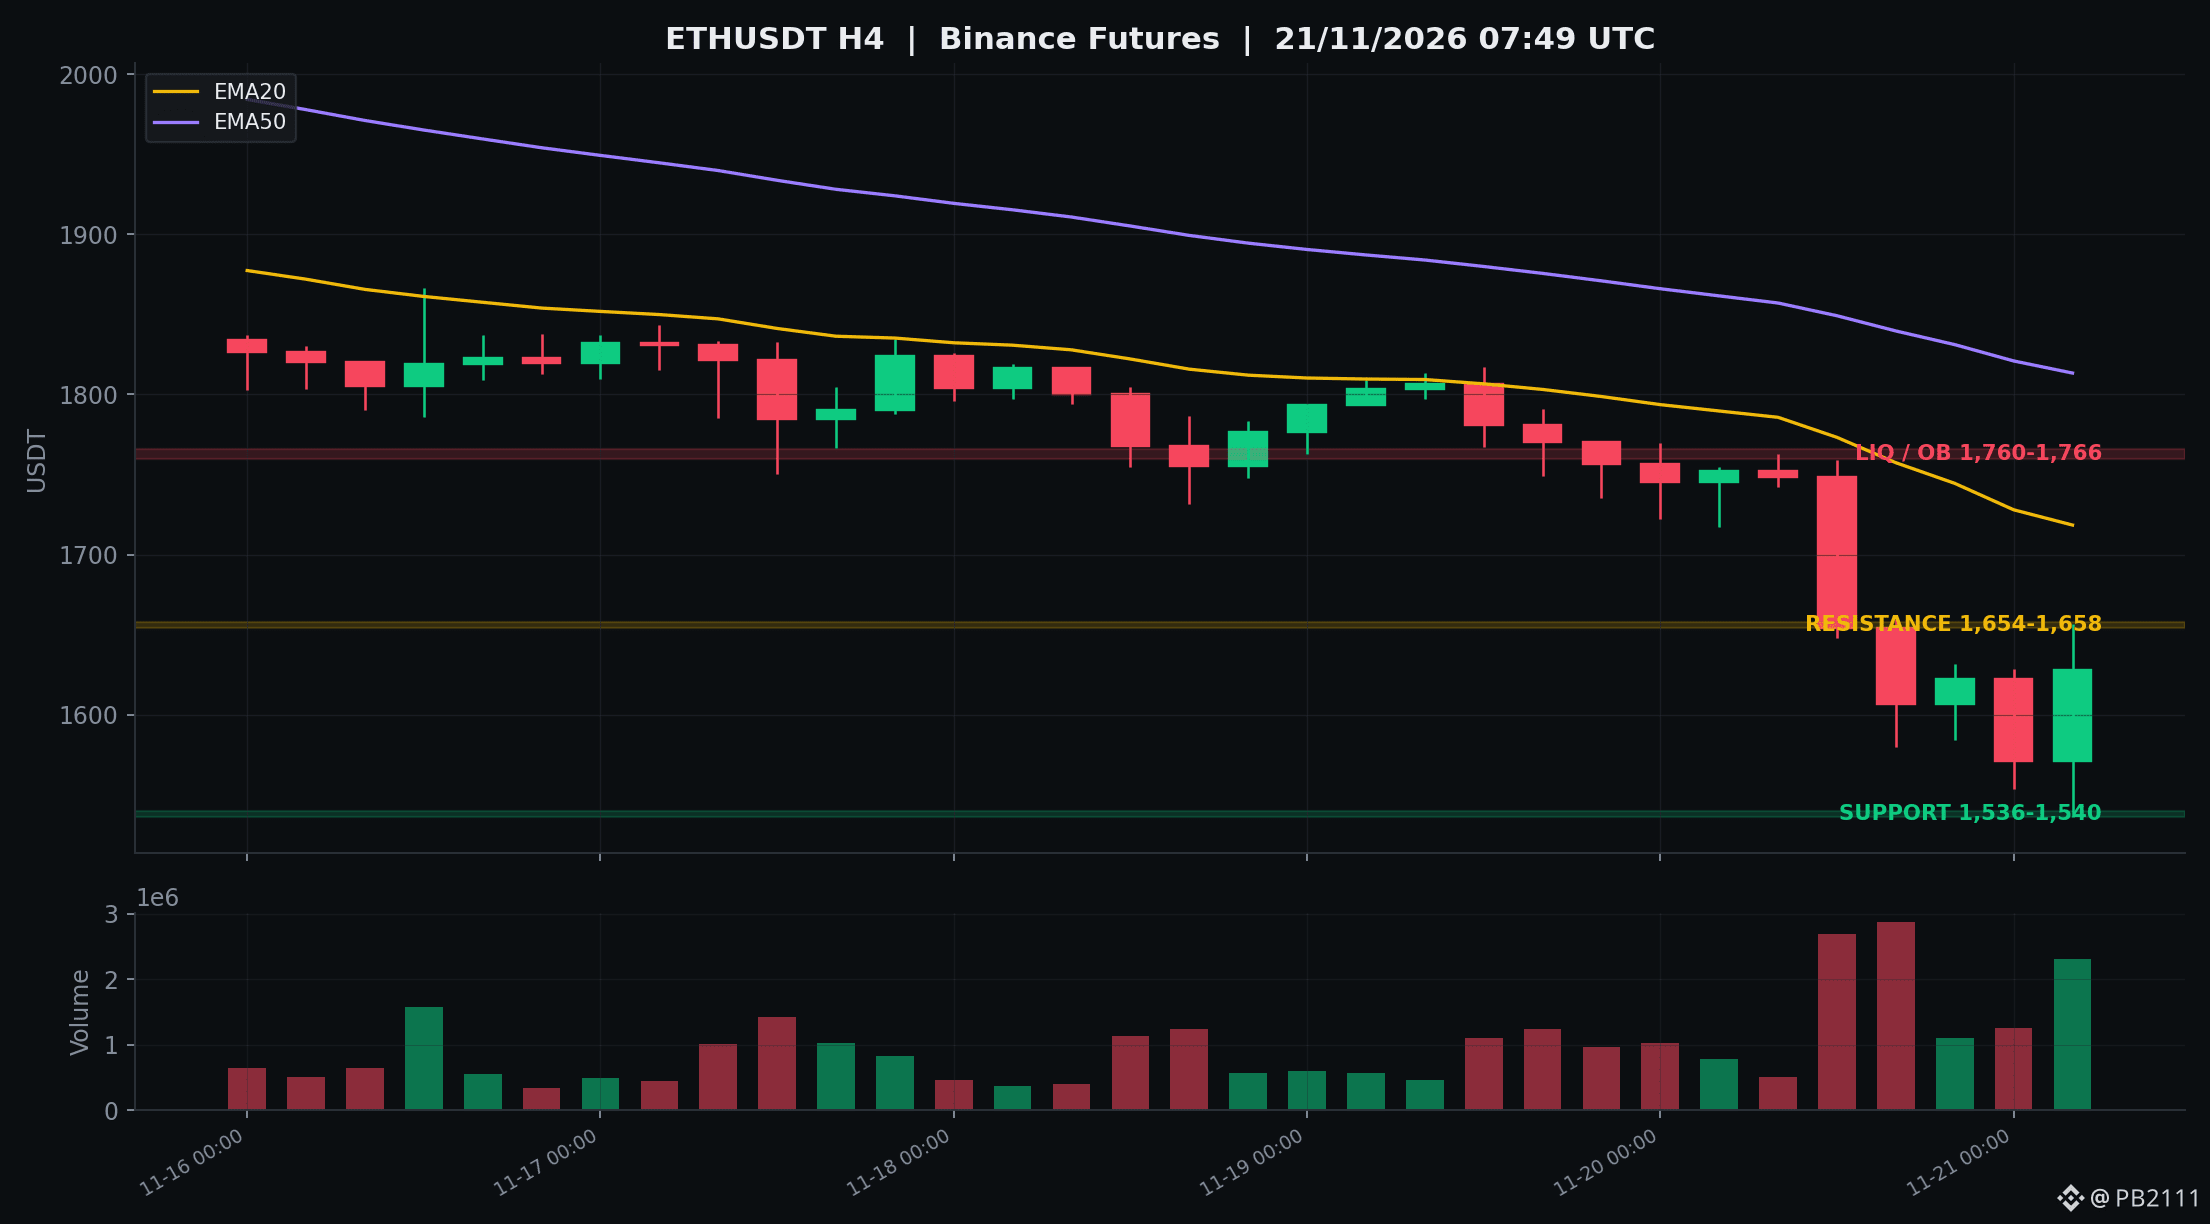
ETH is down 6.9% to 1,627 USD. Support is at 1,536–1,540, resistance at 1,654–1,658, and liquidity above at 1,760–1,766. Funding is -0.0037%/8h, so shorts are paying a small fee. OI is 2.31 million ETH.
Attach an H4 BTCUSDT chart with the 55,100–55,200, 59,150–59,250, and 62,250–62,400 zones marked, along with EMA20, EMA50, and volume. For ETH, use an H4 chart marking 1,536–1,540 and 1,654–1,658.
If 55.1k holds → a rebound to test 59.1k. If 55.1k breaks → watch 50,000 as a psychological level. If ETH breaks below 1,536, its recovery structure will weaken.
This is still a technical reaction after a sell-off, not confirmation of a bottom. Funding is neutral and OI remains high, so a retest cannot be ruled out.
$BTC $ETH #Bitcoin #Crypto #MarketAnalysis
Are you watching 55.1k or 59.1k today?
BTC rebounds to 57.8k after sweeping 55.1k: can it hold?
BTC is at 57,821 USD, down 6.4% in 24 hours, after falling from a high of 62,320 to a low of 55,126. The Fear & Greed Index is at 12, in the extreme fear zone. According to a CoinGlass report, around 2.4 billion USD worth of positions were liquidated today.
The BTC H4 chart shows the 62k range breaking on heavy volume, followed by the morning candle on 21/11 sweeping 55,126 before bouncing back. The 55,100–55,200 zone is the nearest support, as it marks the 24-hour low and the area where longs were stopped out. Resistance is near 59,150–59,250, the price zone where selling occurred before the drop. Greater liquidity lies at 62,250–62,400. BTC funding is +0.0015% every 8h, close to neutral. OI is still at 94,291 BTC, meaning positions have not been fully cleared out.
ETH is down 6.9% to 1,627 USD. Support is at 1,536–1,540, resistance at 1,654–1,658, and liquidity above at 1,760–1,766. Funding is -0.0037%/8h, so shorts are paying a small fee. OI is 2.31 million ETH.
Attach an H4 BTCUSDT chart with the 55,100–55,200, 59,150–59,250, and 62,250–62,400 zones marked, along with EMA20, EMA50, and volume. For ETH, use an H4 chart marking 1,536–1,540 and 1,654–1,658.
If 55.1k holds → a rebound to test 59.1k. If 55.1k breaks → watch 50,000 as a psychological level. If ETH breaks below 1,536, its recovery structure will weaken.
This is still a technical reaction after a sell-off, not confirmation of a bottom. Funding is neutral and OI remains high, so a retest cannot be ruled out.
$BTC $ETH #Bitcoin #Crypto #MarketAnalysis
Are you watching 55.1k or 59.1k today?
BTC is at 57,821 USD, down 6.4% in 24 hours, after falling from a high of 62,320 to a low of 55,126. The Fear & Greed Index is at 12, in the extreme fear zone. According to a CoinGlass report, around 2.4 billion USD worth of positions were liquidated today.
The BTC H4 chart shows the 62k range breaking on heavy volume, followed by the morning candle on 21/11 sweeping 55,126 before bouncing back. The 55,100–55,200 zone is the nearest support, as it marks the 24-hour low and the area where longs were stopped out. Resistance is near 59,150–59,250, the price zone where selling occurred before the drop. Greater liquidity lies at 62,250–62,400. BTC funding is +0.0015% every 8h, close to neutral. OI is still at 94,291 BTC, meaning positions have not been fully cleared out.
ETH is down 6.9% to 1,627 USD. Support is at 1,536–1,540, resistance at 1,654–1,658, and liquidity above at 1,760–1,766. Funding is -0.0037%/8h, so shorts are paying a small fee. OI is 2.31 million ETH.
Attach an H4 BTCUSDT chart with the 55,100–55,200, 59,150–59,250, and 62,250–62,400 zones marked, along with EMA20, EMA50, and volume. For ETH, use an H4 chart marking 1,536–1,540 and 1,654–1,658.
If 55.1k holds → a rebound to test 59.1k. If 55.1k breaks → watch 50,000 as a psychological level. If ETH breaks below 1,536, its recovery structure will weaken.
This is still a technical reaction after a sell-off, not confirmation of a bottom. Funding is neutral and OI remains high, so a retest cannot be ruled out.
$BTC $ETH #Bitcoin #Crypto #MarketAnalysis
Are you watching 55.1k or 59.1k today?
1
617
·
--
━━━ 📊 BTC Report, May 10, 2026 ━━━
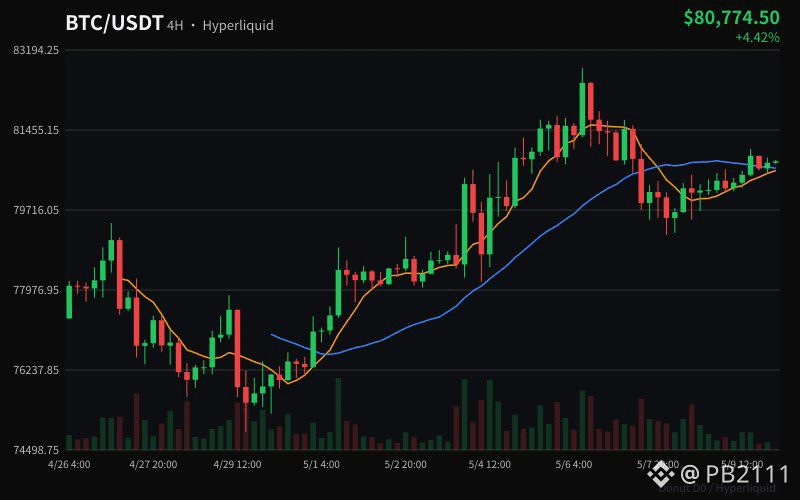
Bitcoin is trading at $80,814 and the picture has gotten stronger since yesterday.
Score jumped to 79/100 (up from 64 yesterday). Four bullish signals, zero bearish. That's as clean as it gets without being overbought.
All moving averages still stacked perfectly. Price above EMA20 ($80,501), EMA50 ($79,929), and EMA200 ($76,657). Trend structure is intact.
RSI moved up to 55.4. Still neutral territory but momentum is building. MACD histogram flipped positive at +20.3, meaning short term momentum just confirmed the move. Yesterday it was negative. Today it's green. That's a meaningful shift.
Bollinger Bands are tightening. Upper at $81,319, lower at $79,477. When bands squeeze like this with an uptrend underneath, the breakout tends to continue in the direction of the trend.
Funding rate just flipped positive (+0.006%). Yesterday it was negative. Longs are now the majority, which means conviction is building on the bull side. This is a healthy transition from "squeeze shorts" to "organic buying."
Key levels:
🟢 Support: $79,181 / $78,143 / $77,050
🔴 Resistance: $81,319 (BB upper) → $82,850 (major R1)
The read: Everything improved overnight. Score up, MACD confirmed, funding flipped. BTC is coiling for a move and the data says up. A clean break above $81,319 likely triggers a run toward $82,850. Invalidated below $79,000.
ATR at $613 (0.76%): volatility is low and compressing. The breakout when it comes will be sharp.
⚠️ Data analysis only, not financial advice.
#CryptoAnalysis #BTC
━━━ 📊 BTC Report, May 10, 2026 ━━━
Bitcoin is trading at $80,814 and the picture has gotten stronger since yesterday.
Score jumped to 79/100 (up from 64 yesterday). Four bullish signals, zero bearish. That's as clean as it gets without being overbought.
All moving averages still stacked perfectly. Price above EMA20 ($80,501), EMA50 ($79,929), and EMA200 ($76,657). Trend structure is intact.
RSI moved up to 55.4. Still neutral territory but momentum is building. MACD histogram flipped positive at +20.3, meaning short term momentum just confirmed the move. Yesterday it was negative. Today it's green. That's a meaningful shift.
Bollinger Bands are tightening. Upper at $81,319, lower at $79,477. When bands squeeze like this with an uptrend underneath, the breakout tends to continue in the direction of the trend.
Funding rate just flipped positive (+0.006%). Yesterday it was negative. Longs are now the majority, which means conviction is building on the bull side. This is a healthy transition from "squeeze shorts" to "organic buying."
Key levels:
🟢 Support: $79,181 / $78,143 / $77,050
🔴 Resistance: $81,319 (BB upper) → $82,850 (major R1)
The read: Everything improved overnight. Score up, MACD confirmed, funding flipped. BTC is coiling for a move and the data says up. A clean break above $81,319 likely triggers a run toward $82,850. Invalidated below $79,000.
ATR at $613 (0.76%): volatility is low and compressing. The breakout when it comes will be sharp.
⚠️ Data analysis only, not financial advice.
#CryptoAnalysis #BTC
Bitcoin is trading at $80,814 and the picture has gotten stronger since yesterday.
Score jumped to 79/100 (up from 64 yesterday). Four bullish signals, zero bearish. That's as clean as it gets without being overbought.
All moving averages still stacked perfectly. Price above EMA20 ($80,501), EMA50 ($79,929), and EMA200 ($76,657). Trend structure is intact.
RSI moved up to 55.4. Still neutral territory but momentum is building. MACD histogram flipped positive at +20.3, meaning short term momentum just confirmed the move. Yesterday it was negative. Today it's green. That's a meaningful shift.
Bollinger Bands are tightening. Upper at $81,319, lower at $79,477. When bands squeeze like this with an uptrend underneath, the breakout tends to continue in the direction of the trend.
Funding rate just flipped positive (+0.006%). Yesterday it was negative. Longs are now the majority, which means conviction is building on the bull side. This is a healthy transition from "squeeze shorts" to "organic buying."
Key levels:
🟢 Support: $79,181 / $78,143 / $77,050
🔴 Resistance: $81,319 (BB upper) → $82,850 (major R1)
The read: Everything improved overnight. Score up, MACD confirmed, funding flipped. BTC is coiling for a move and the data says up. A clean break above $81,319 likely triggers a run toward $82,850. Invalidated below $79,000.
ATR at $613 (0.76%): volatility is low and compressing. The breakout when it comes will be sharp.
⚠️ Data analysis only, not financial advice.
#CryptoAnalysis #BTC
142
·
--
Great
Great

RUBEL AHMED 1
·
--
$BTC still has two major CME gaps left to fill — one around $#84,100 and another near $67,100.
If BTC moves up and fills the $84,100 CME gap, roughly $3.4 billion in short positions could get liquidated, potentially creating strong bullish momentum through a short squeeze.
On the other hand, if Bitcoin drops and fills the $67,100 CME gap, nearly $17 billion in long positions may face liquidation, which could trigger heavy market volatility and panic selling.
Right now, these two levels are becoming some of the most important liquidity zones for the entire crypto market, and traders are closely watching which direction #BTC☀️ chooses next.
If BTC moves up and fills the $84,100 CME gap, roughly $3.4 billion in short positions could get liquidated, potentially creating strong bullish momentum through a short squeeze.
On the other hand, if Bitcoin drops and fills the $67,100 CME gap, nearly $17 billion in long positions may face liquidation, which could trigger heavy market volatility and panic selling.
Right now, these two levels are becoming some of the most important liquidity zones for the entire crypto market, and traders are closely watching which direction #BTC☀️ chooses next.



1
·
--
━━━ 📊 BTC Market Analysis : May 9, 2026 ━━━
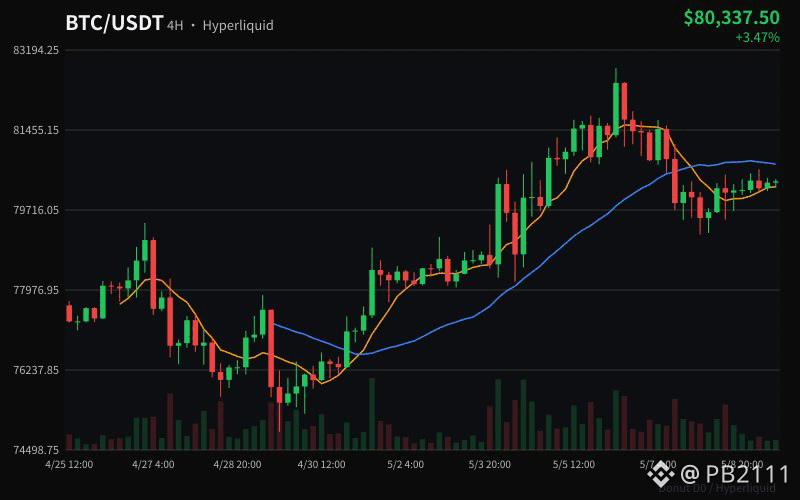
Bitcoin is currently trading at $80,338, holding its ground in a confirmed uptrend with an accumulation phase underway. Here's what the data shows.
The structure is clean.
All major moving averages are stacked in the right order, price sits above EMA20 ($80,337), EMA50 ($79,770), and EMA200 ($76,604). This kind of alignment tells you the trend is intact. Bulls are in control on every meaningful timeframe.
Momentum is cautious, not broken.
RSI is sitting neutral at 51, no signs of being overbought or oversold. There's room to move in either direction, but the edge still favors the upside. The MACD histogram is slightly negative (-76), meaning short-term momentum hasn't fully confirmed yet. Not a red flag, just a signal to wait for confirmation rather than chase.
The range is tight but defined.
Bollinger Bands show price compressing between $79,083 (lower) and $82,089 (upper), with the midline at $80,585 acting as the immediate battleground. A clean close above $82,089 opens the path toward $84K–$85K. Lose $79,000 and the thesis shifts to a retest of $77K–$78K.
Derivatives are saying something important.
Funding rate is negative right now, short traders are paying longs to hold their positions. That's a quiet squeeze building in the background. When funding is negative and price isn't dropping, it's usually only a matter of time before shorts cover.
Key levels to watch:
🟢 Support: $80,585 / $79,181 / $78,143
🔴 Resistance: $82,089 / $82,850
Bottom line: Accumulation phase, uptrend intact, funding squeeze building. The setup favors bulls as long as $79,000 holds. ATR at $703 (0.88%), market is calm, no wild swings expected unless a macro catalyst hits.
⚠️ This is data-driven analysis, not financial advice.
#Bitcoin #BTC #CryptoAnalysis
━━━ 📊 BTC Market Analysis : May 9, 2026 ━━━
Bitcoin is currently trading at $80,338, holding its ground in a confirmed uptrend with an accumulation phase underway. Here's what the data shows.
The structure is clean.
All major moving averages are stacked in the right order, price sits above EMA20 ($80,337), EMA50 ($79,770), and EMA200 ($76,604). This kind of alignment tells you the trend is intact. Bulls are in control on every meaningful timeframe.
Momentum is cautious, not broken.
RSI is sitting neutral at 51, no signs of being overbought or oversold. There's room to move in either direction, but the edge still favors the upside. The MACD histogram is slightly negative (-76), meaning short-term momentum hasn't fully confirmed yet. Not a red flag, just a signal to wait for confirmation rather than chase.
The range is tight but defined.
Bollinger Bands show price compressing between $79,083 (lower) and $82,089 (upper), with the midline at $80,585 acting as the immediate battleground. A clean close above $82,089 opens the path toward $84K–$85K. Lose $79,000 and the thesis shifts to a retest of $77K–$78K.
Derivatives are saying something important.
Funding rate is negative right now, short traders are paying longs to hold their positions. That's a quiet squeeze building in the background. When funding is negative and price isn't dropping, it's usually only a matter of time before shorts cover.
Key levels to watch:
🟢 Support: $80,585 / $79,181 / $78,143
🔴 Resistance: $82,089 / $82,850
Bottom line: Accumulation phase, uptrend intact, funding squeeze building. The setup favors bulls as long as $79,000 holds. ATR at $703 (0.88%), market is calm, no wild swings expected unless a macro catalyst hits.
⚠️ This is data-driven analysis, not financial advice.
#Bitcoin #BTC #CryptoAnalysis
Bitcoin is currently trading at $80,338, holding its ground in a confirmed uptrend with an accumulation phase underway. Here's what the data shows.
The structure is clean.
All major moving averages are stacked in the right order, price sits above EMA20 ($80,337), EMA50 ($79,770), and EMA200 ($76,604). This kind of alignment tells you the trend is intact. Bulls are in control on every meaningful timeframe.
Momentum is cautious, not broken.
RSI is sitting neutral at 51, no signs of being overbought or oversold. There's room to move in either direction, but the edge still favors the upside. The MACD histogram is slightly negative (-76), meaning short-term momentum hasn't fully confirmed yet. Not a red flag, just a signal to wait for confirmation rather than chase.
The range is tight but defined.
Bollinger Bands show price compressing between $79,083 (lower) and $82,089 (upper), with the midline at $80,585 acting as the immediate battleground. A clean close above $82,089 opens the path toward $84K–$85K. Lose $79,000 and the thesis shifts to a retest of $77K–$78K.
Derivatives are saying something important.
Funding rate is negative right now, short traders are paying longs to hold their positions. That's a quiet squeeze building in the background. When funding is negative and price isn't dropping, it's usually only a matter of time before shorts cover.
Key levels to watch:
🟢 Support: $80,585 / $79,181 / $78,143
🔴 Resistance: $82,089 / $82,850
Bottom line: Accumulation phase, uptrend intact, funding squeeze building. The setup favors bulls as long as $79,000 holds. ATR at $703 (0.88%), market is calm, no wild swings expected unless a macro catalyst hits.
⚠️ This is data-driven analysis, not financial advice.
#Bitcoin #BTC #CryptoAnalysis
1
109

·
--
#2025withBinance Start your crypto story with the @Binance Year in Review and share your highlights! #2025withBinance.
👉 Sign up with my link and get 100 USD rewards! https://www.binance.com/year-in-review/2025-with-binance?ref=91822436
#2025withBinance Start your crypto story with the @Binance Year in Review and share your highlights! #2025withBinance.
👉 Sign up with my link and get 100 USD rewards! https://www.binance.com/year-in-review/2025-with-binance?ref=91822436
👉 Sign up with my link and get 100 USD rewards! https://www.binance.com/year-in-review/2025-with-binance?ref=91822436
·
--
Hold $LINEA to end this year!
Target x10 with this price! Dont miss!
Hold $LINEA to end this year!
Target x10 with this price! Dont miss!
Target x10 with this price! Dont miss!
25
·
--
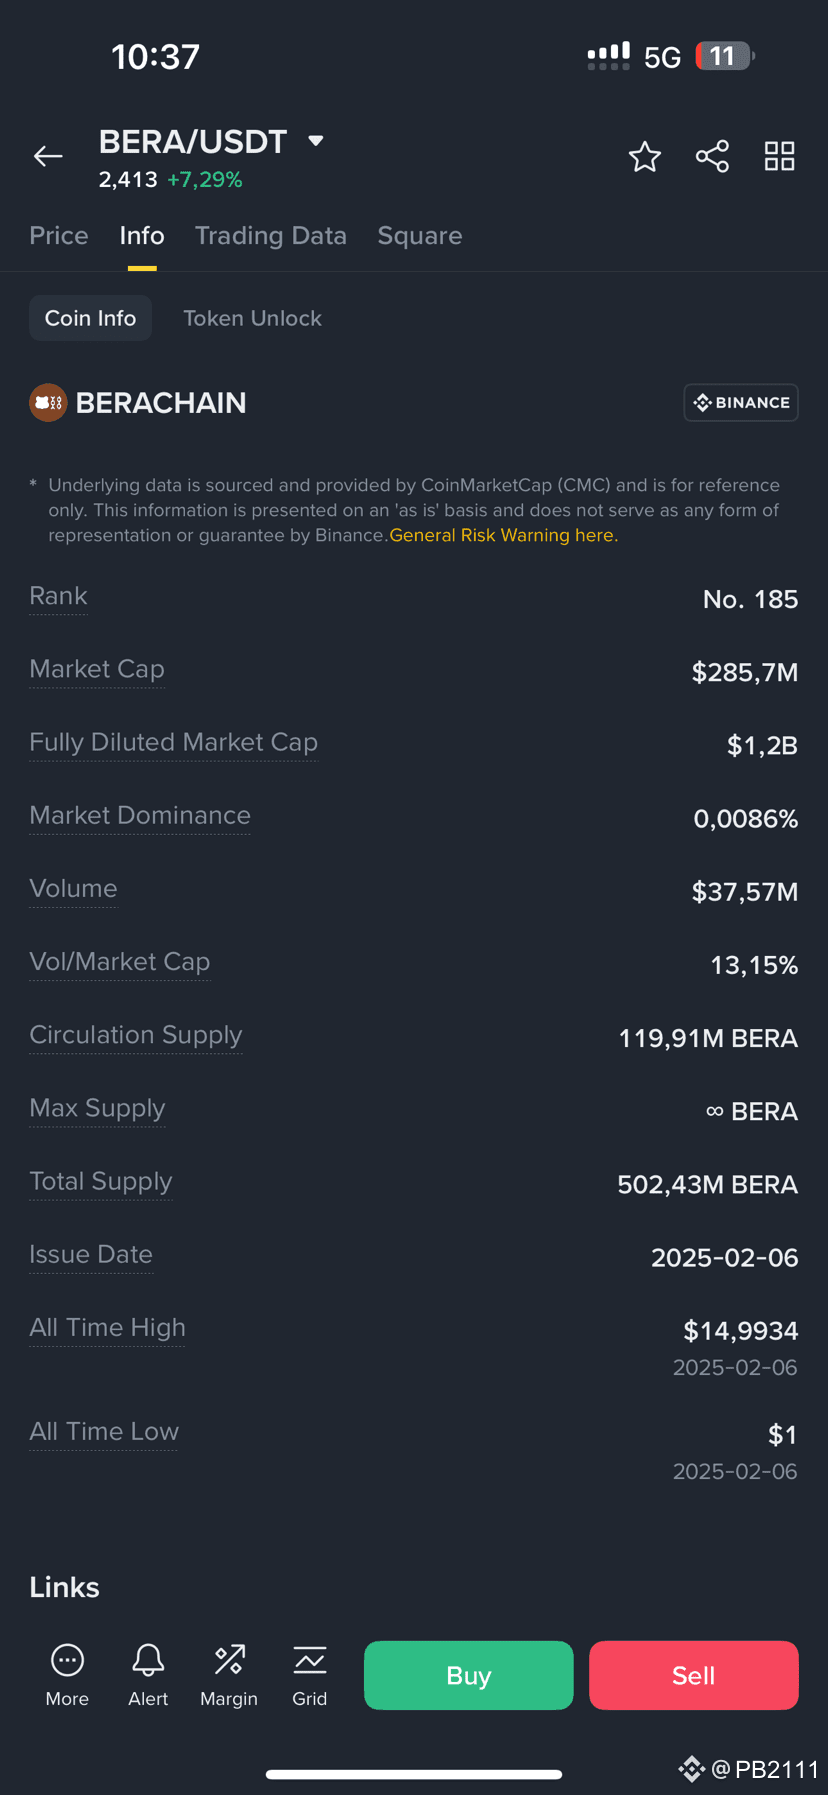
$Bera distribution, layer1 280M$ market, no unlock until next year
$Bera distribution, layer1 280M$ market, no unlock until next year
870

·
--
#ShareYourTrades $CAKE look like bulish on CAKE
#ShareYourTrades $CAKE look like bulish on CAKE
301
Log in to explore more content
Join global crypto users on Binance Square
⚡️ Get latest and useful information about crypto.
💬 Trusted by the world’s largest crypto exchange.
👍 Discover real insights from verified creators.
Email / Phone number
Trending Topics
BTCReboundsAbove$60KAmidWhaleDipBuying
26,901 views
163 Discussing
Abraxas Capital, Other Whales Buy the BTC Dip as Bitcoin Briefly Reclaims $60,000
Binance News
·28 Likes
·42.1k views
SolanaSets2027RoadmapToDoubleComputeCapacity
10,232 views
332 Discussing
CaliforniaNvidiaProbeExaminesPotentialCriminalViolations
3,908 views
50 Discussing