

Kabawn
55 Posts

Kabawn
Report
Block User
king of crypto
Open Trade
High-Frequency Trader
7.4 Years
537 Following
173 Followers
303 Liked
Posts
Portfolio
All
Quotes
Videos
·
--
Bullish
$NIGHT is trading at $0.05 after a 91% weekly surge and a recovery of more than 235% from its yearly low, but overbought momentum and sell-side participation temper the bullish setup.
Key Drivers:
Midnight v9 upgrade and ecosystem access: Interoperable, upgradeable smart contracts, sponsored DUST fees, Brave Wallet integration, Gero shielded balances, and Morpho P2P Orders could broaden future NIGHT demand, although flows remain ecosystem-dependent.
Supply and participation: The $817.86M market cap, 1.44 FDV ratio, $716,619.28 USDT big-order outflow, 0.49 taker buy share, and 0.22 large-order buy share point to supply and sell-side pressure.
Macro Transmission: Fear & Greed at 67 remains supportive of speculative interest, but declines of 3 points from yesterday and last week and 9 points from last month make the backdrop mixed.
Key Levels:
Market Classification: bullish lean, with price above MA10, MA20, MA60, and the $0.03879 volume concentration.
Upper reference: $0.06; lower reference: $0.04; volatility boundary: $0.06 and $0.04.
A break below MA20 at $0.03 would weaken the trend.
$NIGHT is trading at $0.05 after a 91% weekly surge and a recovery of more than 235% from its yearly low, but overbought momentum and sell-side participation temper the bullish setup.
Key Drivers:
Midnight v9 upgrade and ecosystem access: Interoperable, upgradeable smart contracts, sponsored DUST fees, Brave Wallet integration, Gero shielded balances, and Morpho P2P Orders could broaden future NIGHT demand, although flows remain ecosystem-dependent.
Supply and participation: The $817.86M market cap, 1.44 FDV ratio, $716,619.28 USDT big-order outflow, 0.49 taker buy share, and 0.22 large-order buy share point to supply and sell-side pressure.
Macro Transmission: Fear & Greed at 67 remains supportive of speculative interest, but declines of 3 points from yesterday and last week and 9 points from last month make the backdrop mixed.
Key Levels:
Market Classification: bullish lean, with price above MA10, MA20, MA60, and the $0.03879 volume concentration.
Upper reference: $0.06; lower reference: $0.04; volatility boundary: $0.06 and $0.04.
A break below MA20 at $0.03 would weaken the trend.
Key Drivers:
Midnight v9 upgrade and ecosystem access: Interoperable, upgradeable smart contracts, sponsored DUST fees, Brave Wallet integration, Gero shielded balances, and Morpho P2P Orders could broaden future NIGHT demand, although flows remain ecosystem-dependent.
Supply and participation: The $817.86M market cap, 1.44 FDV ratio, $716,619.28 USDT big-order outflow, 0.49 taker buy share, and 0.22 large-order buy share point to supply and sell-side pressure.
Macro Transmission: Fear & Greed at 67 remains supportive of speculative interest, but declines of 3 points from yesterday and last week and 9 points from last month make the backdrop mixed.
Key Levels:
Market Classification: bullish lean, with price above MA10, MA20, MA60, and the $0.03879 volume concentration.
Upper reference: $0.06; lower reference: $0.04; volatility boundary: $0.06 and $0.04.
A break below MA20 at $0.03 would weaken the trend.

268
·
--
🚀 NIGHT/USDT Analysis: Following the SUI Pattern?
Notice standard structural similarity on the weekly chart (NIGHT/USDT) comparing toSUI's historic breakout setup:
📌 Key Structure Breakdown:
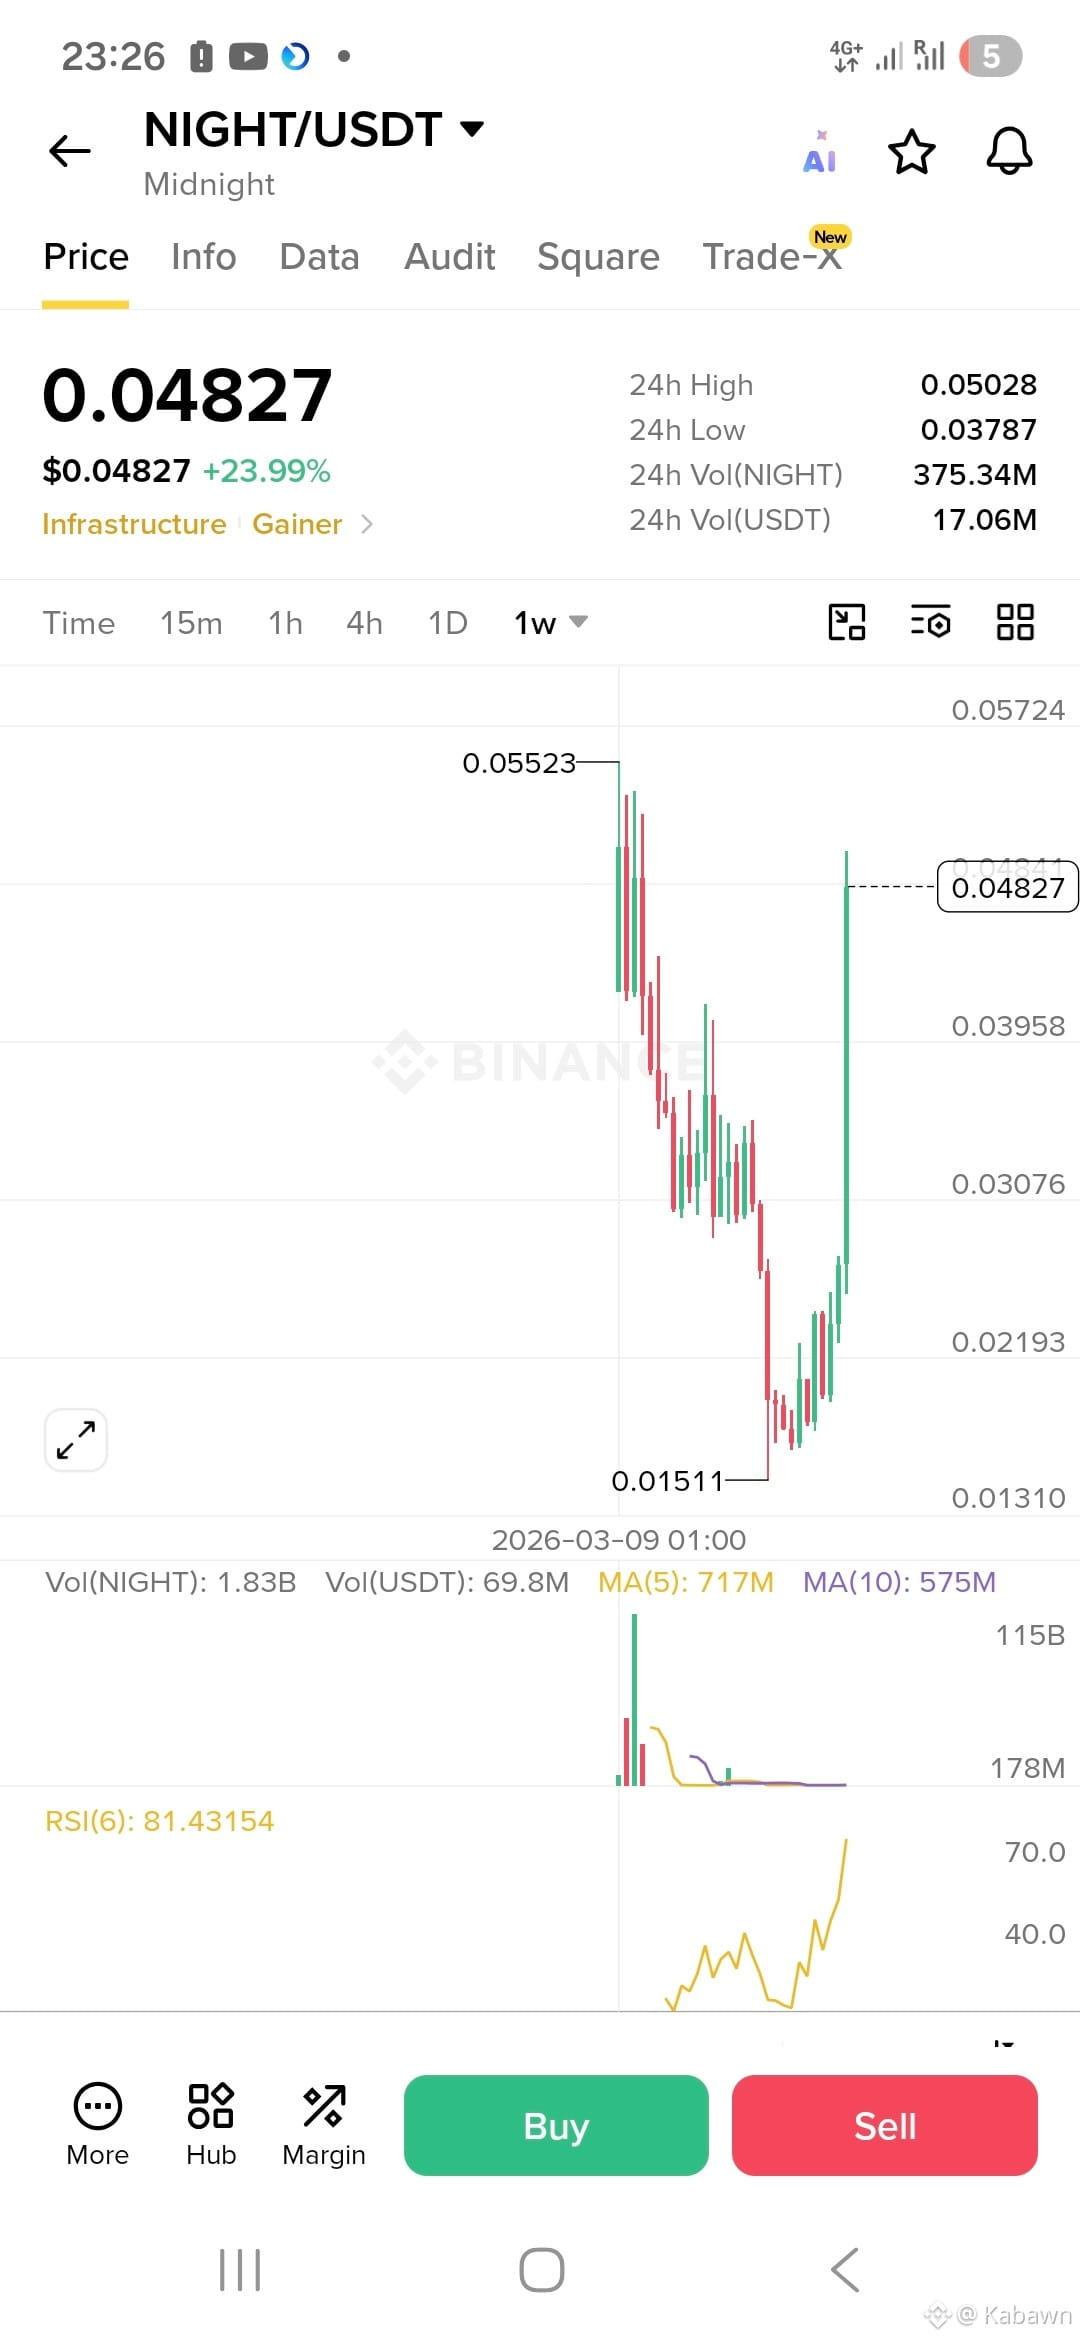
• Bottom Formation & Quick Base: Price bottomed out at 0.01511 after a sell-off from the 0.05523 high, forming a solid accumulation base.
• V-Shape Recovery: A powerful weekly green candle pushed price rapidly back up to 0.04827, mirroring SUI's aggressive recovery before breaking its ATH.
Trade Strategy:
Watch for a clean weekly close above 0.05523 for trend expansion.$NIGHT
🚀 NIGHT/USDT Analysis: Following the SUI Pattern?
Notice standard structural similarity on the weekly chart (NIGHT/USDT) comparing toSUI's historic breakout setup:
📌 Key Structure Breakdown:
• Bottom Formation & Quick Base: Price bottomed out at 0.01511 after a sell-off from the 0.05523 high, forming a solid accumulation base.
• V-Shape Recovery: A powerful weekly green candle pushed price rapidly back up to 0.04827, mirroring SUI's aggressive recovery before breaking its ATH.
Trade Strategy:
Watch for a clean weekly close above 0.05523 for trend expansion.$NIGHT
Notice standard structural similarity on the weekly chart (NIGHT/USDT) comparing toSUI's historic breakout setup:
📌 Key Structure Breakdown:
• Bottom Formation & Quick Base: Price bottomed out at 0.01511 after a sell-off from the 0.05523 high, forming a solid accumulation base.
• V-Shape Recovery: A powerful weekly green candle pushed price rapidly back up to 0.04827, mirroring SUI's aggressive recovery before breaking its ATH.
Trade Strategy:
Watch for a clean weekly close above 0.05523 for trend expansion.$NIGHT
4
1
1.6k
·
--
Bullish
🚀 NIGHT/USDT Analysis: Following the SUI Pattern?
Notice standard structural similarity on the weekly chart (NIGHT/USDT) comparing toSUI's historic breakout setup:
📌 Key Structure Breakdown:
• Bottom Formation & Quick Base: Price bottomed out at 0.01511 after a sell-off from the 0.05523 high, forming a solid accumulation base.
• V-Shape Recovery: A powerful weekly green candle pushed price rapidly back up to 0.04827, mirroring SUI's aggressive recovery before breaking its ATH.
📊 Indicators & Key Levels:
• Resistance Target: 0.05523 (Breakout confirmation zone).
• RSI (6): Currently at 81.43 (Overbought territory). Expect potential short-term consolidation or a quick retest before continuation.
💡 Trade Strategy:
Watch for a clean weekly close above 0.05523 for trend expansion, or look for entry opportunities on minor pullbacks.
Not financial advice (NFA). Always manage your risk. ⚖️
🚀 NIGHT/USDT Analysis: Following the SUI Pattern?
Notice standard structural similarity on the weekly chart (NIGHT/USDT) comparing toSUI's historic breakout setup:
📌 Key Structure Breakdown:
• Bottom Formation & Quick Base: Price bottomed out at 0.01511 after a sell-off from the 0.05523 high, forming a solid accumulation base.
• V-Shape Recovery: A powerful weekly green candle pushed price rapidly back up to 0.04827, mirroring SUI's aggressive recovery before breaking its ATH.
📊 Indicators & Key Levels:
• Resistance Target: 0.05523 (Breakout confirmation zone).
• RSI (6): Currently at 81.43 (Overbought territory). Expect potential short-term consolidation or a quick retest before continuation.
💡 Trade Strategy:
Watch for a clean weekly close above 0.05523 for trend expansion, or look for entry opportunities on minor pullbacks.
Not financial advice (NFA). Always manage your risk. ⚖️
Notice standard structural similarity on the weekly chart (NIGHT/USDT) comparing toSUI's historic breakout setup:
📌 Key Structure Breakdown:
• Bottom Formation & Quick Base: Price bottomed out at 0.01511 after a sell-off from the 0.05523 high, forming a solid accumulation base.
• V-Shape Recovery: A powerful weekly green candle pushed price rapidly back up to 0.04827, mirroring SUI's aggressive recovery before breaking its ATH.
📊 Indicators & Key Levels:
• Resistance Target: 0.05523 (Breakout confirmation zone).
• RSI (6): Currently at 81.43 (Overbought territory). Expect potential short-term consolidation or a quick retest before continuation.
💡 Trade Strategy:
Watch for a clean weekly close above 0.05523 for trend expansion, or look for entry opportunities on minor pullbacks.
Not financial advice (NFA). Always manage your risk. ⚖️
1
273
·
--

Article
AAVEThe 1M (monthly) chart of the AAVE/USDT pair appears to be forming a Double Bottom pattern, also known as a “W” pattern. This is generally considered a potentially strong bullish reversal pattern on higher timeframes.
Key Technical Details:
Double Bottom / W Pattern:
First Bottom: Formed in the lower region around the $25.93–$50 area.
Second Bottom: Formed at relatively similar levels, followed by a bullish rebound.
Neckline: The neckline is located around the previous intermediate high between the two bottoms, approximately in the $260–$300 area.
RSI (Relative Strength Index):
The RSI is showing an upward trend at around 65.37, indicating strong buying momentum and supporting the possibility of continued upward movement.
Current Price Action:
The price is currently trading around $172.10 and is moving toward a potential test of the pattern’s neckline.
Potential Trading Scenarios:
Bullish Scenario – Pattern Confirmation:
A breakout of the $260–$300 neckline area, followed by a monthly close above it, would confirm the completion of the Double Bottom pattern.
The technical target can be calculated by measuring the distance between the bottom of the pattern and the neckline, then projecting that distance upward from the breakout point. This could potentially open the way toward higher levels, possibly above $450–$500 over the long term.
Cautious Scenario:
As long as the price remains below the neckline, the pattern should be considered still in formation and not officially confirmed.
A rejection from nearby resistance levels could lead to further sideways consolidation before another attempt to break above the neckline.
Summary:
The chart presents a potentially bullish technical structure, but confirmation would require a monthly breakout and close above the $260–$300 neckline area. Until that happens, the Double Bottom remains a developing pattern rather than a confirmed reversal signal.
AAVE
The 1M (monthly) chart of the AAVE/USDT pair appears to be forming a Double Bottom pattern, also known as a “W” pattern. This is generally considered a potentially strong bullish reversal pattern on higher timeframes.
Key Technical Details:
Double Bottom / W Pattern:
First Bottom: Formed in the lower region around the $25.93–$50 area.
Second Bottom: Formed at relatively similar levels, followed by a bullish rebound.
Neckline: The neckline is located around the previous intermediate high between the two bottoms, approximately in the $260–$300 area.
RSI (Relative Strength Index):
The RSI is showing an upward trend at around 65.37, indicating strong buying momentum and supporting the possibility of continued upward movement.
Current Price Action:
The price is currently trading around $172.10 and is moving toward a potential test of the pattern’s neckline.
Potential Trading Scenarios:
Bullish Scenario – Pattern Confirmation:
A breakout of the $260–$300 neckline area, followed by a monthly close above it, would confirm the completion of the Double Bottom pattern.
The technical target can be calculated by measuring the distance between the bottom of the pattern and the neckline, then projecting that distance upward from the breakout point. This could potentially open the way toward higher levels, possibly above $450–$500 over the long term.
Cautious Scenario:
As long as the price remains below the neckline, the pattern should be considered still in formation and not officially confirmed.
A rejection from nearby resistance levels could lead to further sideways consolidation before another attempt to break above the neckline.
Summary:
The chart presents a potentially bullish technical structure, but confirmation would require a monthly breakout and close above the $260–$300 neckline area. Until that happens, the Double Bottom remains a developing pattern rather than a confirmed reversal signal.
Key Technical Details:
Double Bottom / W Pattern:
First Bottom: Formed in the lower region around the $25.93–$50 area.
Second Bottom: Formed at relatively similar levels, followed by a bullish rebound.
Neckline: The neckline is located around the previous intermediate high between the two bottoms, approximately in the $260–$300 area.
RSI (Relative Strength Index):
The RSI is showing an upward trend at around 65.37, indicating strong buying momentum and supporting the possibility of continued upward movement.
Current Price Action:
The price is currently trading around $172.10 and is moving toward a potential test of the pattern’s neckline.
Potential Trading Scenarios:
Bullish Scenario – Pattern Confirmation:
A breakout of the $260–$300 neckline area, followed by a monthly close above it, would confirm the completion of the Double Bottom pattern.
The technical target can be calculated by measuring the distance between the bottom of the pattern and the neckline, then projecting that distance upward from the breakout point. This could potentially open the way toward higher levels, possibly above $450–$500 over the long term.
Cautious Scenario:
As long as the price remains below the neckline, the pattern should be considered still in formation and not officially confirmed.
A rejection from nearby resistance levels could lead to further sideways consolidation before another attempt to break above the neckline.
Summary:
The chart presents a potentially bullish technical structure, but confirmation would require a monthly breakout and close above the $260–$300 neckline area. Until that happens, the Double Bottom remains a developing pattern rather than a confirmed reversal signal.
1
86
·
--

Article
Is October 2026 the start of the altcoin season?🚀 Is October 2026 the start of the altcoin season? 🔥
As October approaches, questions are rising about the possibility of a new altcoin season (Altseason) kicking off—especially with signs that their performance is improving relative to Bitcoin.
📊 Top indicators
Bitcoin dominance is around 58.55%, and a decline could indicate liquidity shifting toward altcoins
Is October 2026 the start of the altcoin season?
🚀 Is October 2026 the start of the altcoin season? 🔥
As October approaches, questions are rising about the possibility of a new altcoin season (Altseason) kicking off—especially with signs that their performance is improving relative to Bitcoin.
📊 Top indicators
Bitcoin dominance is around 58.55%, and a decline could indicate liquidity shifting toward altcoins
As October approaches, questions are rising about the possibility of a new altcoin season (Altseason) kicking off—especially with signs that their performance is improving relative to Bitcoin.
📊 Top indicators
Bitcoin dominance is around 58.55%, and a decline could indicate liquidity shifting toward altcoins
1
1
289
·
--
I told you before 🤑
I told you before 🤑
Kabawn
·
--
Bullish$BTC $ZEC This two coins Just hold
Bitcoin And Zec Loading ...............
Bitcoin And Zec Loading ...............
2
·
--
Bullish
Technical Analysis for $NEAR: Are We Approaching a Major Price Explosion? 💥
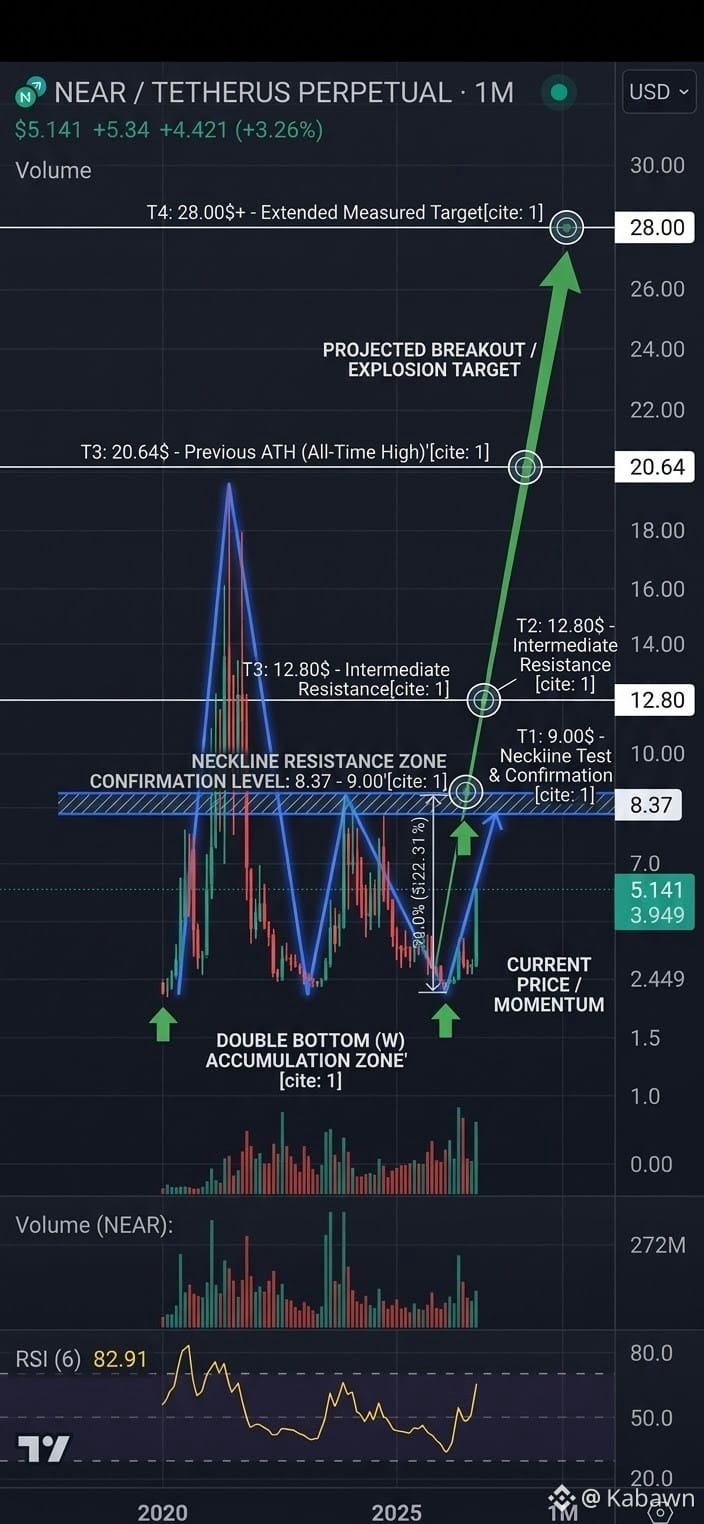
On the monthly timeframe (1M), NEAR Protocol is forming one of the strongest reversal patterns in technical analysis: the Double Bottom (W-Pattern) 📉➔📈
🔍 Technical Overview:
1️⃣ Bottoms Confirmed: The price established its first low, bounced to form the middle peak, and retraced to set a second bottom of equal strength. This highlights full absorption of selling pressure alongside a massive influx of accumulation liquidity.
2️⃣ Current Momentum: Strong bullish price action is actively driving the price upward to test the critical Neckline resistance zone.
3️⃣ Decisive Zone (Neckline): Major resistance at the neckline is concentrated between $8.00 and $9.00.
🎯 Breakout & Explosion Scenario:
Bullish Trigger: A solid monthly candle close above $9.00 officially confirms the completion of the W-Pattern.
Technical Target: Upon breaking the neckline, the path opens up to target macro levels—potentially surpassing the previous All-Time High (ATH)—given the deep structure of the pattern and strong post-accumulation liquidity.
💡 Bottom Line:
$NEAR is in a historic momentum-building phase. A confirmed breakout above the neckline could transition the asset from accumulation to an explosive trend-reversal phase over the long term.
{spot}(NEARUSDT)
Technical Analysis for $NEAR: Are We Approaching a Major Price Explosion? 💥
On the monthly timeframe (1M), NEAR Protocol is forming one of the strongest reversal patterns in technical analysis: the Double Bottom (W-Pattern) 📉➔📈
🔍 Technical Overview:
1️⃣ Bottoms Confirmed: The price established its first low, bounced to form the middle peak, and retraced to set a second bottom of equal strength. This highlights full absorption of selling pressure alongside a massive influx of accumulation liquidity.
2️⃣ Current Momentum: Strong bullish price action is actively driving the price upward to test the critical Neckline resistance zone.
3️⃣ Decisive Zone (Neckline): Major resistance at the neckline is concentrated between $8.00 and $9.00.
🎯 Breakout & Explosion Scenario:
Bullish Trigger: A solid monthly candle close above $9.00 officially confirms the completion of the W-Pattern.
Technical Target: Upon breaking the neckline, the path opens up to target macro levels—potentially surpassing the previous All-Time High (ATH)—given the deep structure of the pattern and strong post-accumulation liquidity.
💡 Bottom Line:
$NEAR is in a historic momentum-building phase. A confirmed breakout above the neckline could transition the asset from accumulation to an explosive trend-reversal phase over the long term.
On the monthly timeframe (1M), NEAR Protocol is forming one of the strongest reversal patterns in technical analysis: the Double Bottom (W-Pattern) 📉➔📈
🔍 Technical Overview:
1️⃣ Bottoms Confirmed: The price established its first low, bounced to form the middle peak, and retraced to set a second bottom of equal strength. This highlights full absorption of selling pressure alongside a massive influx of accumulation liquidity.
2️⃣ Current Momentum: Strong bullish price action is actively driving the price upward to test the critical Neckline resistance zone.
3️⃣ Decisive Zone (Neckline): Major resistance at the neckline is concentrated between $8.00 and $9.00.
🎯 Breakout & Explosion Scenario:
Bullish Trigger: A solid monthly candle close above $9.00 officially confirms the completion of the W-Pattern.
Technical Target: Upon breaking the neckline, the path opens up to target macro levels—potentially surpassing the previous All-Time High (ATH)—given the deep structure of the pattern and strong post-accumulation liquidity.
💡 Bottom Line:
$NEAR is in a historic momentum-building phase. A confirmed breakout above the neckline could transition the asset from accumulation to an explosive trend-reversal phase over the long term.
1
123
·
--
Bullish
We announce the start of the market 💥💥💥 All indexes are supported
that
$BTC
{spot}(BTCUSDT)
We announce the start of the market 💥💥💥 All indexes are supported
that
$BTC
that
$BTC
15
·
--
Bullish
as i sad before 🤑🤑🤑
as i sad before 🤑🤑🤑
Kabawn
·
--
Bullish$BTC $ZEC This two coins Just hold
Bitcoin And Zec Loading ...............
Bitcoin And Zec Loading ...............
1
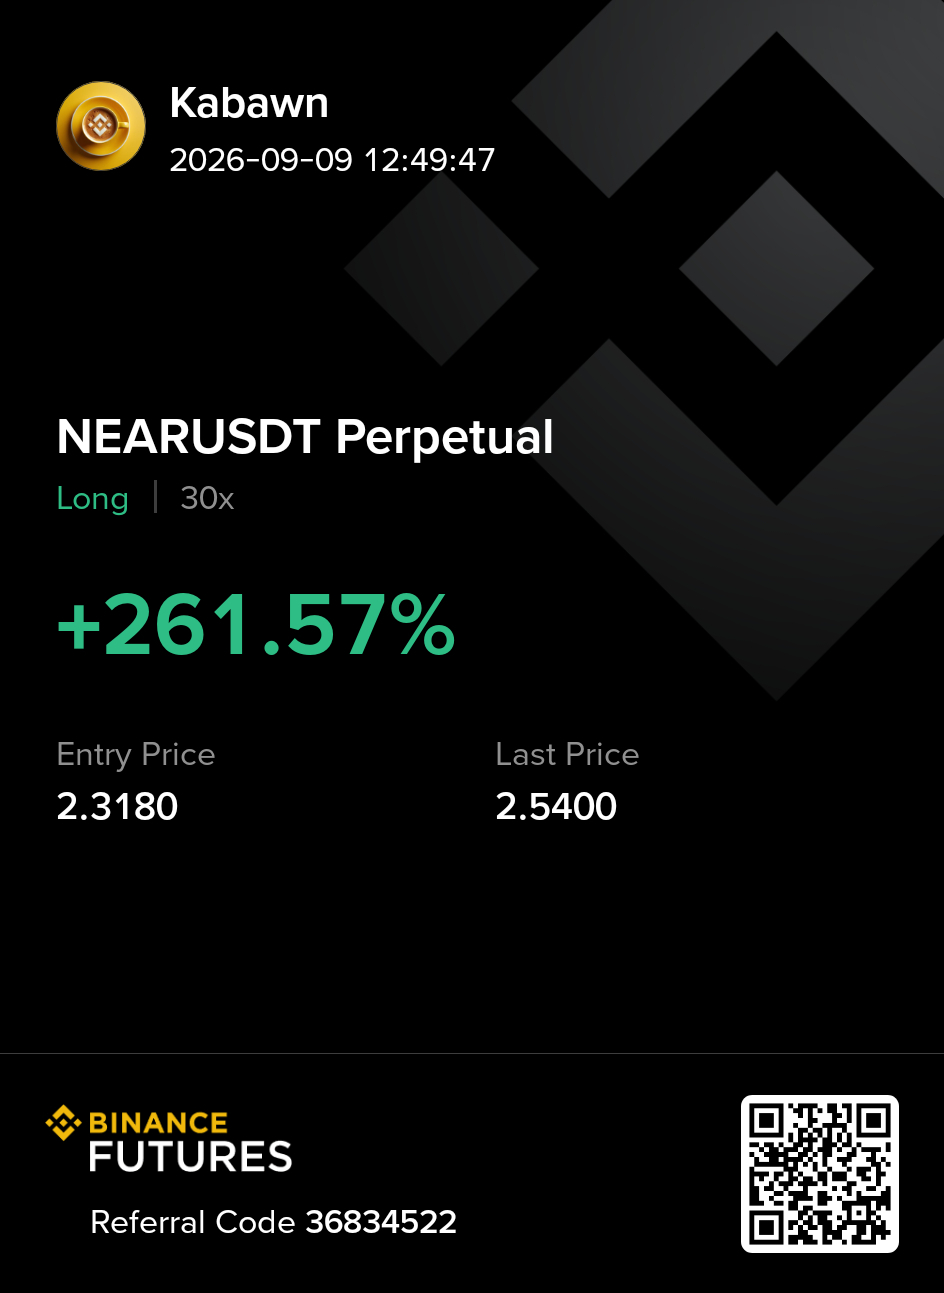
·
--
i told you 🤫
i told you 🤫
Kabawn
·
--
Bullish$BTC $ZEC This two coins Just hold
Bitcoin And Zec Loading ...............
Bitcoin And Zec Loading ...............
2
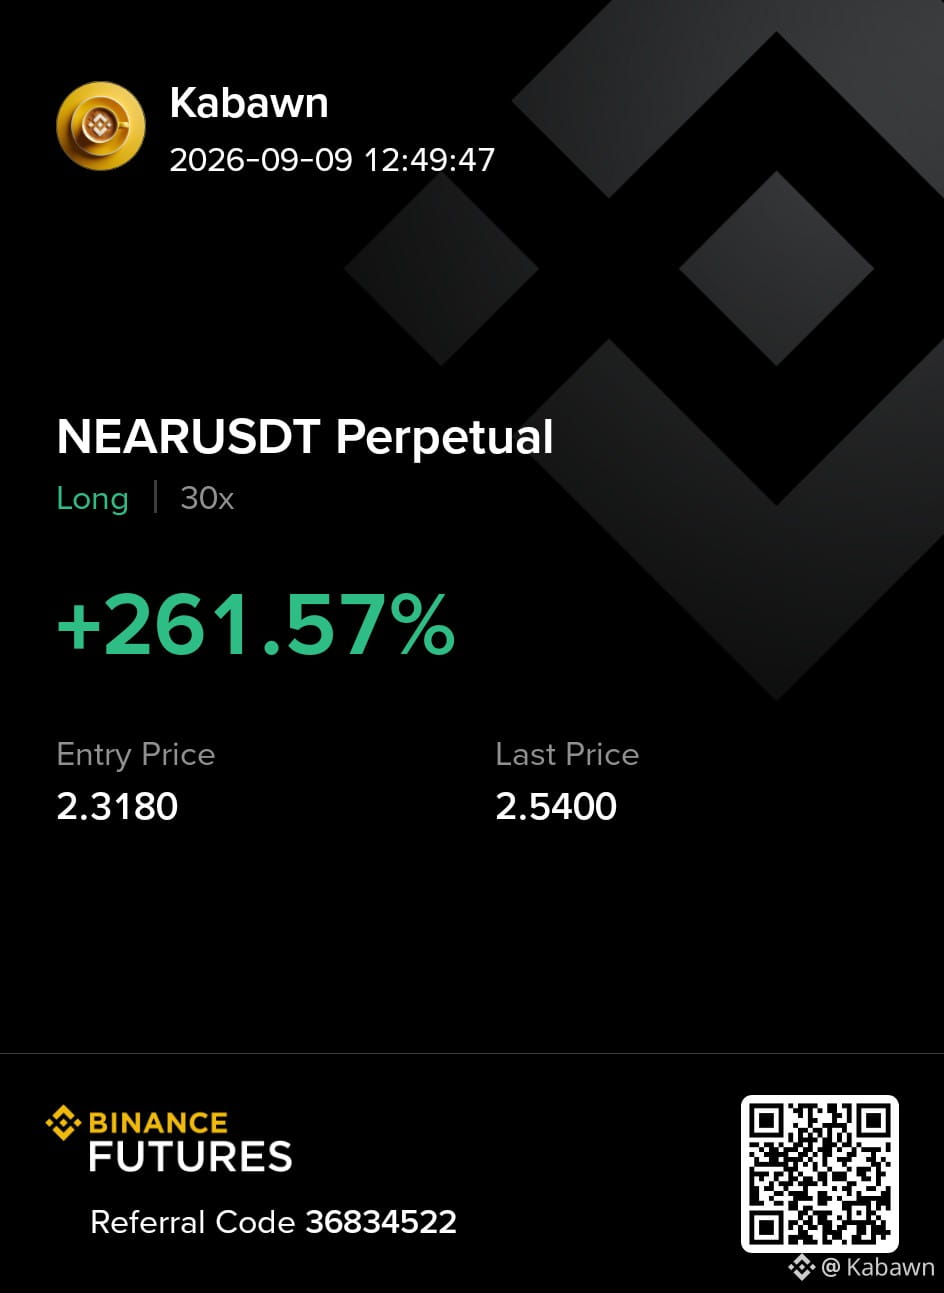
·
--
This is what I wrote months ago 🤑
This is what I wrote months ago 🤑
Kabawn
·
--
Bullish$BTC $ZEC This two coins Just hold
Bitcoin And Zec Loading ...............
Bitcoin And Zec Loading ...............
60
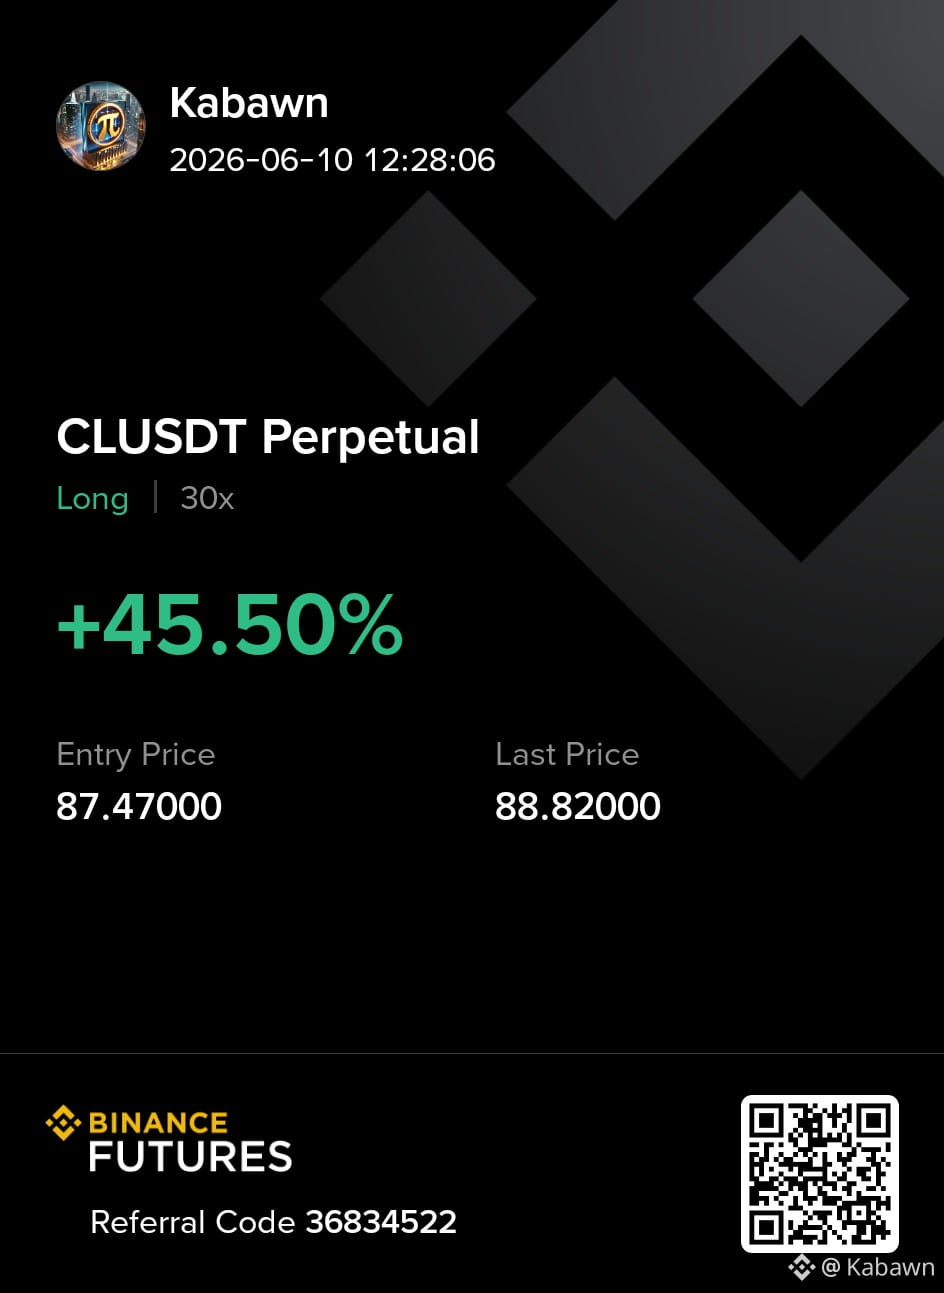
·
--
Bullish
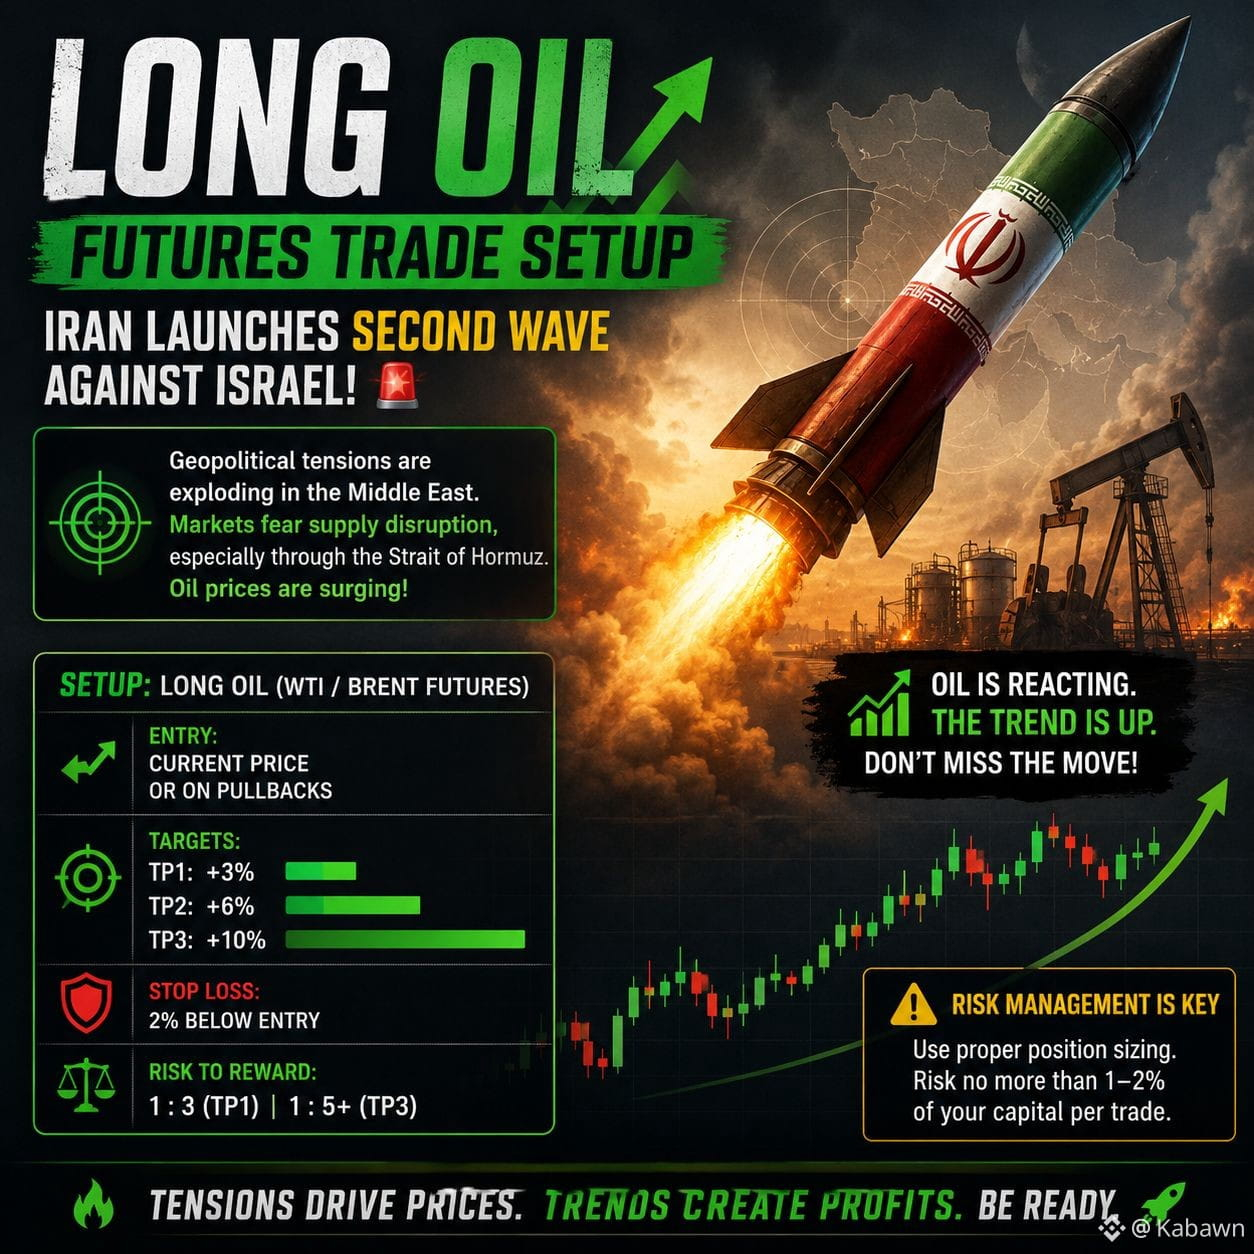
🚨🔥 LONG OIL!
Iran's second wave against Israel is fueling fears of supply disruptions.
Bulls are back in control!
🎯 TP1: +3% 🎯 TP2: +6% 🎯 TP3: +10%
🛑 SL: -2%
Risk/Reward: 1:3 to 1:5+
Tensions drive prices. Trends create profits.
🚀 Don't fight the momentum.
#Oil #WTI #Brent #Long #Futures #CrudeOil #trading
🚨🔥 LONG OIL!
Iran's second wave against Israel is fueling fears of supply disruptions.
Bulls are back in control!
🎯 TP1: +3% 🎯 TP2: +6% 🎯 TP3: +10%
🛑 SL: -2%
Risk/Reward: 1:3 to 1:5+
Tensions drive prices. Trends create profits.
🚀 Don't fight the momentum.
#Oil #WTI #Brent #Long #Futures #CrudeOil #trading
Iran's second wave against Israel is fueling fears of supply disruptions.
Bulls are back in control!
🎯 TP1: +3% 🎯 TP2: +6% 🎯 TP3: +10%
🛑 SL: -2%
Risk/Reward: 1:3 to 1:5+
Tensions drive prices. Trends create profits.
🚀 Don't fight the momentum.
#Oil #WTI #Brent #Long #Futures #CrudeOil #trading
2
255
Log in to explore more content
Join global crypto users on Binance Square
⚡️ Get latest and useful information about crypto.
💬 Trusted by the world’s largest crypto exchange.
👍 Discover real insights from verified creators.
Email / Phone number
Trending Topics
FedMinutesFocusOnOctoberPause
12,992 views
335 Discussing
#fedminutesfocusonoctoberpause
🚨 OCTOBER FED HIKE ODDS COLLAPSE TO 21.6%… Is $BTC About to React? 👀
The Fed is about to give markets another major clue.
Investors are waiting for today’s FOMC minutes — and the biggest question is whether October brings another rate hike… or a pause.
Right now, the odds of a 25-basis-point October hike have fallen to just 21.6%.
That’s a huge shift in expectations.
But here’s what makes this interesting… 👀
The Fed raised rates to 3.75%–4.00% in September, but recent weakness in jobs data and softer inflation have made another immediate hike look less certain.
And for crypto, this matters.
A Fed pause could reduce pressure on financial conditions and potentially improve risk appetite.
That could become a tailwind for BTC
But there’s a catch…
Bitcoin is already under pressure as the dollar and Treasury yields move higher.
So tonight’s minutes could become a volatility trigger.
Dovish Fed → liquidity hopes → bullish .
BTC narrative?
Hawkish Fed → higher-rate fears → more pressure on risk assets?
The real question:
Is October becoming the pause Bitcoin bulls have been waiting for… or could the Fed surprise the market again? 👀
Watch BTC + Fed expectations + Treasury yields closely.
#FederalReserve #Fed #Crypto #InterestRates
$ETH
$SOL
Shae Cassler Sw9r
·12 Likes
·27.4k views
BinanceLaunchesBinanceIntelligence
921,714 views
5,605 Discussing
RobinhoodAdds$25MInBitcoinToBalanceSheet
724 views
28 Discussing