

KiQabeela
6.3k Posts

KiQabeela
Report
Block User
Crypto enthusiasts strongly believe in the decentralized blockchain architecture and feel that it solves many problems both financially and politically.
181 Following
848 Followers
1.8K+ Liked
Posts
All
Quotes
Videos
·
--
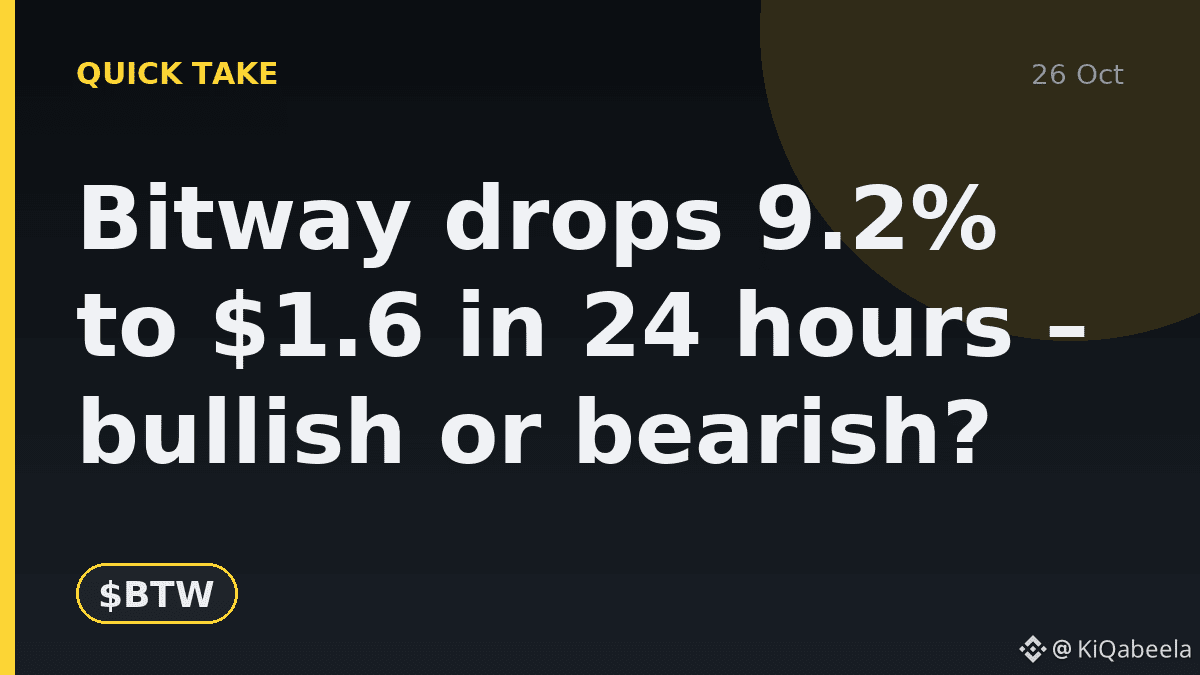
Bitway drops 9.2% to $1.6 in 24 hours – bullish or bearish?
The token slipped to $1.6, trading between a high of $1.92 and a low of $1.65. Volume sat at $4,535,546, showing modest activity despite the price swing.
The Fear & Greed index reads 54, a neutral stance, suggesting the market isn’t overly optimistic or scared. That neutrality makes the dip stand out.
💬 Sentiment?
$BTW
#Bitway #CryptoNews
15
·
--
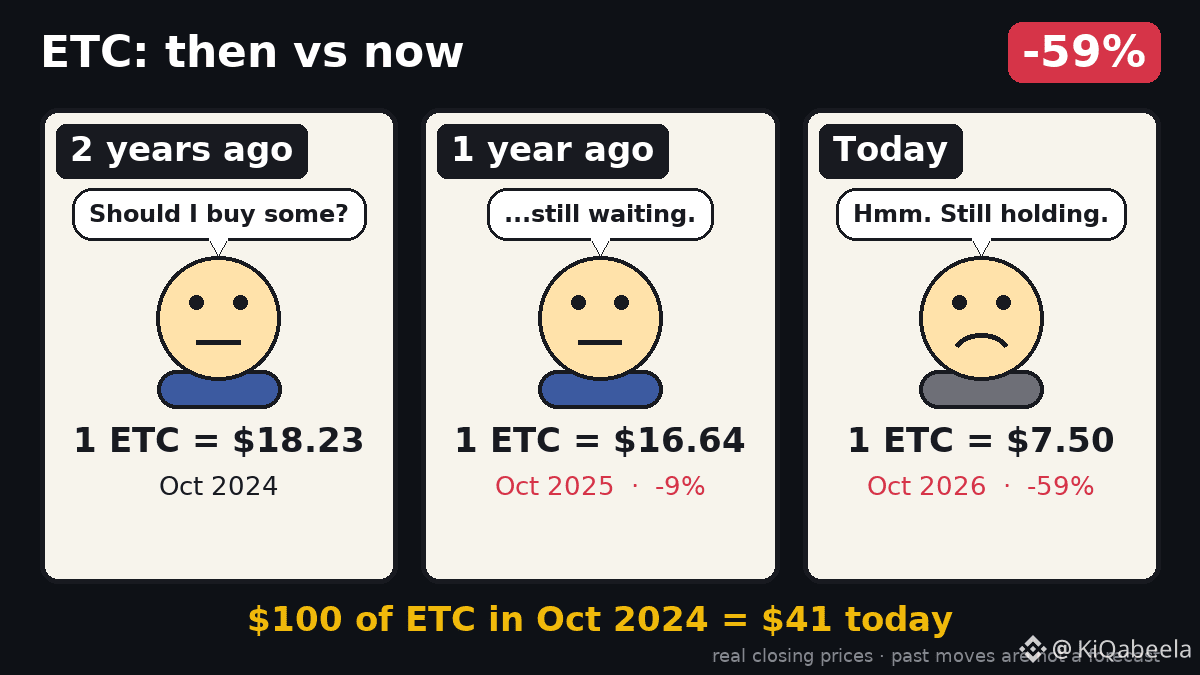
ETC fell 59% since last October, turning $100 into $41.
A $100 buy on 2024‑10‑26 would now be worth just $41, a stark reminder of market swings. The price slid from $18.23 to $7.50 over two years, erasing more than half the investment.
Past moves say nothing about the next ones.
💬 Holder?
$ETC
ETC fell 59% since last October, turning $100 into $41.
A $100 buy on 2024‑10‑26 would now be worth just $41, a stark reminder of market swings. The price slid from $18.23 to $7.50 over two years, erasing more than half the investment.
Past moves say nothing about the next ones.
💬 Holder?
$ETC
A $100 buy on 2024‑10‑26 would now be worth just $41, a stark reminder of market swings. The price slid from $18.23 to $7.50 over two years, erasing more than half the investment.
Past moves say nothing about the next ones.
💬 Holder?
$ETC
11
·
--
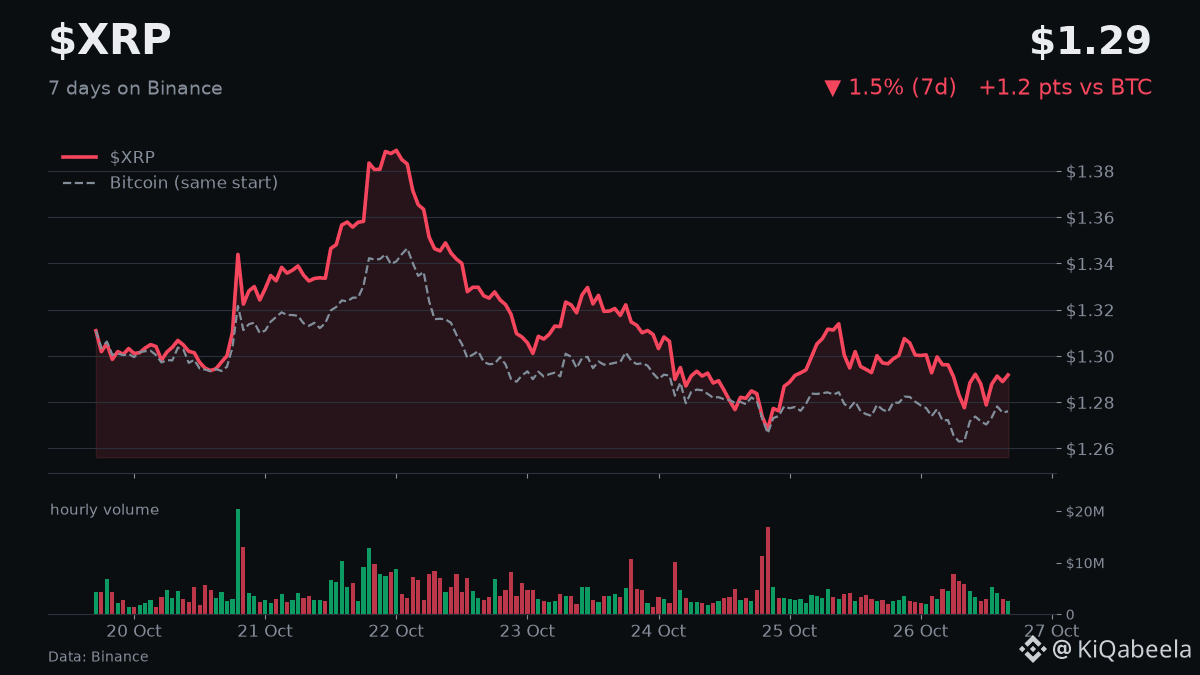
XRP slides 0.6% to $1.29 as Aviva tokenizes $29 billion fund.
📌 What happened
Aviva Investors launched a tokenized share class of its $29 billion Sterling Liquidity Fund on the Ripple‑backed XRP Ledger, per The Block.
🔍 Why it matters
• XRP’s price dipped 0.6% to $1.29, showing immediate market reaction.
• 24‑hour volume is $86 M, only 0.8× its 7‑day average, indicating lighter trading activity.
• Futures funding is +0.010%, meaning longs are paying shorts, a modest cost for bullish positions.
👀 What to watch
• Open interest rose 1% to $394 M, suggesting growing interest in XRP contracts.
• Risk: lower volume could lead to higher price volatility if larger orders hit the market.
💬 Bullish or bearish? One word.
$XRP
7
·
--
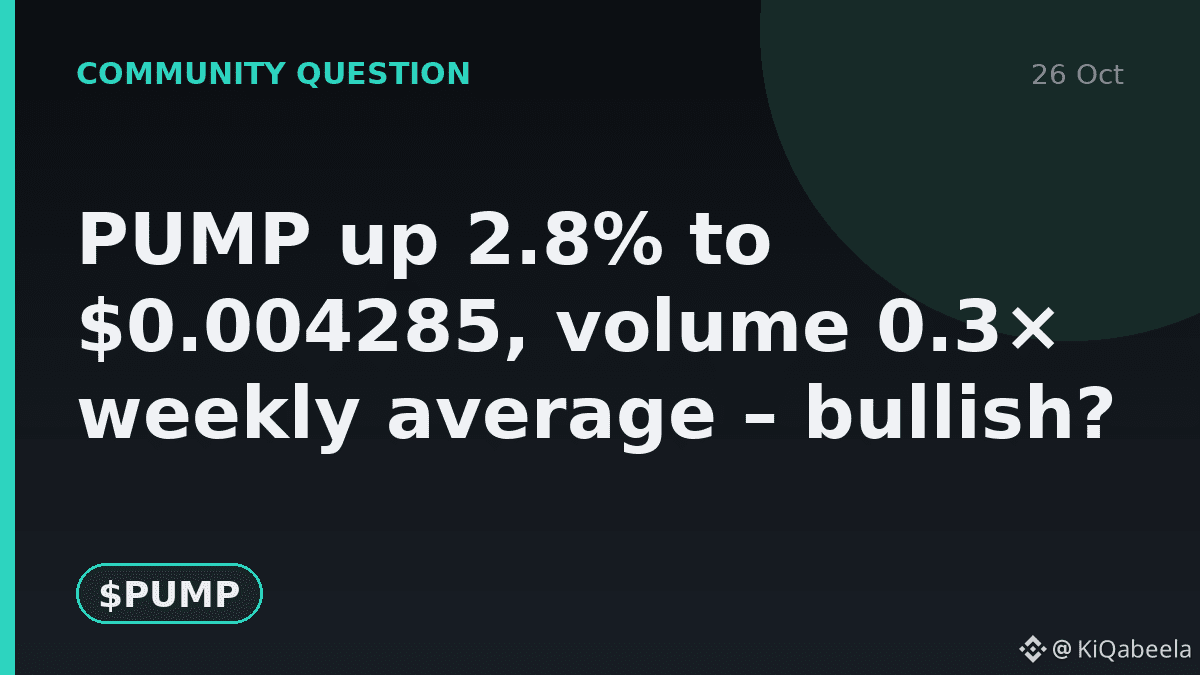
PUMP up 2.8% to $0.004285, volume 0.3× weekly average – bullish?
What do you think drives this price gap?
A) Hidden large‑address acquisitions
B) Low trading volume creating volatility
C) Market speculation on the study findings
💬 Drop your pick below.
$PUMP
#PumpGap #CryptoInsights
PUMP up 2.8% to $0.004285, volume 0.3× weekly average – bullish?
What do you think drives this price gap?
A) Hidden large‑address acquisitions
B) Low trading volume creating volatility
C) Market speculation on the study findings
💬 Drop your pick below.
$PUMP
#PumpGap #CryptoInsights
What do you think drives this price gap?
A) Hidden large‑address acquisitions
B) Low trading volume creating volatility
C) Market speculation on the study findings
💬 Drop your pick below.
$PUMP
#PumpGap #CryptoInsights
3
·
--
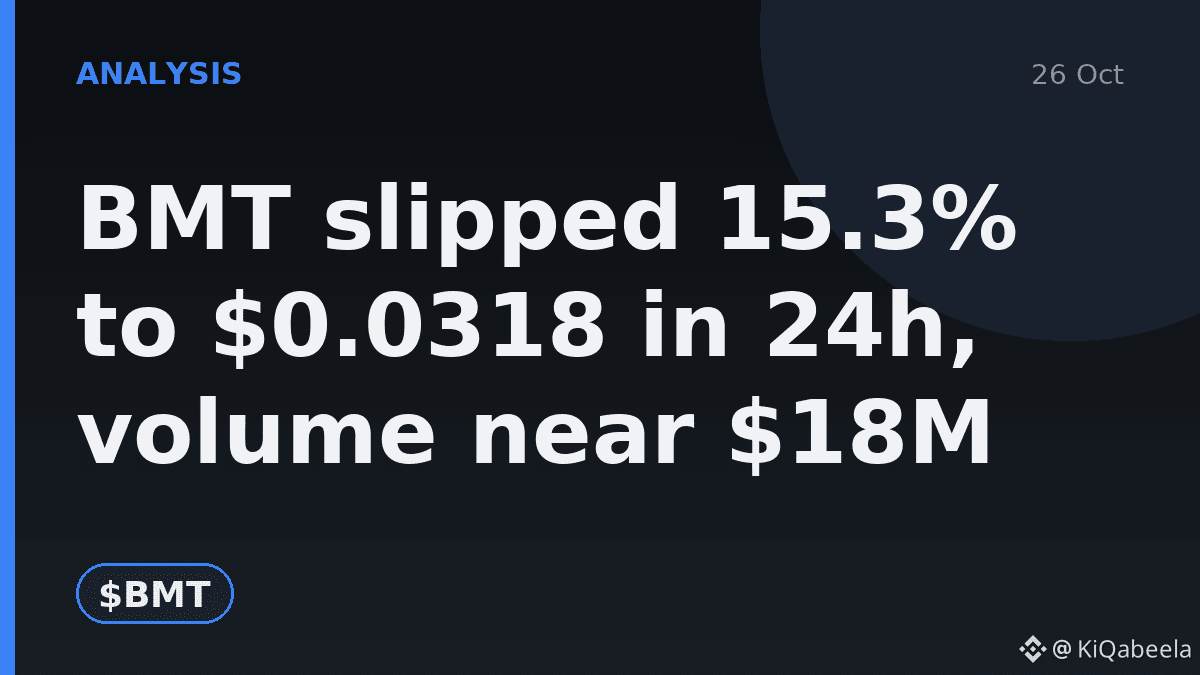
BMT slipped 15.3% to $0.0318 in 24h, volume near $18M
📌 What happened
BMT dropped to $0.03175, down 15.31% over the last day, with trading volume around $18 million on Binance.
🔍 Why it matters
• The 24‑hour price change of –17.0% shows a sharper decline than the headline figure.
• 7‑day gain of +101% versus Bitcoin’s flat move highlights BMT’s recent outperformance.
• Funding at –0.015% means shorts are paying longs, indicating bearish pressure in futures.
👀 What to watch
• Open interest fell 16% to $7 million, suggesting traders may be exiting positions.
• Risk: Volume is only 0.9× its 7‑day average, hinting at waning liquidity that could amplify price swings.
💬 How do you see BMT’s short‑term outlook? One word.
$BMT
1
·
--
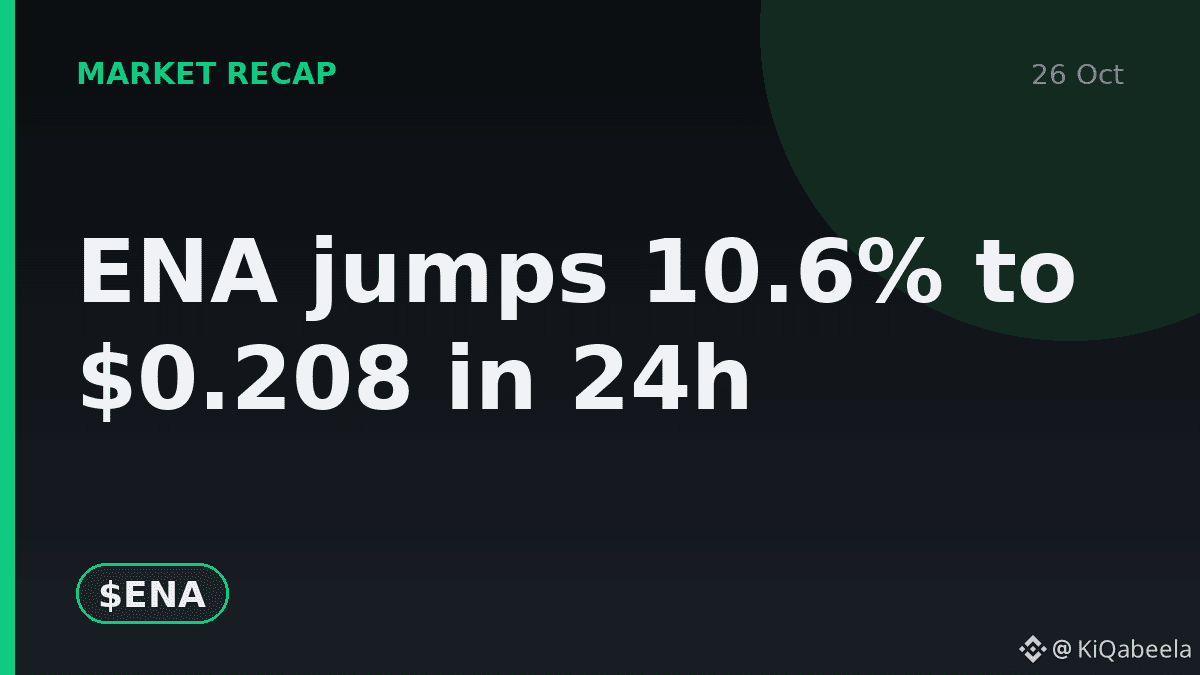
ENA jumps 10.6% to $0.208 in 24h
📊 By the numbers
• ENA up +10.7% in 24h, matching the price rally.
• 24h volume $28M, only 0.7× its 7‑day average, showing weaker trading activity.
• Open interest $105M, up 14% in 24h, indicating more contracts are being added.
• Funding rate +0.005%, meaning longs are paying shorts to hold positions.
🎯 Levels to watch
If the price breaks above the recent high $0.20873, upside could test the 30‑day peak. A pullback toward the low $0.1879 may trigger short‑covering pressure, but the low volume and modest funding suggest caution.
Bullish, bearish or waiting? One word.
$ENA
#ENAMovement #BinanceData
3
·
--
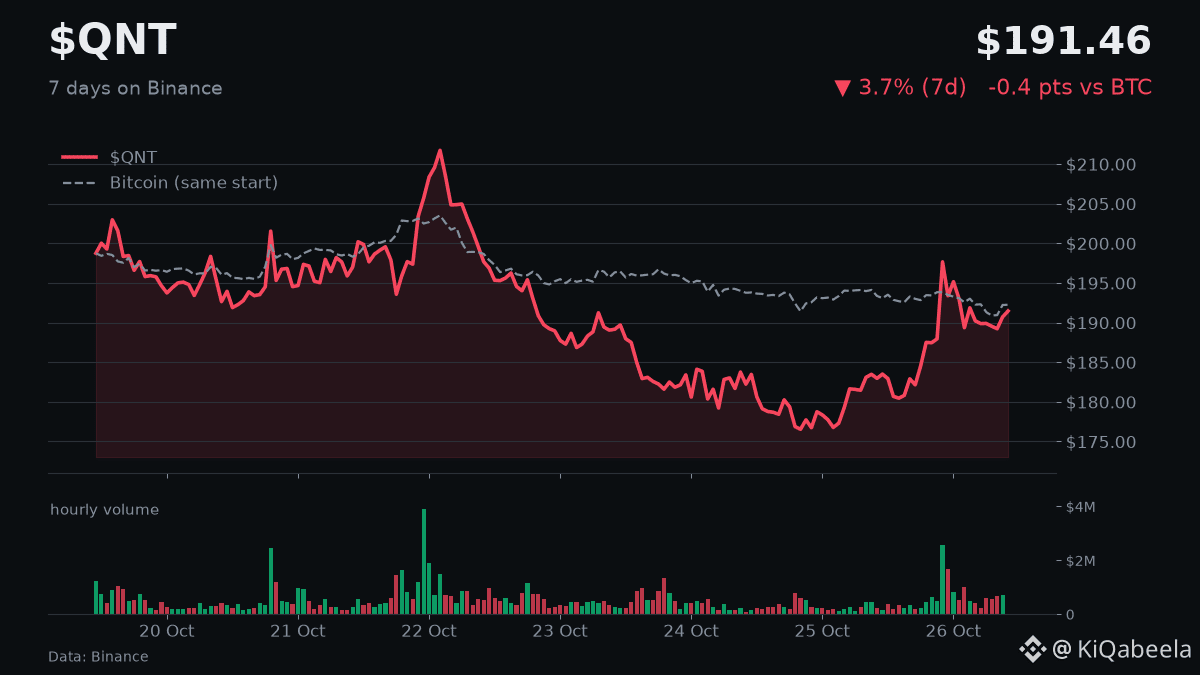
Quant jumps 11.6% to $195.9 in 24h
📌 What happened
Quant ($QNT) rose 11.56% to $195.9, trading near $197 per Binance data.
🔍 Why it matters
• Binance shows a 11.7% rise, confirming strong short‑term momentum.
• 24‑hour volume is only 0.7× its 7‑day average, hinting thin liquidity.
• Futures funding is -0.011%, meaning shorts are paying longs to hold positions.
👀 What to watch
• Open interest grew 7% to $29 M, indicating more capital entering the market.
• A 1.03 long‑to‑short account ratio suggests a slight bias toward longs, but thin volume could amplify swings – a risk to consider.
💬 Bullish or bearish?
Quant jumps 11.6% to $195.9 in 24h
📌 What happened
Quant ($QNT ) rose 11.56% to $195.9, trading near $197 per Binance data.
🔍 Why it matters
• Binance shows a 11.7% rise, confirming strong short‑term momentum.
• 24‑hour volume is only 0.7× its 7‑day average, hinting thin liquidity.
• Futures funding is -0.011%, meaning shorts are paying longs to hold positions.
👀 What to watch
• Open interest grew 7% to $29 M, indicating more capital entering the market.
• A 1.03 long‑to‑short account ratio suggests a slight bias toward longs, but thin volume could amplify swings – a risk to consider.
💬 Bullish or bearish?
30
·
--
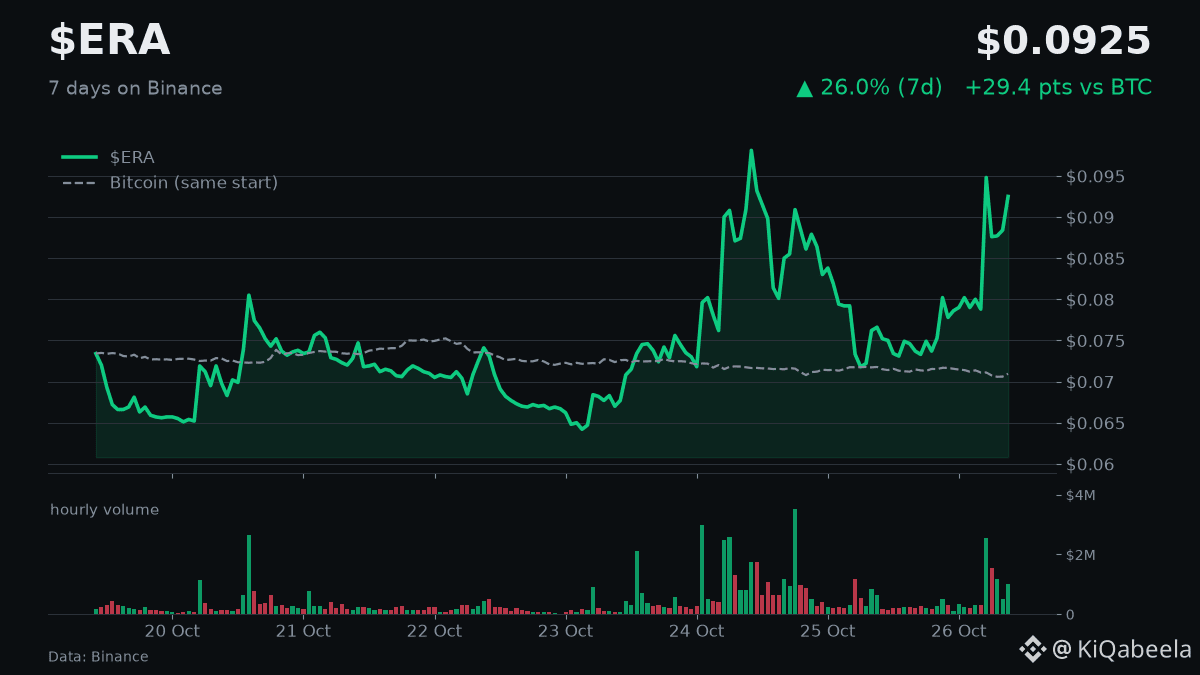
ERA jumps 17% in 24h, trading around $0.0855
📊 By the numbers
• Price up +19.1% to $0.0855
• 24h volume $10M, only 0.9× its 7‑day average
• 7‑day move +16% versus Bitcoin –3%
• Funding –0.152%, meaning shorts are paying longs
🎯 Levels to watch
If buying pressure holds, $0.09 could act as near‑term resistance; a break below $0.07 may trigger a correction. Risk: volume remains low, suggesting the rally could fizzle.
Bullish, bearish or waiting? One word.
$ERA
#ERAToken #AltSeason
31
·
--
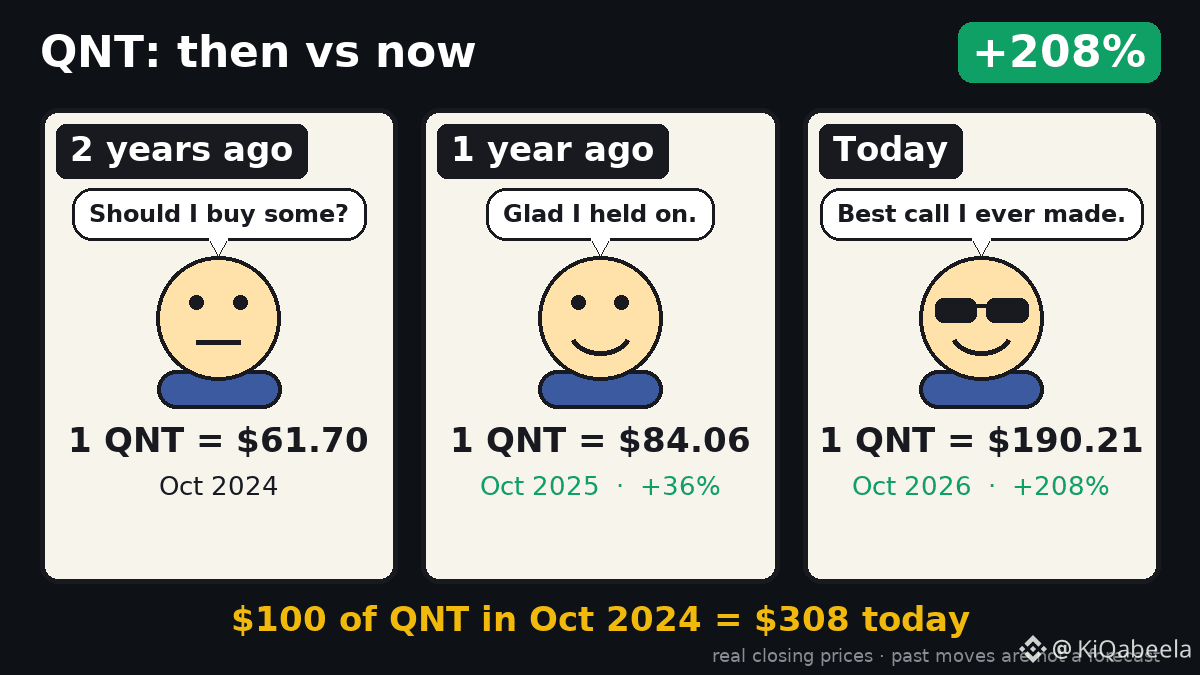
QNT surged 208% since last October, turning $100 into $308.
A $100 stake on 2024‑10‑26 would now sit at $308, showing how the token climbed from $61.7 to $190.2. That kind of jump feels like a missed coffee‑break opportunity for anyone who watched the chart.
Past moves say nothing about the next ones.
💬 Holder?
$QNT
A $100 stake on 2024‑10‑26 would now sit at $308, showing how the token climbed from $61.7 to $190.2. That kind of jump feels like a missed coffee‑break opportunity for anyone who watched the chart.
Past moves say nothing about the next ones.
💬 Holder?
$QNT
59
·
--
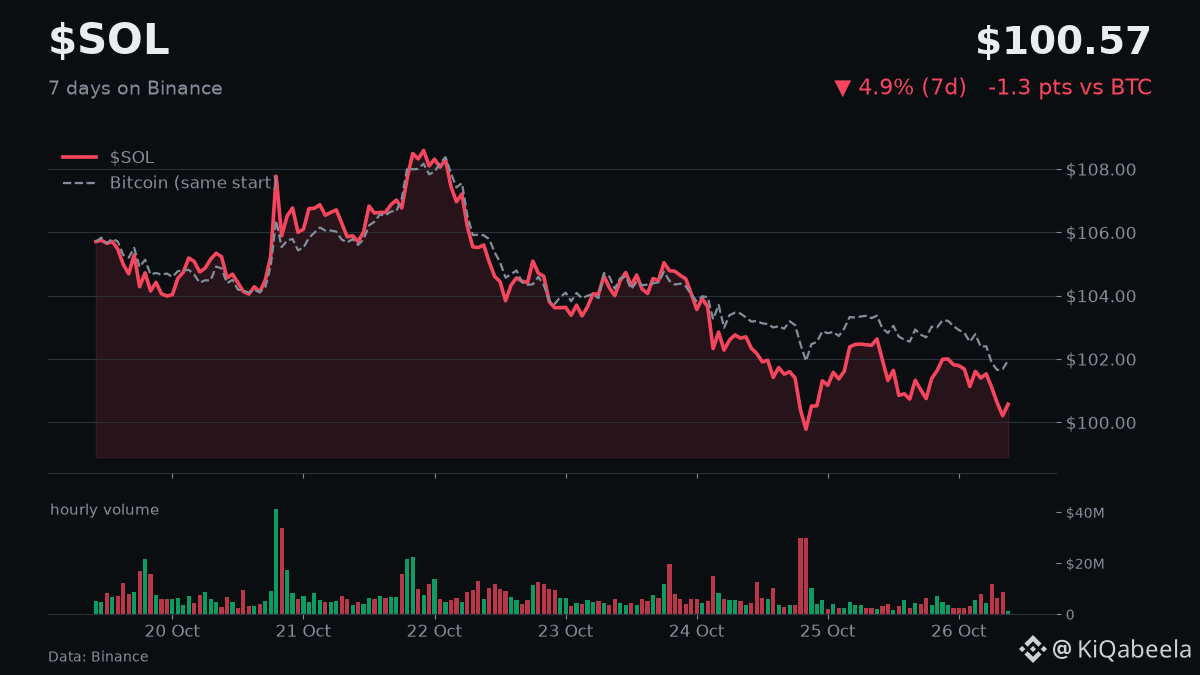
Solana drops 1.8% to $100.58 as Hong Kong validator plans launch
📌 What happened
Solana fell 1.8% to $100.58 after a Nasdaq‑listed firm announced plans to set up validator operations in Hong Kong, per Cointelegraph.
🔍 Why it matters
• The 24‑hour volume is only 0.6× its 7‑day average, indicating reduced trading activity.
• Funding is +0.010%, so long traders are paying short traders, hinting at bearish pressure.
• A 7‑day decline of 5% versus Bitcoin’s 4% shows SOL underperforming the market.
👀 What to watch
• Open interest rose 1% to $886 M, suggesting growing positions despite the dip.
• Risk: lower volume could amplify price swings, making short‑term moves unpredictable.
💬 Question: Bullish or bearish? One word.
$SOL
#SolanaNews #HKValidator
53
·
--
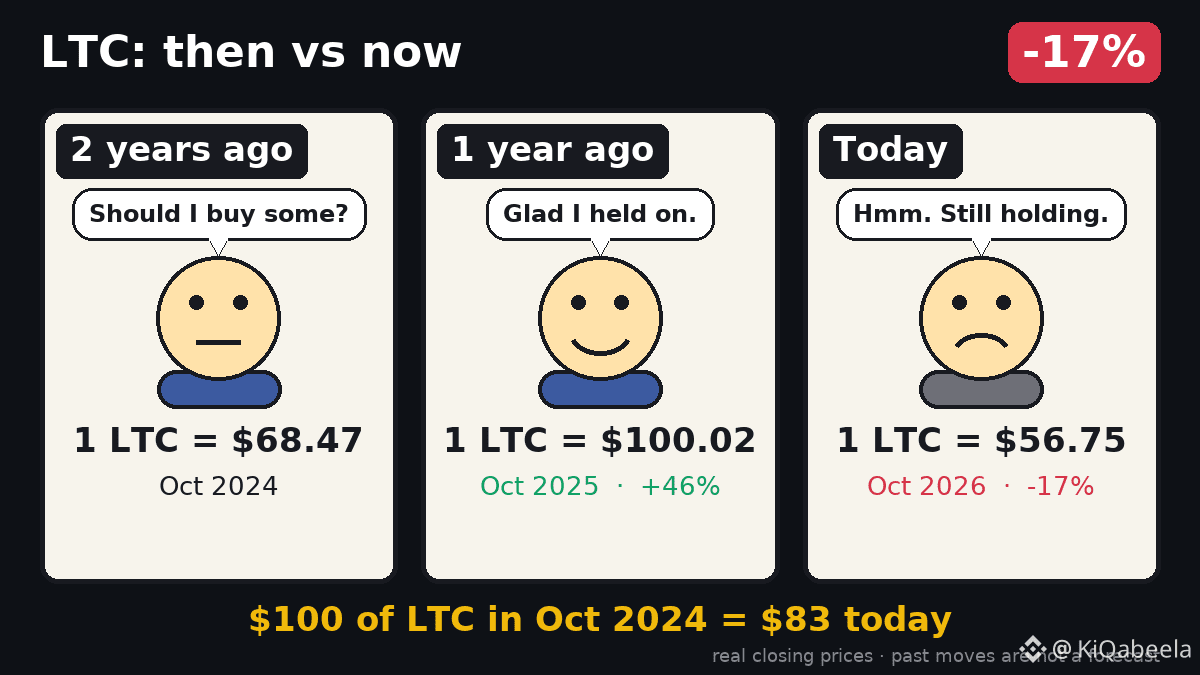
LTC fell from $68.47 to $56.75, a 17% dip since Oct 2024. If you’d bought $100 of LTC back then, it’d be worth about $83 today.
The slide shows how quickly market sentiment can swing, turning a modest gain into a modest loss. It’s a reminder that timing the market is tough and even solid‑performing assets can wobble.
Past moves say nothing about the next ones.
💬 Holder? LTCprice ThenVsNow
$LTC
#LTCprice #ThenVsNow
The slide shows how quickly market sentiment can swing, turning a modest gain into a modest loss. It’s a reminder that timing the market is tough and even solid‑performing assets can wobble.
Past moves say nothing about the next ones.
💬 Holder? LTCprice ThenVsNow
$LTC
#LTCprice #ThenVsNow
76
·
--
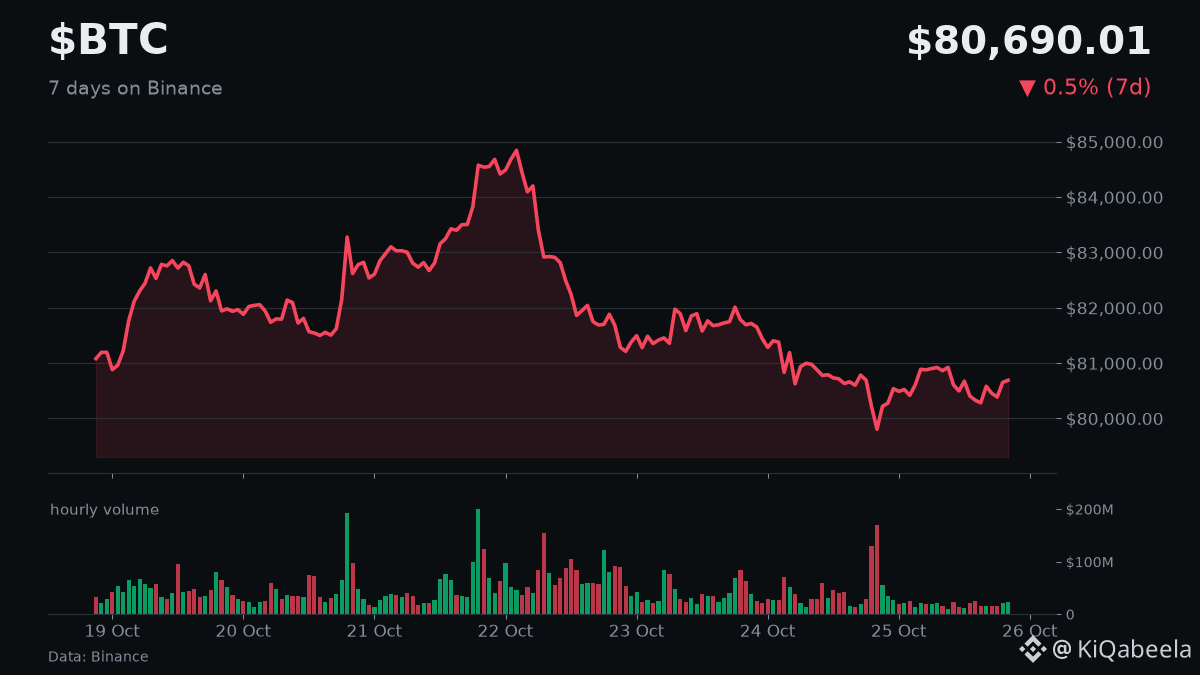
Spot Bitcoin ETFs pull in $301M, ending two‑week outflow streak.
The inflow signals renewed investor appetite despite recent outflows that kept October negative.
$BTC is up 0.2% at $80,375, but 24h volume sits at half its weekly average, hinting limited trading enthusiasm. Funding is +0.008%, so longs are paying shorts. Open interest slipped 2% to $7.5B and long‑to‑short accounts sit at 2.07‑to‑1.
My view: the modest price rise paired with thin volume suggests the ETF money may be more about portfolio rebalancing than fresh buying power.
💬 Bullish, bearish or waiting? One word.
#BitcoinETF #SpotETF
2
·
--
DOT drops 4.4% as a wallet breach highlights fast exit risks
📌 What happened
Polkadot’s price fell 4.4% to $1.01 after a 20‑month wallet breach was disclosed.
🔍 Why it matters
• 24h volume is only 0.8× its 7‑day average, showing reduced trading activity.
• Funding rate is -0.006%, meaning shorts are paying longs.
• Open interest rose 3% to $34M, indicating growing interest in futures.
👀 What to watch
• Continued price pressure could push DOT further below its 30‑day high.
• Risk: Faster nominator exit times may leave users exposed to rapid withdrawals.
💬 Bullish or bearish? One word.
$DOT
#Polkadot #WalletBreach
5
·
--
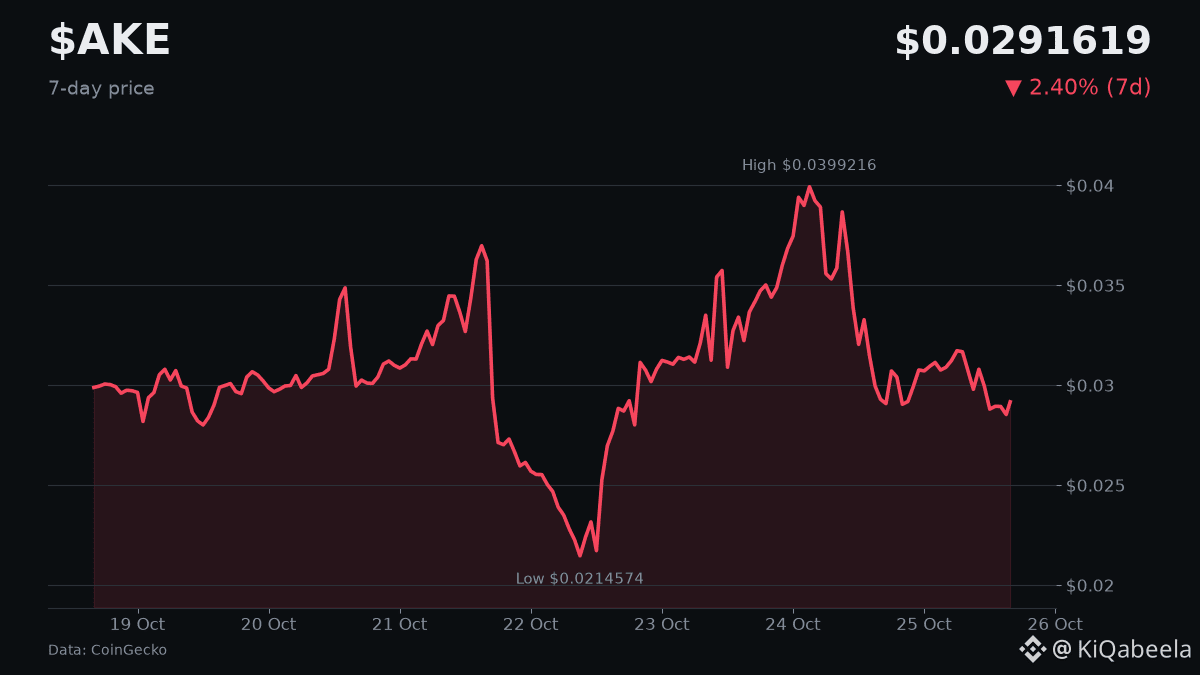
Akedo drops 20.4% in 24h, rebound?
The token slid to $0.031, with volume hitting $35 million, showing solid activity despite the dip. A neutral Fear & Greed index at 51 suggests the market isn’t overly panic‑filled.
My take: the sharp 20% pull‑back could set up a short‑term buying opportunity if buyers step in at the $0.028 low.
💬 Do you think $AKE will recover today?
17
·
--
ATOM fell 9.4% in 24h, volume only 0.8× its weekly average?
Which factor most likely explains ATOM's slide?
A) Lower funding rate hurting longs
B) Reduced trading volume
C) Market sentiment shift
💬 Drop your pick below.
Bullish, bearish or neutral? One word.
$ATOM
#ATOM #CryptoNews
ATOM fell 9.4% in 24h, volume only 0.8× its weekly average?
Which factor most likely explains ATOM's slide?
A) Lower funding rate hurting longs
B) Reduced trading volume
C) Market sentiment shift
💬 Drop your pick below.
Bullish, bearish or neutral? One word.
$ATOM
#ATOM #CryptoNews
Which factor most likely explains ATOM's slide?
A) Lower funding rate hurting longs
B) Reduced trading volume
C) Market sentiment shift
💬 Drop your pick below.
Bullish, bearish or neutral? One word.
$ATOM
#ATOM #CryptoNews
7
·
--
Worldcoin fell 11.3% today, is sentiment turning bearish?
Given the volume surge and funding rate, what’s the likely short‑term bias?
A) Bullish
B) Bearish
C) Neutral
💬 Drop your pick below.
$WLD
#Worldcoin #MarketMove
Worldcoin fell 11.3% today, is sentiment turning bearish?
Given the volume surge and funding rate, what’s the likely short‑term bias?
A) Bullish
B) Bearish
C) Neutral
💬 Drop your pick below.
$WLD
#Worldcoin #MarketMove
Given the volume surge and funding rate, what’s the likely short‑term bias?
A) Bullish
B) Bearish
C) Neutral
💬 Drop your pick below.
$WLD
#Worldcoin #MarketMove
80
·
--
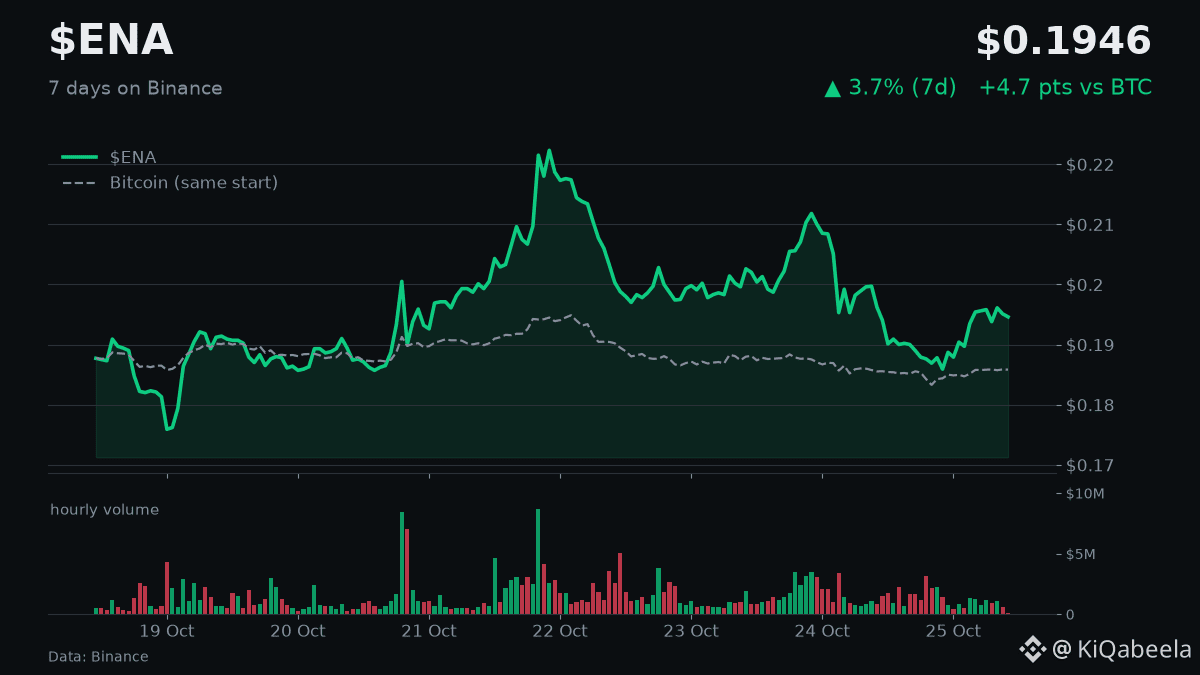
ENA slipped 9.4% in 24h, volume half its weekly average, bearish?
Binance shows ENA at $0.1958, down 1.6% over 24h. Trading volume $31M is only 0.8× its 7‑day average, indicating weaker participation.
Despite the drop, the 7‑day move is +2% while Bitcoin fell 1%, and funding is +0.005% meaning longs are paying shorts. Open interest slipped 1% to $95M, and there are 1.58 long accounts per short account.
💬 Outlook?
$ENA
79
·
--
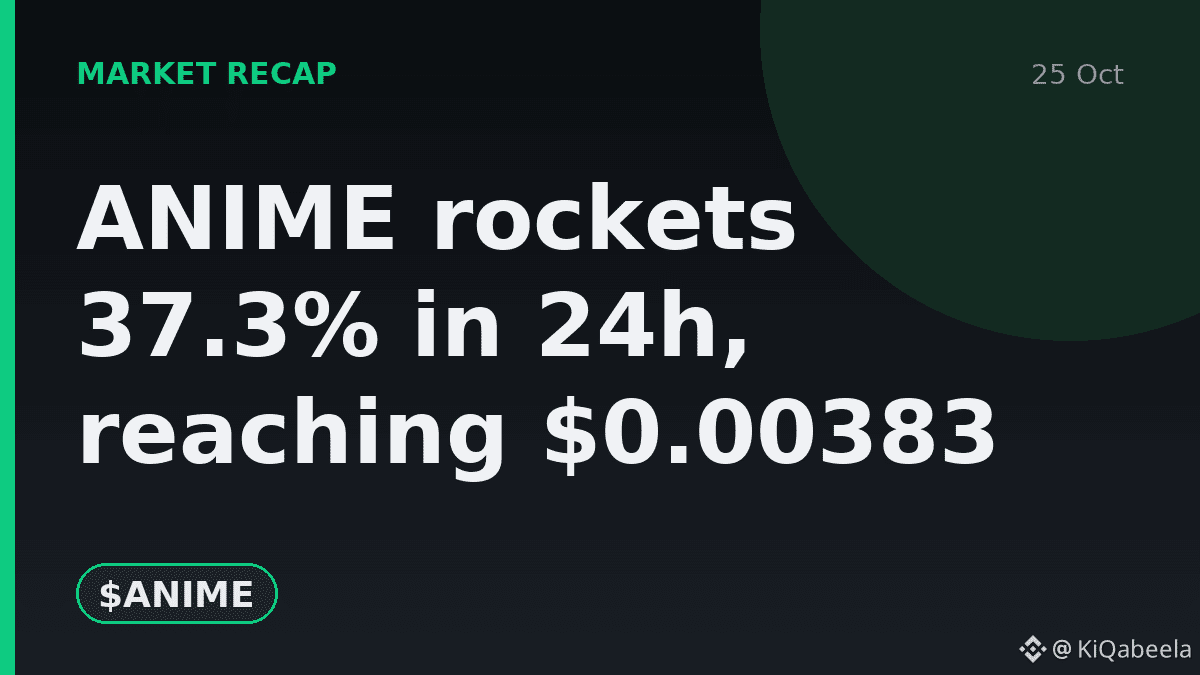
ANIME rockets 37.3% in 24h, reaching $0.00383
📊 By the numbers
• 24h volume $10M, 28.9× its 7‑day average
• 7‑day move +38% while Bitcoin fell 1%
• Open interest $4M, up 268% in 24h
• Funding -1.396%, shorts paying longs
🎯 Levels to watch
Potential pullback as price sits 10% below its 30‑day high; funding negative may pressure longs.
Bullish or cautious? One word.
$ANIME
#AnimeSurge #BinanceData
118
·
--
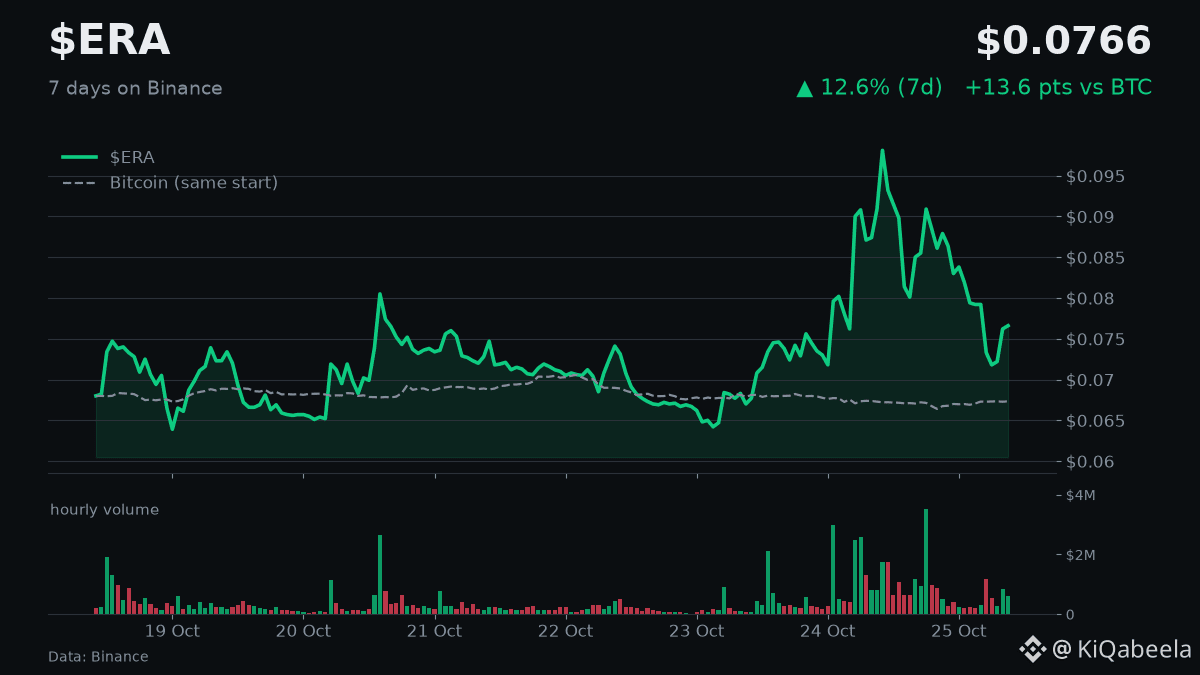
ERA jumps 15.8% to $0.085, volume spikes 3.7‑times its norm
📊 By the numbers
• 24h change +18.4% at $0.0850
• Volume $28M, 3.7× its 7‑day average
• 7‑day gain +36% while Bitcoin fell 1%
• Funding -0.065%, shorts pay longs
🎯 Levels to watch
If ERA holds above its 24h high $0.1031 it could keep climbing, but a dip back toward the 24h low $0.0709 may trigger sellers, especially as funding remains negative.
Bullish or cautious? One word.
$ERA
#ERA #BinanceData
240
·
--
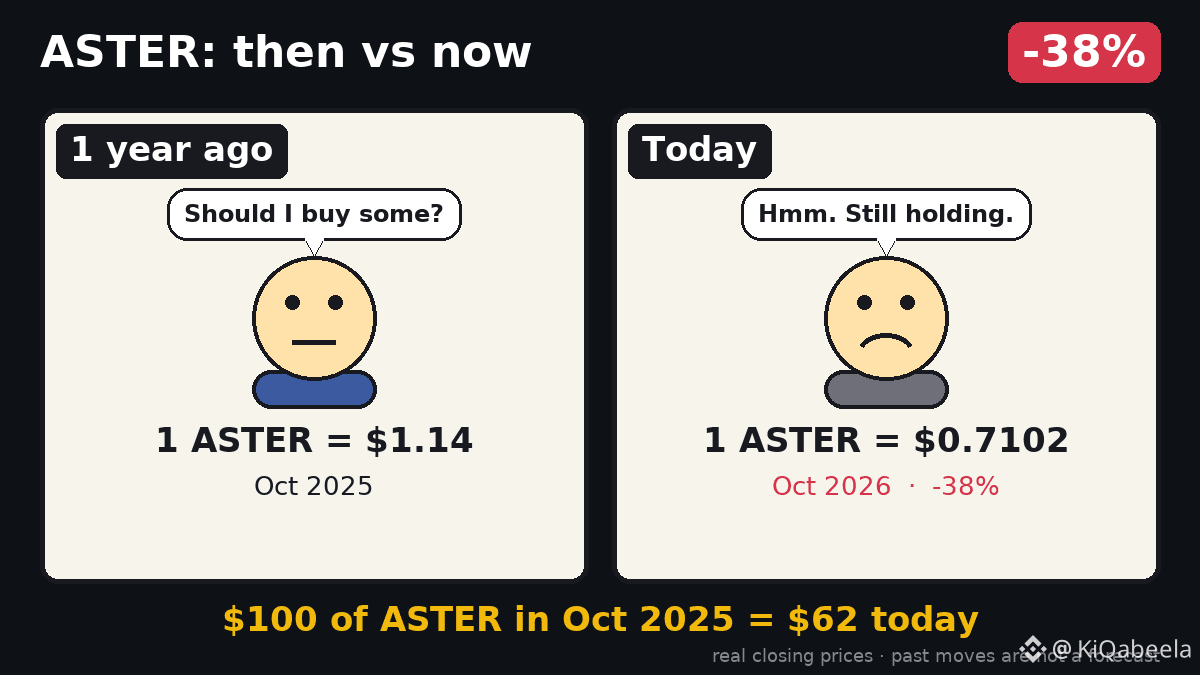
A $100 ASTER buy a year ago is now worth $62.
One year ago ASTER closed at $1.14, today it sits at $0.7102 – a 38% slide. That $100 investment shrank to $62, a stark reminder of crypto’s volatility.
Past moves say nothing about the next ones.
💬 Holder?
$ASTER
A $100 ASTER buy a year ago is now worth $62.
One year ago ASTER closed at $1.14, today it sits at $0.7102 – a 38% slide. That $100 investment shrank to $62, a stark reminder of crypto’s volatility.
Past moves say nothing about the next ones.
💬 Holder?
$ASTER
One year ago ASTER closed at $1.14, today it sits at $0.7102 – a 38% slide. That $100 investment shrank to $62, a stark reminder of crypto’s volatility.
Past moves say nothing about the next ones.
💬 Holder?
$ASTER
487
Log in to explore more content
Join global crypto users on Binance Square
⚡️ Get latest and useful information about crypto.
💬 Trusted by the world’s largest crypto exchange.
👍 Discover real insights from verified creators.
Email / Phone number