

Anas btt
7.5k Posts

Anas btt
Report
Block User
Open Trade
Frequent Trader
2.7 Years
328 Following
562 Followers
642 Liked
Posts
Portfolio
All
Quotes
PINNED
·
--
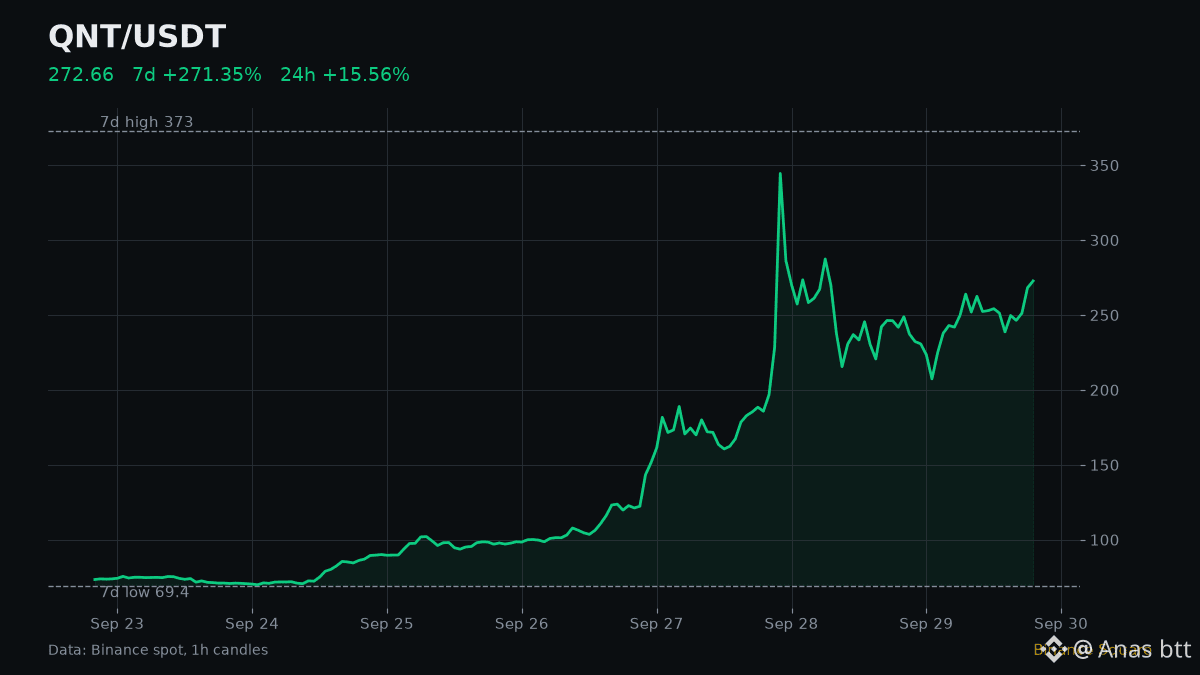
$QNT is up 271% in seven days. It ran from a 7-day low of 69.4 to a high of 373 and now trades at 272.66.
The detail I keep coming back to is volume. 24h turnover is about 153.9M USDT, 1.9 times the 7-day average. That average already includes the whole run, so buyers have not left yet.
It also added 15.6% in the last 24 hours while $BTC moved only 0.35%. This is its own story, not the market lifting everything.
Still, price sits 26.9% below the 373 high, and the chart shows that spike was short and sold off hard. Hourly RSI at 61 is warm, not extreme.
My view: I respect the strength, but I will not chase a coin that is up 271% in a week. No trade yet.
What would make me bullish: a hold above 373 with volume still near 2x its average.
What would make me cautious: a drop back under about 236, where price stood 24 hours ago. That erases today's gain and points to fading demand.
Fear & Greed at 73 says the crowd is already leaning in. Next I watch whether volume holds on the next test of the highs.
$QNT is up 271% in seven days. It ran from a 7-day low of 69.4 to a high of 373 and now trades at 272.66.
The detail I keep coming back to is volume. 24h turnover is about 153.9M USDT, 1.9 times the 7-day average. That average already includes the whole run, so buyers have not left yet.
It also added 15.6% in the last 24 hours while $BTC moved only 0.35%. This is its own story, not the market lifting everything.
Still, price sits 26.9% below the 373 high, and the chart shows that spike was short and sold off hard. Hourly RSI at 61 is warm, not extreme.
My view: I respect the strength, but I will not chase a coin that is up 271% in a week. No trade yet.
What would make me bullish: a hold above 373 with volume still near 2x its average.
What would make me cautious: a drop back under about 236, where price stood 24 hours ago. That erases today's gain and points to fading demand.
Fear & Greed at 73 says the crowd is already leaning in. Next I watch whether volume holds on the next test of the highs.
The detail I keep coming back to is volume. 24h turnover is about 153.9M USDT, 1.9 times the 7-day average. That average already includes the whole run, so buyers have not left yet.
It also added 15.6% in the last 24 hours while $BTC moved only 0.35%. This is its own story, not the market lifting everything.
Still, price sits 26.9% below the 373 high, and the chart shows that spike was short and sold off hard. Hourly RSI at 61 is warm, not extreme.
My view: I respect the strength, but I will not chase a coin that is up 271% in a week. No trade yet.
What would make me bullish: a hold above 373 with volume still near 2x its average.
What would make me cautious: a drop back under about 236, where price stood 24 hours ago. That erases today's gain and points to fading demand.
Fear & Greed at 73 says the crowd is already leaning in. Next I watch whether volume holds on the next test of the highs.
1
466
·
--
One detail first: this announcement comes from Decrypt itself, about its own product. Read it as a launch notice, not independent news.
Decrypt says it is launching The Information Exchange on Solana, with Decrypt as the media destination, Myriad as the infrastructure and a token called MYR tying it together.
Another consumer app picking Solana is a small plus for the network. But one media token does not change $SOL demand in a way you can see on a chart, and the market agrees.
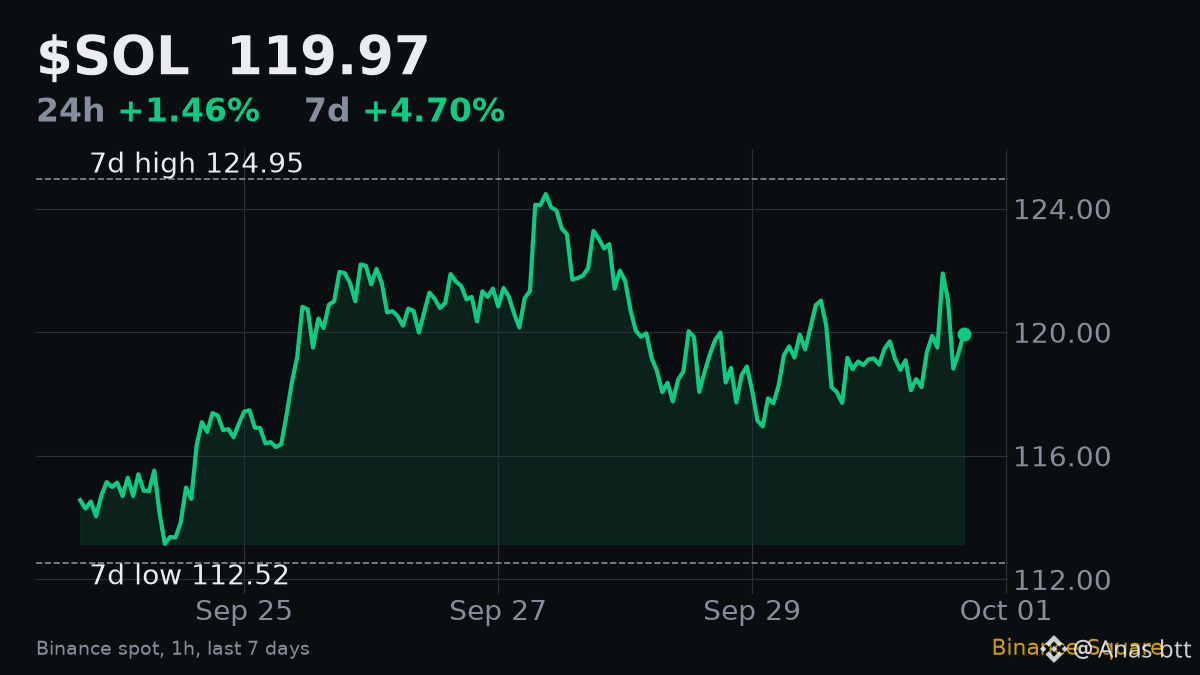
SOL is at 119.97, up 1.46% in 24 hours. $BTC is up 1.41% over the same period. That is the market moving SOL, not this headline. Volume is 0.96 times its 7-day average, so nothing unusual is happening. Hourly RSI is 52.8, neutral.
On the week SOL is up 4.7%, trading inside a range from 112.52 to 124.95, about 4.0% under the top.
My view: neutral on SOL, no trade from this news.
A break above 124.95 with volume clearly above average would be the first real signal of new demand.
A drop under 112.52 would break the week's range to the downside.
What I will watch is simple: whether this product brings real users on-chain in the coming weeks. Adoption shows up in activity long before it shows up in price.
#Solana #Decrypt
One detail first: this announcement comes from Decrypt itself, about its own product. Read it as a launch notice, not independent news.
Decrypt says it is launching The Information Exchange on Solana, with Decrypt as the media destination, Myriad as the infrastructure and a token called MYR tying it together.
Another consumer app picking Solana is a small plus for the network. But one media token does not change $SOL demand in a way you can see on a chart, and the market agrees.
SOL is at 119.97, up 1.46% in 24 hours. $BTC is up 1.41% over the same period. That is the market moving SOL, not this headline. Volume is 0.96 times its 7-day average, so nothing unusual is happening. Hourly RSI is 52.8, neutral.
On the week SOL is up 4.7%, trading inside a range from 112.52 to 124.95, about 4.0% under the top.
My view: neutral on SOL, no trade from this news.
A break above 124.95 with volume clearly above average would be the first real signal of new demand.
A drop under 112.52 would break the week's range to the downside.
What I will watch is simple: whether this product brings real users on-chain in the coming weeks. Adoption shows up in activity long before it shows up in price.
#Solana #Decrypt
Decrypt says it is launching The Information Exchange on Solana, with Decrypt as the media destination, Myriad as the infrastructure and a token called MYR tying it together.
Another consumer app picking Solana is a small plus for the network. But one media token does not change $SOL demand in a way you can see on a chart, and the market agrees.
SOL is at 119.97, up 1.46% in 24 hours. $BTC is up 1.41% over the same period. That is the market moving SOL, not this headline. Volume is 0.96 times its 7-day average, so nothing unusual is happening. Hourly RSI is 52.8, neutral.
On the week SOL is up 4.7%, trading inside a range from 112.52 to 124.95, about 4.0% under the top.
My view: neutral on SOL, no trade from this news.
A break above 124.95 with volume clearly above average would be the first real signal of new demand.
A drop under 112.52 would break the week's range to the downside.
What I will watch is simple: whether this product brings real users on-chain in the coming weeks. Adoption shows up in activity long before it shows up in price.
#Solana #Decrypt
1
66
·
--
$BTC is leading and $ETH is not following. That split is the most useful thing on the board today.
BTC is up 1.19% in 24 hours at 84,170, on about 1.51B USDT of volume. ETH is flat at +0.10%, trading 2,684.52 on about 779M. Bitcoin is doing nearly twice the volume and all of the moving.
When BTC rises alone, it usually means money is going to the safest large asset first, not spreading out into risk. A broad, healthy move tends to show ETH keeping up or leading. $BNB, up 1.77%, is the only major doing better than BTC today.
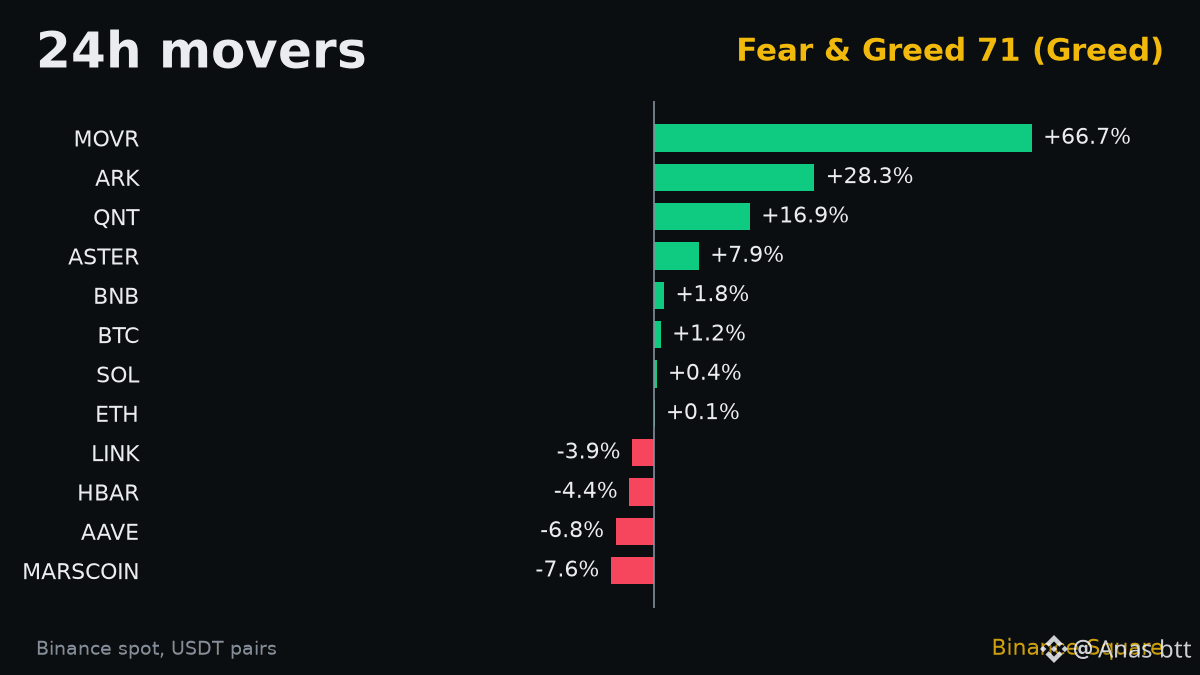
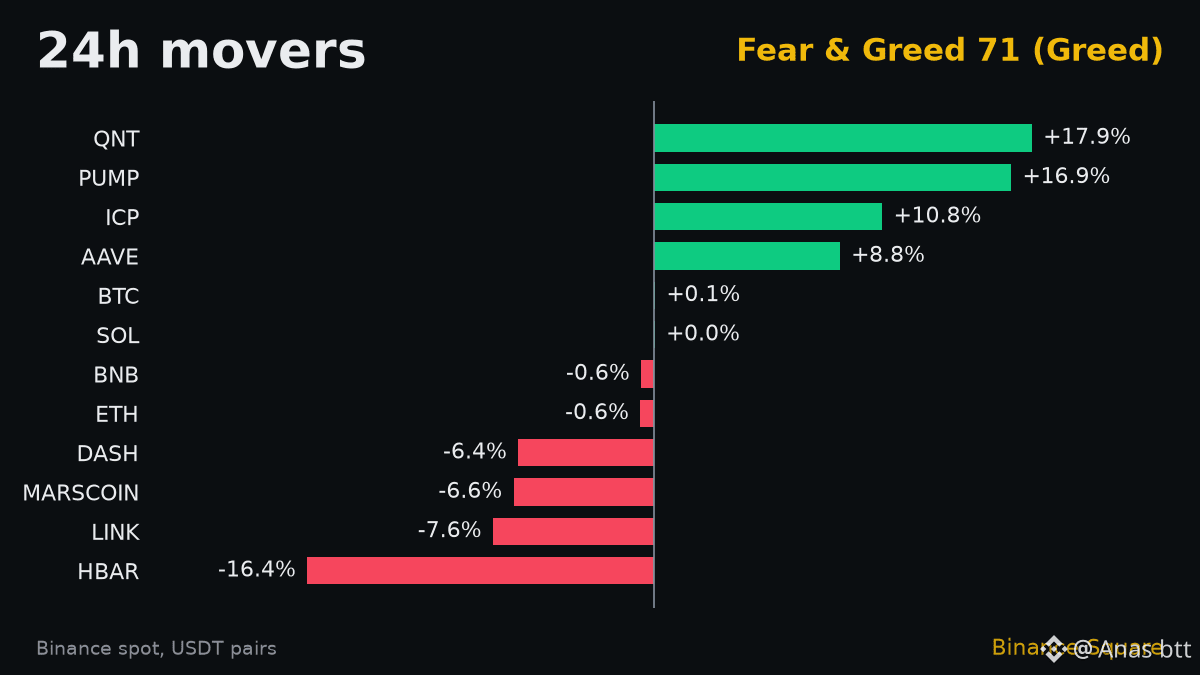
The big percentage winners on the movers chart are small, thin coins. They do not tell you much about the market's direction.
Sentiment agrees with a cautious read: Fear & Greed eased from 73 to 71 even as BTC rose.
My view: BTC strength without ETH is a narrow move, not a broad risk-on day.
It stays constructive while BTC holds above about 83,180, where the day began.
It turns broad only if ETH starts to outpace BTC on rising volume.
That ETH reaction is what I watch next.
#MarketBreadth #Rotation
$BTC is leading and $ETH is not following. That split is the most useful thing on the board today.
BTC is up 1.19% in 24 hours at 84,170, on about 1.51B USDT of volume. ETH is flat at +0.10%, trading 2,684.52 on about 779M. Bitcoin is doing nearly twice the volume and all of the moving.
When BTC rises alone, it usually means money is going to the safest large asset first, not spreading out into risk. A broad, healthy move tends to show ETH keeping up or leading. $BNB , up 1.77%, is the only major doing better than BTC today.
The big percentage winners on the movers chart are small, thin coins. They do not tell you much about the market's direction.
Sentiment agrees with a cautious read: Fear & Greed eased from 73 to 71 even as BTC rose.
My view: BTC strength without ETH is a narrow move, not a broad risk-on day.
It stays constructive while BTC holds above about 83,180, where the day began.
It turns broad only if ETH starts to outpace BTC on rising volume.
That ETH reaction is what I watch next.
#MarketBreadth #Rotation
BTC is up 1.19% in 24 hours at 84,170, on about 1.51B USDT of volume. ETH is flat at +0.10%, trading 2,684.52 on about 779M. Bitcoin is doing nearly twice the volume and all of the moving.
When BTC rises alone, it usually means money is going to the safest large asset first, not spreading out into risk. A broad, healthy move tends to show ETH keeping up or leading. $BNB , up 1.77%, is the only major doing better than BTC today.
The big percentage winners on the movers chart are small, thin coins. They do not tell you much about the market's direction.
Sentiment agrees with a cautious read: Fear & Greed eased from 73 to 71 even as BTC rose.
My view: BTC strength without ETH is a narrow move, not a broad risk-on day.
It stays constructive while BTC holds above about 83,180, where the day began.
It turns broad only if ETH starts to outpace BTC on rising volume.
That ETH reaction is what I watch next.
#MarketBreadth #Rotation
1
41
·
--
The week is still green for $AAVE. The last day was not.
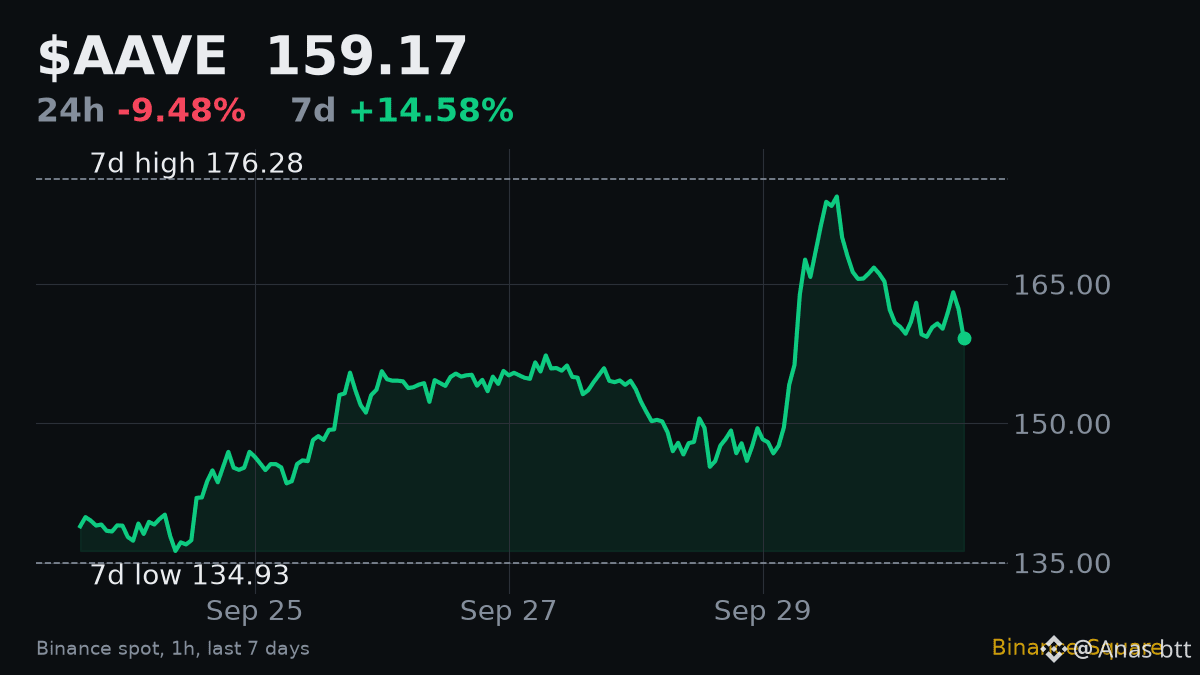
AAVE is at 159.17, down 9.5% in 24 hours but still up 14.6% on the week. It now sits 9.7% under its 7-day high of 176.28, so roughly half of the week's rally is gone.
What makes this drop worth attention is the volume behind it: about 57.7M USDT, 2.0 times the 7-day average. Heavy volume on a red day usually means real selling, not a quiet dip. And it is not the market: $BTC moved only -0.32%.
Hourly RSI is 44.3. Momentum has cooled but is not oversold, so there is no sign yet that sellers are exhausted.
My view: short-term bearish until the selling pressure fades. No long here yet.
The level I watch is about 155.6, the middle of this week's 134.93 to 176.28 range. A clean break under it on high volume opens the way back toward the weekly low.
What changes my mind: a recovery back above about 176, where this drop started, which would erase the whole sell-off.
Next I want to see volume fall while price stabilises. That would tell me the sellers are done.
#AAVE #Selloff
The week is still green for $AAVE . The last day was not.
AAVE is at 159.17, down 9.5% in 24 hours but still up 14.6% on the week. It now sits 9.7% under its 7-day high of 176.28, so roughly half of the week's rally is gone.
What makes this drop worth attention is the volume behind it: about 57.7M USDT, 2.0 times the 7-day average. Heavy volume on a red day usually means real selling, not a quiet dip. And it is not the market: $BTC moved only -0.32%.
Hourly RSI is 44.3. Momentum has cooled but is not oversold, so there is no sign yet that sellers are exhausted.
My view: short-term bearish until the selling pressure fades. No long here yet.
The level I watch is about 155.6, the middle of this week's 134.93 to 176.28 range. A clean break under it on high volume opens the way back toward the weekly low.
What changes my mind: a recovery back above about 176, where this drop started, which would erase the whole sell-off.
Next I want to see volume fall while price stabilises. That would tell me the sellers are done.
#AAVE #Selloff
AAVE is at 159.17, down 9.5% in 24 hours but still up 14.6% on the week. It now sits 9.7% under its 7-day high of 176.28, so roughly half of the week's rally is gone.
What makes this drop worth attention is the volume behind it: about 57.7M USDT, 2.0 times the 7-day average. Heavy volume on a red day usually means real selling, not a quiet dip. And it is not the market: $BTC moved only -0.32%.
Hourly RSI is 44.3. Momentum has cooled but is not oversold, so there is no sign yet that sellers are exhausted.
My view: short-term bearish until the selling pressure fades. No long here yet.
The level I watch is about 155.6, the middle of this week's 134.93 to 176.28 range. A clean break under it on high volume opens the way back toward the weekly low.
What changes my mind: a recovery back above about 176, where this drop started, which would erase the whole sell-off.
Next I want to see volume fall while price stabilises. That would tell me the sellers are done.
#AAVE #Selloff
1
37
·
--
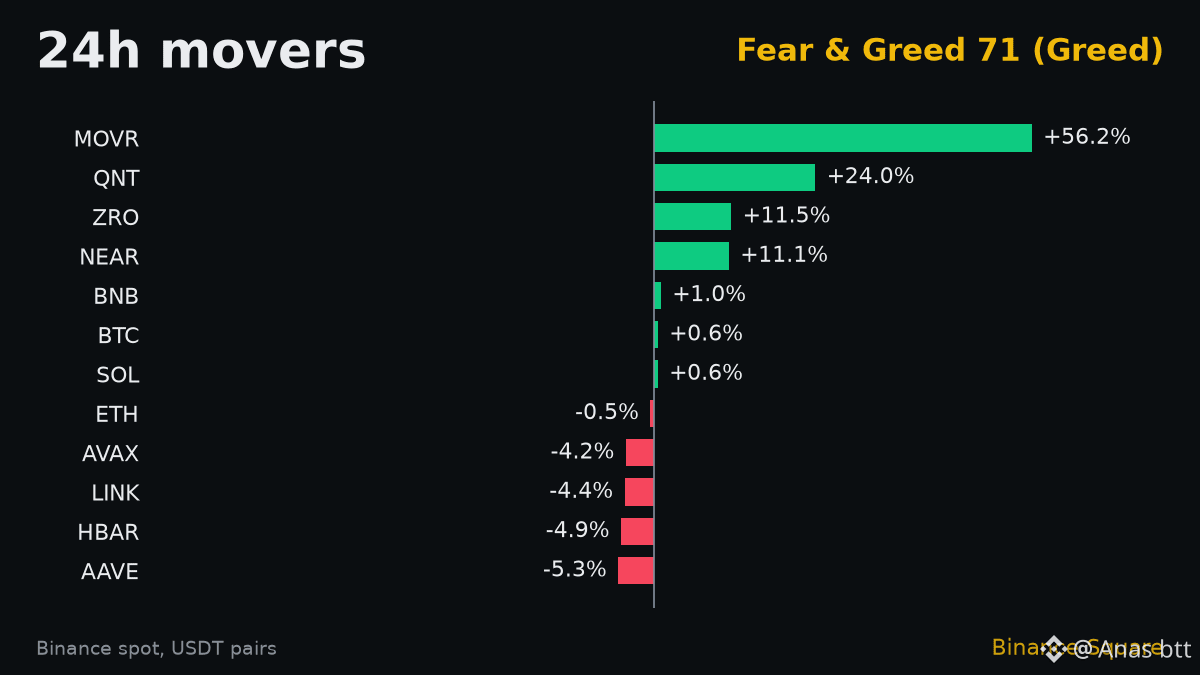
Of all today's big gainers, only one also sits in the top five by volume: $NEAR.
NEAR is up 11.1% in 24 hours at 5.401, on about 220.1M USDT of trading. That is more volume than every other coin on the gainers list, and it ranks right behind BTC, ETH, SOL and XRP.
Compare that with the loudest move of the day. $MOVR is up 56.2%, but on about 35.5M USDT. NEAR's move is smaller in percent and carries more than six times the money.
That difference matters to me. A thin coin can jump on a few large orders. A move with this much volume behind it means many participants agreed on the direction, which usually makes it harder to reverse quickly.
The backdrop is calm. $BTC is up 0.57% and the majors are mixed, so NEAR is not riding a market-wide wave.
My view: this is the higher-quality move of the day. I would still not chase an 11% candle.
It stays constructive while price holds above about 4.86, where the day started.
If volume fades and price slips back under that level, the move loses its meaning.
Next I watch whether NEAR keeps a place in the top five by volume tomorrow.
#NEAR #Volume
Of all today's big gainers, only one also sits in the top five by volume: $NEAR .
NEAR is up 11.1% in 24 hours at 5.401, on about 220.1M USDT of trading. That is more volume than every other coin on the gainers list, and it ranks right behind BTC, ETH, SOL and XRP.
Compare that with the loudest move of the day. $MOVR is up 56.2%, but on about 35.5M USDT. NEAR's move is smaller in percent and carries more than six times the money.
That difference matters to me. A thin coin can jump on a few large orders. A move with this much volume behind it means many participants agreed on the direction, which usually makes it harder to reverse quickly.
The backdrop is calm. $BTC is up 0.57% and the majors are mixed, so NEAR is not riding a market-wide wave.
My view: this is the higher-quality move of the day. I would still not chase an 11% candle.
It stays constructive while price holds above about 4.86, where the day started.
If volume fades and price slips back under that level, the move loses its meaning.
Next I watch whether NEAR keeps a place in the top five by volume tomorrow.
#NEAR #Volume
NEAR is up 11.1% in 24 hours at 5.401, on about 220.1M USDT of trading. That is more volume than every other coin on the gainers list, and it ranks right behind BTC, ETH, SOL and XRP.
Compare that with the loudest move of the day. $MOVR is up 56.2%, but on about 35.5M USDT. NEAR's move is smaller in percent and carries more than six times the money.
That difference matters to me. A thin coin can jump on a few large orders. A move with this much volume behind it means many participants agreed on the direction, which usually makes it harder to reverse quickly.
The backdrop is calm. $BTC is up 0.57% and the majors are mixed, so NEAR is not riding a market-wide wave.
My view: this is the higher-quality move of the day. I would still not chase an 11% candle.
It stays constructive while price holds above about 4.86, where the day started.
If volume fades and price slips back under that level, the move loses its meaning.
Next I watch whether NEAR keeps a place in the top five by volume tomorrow.
#NEAR #Volume
1
155
·
--
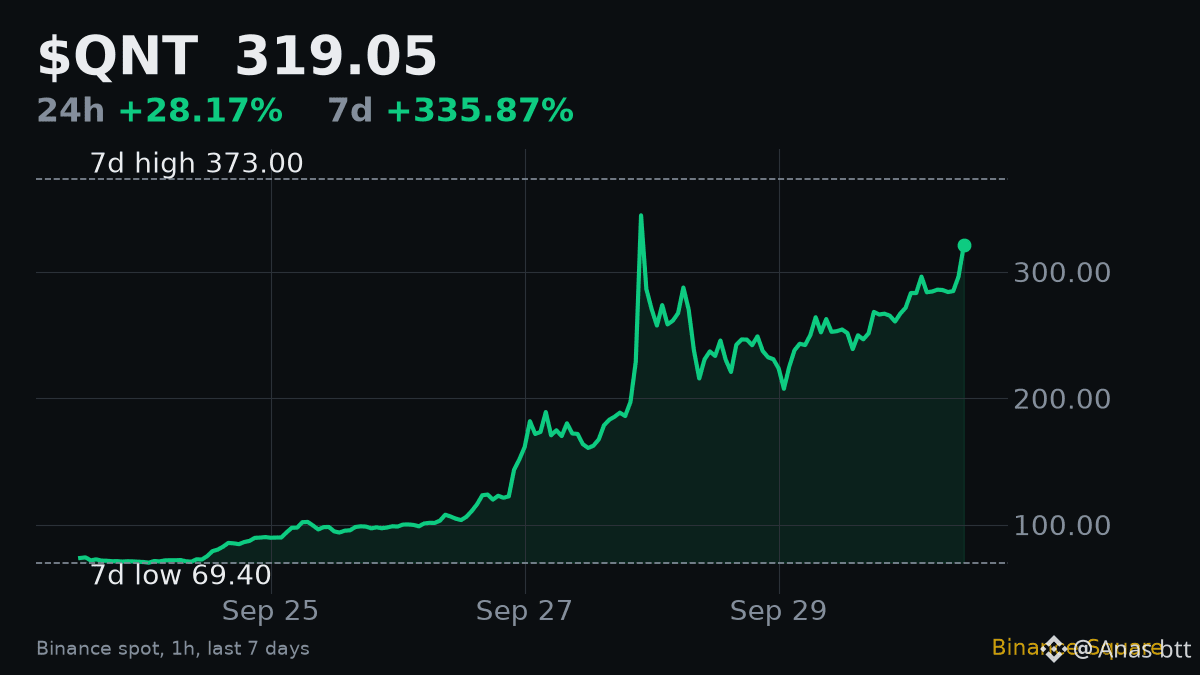
Three numbers tell the $QNT story today.
336%. That is the 7-day gain. From a weekly low of 69.4, QNT now trades at 319.05. Very few liquid coins move like this in a week.
74.3. That is the hourly RSI, above the usual overbought line of 70. After a 28.2% jump in the last 24 hours, momentum is running hot.
14.5%. That is the distance left to the 7-day high of 373. The last push toward that level was rejected fast, as the chart shows.
What keeps the trend credible is volume: about 178M USDT in 24 hours, 1.8 times the weekly average, while $BTC is down 0.34%. Real money is still coming in, and it is not riding the market.
My view: the trend is up, but chasing an overbought coin 14% under a level that already rejected it is poor risk. No trade yet.
Above 373 on strong volume, the trend is confirmed and I turn bullish.
Below about 249, where the last 24 hours started, the push has failed and I expect a deeper pullback.
What I want to see is a cool-down: RSI back near 50 while price holds most of the gain. That would be a healthier base than today's stretch.
#QNT #TrendFollowing
Three numbers tell the $QNT story today.
336%. That is the 7-day gain. From a weekly low of 69.4, QNT now trades at 319.05. Very few liquid coins move like this in a week.
74.3. That is the hourly RSI, above the usual overbought line of 70. After a 28.2% jump in the last 24 hours, momentum is running hot.
14.5%. That is the distance left to the 7-day high of 373. The last push toward that level was rejected fast, as the chart shows.
What keeps the trend credible is volume: about 178M USDT in 24 hours, 1.8 times the weekly average, while $BTC is down 0.34%. Real money is still coming in, and it is not riding the market.
My view: the trend is up, but chasing an overbought coin 14% under a level that already rejected it is poor risk. No trade yet.
Above 373 on strong volume, the trend is confirmed and I turn bullish.
Below about 249, where the last 24 hours started, the push has failed and I expect a deeper pullback.
What I want to see is a cool-down: RSI back near 50 while price holds most of the gain. That would be a healthier base than today's stretch.
#QNT #TrendFollowing
336%. That is the 7-day gain. From a weekly low of 69.4, QNT now trades at 319.05. Very few liquid coins move like this in a week.
74.3. That is the hourly RSI, above the usual overbought line of 70. After a 28.2% jump in the last 24 hours, momentum is running hot.
14.5%. That is the distance left to the 7-day high of 373. The last push toward that level was rejected fast, as the chart shows.
What keeps the trend credible is volume: about 178M USDT in 24 hours, 1.8 times the weekly average, while $BTC is down 0.34%. Real money is still coming in, and it is not riding the market.
My view: the trend is up, but chasing an overbought coin 14% under a level that already rejected it is poor risk. No trade yet.
Above 373 on strong volume, the trend is confirmed and I turn bullish.
Below about 249, where the last 24 hours started, the push has failed and I expect a deeper pullback.
What I want to see is a cool-down: RSI back near 50 while price holds most of the gain. That would be a healthier base than today's stretch.
#QNT #TrendFollowing
1
315
·
--
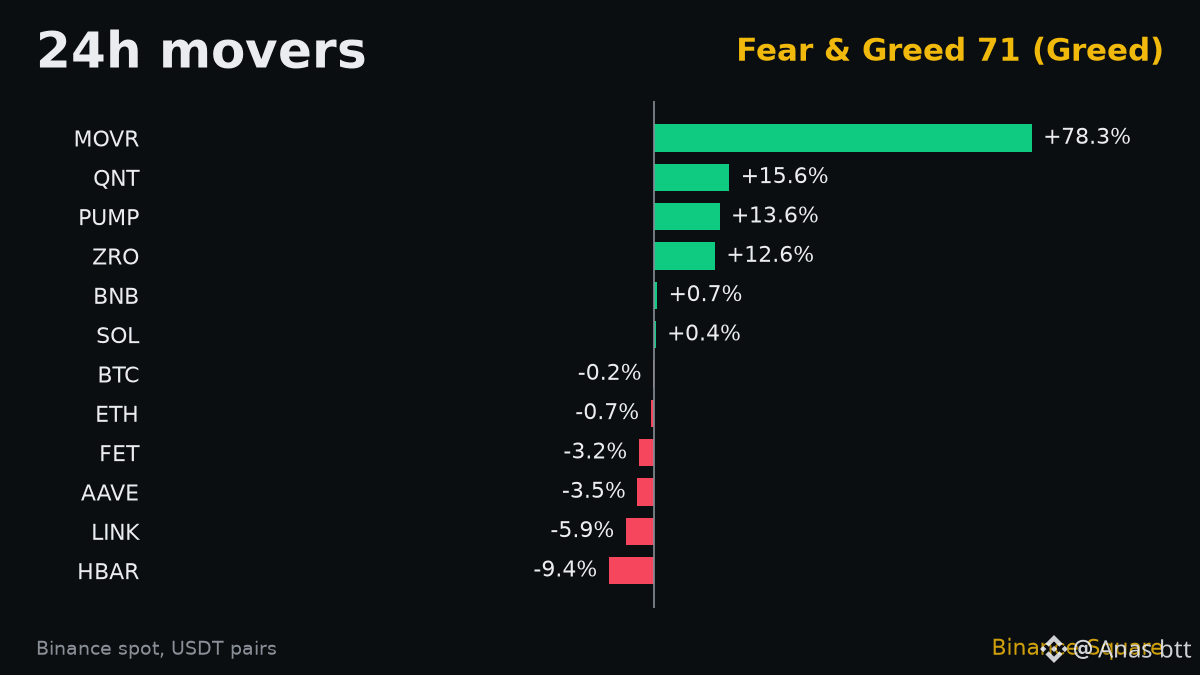
+78% in one day. $MOVR is the only real story on the board right now, and it is not close.
MOVR trades at 1.797, up 78.3% in 24 hours, on about 30.4M USDT of volume. For comparison, the next best gainers on the movers chart are up 12% to 16%. The majors did almost nothing: $BTC is down 0.2% and ETH down 0.7%.
So this is not the market lifting everything. It is one small coin moving on its own, in a market thin enough that 30M USDT can nearly double the price.
That cuts both ways. A move built on thin volume can give back a large part of its gain just as fast, especially once early buyers start taking profit. I do not have a clear reason for the jump in my data, and I do not trade what I cannot explain.
My view: no chase. Watching only.
The level I care about is about 1.40, halfway between where the day started (about 1.01) and the current price. Holding above it would mean buyers are defending the move.
Losing it would suggest the spike is unwinding.
What I watch next is whether volume stays near this level tomorrow. A second day of heavy trading would matter more than the first.
#MOVR #Volatility
+78% in one day. $MOVR is the only real story on the board right now, and it is not close.
MOVR trades at 1.797, up 78.3% in 24 hours, on about 30.4M USDT of volume. For comparison, the next best gainers on the movers chart are up 12% to 16%. The majors did almost nothing: $BTC is down 0.2% and ETH down 0.7%.
So this is not the market lifting everything. It is one small coin moving on its own, in a market thin enough that 30M USDT can nearly double the price.
That cuts both ways. A move built on thin volume can give back a large part of its gain just as fast, especially once early buyers start taking profit. I do not have a clear reason for the jump in my data, and I do not trade what I cannot explain.
My view: no chase. Watching only.
The level I care about is about 1.40, halfway between where the day started (about 1.01) and the current price. Holding above it would mean buyers are defending the move.
Losing it would suggest the spike is unwinding.
What I watch next is whether volume stays near this level tomorrow. A second day of heavy trading would matter more than the first.
#MOVR #Volatility
MOVR trades at 1.797, up 78.3% in 24 hours, on about 30.4M USDT of volume. For comparison, the next best gainers on the movers chart are up 12% to 16%. The majors did almost nothing: $BTC is down 0.2% and ETH down 0.7%.
So this is not the market lifting everything. It is one small coin moving on its own, in a market thin enough that 30M USDT can nearly double the price.
That cuts both ways. A move built on thin volume can give back a large part of its gain just as fast, especially once early buyers start taking profit. I do not have a clear reason for the jump in my data, and I do not trade what I cannot explain.
My view: no chase. Watching only.
The level I care about is about 1.40, halfway between where the day started (about 1.01) and the current price. Holding above it would mean buyers are defending the move.
Losing it would suggest the spike is unwinding.
What I watch next is whether volume stays near this level tomorrow. A second day of heavy trading would matter more than the first.
#MOVR #Volatility
1
227
·
--
A small detail in a quiet news story: European investors can now hold $BTC exposure without a second bet on the US dollar.
CoinDesk reports that HANetf listed ETCs in London, Frankfurt and Paris that give bitcoin exposure hedged to pound sterling and euro.
Why that matters: bitcoin is priced in dollars. A euro investor who buys it normally carries two risks, the BTC price and the dollar against the euro. Their return can move even when BTC does not. A hedged product removes the currency layer, which makes it easier for more cautious money in Europe to say yes.
I see it as plumbing, not a price catalyst. New access routes add demand slowly, over months.
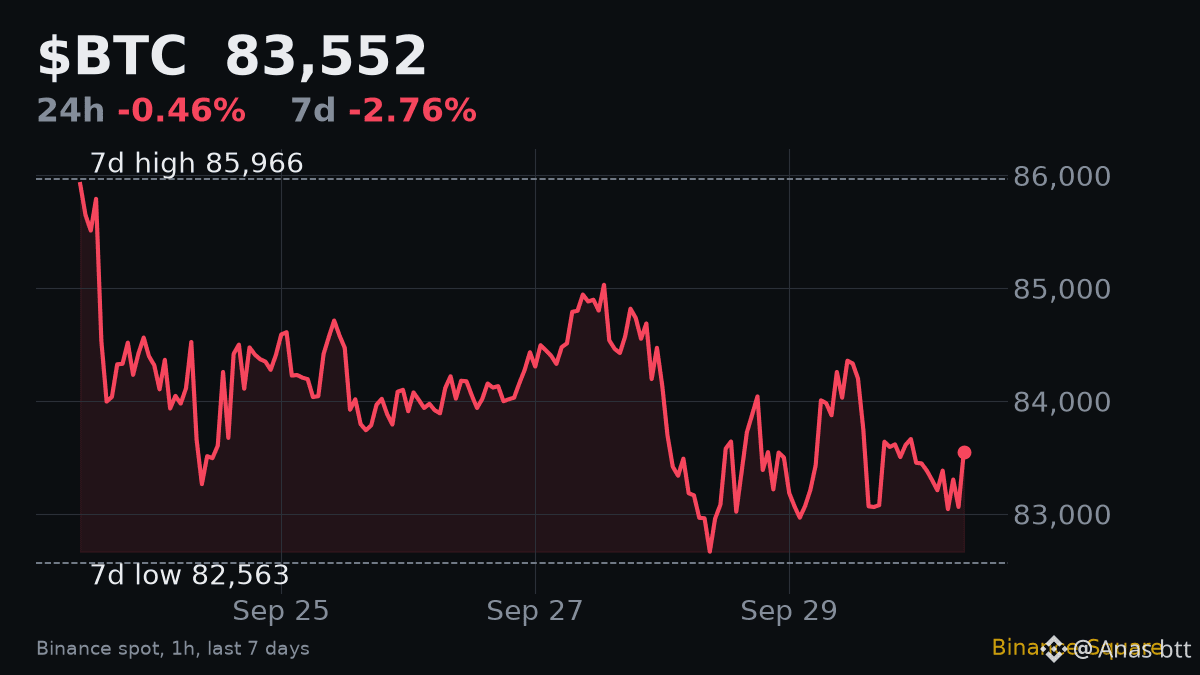
The chart agrees for now. BTC is at 83,552, down 0.46% on the day and 2.8% on the week. It sits between the 7-day low of 82,563 and the high of 85,966. Volume is 0.77 times its 7-day average and hourly RSI is 51.8, dead neutral.
My view: good for the long run, no trade from it today.
A break above 85,966 on rising volume would show fresh demand arriving.
A loss of 82,563 would show it is not arriving yet.
I will watch whether these new listings get real volume in the next weeks. That is the part that would matter for price.
#HANetf #Europe
A small detail in a quiet news story: European investors can now hold $BTC exposure without a second bet on the US dollar.
CoinDesk reports that HANetf listed ETCs in London, Frankfurt and Paris that give bitcoin exposure hedged to pound sterling and euro.
Why that matters: bitcoin is priced in dollars. A euro investor who buys it normally carries two risks, the BTC price and the dollar against the euro. Their return can move even when BTC does not. A hedged product removes the currency layer, which makes it easier for more cautious money in Europe to say yes.
I see it as plumbing, not a price catalyst. New access routes add demand slowly, over months.
The chart agrees for now. BTC is at 83,552, down 0.46% on the day and 2.8% on the week. It sits between the 7-day low of 82,563 and the high of 85,966. Volume is 0.77 times its 7-day average and hourly RSI is 51.8, dead neutral.
My view: good for the long run, no trade from it today.
A break above 85,966 on rising volume would show fresh demand arriving.
A loss of 82,563 would show it is not arriving yet.
I will watch whether these new listings get real volume in the next weeks. That is the part that would matter for price.
#HANetf #Europe
CoinDesk reports that HANetf listed ETCs in London, Frankfurt and Paris that give bitcoin exposure hedged to pound sterling and euro.
Why that matters: bitcoin is priced in dollars. A euro investor who buys it normally carries two risks, the BTC price and the dollar against the euro. Their return can move even when BTC does not. A hedged product removes the currency layer, which makes it easier for more cautious money in Europe to say yes.
I see it as plumbing, not a price catalyst. New access routes add demand slowly, over months.
The chart agrees for now. BTC is at 83,552, down 0.46% on the day and 2.8% on the week. It sits between the 7-day low of 82,563 and the high of 85,966. Volume is 0.77 times its 7-day average and hourly RSI is 51.8, dead neutral.
My view: good for the long run, no trade from it today.
A break above 85,966 on rising volume would show fresh demand arriving.
A loss of 82,563 would show it is not arriving yet.
I will watch whether these new listings get real volume in the next weeks. That is the part that would matter for price.
#HANetf #Europe
1
19
·
--
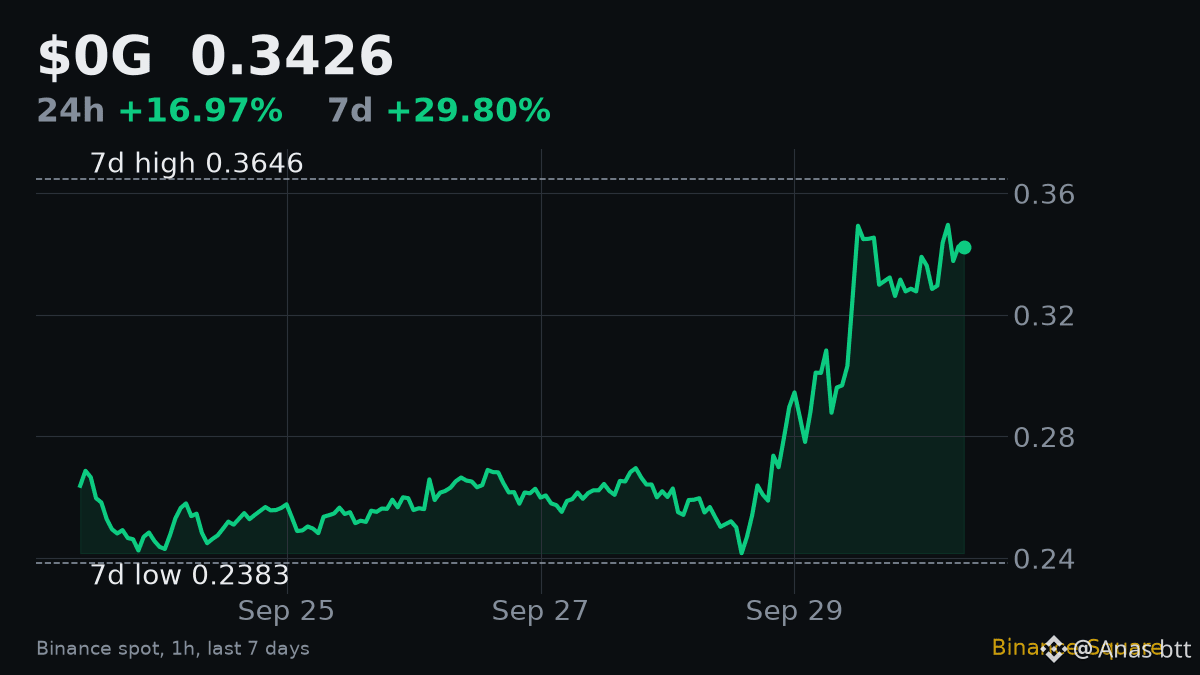
$BTC slipped 0.97% over the last day. $0G went the other way and is still up 17%.
That kind of relative strength is what I look for in a small coin. When the market leader dips and a coin holds its gains, the buying is coming from its own demand, not from the tide.
The numbers: 0G is at 0.3426, up 29.8% on the week. It printed a new 7-day high at 0.3646 and now sits 6.0% below it. Volume is about 24.6M USDT, 5.3 times its 7-day average, so the interest has not faded yet. Hourly RSI is 60.3, which leaves room before it gets stretched.
The risk is size. 24.6M USDT is a thin market, and thin markets can drop as fast as they rise.
My view: constructive, but I want confirmation first.
Bullish if price reclaims 0.3646 while volume stays several times above average.
Wrong if it falls back under about 0.293, where the day began. That would give back the whole 24h move.
What I am watching is whether 0G keeps holding if BTC weakens further. That is the real test of this strength.
#RelativeStrength #Breakout
$BTC slipped 0.97% over the last day. $0G went the other way and is still up 17%.
That kind of relative strength is what I look for in a small coin. When the market leader dips and a coin holds its gains, the buying is coming from its own demand, not from the tide.
The numbers: 0G is at 0.3426, up 29.8% on the week. It printed a new 7-day high at 0.3646 and now sits 6.0% below it. Volume is about 24.6M USDT, 5.3 times its 7-day average, so the interest has not faded yet. Hourly RSI is 60.3, which leaves room before it gets stretched.
The risk is size. 24.6M USDT is a thin market, and thin markets can drop as fast as they rise.
My view: constructive, but I want confirmation first.
Bullish if price reclaims 0.3646 while volume stays several times above average.
Wrong if it falls back under about 0.293, where the day began. That would give back the whole 24h move.
What I am watching is whether 0G keeps holding if BTC weakens further. That is the real test of this strength.
#RelativeStrength #Breakout
That kind of relative strength is what I look for in a small coin. When the market leader dips and a coin holds its gains, the buying is coming from its own demand, not from the tide.
The numbers: 0G is at 0.3426, up 29.8% on the week. It printed a new 7-day high at 0.3646 and now sits 6.0% below it. Volume is about 24.6M USDT, 5.3 times its 7-day average, so the interest has not faded yet. Hourly RSI is 60.3, which leaves room before it gets stretched.
The risk is size. 24.6M USDT is a thin market, and thin markets can drop as fast as they rise.
My view: constructive, but I want confirmation first.
Bullish if price reclaims 0.3646 while volume stays several times above average.
Wrong if it falls back under about 0.293, where the day began. That would give back the whole 24h move.
What I am watching is whether 0G keeps holding if BTC weakens further. That is the real test of this strength.
#RelativeStrength #Breakout
1
216
·
--
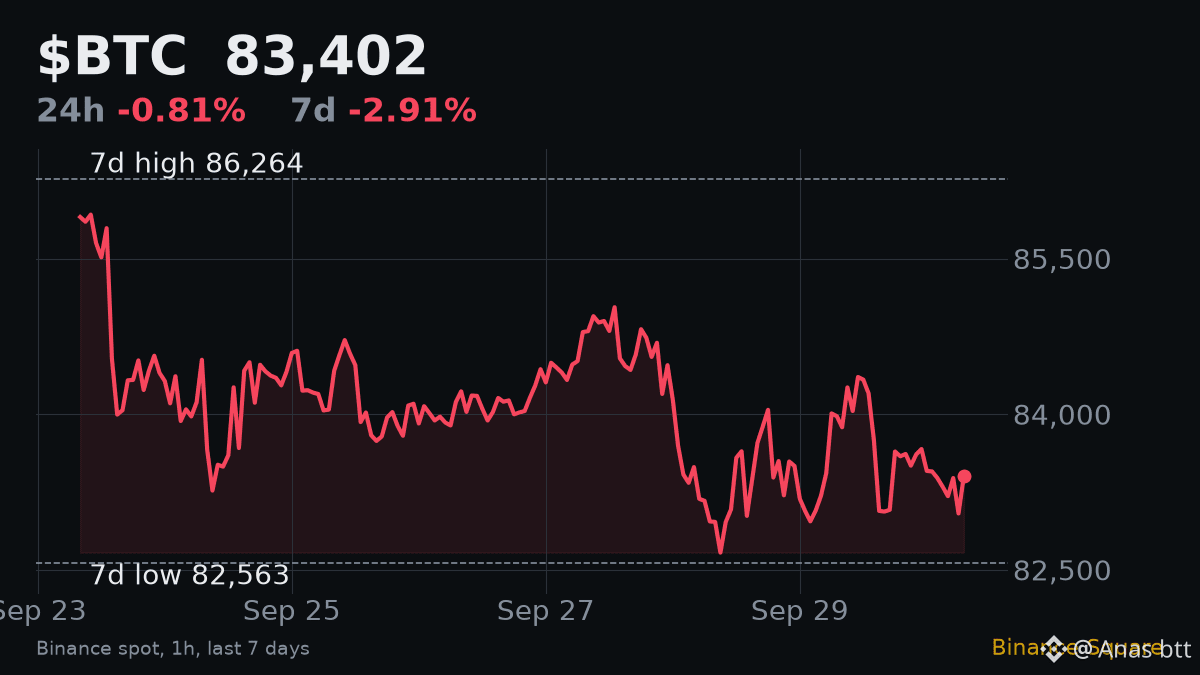
One percent. That is all the room $BTC has left above its 7-day low right now.
CoinDesk writes that bulls have a single price level they need to hold, and that losing it could change the picture for them. The article's summary does not give the number, so here is the one I am watching myself: 82,563, the lowest price of the past week.
BTC trades at 83,402, down 0.81% on the day and 2.9% on the week. It is 3.3% under the 7-day high of 86,264, so the whole week has been a slow grind down inside a narrow range.
Two details make me cautious about that floor. Volume is only 0.78 times its 7-day average, so buyers are not stepping in with size. And hourly RSI at 48.3 shows no bounce energy yet.
My view: this is a test of support, not a buy signal.
If 82,563 breaks on rising volume, I expect sellers to press the move and I stay out.
If price holds that level and reclaims 86,264, the week becomes a range, not a downtrend.
What I watch now is the reaction at the low itself. A quick wick and recovery would say buyers are there. A slow close under it would say they are not.
#SupportLevel #PriceAction
One percent. That is all the room $BTC has left above its 7-day low right now.
CoinDesk writes that bulls have a single price level they need to hold, and that losing it could change the picture for them. The article's summary does not give the number, so here is the one I am watching myself: 82,563, the lowest price of the past week.
BTC trades at 83,402, down 0.81% on the day and 2.9% on the week. It is 3.3% under the 7-day high of 86,264, so the whole week has been a slow grind down inside a narrow range.
Two details make me cautious about that floor. Volume is only 0.78 times its 7-day average, so buyers are not stepping in with size. And hourly RSI at 48.3 shows no bounce energy yet.
My view: this is a test of support, not a buy signal.
If 82,563 breaks on rising volume, I expect sellers to press the move and I stay out.
If price holds that level and reclaims 86,264, the week becomes a range, not a downtrend.
What I watch now is the reaction at the low itself. A quick wick and recovery would say buyers are there. A slow close under it would say they are not.
#SupportLevel #PriceAction
CoinDesk writes that bulls have a single price level they need to hold, and that losing it could change the picture for them. The article's summary does not give the number, so here is the one I am watching myself: 82,563, the lowest price of the past week.
BTC trades at 83,402, down 0.81% on the day and 2.9% on the week. It is 3.3% under the 7-day high of 86,264, so the whole week has been a slow grind down inside a narrow range.
Two details make me cautious about that floor. Volume is only 0.78 times its 7-day average, so buyers are not stepping in with size. And hourly RSI at 48.3 shows no bounce energy yet.
My view: this is a test of support, not a buy signal.
If 82,563 breaks on rising volume, I expect sellers to press the move and I stay out.
If price holds that level and reclaims 86,264, the week becomes a range, not a downtrend.
What I watch now is the reaction at the low itself. A quick wick and recovery would say buyers are there. A slow close under it would say they are not.
#SupportLevel #PriceAction
1
12
·
--
Fear & Greed says 71, Greed. The $BTC chart says something else. That gap is a good lesson in how to use this index.
What it is: one number from 0 to 100 that blends several market and crowd signals into a mood reading. Low means fear, high means greed. It updates once a day.
When it is useful: at the extremes. Very deep fear often shows up near washed-out lows, and very high greed near crowded tops. Used against the crowd, it can warn you before price does.
When it misleads: in the middle, and when price is already turning. Because it is a slow daily blend, it can keep showing greed after the market has cooled.
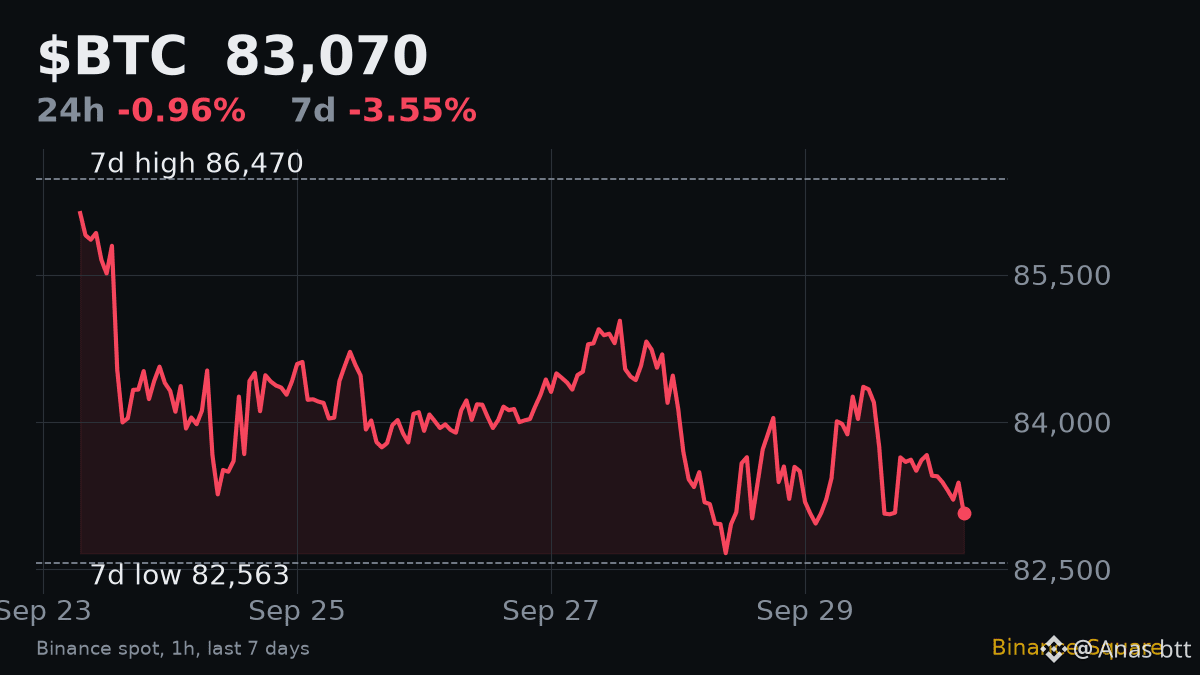
Today is that case. BTC is at 83,070, down 0.97% on the day and 3.5% on the week, 3.9% under its 7-day high of 86,470. Hourly RSI is 40.7, on the weak side. Volume is 0.78 times its weekly average. $ETH is down 1.39% too. Yet the index still reads Greed, only easing from 73 to 71.
So the mood number is lagging the tape, not leading it.
Practical takeaway: treat Fear & Greed as context, not a signal. Only act on it at extremes, and only when price and volume agree with it.
#FearAndGreed #Sentiment
Fear & Greed says 71, Greed. The $BTC chart says something else. That gap is a good lesson in how to use this index.
What it is: one number from 0 to 100 that blends several market and crowd signals into a mood reading. Low means fear, high means greed. It updates once a day.
When it is useful: at the extremes. Very deep fear often shows up near washed-out lows, and very high greed near crowded tops. Used against the crowd, it can warn you before price does.
When it misleads: in the middle, and when price is already turning. Because it is a slow daily blend, it can keep showing greed after the market has cooled.
Today is that case. BTC is at 83,070, down 0.97% on the day and 3.5% on the week, 3.9% under its 7-day high of 86,470. Hourly RSI is 40.7, on the weak side. Volume is 0.78 times its weekly average. $ETH is down 1.39% too. Yet the index still reads Greed, only easing from 73 to 71.
So the mood number is lagging the tape, not leading it.
Practical takeaway: treat Fear & Greed as context, not a signal. Only act on it at extremes, and only when price and volume agree with it.
#FearAndGreed #Sentiment
What it is: one number from 0 to 100 that blends several market and crowd signals into a mood reading. Low means fear, high means greed. It updates once a day.
When it is useful: at the extremes. Very deep fear often shows up near washed-out lows, and very high greed near crowded tops. Used against the crowd, it can warn you before price does.
When it misleads: in the middle, and when price is already turning. Because it is a slow daily blend, it can keep showing greed after the market has cooled.
Today is that case. BTC is at 83,070, down 0.97% on the day and 3.5% on the week, 3.9% under its 7-day high of 86,470. Hourly RSI is 40.7, on the weak side. Volume is 0.78 times its weekly average. $ETH is down 1.39% too. Yet the index still reads Greed, only easing from 73 to 71.
So the mood number is lagging the tape, not leading it.
Practical takeaway: treat Fear & Greed as context, not a signal. Only act on it at extremes, and only when price and volume agree with it.
#FearAndGreed #Sentiment
1
22
·
--
$ZRO is pressing its 7-day high with less fuel than the chart suggests.
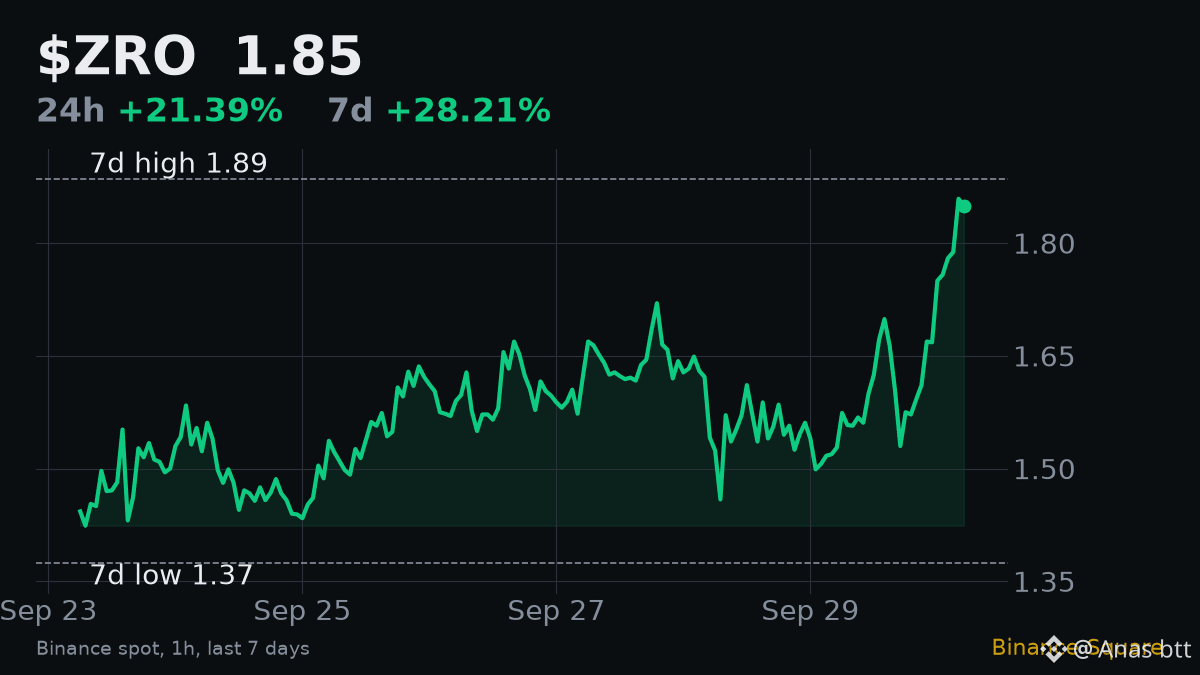
The price side is loud. ZRO is at 1.85, up 21.4% on the day and 28.2% on the week, only 1.9% under the 7-day high of 1.885.
The volume side is quiet. 24h turnover is about 22.6M USDT, just 1.33 times its 7-day average. For a 21% day, that is a small step up in participation.
And momentum is already stretched. Hourly RSI is 73.1, above the usual overbought line. $BTC moved only 0.33%, so there is no market wave to carry ZRO through resistance either.
Breakouts on weak volume usually fail. That is the rule I lean on here.
My view: skeptical of this push. No trade yet.
I change my mind if price holds above 1.885 with volume at 2x its average or more.
A drop back below about 1.52, where the day started, would confirm the move was thin and is unwinding.
Next I watch the first test of 1.885. A rejection there on flat volume is the setup I expect.
#ZRO #Overbought
$ZRO is pressing its 7-day high with less fuel than the chart suggests.
The price side is loud. ZRO is at 1.85, up 21.4% on the day and 28.2% on the week, only 1.9% under the 7-day high of 1.885.
The volume side is quiet. 24h turnover is about 22.6M USDT, just 1.33 times its 7-day average. For a 21% day, that is a small step up in participation.
And momentum is already stretched. Hourly RSI is 73.1, above the usual overbought line. $BTC moved only 0.33%, so there is no market wave to carry ZRO through resistance either.
Breakouts on weak volume usually fail. That is the rule I lean on here.
My view: skeptical of this push. No trade yet.
I change my mind if price holds above 1.885 with volume at 2x its average or more.
A drop back below about 1.52, where the day started, would confirm the move was thin and is unwinding.
Next I watch the first test of 1.885. A rejection there on flat volume is the setup I expect.
#ZRO #Overbought
The price side is loud. ZRO is at 1.85, up 21.4% on the day and 28.2% on the week, only 1.9% under the 7-day high of 1.885.
The volume side is quiet. 24h turnover is about 22.6M USDT, just 1.33 times its 7-day average. For a 21% day, that is a small step up in participation.
And momentum is already stretched. Hourly RSI is 73.1, above the usual overbought line. $BTC moved only 0.33%, so there is no market wave to carry ZRO through resistance either.
Breakouts on weak volume usually fail. That is the rule I lean on here.
My view: skeptical of this push. No trade yet.
I change my mind if price holds above 1.885 with volume at 2x its average or more.
A drop back below about 1.52, where the day started, would confirm the move was thin and is unwinding.
Next I watch the first test of 1.885. A rejection there on flat volume is the setup I expect.
#ZRO #Overbought
1
51
·
--
A trend gauge near its maximum while the buyers walk away. That is the odd split on $BTC today.
CoinDesk reports that CryptoQuant's "bull score" is close to a perfect reading, even though the buyers who pushed BTC to an eight-month high are already pulling back.
I side with the cooling part. The market data backs it:
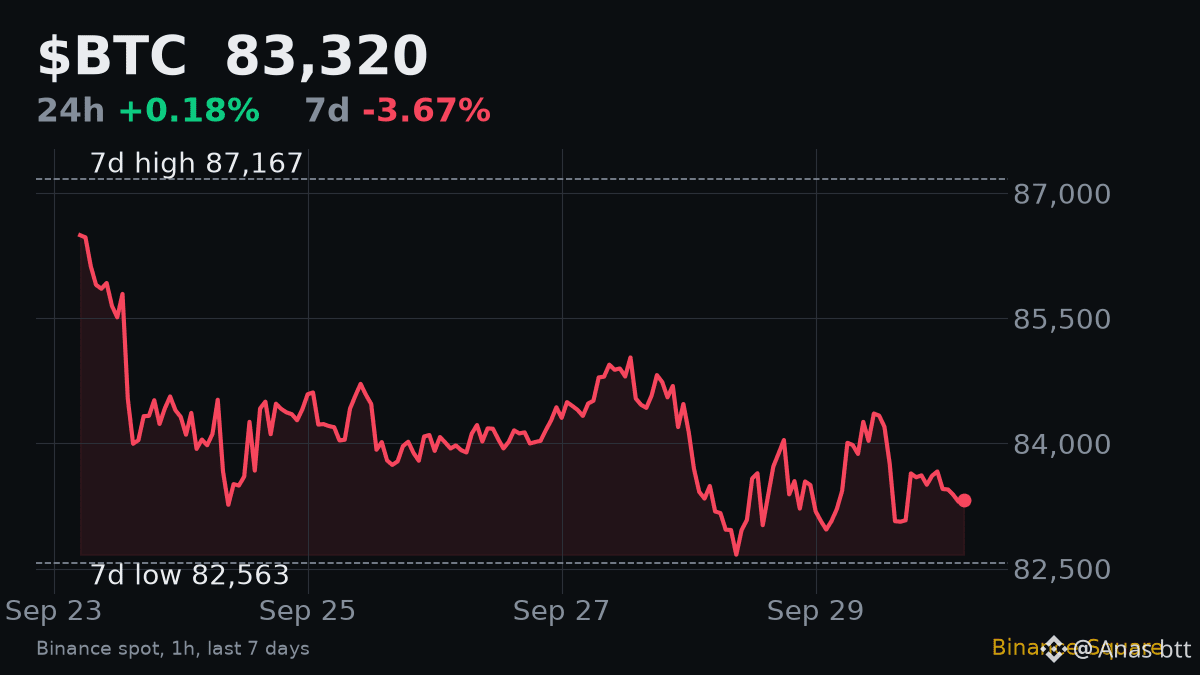
BTC is at 83,320, flat on the day at +0.18% but down 3.7% on the week.
It sits 4.4% under the 7-day high of 87,167.
Volume is only 0.78 times its 7-day average.
Hourly RSI is 44.6, just under neutral.
A trend score is built from what already happened, so it tends to peak after the move. Falling volume and soft momentum describe what is happening now. Fear & Greed easing from 73 to 71 fits the same picture.
My view: no trade yet, with a slight bearish lean while volume stays light.
A push back above 87,167 on volume above average would mean the rally has restarted.
A break below 82,563, the 7-day low, would turn this cooling into a real pullback.
I am watching whether volume returns on the next move, in either direction.
#CryptoQuant #OnChain
A trend gauge near its maximum while the buyers walk away. That is the odd split on $BTC today.
CoinDesk reports that CryptoQuant's "bull score" is close to a perfect reading, even though the buyers who pushed BTC to an eight-month high are already pulling back.
I side with the cooling part. The market data backs it:
BTC is at 83,320, flat on the day at +0.18% but down 3.7% on the week.
It sits 4.4% under the 7-day high of 87,167.
Volume is only 0.78 times its 7-day average.
Hourly RSI is 44.6, just under neutral.
A trend score is built from what already happened, so it tends to peak after the move. Falling volume and soft momentum describe what is happening now. Fear & Greed easing from 73 to 71 fits the same picture.
My view: no trade yet, with a slight bearish lean while volume stays light.
A push back above 87,167 on volume above average would mean the rally has restarted.
A break below 82,563, the 7-day low, would turn this cooling into a real pullback.
I am watching whether volume returns on the next move, in either direction.
#CryptoQuant #OnChain
CoinDesk reports that CryptoQuant's "bull score" is close to a perfect reading, even though the buyers who pushed BTC to an eight-month high are already pulling back.
I side with the cooling part. The market data backs it:
BTC is at 83,320, flat on the day at +0.18% but down 3.7% on the week.
It sits 4.4% under the 7-day high of 87,167.
Volume is only 0.78 times its 7-day average.
Hourly RSI is 44.6, just under neutral.
A trend score is built from what already happened, so it tends to peak after the move. Falling volume and soft momentum describe what is happening now. Fear & Greed easing from 73 to 71 fits the same picture.
My view: no trade yet, with a slight bearish lean while volume stays light.
A push back above 87,167 on volume above average would mean the rally has restarted.
A break below 82,563, the 7-day low, would turn this cooling into a real pullback.
I am watching whether volume returns on the next move, in either direction.
#CryptoQuant #OnChain
1
43
·
--
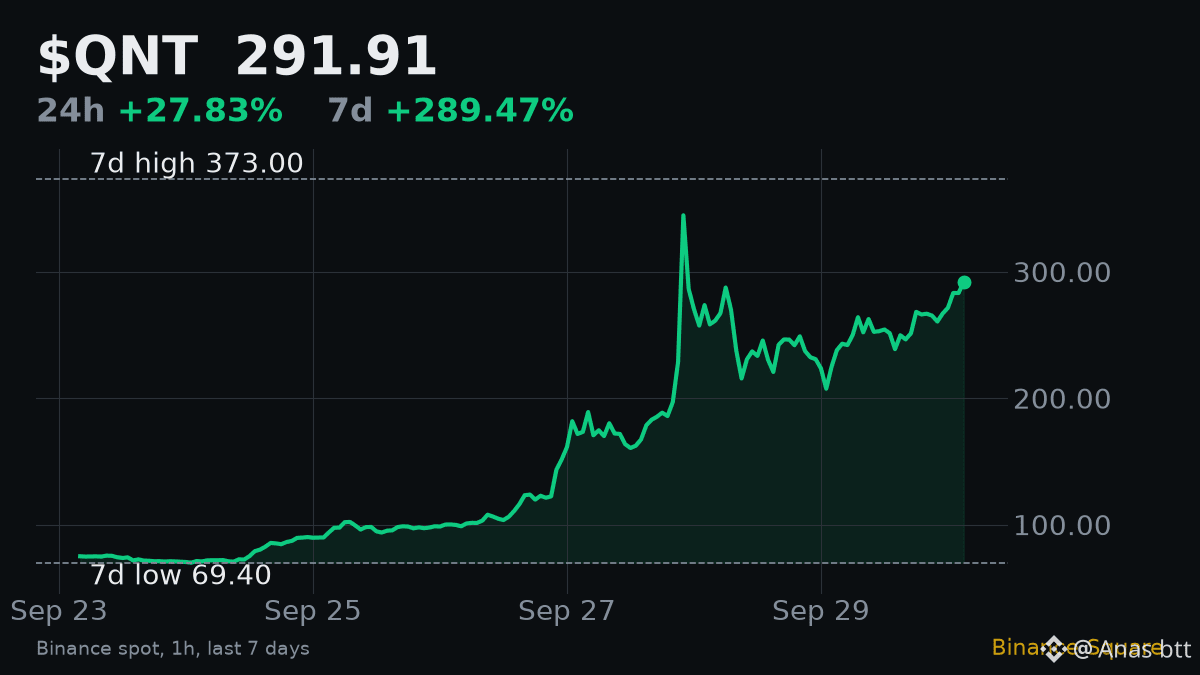
Round two for $QNT. After the spike to 373 faded, buyers came back hard: +27.8% in the last 24 hours, price now 291.91.
Zoom out and the week is extreme. QNT is up 289% from a 7-day low of 69.4. Moves this size rarely end quietly.
What I like about this leg: volume is about 182.8M USDT, 2.06 times the 7-day average, and that average already includes the whole run. This is not a thin bounce. $BTC moved only 0.32%, so none of this is the market lifting all coins.
What I do not like: hourly RSI is 67.6, close to stretched, and price still needs another 27.8% to retest 373. The first test of that level failed fast.
My view: strong trend, bad location to start a position. No trade yet.
Proof of strength: a break above 373 with volume holding near 2x average.
Proof of failure: a drop back below about 228, where this 24h leg began. That would hand back the entire second push.
Until one of those happens, I am watching how price behaves on any pullback. Shallow dips on falling volume would be the healthiest sign.
#QNT #Momentum
Round two for $QNT . After the spike to 373 faded, buyers came back hard: +27.8% in the last 24 hours, price now 291.91.
Zoom out and the week is extreme. QNT is up 289% from a 7-day low of 69.4. Moves this size rarely end quietly.
What I like about this leg: volume is about 182.8M USDT, 2.06 times the 7-day average, and that average already includes the whole run. This is not a thin bounce. $BTC moved only 0.32%, so none of this is the market lifting all coins.
What I do not like: hourly RSI is 67.6, close to stretched, and price still needs another 27.8% to retest 373. The first test of that level failed fast.
My view: strong trend, bad location to start a position. No trade yet.
Proof of strength: a break above 373 with volume holding near 2x average.
Proof of failure: a drop back below about 228, where this 24h leg began. That would hand back the entire second push.
Until one of those happens, I am watching how price behaves on any pullback. Shallow dips on falling volume would be the healthiest sign.
#QNT #Momentum
Zoom out and the week is extreme. QNT is up 289% from a 7-day low of 69.4. Moves this size rarely end quietly.
What I like about this leg: volume is about 182.8M USDT, 2.06 times the 7-day average, and that average already includes the whole run. This is not a thin bounce. $BTC moved only 0.32%, so none of this is the market lifting all coins.
What I do not like: hourly RSI is 67.6, close to stretched, and price still needs another 27.8% to retest 373. The first test of that level failed fast.
My view: strong trend, bad location to start a position. No trade yet.
Proof of strength: a break above 373 with volume holding near 2x average.
Proof of failure: a drop back below about 228, where this 24h leg began. That would hand back the entire second push.
Until one of those happens, I am watching how price behaves on any pullback. Shallow dips on falling volume would be the healthiest sign.
#QNT #Momentum
1
196
·
--
Good news for Ethereum users. Not a reason to trade $ETH this week.
Decrypt reports that Aztec Labs relaunched zk.money, a self-custodial wallet on Aztec Network that lets people send stablecoins privately using readable tags instead of long addresses.
I like this kind of progress. Private payments that normal people can use are a real gap. But tools like this take months to matter, and the ETH chart is living in the short term.
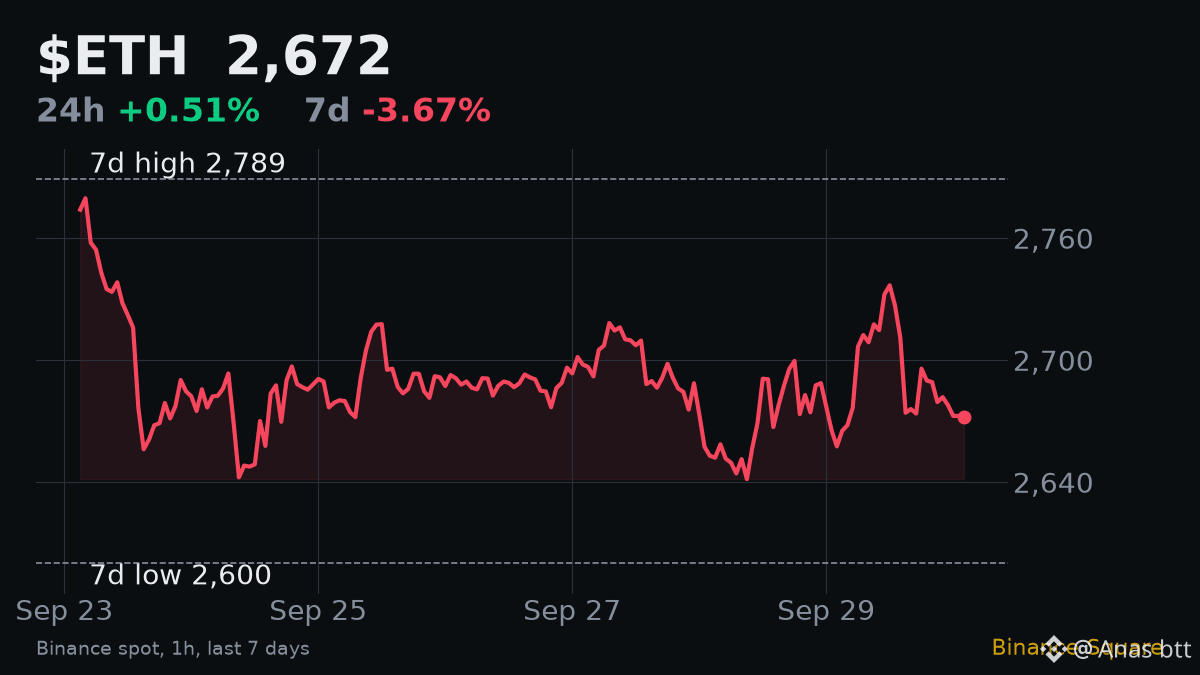
Here is what it shows. ETH is at 2,672, up 0.5% on the day but down 3.7% on the week, 4.2% under the 7-day high of 2,789. Volume is 1.37 times its 7-day average, so trading is picking up. Hourly RSI sits at 42.9, a bit on the weak side. More activity with soft momentum usually means both sides are fighting, not that buyers have won.
My view: neutral, no trade yet.
Above 2,789 with that volume holding, I turn bullish.
Below 2,600, the 7-day low, the weekly downtrend is still in charge.
What I watch next is whether this higher volume leads to a push toward the top or bottom of that range.
#Aztec #Privacy
Good news for Ethereum users. Not a reason to trade $ETH this week.
Decrypt reports that Aztec Labs relaunched zk.money, a self-custodial wallet on Aztec Network that lets people send stablecoins privately using readable tags instead of long addresses.
I like this kind of progress. Private payments that normal people can use are a real gap. But tools like this take months to matter, and the ETH chart is living in the short term.
Here is what it shows. ETH is at 2,672, up 0.5% on the day but down 3.7% on the week, 4.2% under the 7-day high of 2,789. Volume is 1.37 times its 7-day average, so trading is picking up. Hourly RSI sits at 42.9, a bit on the weak side. More activity with soft momentum usually means both sides are fighting, not that buyers have won.
My view: neutral, no trade yet.
Above 2,789 with that volume holding, I turn bullish.
Below 2,600, the 7-day low, the weekly downtrend is still in charge.
What I watch next is whether this higher volume leads to a push toward the top or bottom of that range.
#Aztec #Privacy
Decrypt reports that Aztec Labs relaunched zk.money, a self-custodial wallet on Aztec Network that lets people send stablecoins privately using readable tags instead of long addresses.
I like this kind of progress. Private payments that normal people can use are a real gap. But tools like this take months to matter, and the ETH chart is living in the short term.
Here is what it shows. ETH is at 2,672, up 0.5% on the day but down 3.7% on the week, 4.2% under the 7-day high of 2,789. Volume is 1.37 times its 7-day average, so trading is picking up. Hourly RSI sits at 42.9, a bit on the weak side. More activity with soft momentum usually means both sides are fighting, not that buyers have won.
My view: neutral, no trade yet.
Above 2,789 with that volume holding, I turn bullish.
Below 2,600, the 7-day low, the weekly downtrend is still in charge.
What I watch next is whether this higher volume leads to a push toward the top or bottom of that range.
#Aztec #Privacy
1
64
·
--
Volume on $0G ran at 6.7 times its 7-day average in the last 24 hours. The multiple is huge. The size is not: about 25.8M USDT.
That mix is the whole story for me. In a market this small, a burst of buying can move price a long way, and the same is true in reverse.
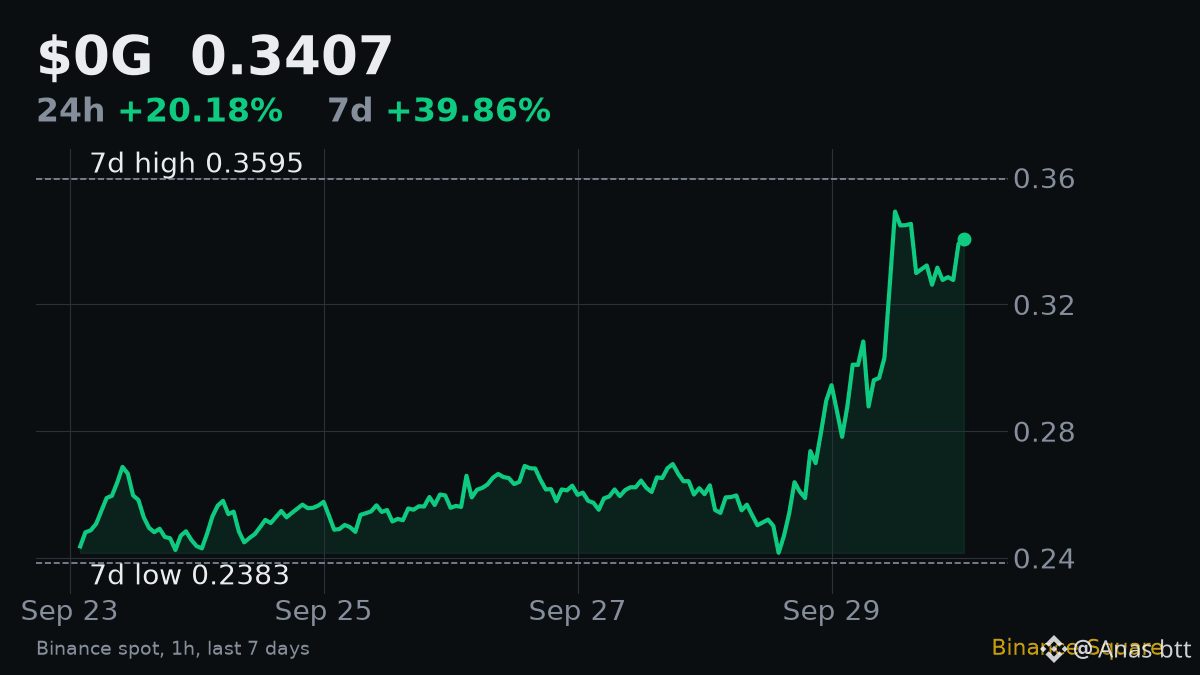
It did move. 0G is at 0.3407, up 20.2% on the day and 39.9% on the week. The 7-day range runs from 0.2383 to 0.3595, and price is now 5.2% under the top of it. Hourly RSI is 65.5, hot but not extreme. $BTC added only 0.53%, so the market did not carry this.
My view: no trade yet. Thin markets with sudden volume can reverse just as fast when the buyers step back. I would rather see the move hold for a while than chase it.
Bullish if: price clears 0.3595 and volume stays well above average.
Wrong if: it falls back below about 0.2835, where the day started. That would erase the whole 24h gain.
What I watch next is simple: does the volume fade tomorrow while price holds, or does price fade with it.
#Liquidity #VolumeSpike
Volume on $0G ran at 6.7 times its 7-day average in the last 24 hours. The multiple is huge. The size is not: about 25.8M USDT.
That mix is the whole story for me. In a market this small, a burst of buying can move price a long way, and the same is true in reverse.
It did move. 0G is at 0.3407, up 20.2% on the day and 39.9% on the week. The 7-day range runs from 0.2383 to 0.3595, and price is now 5.2% under the top of it. Hourly RSI is 65.5, hot but not extreme. $BTC added only 0.53%, so the market did not carry this.
My view: no trade yet. Thin markets with sudden volume can reverse just as fast when the buyers step back. I would rather see the move hold for a while than chase it.
Bullish if: price clears 0.3595 and volume stays well above average.
Wrong if: it falls back below about 0.2835, where the day started. That would erase the whole 24h gain.
What I watch next is simple: does the volume fade tomorrow while price holds, or does price fade with it.
#Liquidity #VolumeSpike
That mix is the whole story for me. In a market this small, a burst of buying can move price a long way, and the same is true in reverse.
It did move. 0G is at 0.3407, up 20.2% on the day and 39.9% on the week. The 7-day range runs from 0.2383 to 0.3595, and price is now 5.2% under the top of it. Hourly RSI is 65.5, hot but not extreme. $BTC added only 0.53%, so the market did not carry this.
My view: no trade yet. Thin markets with sudden volume can reverse just as fast when the buyers step back. I would rather see the move hold for a while than chase it.
Bullish if: price clears 0.3595 and volume stays well above average.
Wrong if: it falls back below about 0.2835, where the day started. That would erase the whole 24h gain.
What I watch next is simple: does the volume fade tomorrow while price holds, or does price fade with it.
#Liquidity #VolumeSpike
1
308
·
--
The number that stood out to me in the last 24 hours: $ZEC traded about 307.6M USDT, the third highest volume on Binance spot. Only $BTC and $ETH saw more.
And it did that on a red day. ZEC is down 4.1% at 1,427.
Heavy volume on a falling coin usually means real selling, not a quiet drift lower. Somebody wanted out and the market had to absorb it. The movers chart shows a mixed day elsewhere, so this looks specific to ZEC.
For context, the majors went nowhere. BTC is flat at +0.05% and ETH is down 0.64%. Fear & Greed slipped from 73 to 71, still Greed.
My view: bearish short term on ZEC until that selling is absorbed. I want to see volume fall while price holds, which would tell me sellers are running out.
What changes my mind: a move back above about 1,488, where the day started. That would erase the drop on the same heavy volume and flip the read.
Next I watch whether ZEC stays in the top 3 by volume tomorrow. If it does while still falling, the exit is not finished.
#ZEC #Volume
The number that stood out to me in the last 24 hours: $ZEC traded about 307.6M USDT, the third highest volume on Binance spot. Only $BTC and $ETH saw more.
And it did that on a red day. ZEC is down 4.1% at 1,427.
Heavy volume on a falling coin usually means real selling, not a quiet drift lower. Somebody wanted out and the market had to absorb it. The movers chart shows a mixed day elsewhere, so this looks specific to ZEC.
For context, the majors went nowhere. BTC is flat at +0.05% and ETH is down 0.64%. Fear & Greed slipped from 73 to 71, still Greed.
My view: bearish short term on ZEC until that selling is absorbed. I want to see volume fall while price holds, which would tell me sellers are running out.
What changes my mind: a move back above about 1,488, where the day started. That would erase the drop on the same heavy volume and flip the read.
Next I watch whether ZEC stays in the top 3 by volume tomorrow. If it does while still falling, the exit is not finished.
#ZEC #Volume
And it did that on a red day. ZEC is down 4.1% at 1,427.
Heavy volume on a falling coin usually means real selling, not a quiet drift lower. Somebody wanted out and the market had to absorb it. The movers chart shows a mixed day elsewhere, so this looks specific to ZEC.
For context, the majors went nowhere. BTC is flat at +0.05% and ETH is down 0.64%. Fear & Greed slipped from 73 to 71, still Greed.
My view: bearish short term on ZEC until that selling is absorbed. I want to see volume fall while price holds, which would tell me sellers are running out.
What changes my mind: a move back above about 1,488, where the day started. That would erase the drop on the same heavy volume and flip the read.
Next I watch whether ZEC stays in the top 3 by volume tomorrow. If it does while still falling, the exit is not finished.
#ZEC #Volume
1
297
·
--
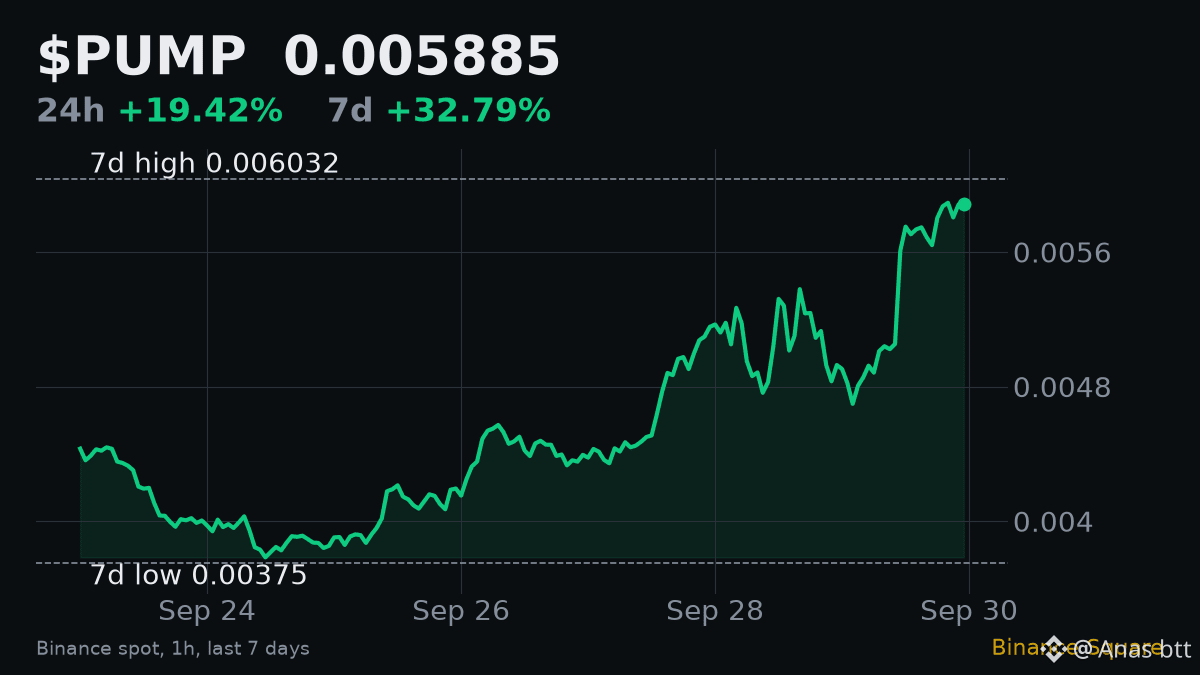
0.006032 is the only level on the $PUMP chart I care about tonight. That is the 7-day high, and price sits just 2.4% under it at 0.005885.
The run into it looks healthy. PUMP is up 19.4% in 24 hours and 32.8% on the week, and volume is about 78.2M USDT, 1.82 times its 7-day average. Real participation, not a thin drift higher. And with $BTC flat at +0.07%, this move is coin-specific.
The catch is timing. Hourly RSI is 68.7, right at the edge of overbought. Price is testing a ceiling with momentum already stretched, and that is where first attempts often stall.
My view: constructive, but no entry at the ceiling.
Bullish trigger: an hourly close above 0.006032 with volume still near 2x average. That turns the 7-day high into support.
What cancels it: a slide back below 0.00493, where the day started. Then the whole 24h gain is gone and this was a failed test.
I am waiting for the breakout or the rejection, not guessing between them.
#PUMP #Breakout
0.006032 is the only level on the $PUMP chart I care about tonight. That is the 7-day high, and price sits just 2.4% under it at 0.005885.
The run into it looks healthy. PUMP is up 19.4% in 24 hours and 32.8% on the week, and volume is about 78.2M USDT, 1.82 times its 7-day average. Real participation, not a thin drift higher. And with $BTC flat at +0.07%, this move is coin-specific.
The catch is timing. Hourly RSI is 68.7, right at the edge of overbought. Price is testing a ceiling with momentum already stretched, and that is where first attempts often stall.
My view: constructive, but no entry at the ceiling.
Bullish trigger: an hourly close above 0.006032 with volume still near 2x average. That turns the 7-day high into support.
What cancels it: a slide back below 0.00493, where the day started. Then the whole 24h gain is gone and this was a failed test.
I am waiting for the breakout or the rejection, not guessing between them.
#PUMP #Breakout
The run into it looks healthy. PUMP is up 19.4% in 24 hours and 32.8% on the week, and volume is about 78.2M USDT, 1.82 times its 7-day average. Real participation, not a thin drift higher. And with $BTC flat at +0.07%, this move is coin-specific.
The catch is timing. Hourly RSI is 68.7, right at the edge of overbought. Price is testing a ceiling with momentum already stretched, and that is where first attempts often stall.
My view: constructive, but no entry at the ceiling.
Bullish trigger: an hourly close above 0.006032 with volume still near 2x average. That turns the 7-day high into support.
What cancels it: a slide back below 0.00493, where the day started. Then the whole 24h gain is gone and this was a failed test.
I am waiting for the breakout or the rejection, not guessing between them.
#PUMP #Breakout
1
225
·
--
Hourly RSI on $BTC reads 49.7 right now. Most people would call that "nothing". It is actually a useful reading, if you know what RSI can and cannot tell you.
What it is: RSI compares the size of recent up moves with recent down moves and puts the result on a 0 to 100 scale. Above 70 is called overbought, below 30 oversold. Around 50, buyers and sellers are roughly balanced.
Trap 1: treating 70 as a sell signal. In a strong trend RSI can stay above 70 for a long time while price keeps climbing. High RSI means strong momentum, not a top.
Trap 2: ignoring the timeframe. The 49.7 here is on 1-hour candles. It describes roughly the last 14 hours, not the bigger picture.
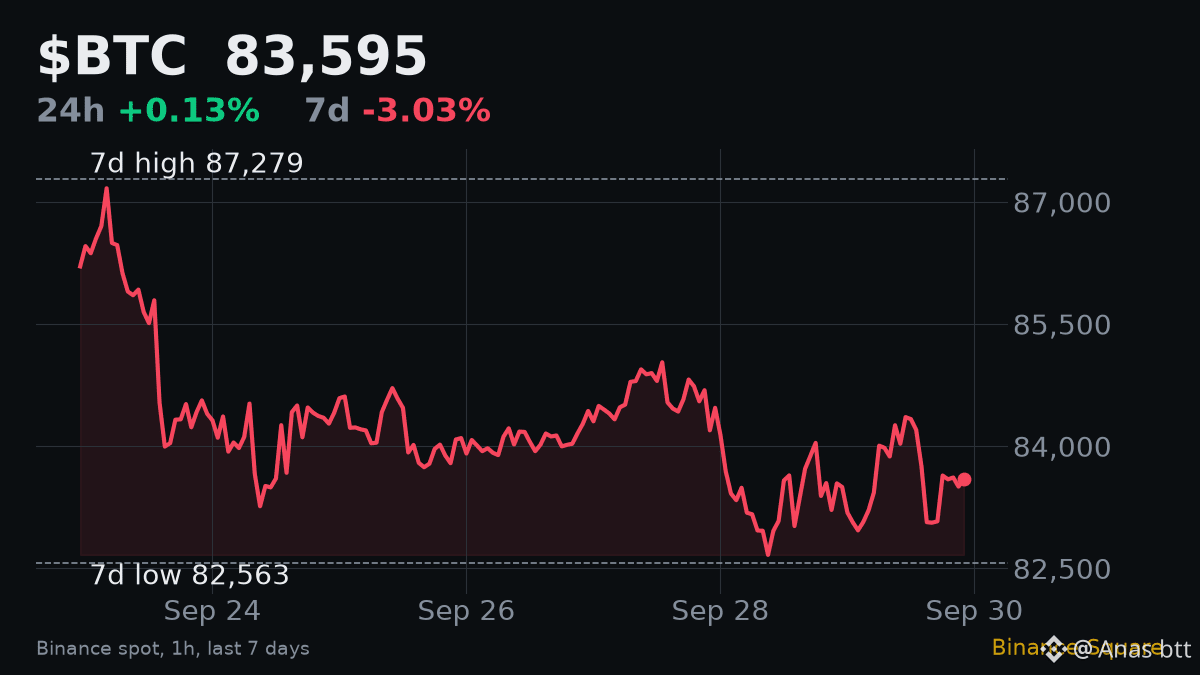
Trap 3: reading RSI alone. Look at the context. BTC is at 83,595, down 3.0% on the week and 4.2% under its 7-day high of 87,279. After that drop, an hourly RSI near 50 tells me the selling pressure has faded. It does not tell me buyers have taken over. Volume at 0.81 times its weekly average agrees: nobody is pushing hard either way.
Practical takeaway: use RSI to measure how strong a move is, then confirm with price levels and volume before acting. Here, a break of the 87,279 high or the 82,563 low on rising volume would matter far more than any RSI number.
#RSI #TechnicalAnalysis
Hourly RSI on $BTC reads 49.7 right now. Most people would call that "nothing". It is actually a useful reading, if you know what RSI can and cannot tell you.
What it is: RSI compares the size of recent up moves with recent down moves and puts the result on a 0 to 100 scale. Above 70 is called overbought, below 30 oversold. Around 50, buyers and sellers are roughly balanced.
Trap 1: treating 70 as a sell signal. In a strong trend RSI can stay above 70 for a long time while price keeps climbing. High RSI means strong momentum, not a top.
Trap 2: ignoring the timeframe. The 49.7 here is on 1-hour candles. It describes roughly the last 14 hours, not the bigger picture.
Trap 3: reading RSI alone. Look at the context. BTC is at 83,595, down 3.0% on the week and 4.2% under its 7-day high of 87,279. After that drop, an hourly RSI near 50 tells me the selling pressure has faded. It does not tell me buyers have taken over. Volume at 0.81 times its weekly average agrees: nobody is pushing hard either way.
Practical takeaway: use RSI to measure how strong a move is, then confirm with price levels and volume before acting. Here, a break of the 87,279 high or the 82,563 low on rising volume would matter far more than any RSI number.
#RSI #TechnicalAnalysis
What it is: RSI compares the size of recent up moves with recent down moves and puts the result on a 0 to 100 scale. Above 70 is called overbought, below 30 oversold. Around 50, buyers and sellers are roughly balanced.
Trap 1: treating 70 as a sell signal. In a strong trend RSI can stay above 70 for a long time while price keeps climbing. High RSI means strong momentum, not a top.
Trap 2: ignoring the timeframe. The 49.7 here is on 1-hour candles. It describes roughly the last 14 hours, not the bigger picture.
Trap 3: reading RSI alone. Look at the context. BTC is at 83,595, down 3.0% on the week and 4.2% under its 7-day high of 87,279. After that drop, an hourly RSI near 50 tells me the selling pressure has faded. It does not tell me buyers have taken over. Volume at 0.81 times its weekly average agrees: nobody is pushing hard either way.
Practical takeaway: use RSI to measure how strong a move is, then confirm with price levels and volume before acting. Here, a break of the 87,279 high or the 82,563 low on rising volume would matter far more than any RSI number.
#RSI #TechnicalAnalysis
1
66
·
--
The first US spot $NEAR ETF went live today, and NEAR volume came in below its weekly average. That gap is my whole take.
Per Decrypt, Bitwise's NRR started trading on NYSE Arca on Tuesday. It gives brokerage accounts NEAR exposure plus staking rewards, after the token nearly tripled since August.
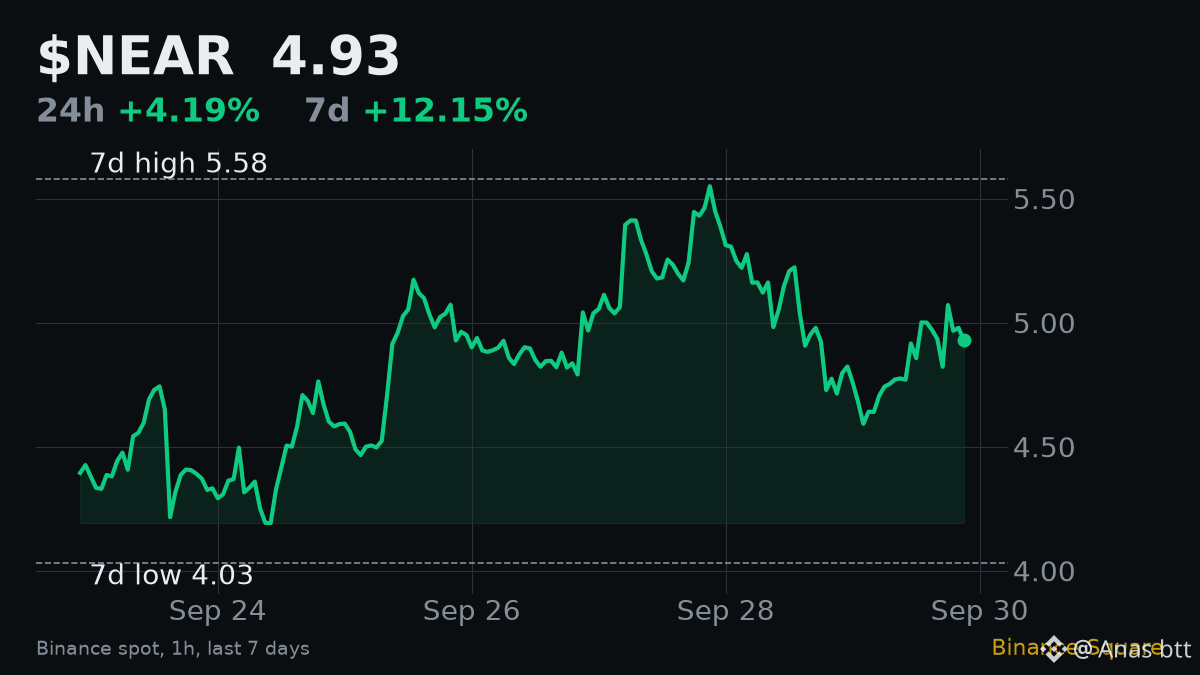
Now the market data. Price is 4.926, up 4.2% on the day and 12.2% on the week. But it sits 11.7% under the 7-day high of 5.578. Spot volume was about 202.7M USDT, only 0.74 times the 7-day average. Hourly RSI is 51, neutral.
A launch like this is the kind of news traders position for in advance. When the day arrives and volume drops instead of rising, I read it as the news already being priced in. It is not bearish on its own, but it is not a fresh buyer showing up either.
View: no trade yet.
A move back above 5.578 on volume above average would tell me ETF demand is real, and I turn bullish.
Below 4.80, the middle of this week's range, I expect a classic sell-the-news fade.
$BTC is flat at +0.12%, so NEAR has to carry this move alone. Next I watch whether volume picks up over the next few sessions.
#NEARETF #Bitwise
The first US spot $NEAR ETF went live today, and NEAR volume came in below its weekly average. That gap is my whole take.
Per Decrypt, Bitwise's NRR started trading on NYSE Arca on Tuesday. It gives brokerage accounts NEAR exposure plus staking rewards, after the token nearly tripled since August.
Now the market data. Price is 4.926, up 4.2% on the day and 12.2% on the week. But it sits 11.7% under the 7-day high of 5.578. Spot volume was about 202.7M USDT, only 0.74 times the 7-day average. Hourly RSI is 51, neutral.
A launch like this is the kind of news traders position for in advance. When the day arrives and volume drops instead of rising, I read it as the news already being priced in. It is not bearish on its own, but it is not a fresh buyer showing up either.
View: no trade yet.
A move back above 5.578 on volume above average would tell me ETF demand is real, and I turn bullish.
Below 4.80, the middle of this week's range, I expect a classic sell-the-news fade.
$BTC is flat at +0.12%, so NEAR has to carry this move alone. Next I watch whether volume picks up over the next few sessions.
#NEARETF #Bitwise
Per Decrypt, Bitwise's NRR started trading on NYSE Arca on Tuesday. It gives brokerage accounts NEAR exposure plus staking rewards, after the token nearly tripled since August.
Now the market data. Price is 4.926, up 4.2% on the day and 12.2% on the week. But it sits 11.7% under the 7-day high of 5.578. Spot volume was about 202.7M USDT, only 0.74 times the 7-day average. Hourly RSI is 51, neutral.
A launch like this is the kind of news traders position for in advance. When the day arrives and volume drops instead of rising, I read it as the news already being priced in. It is not bearish on its own, but it is not a fresh buyer showing up either.
View: no trade yet.
A move back above 5.578 on volume above average would tell me ETF demand is real, and I turn bullish.
Below 4.80, the middle of this week's range, I expect a classic sell-the-news fade.
$BTC is flat at +0.12%, so NEAR has to carry this move alone. Next I watch whether volume picks up over the next few sessions.
#NEARETF #Bitwise
2
242
Log in to explore more content
Join global crypto users on Binance Square
⚡️ Get latest and useful information about crypto.
💬 Trusted by the world’s largest crypto exchange.
👍 Discover real insights from verified creators.
Email / Phone number
Trending Topics
BitcoinClears$85200
7,168 views
179 Discussing
We got the move, and $BTC is standing exactly where we were before the data. That’s what actual patience for a trade looks like.
The data came in mixed but with some important numbers. ADP Non-Farm Employment Change came at 90K vs 73K forecast, while Core PCE came in at 0.2% vs 0.3% expected. Final GDP was also stronger at 2.2% vs 1.5% forecast, while Personal Spending came in at 0.9% vs 0.8% expected. At the same time, Personal Income missed at 0.2% vs 0.5% forecast.
BTC initially surged to $85,600 and is now back where it needs to be. I’m still looking toward the lower ranges at $82,759 and the $80,000 liquidity, because the overhead liquidity is done and dusted.
We had a live session during the data, and during that session we saw the market at $83,800, then $85,600, and then back toward $83,000 and we still didn’t enter a trade.
That’s what patience is.
We can’t force an entry when the market has no clear direction. The same range is still in focus, and we’ll wait for the market to give us the setup.
Let me know, guys, how was the session? And should we have more regular sessions with our respected members so we can have proper discussions regarding the market?
#BitcoinClears$85200 #AltcoinSeasonIndexHoldsAbove60For5Days #USADPAdds90000JobsInSeptember #BitcoinSlipsBelow$84000 #SECToClarifyOnChainFundraisingRules
Crypto_LUX
·24 Likes
·13.7k views
AltcoinSeasonIndexHoldsAbove60For5Days
38,837 views
984 Discussing
USADPAdds90000JobsInSeptember
17,534 views
559 Discussing