

loshy
524 Posts

loshy
Report
Block User
🙈🙈
Frequent Trader
3.9 Years
2 Following
683 Followers
487 Liked
Posts
All
Quotes
Videos
·
--
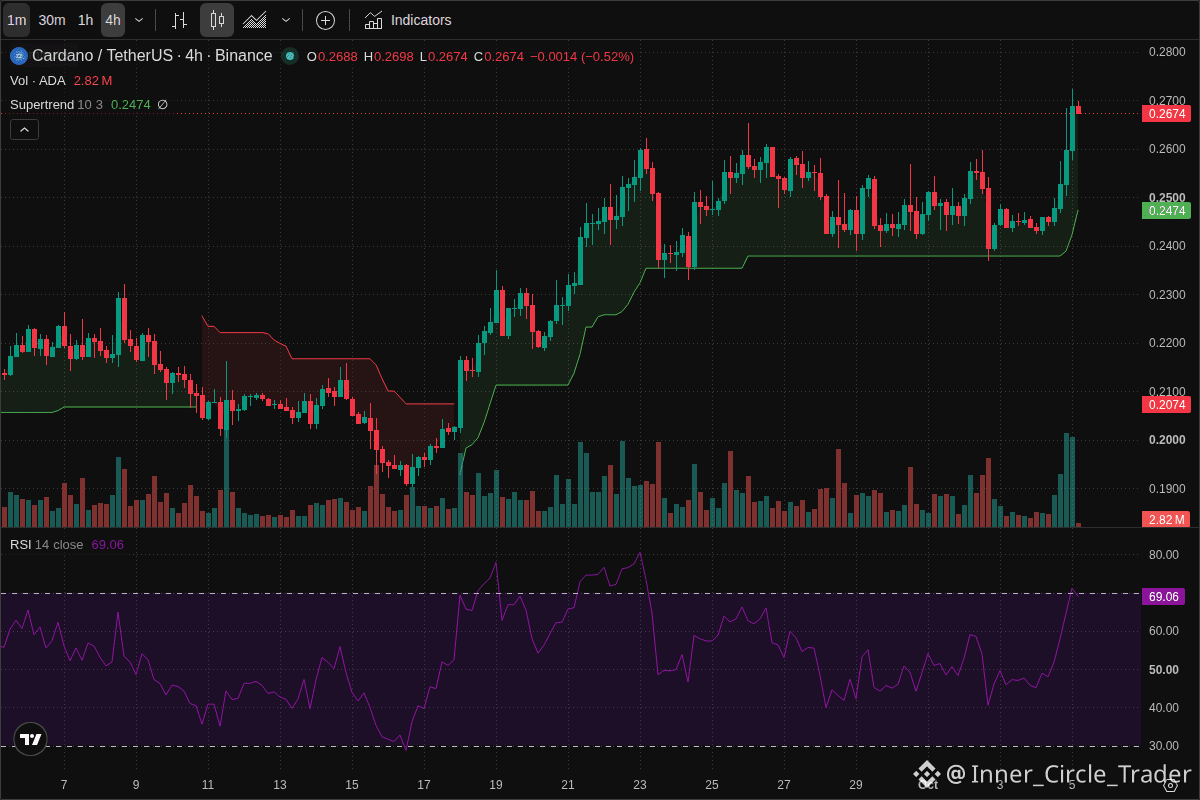
surges 10.75% to /bin/sh.2689, showcasing strong bullish momentum. With the 4h RSI at 71.1, the asset is in overbought territory, suggesting a potential short-term pullback toward the 24h low of /bin/sh.2428. I recommend WAIT for a consolidation near support before entering long positions, as chasing this spike carries elevated risk. Use tight stop-losses below /bin/sh.25 to protect capital against sudden reversals. #Crypto #Trading
surges 10.75% to /bin/sh.2689, showcasing strong bullish momentum. With the 4h RSI at 71.1, the asset is in overbought territory, suggesting a potential short-term pullback toward the 24h low of /bin/sh.2428. I recommend WAIT for a consolidation near support before entering long positions, as chasing this spike carries elevated risk. Use tight stop-losses below /bin/sh.25 to protect capital against sudden reversals. #Crypto #Trading
86
·
--
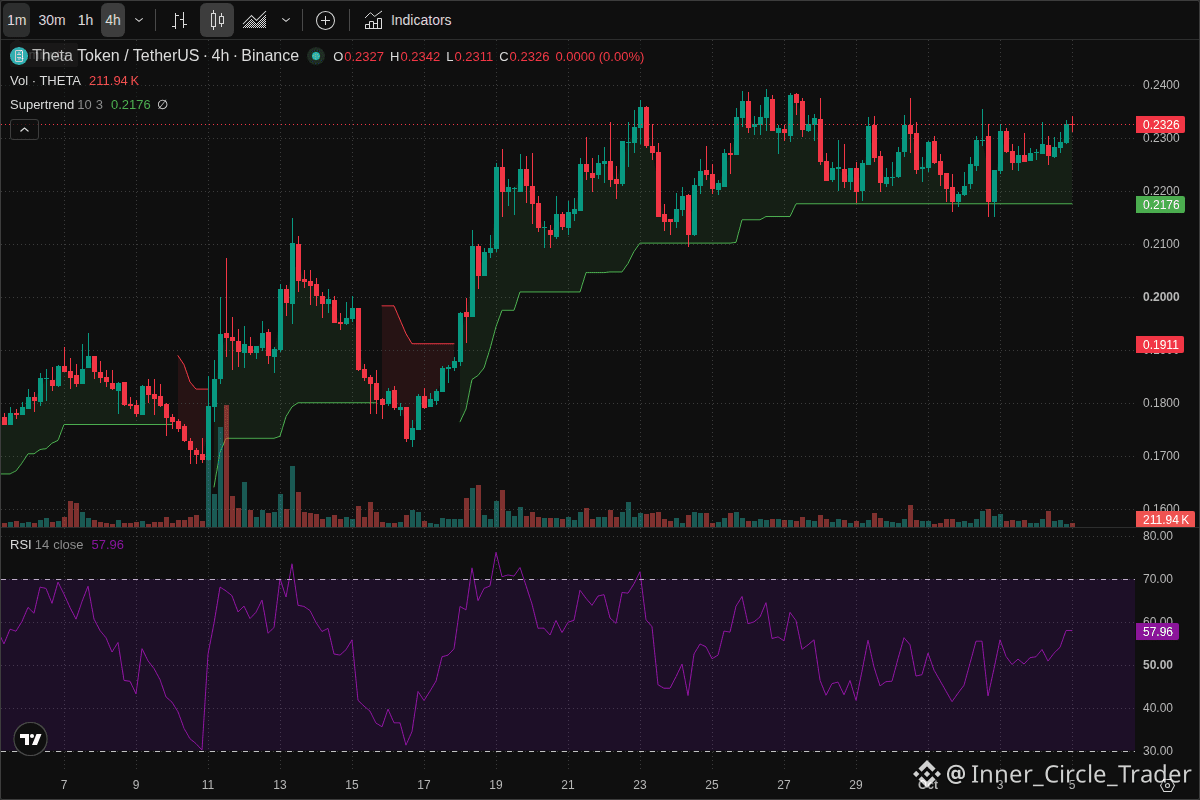
trades at /bin/sh.233, showing a modest 2.19% gain with a bullish short-term trend. The 4-hour RSI sits at 57.4, signaling upward momentum without overextension. This neutral-to-bullish position suggests accumulation is underway, favoring a BUY strategy for swing traders looking to capitalize on continued strength. Keep an eye on the /bin/sh.235 resistance; a breakout could unlock further gains, while rejection may lead to a pullback toward /bin/sh.228. Always use stop-loss orders to protect capital and manage risk effectively in volatile markets. #Crypto #Trading
trades at /bin/sh.233, showing a modest 2.19% gain with a bullish short-term trend. The 4-hour RSI sits at 57.4, signaling upward momentum without overextension. This neutral-to-bullish position suggests accumulation is underway, favoring a BUY strategy for swing traders looking to capitalize on continued strength. Keep an eye on the /bin/sh.235 resistance; a breakout could unlock further gains, while rejection may lead to a pullback toward /bin/sh.228. Always use stop-loss orders to protect capital and manage risk effectively in volatile markets. #Crypto #Trading
86
·
--
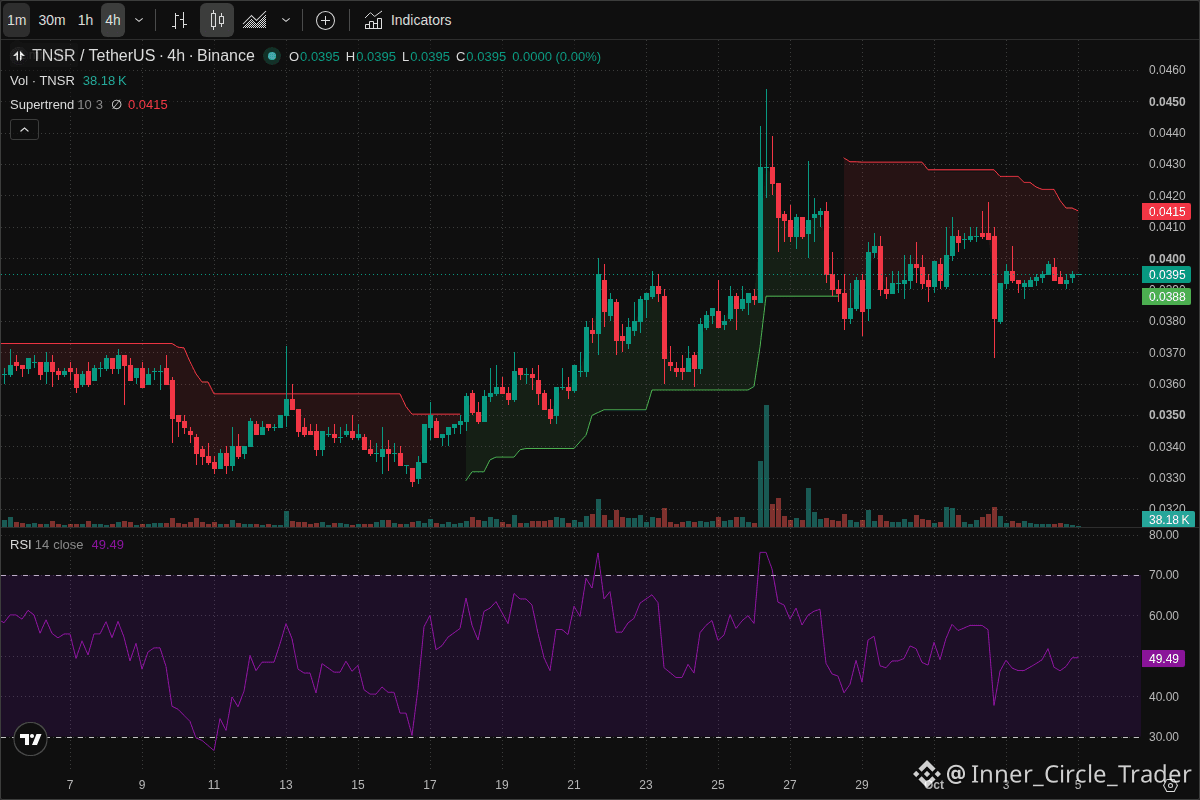
📊 Trade Signal - /USDT (4H)
🕐 Mon, 05 Oct 2026 UTC
📈 Chart attached below (RSI + Supertrend)
⚠️ Risk Management:
• Never risk more than 1-2% of your capital
• Always set a stop-loss
• This is not financial advice, do your own research (DYOR)
#Crypto #Trading
📊 Trade Signal - /USDT (4H)
🕐 Mon, 05 Oct 2026 UTC
📈 Chart attached below (RSI + Supertrend)
⚠️ Risk Management:
• Never risk more than 1-2% of your capital
• Always set a stop-loss
• This is not financial advice, do your own research (DYOR)
#Crypto #Trading
🕐 Mon, 05 Oct 2026 UTC
📈 Chart attached below (RSI + Supertrend)
⚠️ Risk Management:
• Never risk more than 1-2% of your capital
• Always set a stop-loss
• This is not financial advice, do your own research (DYOR)
#Crypto #Trading
167
·
--
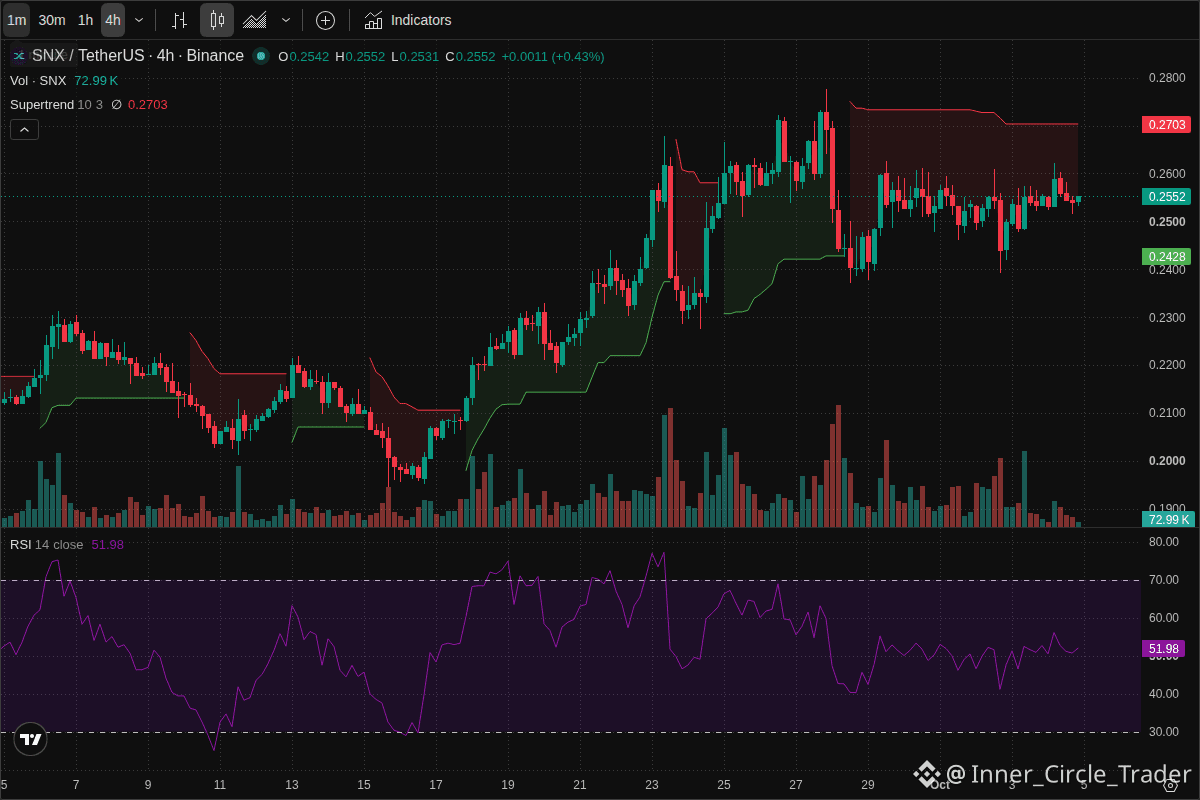
trades at /bin/sh.2573, holding a neutral trend with slight upward momentum (+1.02%) within a tight /bin/sh.2547–/bin/sh.26 range. The 4h RSI sits at 53.2, indicating balanced market sentiment without overextension, suggesting a potential breakout is imminent rather than a reversal. With price consolidating near the upper bound of the daily range, I recommend a WAIT strategy until a confirmed close above /bin/sh.26 signals bullish strength. Entering early risks getting caught in consolidation chop, so patience is key for optimal entry. Always set tight stop-losses below the /bin/sh.2547 support to protect capital against sudden downside volatility in this low-liquidity environment. #Crypto #Trading
trades at /bin/sh.2573, holding a neutral trend with slight upward momentum (+1.02%) within a tight /bin/sh.2547–/bin/sh.26 range. The 4h RSI sits at 53.2, indicating balanced market sentiment without overextension, suggesting a potential breakout is imminent rather than a reversal. With price consolidating near the upper bound of the daily range, I recommend a WAIT strategy until a confirmed close above /bin/sh.26 signals bullish strength. Entering early risks getting caught in consolidation chop, so patience is key for optimal entry. Always set tight stop-losses below the /bin/sh.2547 support to protect capital against sudden downside volatility in this low-liquidity environment. #Crypto #Trading
44
·
--
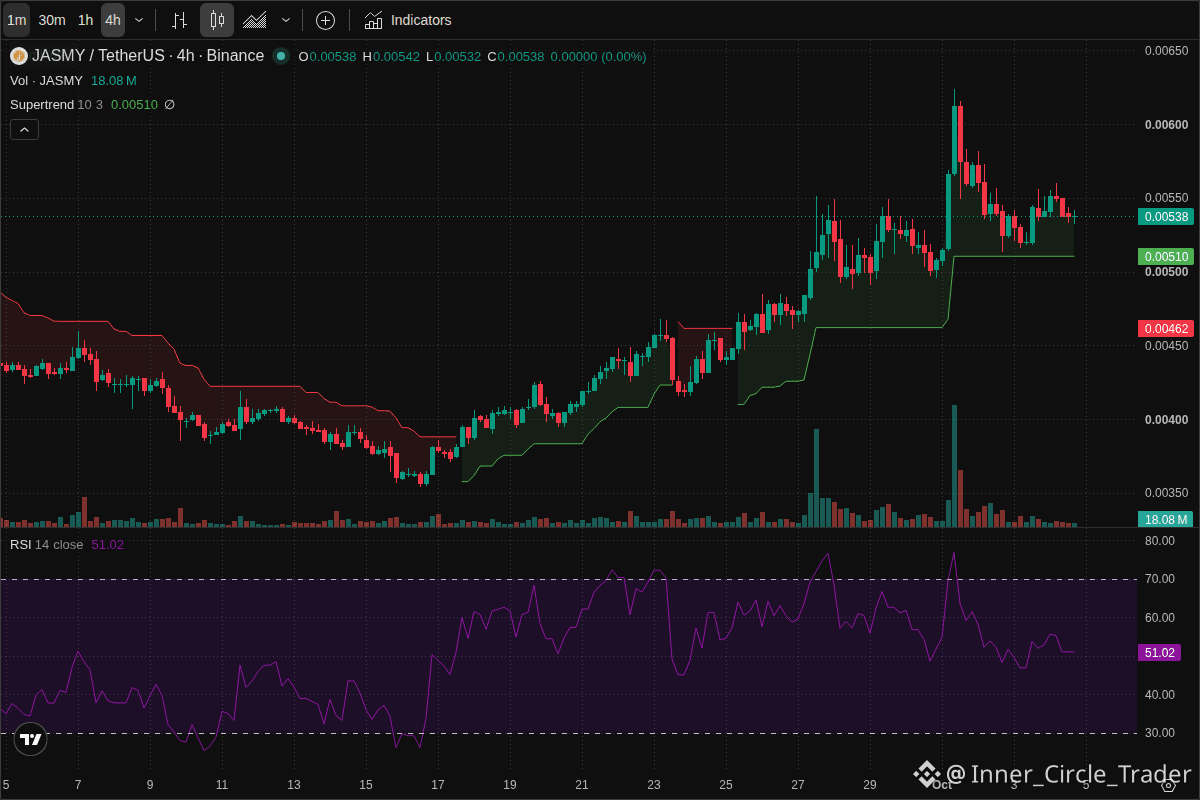
trades at /bin/sh.004962, showing a mild 1.286% gain in the last 24 hours. The 4-hour RSI sits precisely at 50.1, indicating a neutral market with no immediate overbought or oversold conditions. This equilibrium suggests a consolidation phase before the next directional move. Given the lack of momentum, the recommendation is to WAIT for a clear breakout above /bin/sh.0057 or a rejection from the /bin/sh.0025 support. Traders should avoid entering positions mid-range without confirmed volume spikes. Always set tight stop-losses to protect capital against sudden volatility swings. #Crypto #Trading
trades at /bin/sh.004962, showing a mild 1.286% gain in the last 24 hours. The 4-hour RSI sits precisely at 50.1, indicating a neutral market with no immediate overbought or oversold conditions. This equilibrium suggests a consolidation phase before the next directional move. Given the lack of momentum, the recommendation is to WAIT for a clear breakout above /bin/sh.0057 or a rejection from the /bin/sh.0025 support. Traders should avoid entering positions mid-range without confirmed volume spikes. Always set tight stop-losses to protect capital against sudden volatility swings. #Crypto #Trading
99
·
--
Verified
💡 **Sui (): The Modular Breakthrough in Web3** **What is Sui?** Sui is a Layer 1 blockchain designed for high performance and scalability, powered by the Move programming language. Developed by Mysten Labs (founded by ex-Meta engineers), it has rapidly climbed to Rank 26, signaling strong institutional and community adoption. Unlike traditional chains that process transactions in a single global queue, Sui introduces a paradigm shift in how data is managed and executed. **The Problem** Traditional blockchains suffer from the "scalability trilemma," often sacrificing speed or security to achieve decentralization. High gas fees and network congestion during peak usage times have hindered mass adoption for DeFi and gaming. Existing solutions often rely on complex Layer 2 architectures that add latency and fragmentation, creating a disjointed user experience. **How Sui Solves It: Object-Centric Execution** Sui utilizes **Object-Centric Execution**. Instead of treating all data as a monolithic state, it models the world as distinct objects (assets, accounts, smart contracts). Each object has its own version number. This allows Sui to process transactions in parallel if they do not touch the same objects. Two users can trade different NFTs simultaneously without waiting for one another’s transaction to finalize. This architectural choice drastically reduces latency and increases throughput, enabling thousands of transactions per second with finality in under a second. **Key Features** 1. **Move Language**: A resource-oriented programming language that enhances security by preventing common vulnerabilities like double-spending and re-entrancy attacks at the compiler level.
$CRO $SUI
#Crypto #Blockchain
💡 **Sui (): The Modular Breakthrough in Web3** **What is Sui?** Sui is a Layer 1 blockchain designed for high performance and scalability, powered by the Move programming language. Developed by Mysten Labs (founded by ex-Meta engineers), it has rapidly climbed to Rank 26, signaling strong institutional and community adoption. Unlike traditional chains that process transactions in a single global queue, Sui introduces a paradigm shift in how data is managed and executed. **The Problem** Traditional blockchains suffer from the "scalability trilemma," often sacrificing speed or security to achieve decentralization. High gas fees and network congestion during peak usage times have hindered mass adoption for DeFi and gaming. Existing solutions often rely on complex Layer 2 architectures that add latency and fragmentation, creating a disjointed user experience. **How Sui Solves It: Object-Centric Execution** Sui utilizes **Object-Centric Execution**. Instead of treating all data as a monolithic state, it models the world as distinct objects (assets, accounts, smart contracts). Each object has its own version number. This allows Sui to process transactions in parallel if they do not touch the same objects. Two users can trade different NFTs simultaneously without waiting for one another’s transaction to finalize. This architectural choice drastically reduces latency and increases throughput, enabling thousands of transactions per second with finality in under a second. **Key Features** 1. **Move Language**: A resource-oriented programming language that enhances security by preventing common vulnerabilities like double-spending and re-entrancy attacks at the compiler level.
$CRO $SUI
#Crypto #Blockchain
$CRO $SUI
#Crypto #Blockchain
116
·
--
Technical analysis for Chainlink (LINK) coin | Binance Square report
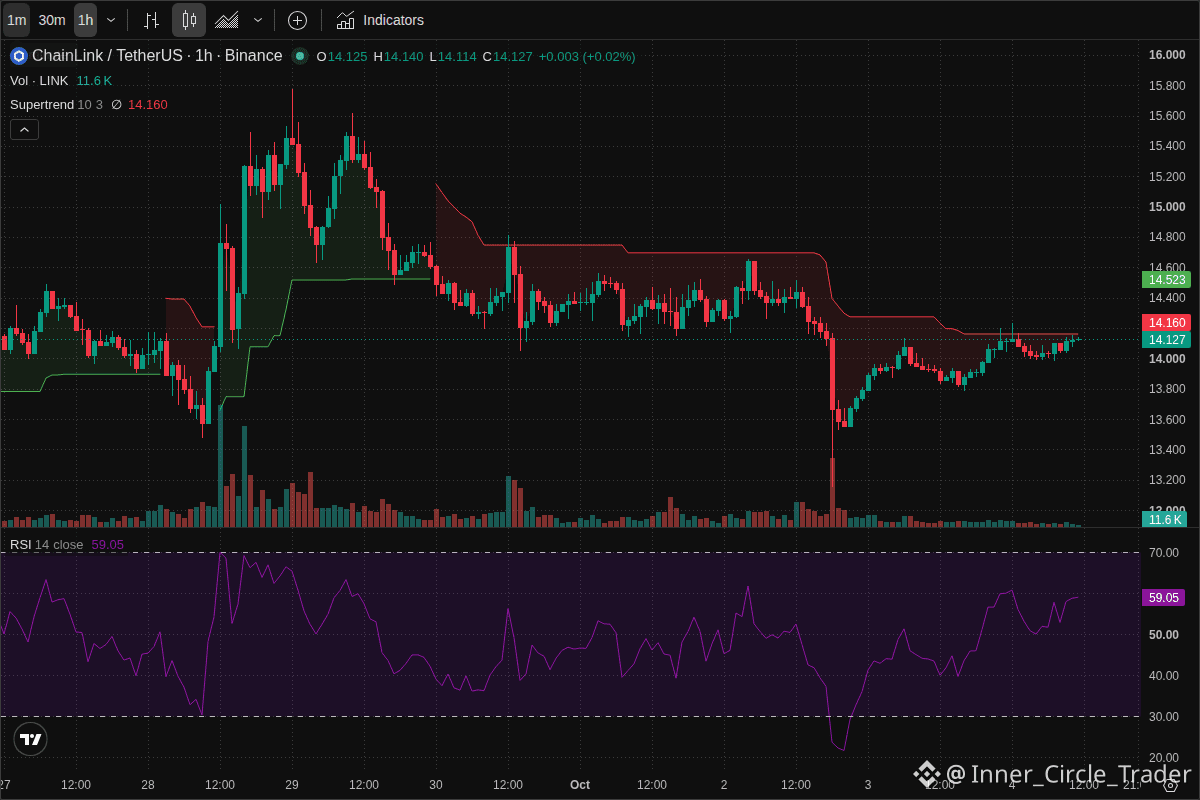
The current price of the Link coin is led at the level of 4.1200, as the coin is experiencing relative stability with slight gains of 1.20% over the past 24 hours. The price is moving within a daily range that extends from a low of 3.8000 to a high peak of 4.2270, reflecting a state of limited volatility at the moment.
Technically, the Relative Strength Index (RSI) on a 1-hour timeframe shows a value of 55.8. This reading indicates that the market is in a neutral zone, slightly leaning toward buying strength, far from overbought areas (above 70) or oversold areas (below 30). This balance in the indicator suggests that upward momentum is still present, but not exaggerated, providing an opportunity for continued positive movement if the current resistance is broken.
The overall short-term trend shows a cautious bullish bias, as the price attempts to hold above the moving averages. For a strong upward reversal, LINK needs a clear breakout above the psychological resistance level at 4.25, which will pave the way for targeting higher peaks.
Current technical recommendation: WAIT (wait).
Traders advise waiting until the price confirms above 4.25 to verify the bullish breakout, or until it returns to test the support area at 3.80 for buying at the bottom. Entering now may be risky due to the lack of clear momentum.
Estimated support and resistance levels:
- Main support: 3.8000 (24-hour low)
- Secondary support: 4.0000 (psychological level)
- Main resistance: 4.2500 (above the 24-hour high)
- Secondary resistance: 4.5000
We always recommend carefully managing capital and using stop-loss orders to protect investments.
#LINK #BinanceSquare
Technical analysis for Chainlink (LINK) coin | Binance Square report
The current price of the Link coin is led at the level of 4.1200, as the coin is experiencing relative stability with slight gains of 1.20% over the past 24 hours. The price is moving within a daily range that extends from a low of 3.8000 to a high peak of 4.2270, reflecting a state of limited volatility at the moment.
Technically, the Relative Strength Index (RSI) on a 1-hour timeframe shows a value of 55.8. This reading indicates that the market is in a neutral zone, slightly leaning toward buying strength, far from overbought areas (above 70) or oversold areas (below 30). This balance in the indicator suggests that upward momentum is still present, but not exaggerated, providing an opportunity for continued positive movement if the current resistance is broken.
The overall short-term trend shows a cautious bullish bias, as the price attempts to hold above the moving averages. For a strong upward reversal, LINK needs a clear breakout above the psychological resistance level at 4.25, which will pave the way for targeting higher peaks.
Current technical recommendation: WAIT (wait).
Traders advise waiting until the price confirms above 4.25 to verify the bullish breakout, or until it returns to test the support area at 3.80 for buying at the bottom. Entering now may be risky due to the lack of clear momentum.
Estimated support and resistance levels:
- Main support: 3.8000 (24-hour low)
- Secondary support: 4.0000 (psychological level)
- Main resistance: 4.2500 (above the 24-hour high)
- Secondary resistance: 4.5000
We always recommend carefully managing capital and using stop-loss orders to protect investments.
#LINK #BinanceSquare
The current price of the Link coin is led at the level of 4.1200, as the coin is experiencing relative stability with slight gains of 1.20% over the past 24 hours. The price is moving within a daily range that extends from a low of 3.8000 to a high peak of 4.2270, reflecting a state of limited volatility at the moment.
Technically, the Relative Strength Index (RSI) on a 1-hour timeframe shows a value of 55.8. This reading indicates that the market is in a neutral zone, slightly leaning toward buying strength, far from overbought areas (above 70) or oversold areas (below 30). This balance in the indicator suggests that upward momentum is still present, but not exaggerated, providing an opportunity for continued positive movement if the current resistance is broken.
The overall short-term trend shows a cautious bullish bias, as the price attempts to hold above the moving averages. For a strong upward reversal, LINK needs a clear breakout above the psychological resistance level at 4.25, which will pave the way for targeting higher peaks.
Current technical recommendation: WAIT (wait).
Traders advise waiting until the price confirms above 4.25 to verify the bullish breakout, or until it returns to test the support area at 3.80 for buying at the bottom. Entering now may be risky due to the lack of clear momentum.
Estimated support and resistance levels:
- Main support: 3.8000 (24-hour low)
- Secondary support: 4.0000 (psychological level)
- Main resistance: 4.2500 (above the 24-hour high)
- Secondary resistance: 4.5000
We always recommend carefully managing capital and using stop-loss orders to protect investments.
#LINK #BinanceSquare
42
·
--
🏛️ The Eternal Cycle: Why Crypto’s Market Structure Fights Itself The "Sisyphean struggle" isn't just a metaphor for crypto; it is the defining characteristic of our asset class. We push the boulder up the hill—narratives shift, adoption grows, and prices soar—only to watch gravity (regulation, macro liquidity, or fear) pull it back down. 📉 What happened? We are currently witnessing the mid-cycle consolidation phase. After the euphoria of new listings and institutional entry, the market is hitting a wall of resistance. Liquidity is thinning, and volatility is spiking as whales accumulate while retail capitulates. It feels like the grind never ends, but history tells us that every time the boulder rolls back, the base is built wider. Why it matters? This struggle is not a bug; it’s a feature of a young financial system. Unlike traditional finance, which has decades of established infrastructure, crypto is constantly evolving its own rules. The friction we feel now—the regulatory ambiguity, the exchange hacks, the volatility—is the price of admission for a system that operates 24/7 without central intermediaries. Each cycle of pain reduces the systemic risk for the next. Market Impact Expect choppy price action in the near term. The dollar index strength and tightening global liquidity are headwinds. However, on-chain data shows that long-term holders are not selling. They are accumulating. This divergence between short-term panic and long-term conviction is the classic setup for a breakout. Your Take Stop fighting the cycle. If you are trying to time the bottom every week, you will burn out. The "Sisyphean" nature of crypto requires patience, not perfection.
$BTC $ETH
#CryptoMarket #Gem
🏛️ The Eternal Cycle: Why Crypto’s Market Structure Fights Itself The "Sisyphean struggle" isn't just a metaphor for crypto; it is the defining characteristic of our asset class. We push the boulder up the hill—narratives shift, adoption grows, and prices soar—only to watch gravity (regulation, macro liquidity, or fear) pull it back down. 📉 What happened? We are currently witnessing the mid-cycle consolidation phase. After the euphoria of new listings and institutional entry, the market is hitting a wall of resistance. Liquidity is thinning, and volatility is spiking as whales accumulate while retail capitulates. It feels like the grind never ends, but history tells us that every time the boulder rolls back, the base is built wider. Why it matters? This struggle is not a bug; it’s a feature of a young financial system. Unlike traditional finance, which has decades of established infrastructure, crypto is constantly evolving its own rules. The friction we feel now—the regulatory ambiguity, the exchange hacks, the volatility—is the price of admission for a system that operates 24/7 without central intermediaries. Each cycle of pain reduces the systemic risk for the next. Market Impact Expect choppy price action in the near term. The dollar index strength and tightening global liquidity are headwinds. However, on-chain data shows that long-term holders are not selling. They are accumulating. This divergence between short-term panic and long-term conviction is the classic setup for a breakout. Your Take Stop fighting the cycle. If you are trying to time the bottom every week, you will burn out. The "Sisyphean" nature of crypto requires patience, not perfection.
$BTC $ETH
#CryptoMarket #Gem
$BTC $ETH
#CryptoMarket #Gem
63
·
--
Analysis of LAYER (LayerZero) Coin
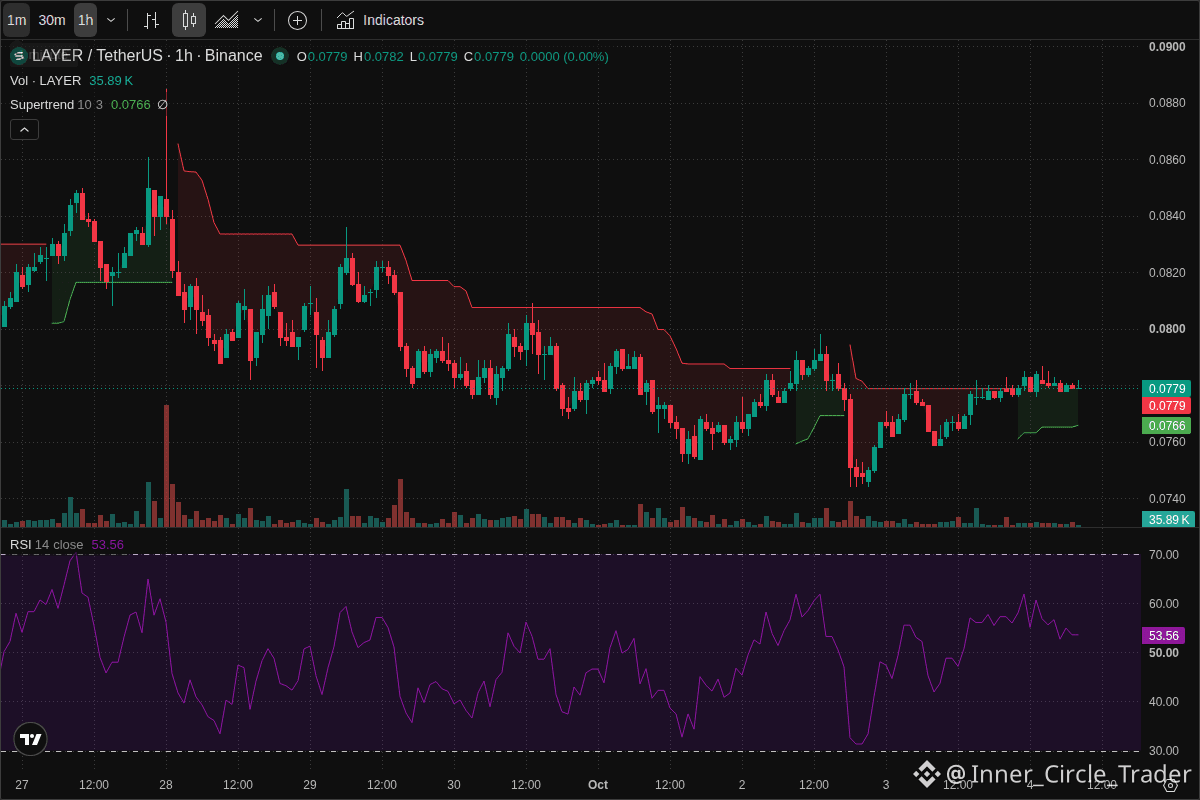
The current price of the LAYER coin at /bin/sh.0000 is shown as 0.0000, reflecting a lack of liquid trading data or a temporary market halt, with the daily change remaining fixed at 0.00%. This zero price reading as well as the high and low over the past 24 hours indicates no real movement, making any accurate short-term momentum prediction difficult at this moment.
In terms of technical analysis, the Relative Strength Index (RSI) on the hourly timeframe records a value of 100.0. Under normal conditions, an RSI above 70 suggests extreme bullish (overbought) territory, but a maximum value of 100 paired with a zero price raises questions about data integrity or a market display issue. If we take this reading seriously as a signal of outdated historical data or a technical glitch, it means buying momentum has been completely exhausted, hinting at a high risk of a sharp bearish correction if liquidity returns.
The overall direction is currently unclear due to the absence of price movement. There is no clear signal of breaking key levels or building a bottom base; instead, the market appears to be in complete "stagnation." In such conditions, entering trades is an ill-considered gamble, since you may face order execution problems or extremely wide price spreads.
The clear recommendation right now is: WAIT (wait).
Buying (BUY) is not recommended in the absence of clear liquidity and due to the purported extreme overbought condition. Likewise, selling (SELL) is not justified if you do not already hold the asset, because there is no real executable price.
The better approach is to monitor the return of liquidity and the stability of price data before making any decision.
As for the estimated levels, since the current price is 0.0000, support and resistance levels become purely theoretical until normal pricing resumes. You should watch the previous historical support levels near the last lows (for example, around /bin/sh.50 – /bin/sh.70, based on the most recent reliable closes) as the first resistance when the price returns to visibility. Meanwhile, extremely low levels may act as psychological support.
We advise traders to verify the data source to ensure there is no technical error in price display, and to focus on other projects with high liquidity and live dashboards. Risk management comes first, especially when dealing with projects that show illogical data.
#تحليل_فني #digital_coins
Analysis of LAYER (LayerZero) Coin
The current price of the LAYER coin at /bin/sh.0000 is shown as 0.0000, reflecting a lack of liquid trading data or a temporary market halt, with the daily change remaining fixed at 0.00%. This zero price reading as well as the high and low over the past 24 hours indicates no real movement, making any accurate short-term momentum prediction difficult at this moment.
In terms of technical analysis, the Relative Strength Index (RSI) on the hourly timeframe records a value of 100.0. Under normal conditions, an RSI above 70 suggests extreme bullish (overbought) territory, but a maximum value of 100 paired with a zero price raises questions about data integrity or a market display issue. If we take this reading seriously as a signal of outdated historical data or a technical glitch, it means buying momentum has been completely exhausted, hinting at a high risk of a sharp bearish correction if liquidity returns.
The overall direction is currently unclear due to the absence of price movement. There is no clear signal of breaking key levels or building a bottom base; instead, the market appears to be in complete "stagnation." In such conditions, entering trades is an ill-considered gamble, since you may face order execution problems or extremely wide price spreads.
The clear recommendation right now is: WAIT (wait).
Buying (BUY) is not recommended in the absence of clear liquidity and due to the purported extreme overbought condition. Likewise, selling (SELL) is not justified if you do not already hold the asset, because there is no real executable price.
The better approach is to monitor the return of liquidity and the stability of price data before making any decision.
As for the estimated levels, since the current price is 0.0000, support and resistance levels become purely theoretical until normal pricing resumes. You should watch the previous historical support levels near the last lows (for example, around /bin/sh.50 – /bin/sh.70, based on the most recent reliable closes) as the first resistance when the price returns to visibility. Meanwhile, extremely low levels may act as psychological support.
We advise traders to verify the data source to ensure there is no technical error in price display, and to focus on other projects with high liquidity and live dashboards. Risk management comes first, especially when dealing with projects that show illogical data.
#تحليل_فني #digital_coins
The current price of the LAYER coin at /bin/sh.0000 is shown as 0.0000, reflecting a lack of liquid trading data or a temporary market halt, with the daily change remaining fixed at 0.00%. This zero price reading as well as the high and low over the past 24 hours indicates no real movement, making any accurate short-term momentum prediction difficult at this moment.
In terms of technical analysis, the Relative Strength Index (RSI) on the hourly timeframe records a value of 100.0. Under normal conditions, an RSI above 70 suggests extreme bullish (overbought) territory, but a maximum value of 100 paired with a zero price raises questions about data integrity or a market display issue. If we take this reading seriously as a signal of outdated historical data or a technical glitch, it means buying momentum has been completely exhausted, hinting at a high risk of a sharp bearish correction if liquidity returns.
The overall direction is currently unclear due to the absence of price movement. There is no clear signal of breaking key levels or building a bottom base; instead, the market appears to be in complete "stagnation." In such conditions, entering trades is an ill-considered gamble, since you may face order execution problems or extremely wide price spreads.
The clear recommendation right now is: WAIT (wait).
Buying (BUY) is not recommended in the absence of clear liquidity and due to the purported extreme overbought condition. Likewise, selling (SELL) is not justified if you do not already hold the asset, because there is no real executable price.
The better approach is to monitor the return of liquidity and the stability of price data before making any decision.
As for the estimated levels, since the current price is 0.0000, support and resistance levels become purely theoretical until normal pricing resumes. You should watch the previous historical support levels near the last lows (for example, around /bin/sh.50 – /bin/sh.70, based on the most recent reliable closes) as the first resistance when the price returns to visibility. Meanwhile, extremely low levels may act as psychological support.
We advise traders to verify the data source to ensure there is no technical error in price display, and to focus on other projects with high liquidity and live dashboards. Risk management comes first, especially when dealing with projects that show illogical data.
#تحليل_فني #digital_coins
87
·
--
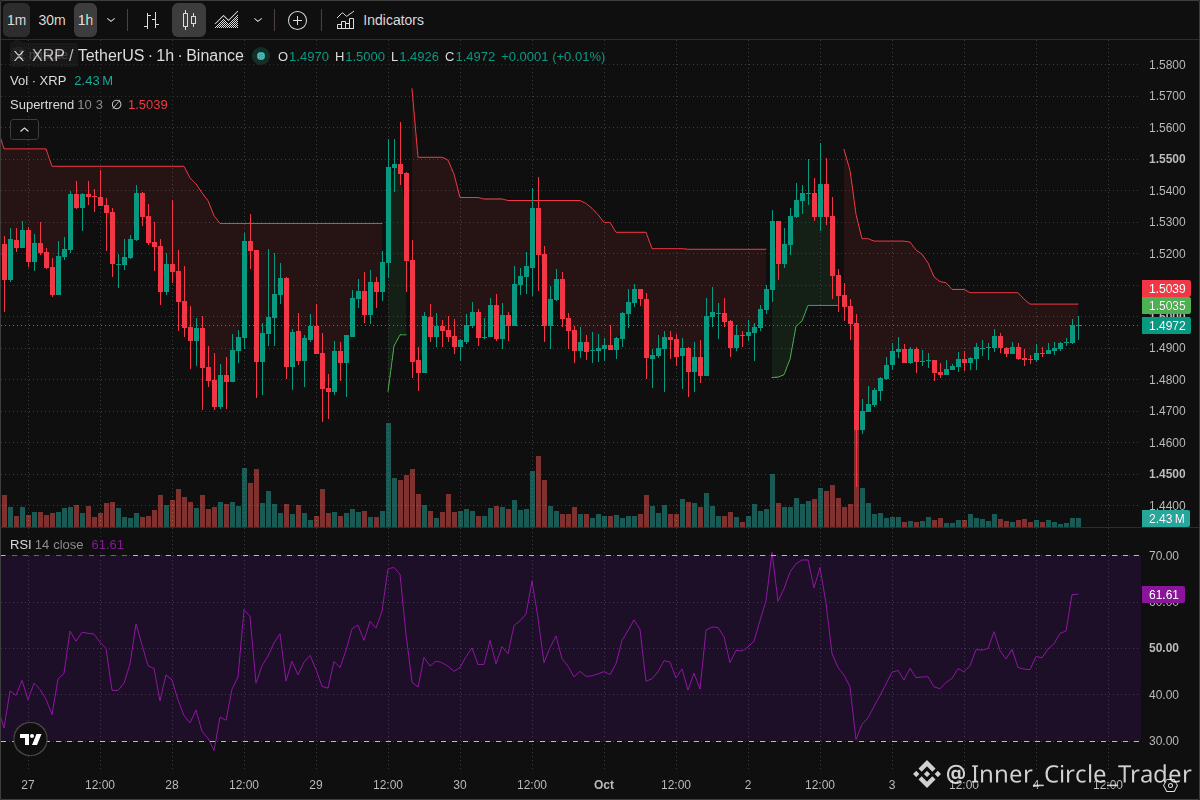
📊 Trading Signal - /USDT (1h)
🕐 Sun, 04 Oct 2026 UTC
📈 Technical Analysis:
• Timeframe: 1h
• Chart attached below (Supertrend + RSI)
• Watch support and resistance levels
⚠️ Risk Management:
• Risk no more than 1-2% of your capital
• Always set a stop-loss
• This is not financial advice—do your own research (DYOR)
#Crypto #Trading
📊 Trading Signal - /USDT (1h)
🕐 Sun, 04 Oct 2026 UTC
📈 Technical Analysis:
• Timeframe: 1h
• Chart attached below (Supertrend + RSI)
• Watch support and resistance levels
⚠️ Risk Management:
• Risk no more than 1-2% of your capital
• Always set a stop-loss
• This is not financial advice—do your own research (DYOR)
#Crypto #Trading
🕐 Sun, 04 Oct 2026 UTC
📈 Technical Analysis:
• Timeframe: 1h
• Chart attached below (Supertrend + RSI)
• Watch support and resistance levels
⚠️ Risk Management:
• Risk no more than 1-2% of your capital
• Always set a stop-loss
• This is not financial advice—do your own research (DYOR)
#Crypto #Trading
57
·
--
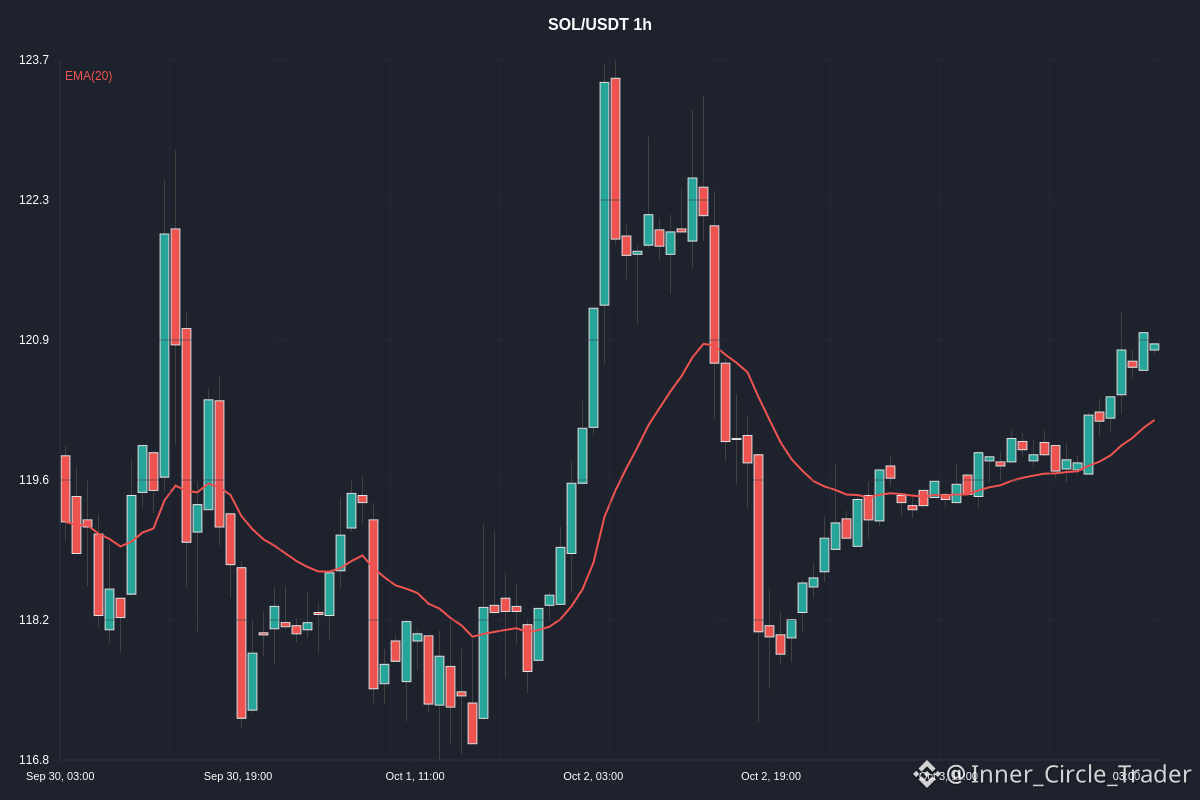
📊 Trading Signal - /USDT (1h)
🕐 Sun, 04 Oct 2026 UTC
📡 Source: binanceus
📈 Technical Analysis:
• Timeframe: 1h
• Chart attached below
• Monitor support and resistance levels
⚠️ Risk Management:
• Don’t risk more than 1–2% of your capital
• Always set a stop-loss
• This is not financial advice—do your own research (DYOR)
#Crypto #Trading
📊 Trading Signal - /USDT (1h)
🕐 Sun, 04 Oct 2026 UTC
📡 Source: binanceus
📈 Technical Analysis:
• Timeframe: 1h
• Chart attached below
• Monitor support and resistance levels
⚠️ Risk Management:
• Don’t risk more than 1–2% of your capital
• Always set a stop-loss
• This is not financial advice—do your own research (DYOR)
#Crypto #Trading
🕐 Sun, 04 Oct 2026 UTC
📡 Source: binanceus
📈 Technical Analysis:
• Timeframe: 1h
• Chart attached below
• Monitor support and resistance levels
⚠️ Risk Management:
• Don’t risk more than 1–2% of your capital
• Always set a stop-loss
• This is not financial advice—do your own research (DYOR)
#Crypto #Trading
133
·
--
💡 **Starknet (): The Zero-Knowledge Titan Reshaping L2s** **What is it?** Starknet is a Layer 2 scaling solution for Ethereum that leverages StarkWare’s STARK (Scalable Transparent Argument of Knowledge) technology. Unlike other rollups, it doesn’t just batch transactions; it proves their validity using cryptographic math, ensuring security without complex trusted setups. **The Problem** Ethereum’s mainnet faces a classic trilemma: security, scalability, and decentralization. High gas fees and slow block times have pushed developers to seek alternatives. However, many existing L2s rely on optimistic rollups, which require long challenge periods, or ZK-rollups that struggle with complex smart contract compatibility and high verification costs. The market needs a solution that scales throughput by orders of magnitude while maintaining full Ethereum-grade security and developer flexibility. **How It Works** Starknet uses Validity Proofs (STARKs) to verify batches of transactions. Instead of executing every transaction on the main chain, it generates a succinct proof that all transactions in the batch were valid. This proof is then posted to Ethereum L1. Crucially, Starknet is **permissionless** and **asynchronous**. Developers can deploy smart contracts without waiting for sequencer approval, and users can interact with the network even if the sequencer goes down (decentralization). **Key Features** 1. **Cairo 1 Programming Language:** A new, Turing-complete language designed specifically for zero-knowledge proofs, allowing developers to write efficient, provable code. 2.
$BCH $STX
#Starknet #CryptoNews
💡 **Starknet (): The Zero-Knowledge Titan Reshaping L2s** **What is it?** Starknet is a Layer 2 scaling solution for Ethereum that leverages StarkWare’s STARK (Scalable Transparent Argument of Knowledge) technology. Unlike other rollups, it doesn’t just batch transactions; it proves their validity using cryptographic math, ensuring security without complex trusted setups. **The Problem** Ethereum’s mainnet faces a classic trilemma: security, scalability, and decentralization. High gas fees and slow block times have pushed developers to seek alternatives. However, many existing L2s rely on optimistic rollups, which require long challenge periods, or ZK-rollups that struggle with complex smart contract compatibility and high verification costs. The market needs a solution that scales throughput by orders of magnitude while maintaining full Ethereum-grade security and developer flexibility. **How It Works** Starknet uses Validity Proofs (STARKs) to verify batches of transactions. Instead of executing every transaction on the main chain, it generates a succinct proof that all transactions in the batch were valid. This proof is then posted to Ethereum L1. Crucially, Starknet is **permissionless** and **asynchronous**. Developers can deploy smart contracts without waiting for sequencer approval, and users can interact with the network even if the sequencer goes down (decentralization). **Key Features** 1. **Cairo 1 Programming Language:** A new, Turing-complete language designed specifically for zero-knowledge proofs, allowing developers to write efficient, provable code. 2.
$BCH $STX
#Starknet #CryptoNews
$BCH $STX
#Starknet #CryptoNews
213
·
--
📚 **Genesis Block: The Digital "Big Bang"** Have you ever wondered where it all began? Before the first trade, before the hype, there was a single block of data. The Genesis Block is the foundation of every blockchain, a digital anchor that proves the network’s existence. **What is it?** It is the very first block in a blockchain. Unlike subsequent blocks, it is not mined or validated in the traditional sense. Its hash is hard-coded into the network's software. For Bitcoin, it was created by Satoshi Nakamoto on January 3, 2009, containing the headline: "Chancellor on brink of second bailout for banks." **How it works** The Genesis Block establishes the initial rules of the ledger. It defines the starting supply, the consensus mechanism, and the cryptographic parameters. In Bitcoin, the initial supply was 50 BTC, though these coins are unspendable. It serves as the root of the Merkle tree, ensuring that all future transactions are cryptographically linked back to this origin point. Without it, there is no chain, only isolated data points. **Why it matters** 1. **Immutability:** It provides a fixed reference point. If the Genesis Block were altered, the entire chain would break. 2. **Trustless Verification:** Nodes can verify the history of the network without trusting a central authority. 3. **Historical Record:** It preserves the intent and origin of the protocol. **Common Mistakes** Many beginners think the Genesis Block is "empty" or just a placeholder. In reality, it is a complex data structure containing the timestamp, nonce, and previous hash (which is zero).
$BTC $ETH
#Blockchain #CryptoEducation
📚 **Genesis Block: The Digital "Big Bang"** Have you ever wondered where it all began? Before the first trade, before the hype, there was a single block of data. The Genesis Block is the foundation of every blockchain, a digital anchor that proves the network’s existence. **What is it?** It is the very first block in a blockchain. Unlike subsequent blocks, it is not mined or validated in the traditional sense. Its hash is hard-coded into the network's software. For Bitcoin, it was created by Satoshi Nakamoto on January 3, 2009, containing the headline: "Chancellor on brink of second bailout for banks." **How it works** The Genesis Block establishes the initial rules of the ledger. It defines the starting supply, the consensus mechanism, and the cryptographic parameters. In Bitcoin, the initial supply was 50 BTC, though these coins are unspendable. It serves as the root of the Merkle tree, ensuring that all future transactions are cryptographically linked back to this origin point. Without it, there is no chain, only isolated data points. **Why it matters** 1. **Immutability:** It provides a fixed reference point. If the Genesis Block were altered, the entire chain would break. 2. **Trustless Verification:** Nodes can verify the history of the network without trusting a central authority. 3. **Historical Record:** It preserves the intent and origin of the protocol. **Common Mistakes** Many beginners think the Genesis Block is "empty" or just a placeholder. In reality, it is a complex data structure containing the timestamp, nonce, and previous hash (which is zero).
$BTC $ETH
#Blockchain #CryptoEducation
$BTC $ETH
#Blockchain #CryptoEducation
18
·
--
🎁 Stop letting your idle assets gather dust! Your money should be working as hard as you do. 🚀 Imagine earning a solid 10% APY on your stablecoin holdings. That’s not a typo. That’s real, consistent yield you can bank while you sleep. 💤💸 Here’s how it’s simple: 1️⃣ Head to Binance Earn. 2️⃣ Select or $BNB. 3️⃣ Lock in your funds. 4️⃣ Watch your balance grow with daily interest accruals. Why settle for 0% when the market offers a guaranteed boost? By diversifying into these high-yield products, you’re not just holding; you’re actively compounding your portfolio. It’s the perfect hedge against volatility while keeping your capital safe and liquid. 🔥 Why do this now? Inflation is eating away at your purchasing power every single day. Every hour you wait, you’re losing potential gains. The 10% APY window is your chance to maximize efficiency without exposing yourself to high-risk speculation. Secure your financial future today, not tomorrow. Are you still leaving free money on the table? 👇 #BinanceEarn #CryptoYield
$ZIL
#BullRun #Breaking
🎁 Stop letting your idle assets gather dust! Your money should be working as hard as you do. 🚀 Imagine earning a solid 10% APY on your stablecoin holdings. That’s not a typo. That’s real, consistent yield you can bank while you sleep. 💤💸 Here’s how it’s simple: 1️⃣ Head to Binance Earn. 2️⃣ Select or $BNB . 3️⃣ Lock in your funds. 4️⃣ Watch your balance grow with daily interest accruals. Why settle for 0% when the market offers a guaranteed boost? By diversifying into these high-yield products, you’re not just holding; you’re actively compounding your portfolio. It’s the perfect hedge against volatility while keeping your capital safe and liquid. 🔥 Why do this now? Inflation is eating away at your purchasing power every single day. Every hour you wait, you’re losing potential gains. The 10% APY window is your chance to maximize efficiency without exposing yourself to high-risk speculation. Secure your financial future today, not tomorrow. Are you still leaving free money on the table? 👇 #BinanceEarn #CryptoYield
$ZIL
#BullRun #Breaking
$ZIL
#BullRun #Breaking
32
·
--
🚨 **Blast (BLAST) Hits Pause: $20M L2 Network Shuts Down, Oct 26 Deadline Set** The crypto world is buzzing with urgent news as Blast, a prominent Layer-2 network with approximately $20M in Total Value Locked (TVL), has announced a temporary shutdown. If you are holding assets on this chain, this is not a drill. The network is pausing withdrawals, and users face a hard exit deadline of **October 26**. **What Exactly Happened?** Blast has initiated a halt on its operations, forcing a temporary pause on all withdrawal functions. This isn’t a permanent rug pull, but rather a structured shutdown or migration process. The critical detail here is the timeline: while withdrawals are currently paused, there is a strict window where users must exit through Blast’s normal interface by October 26. After this date, the standard exit path may close, potentially complicating recovery for those who procrastinate. **Why Does This Matter?** This event highlights the inherent volatility and operational risks of Layer-2 solutions, particularly those in the yield-aggregation or "airdrop farming" space. A $20M TVL is significant enough to impact individual traders significantly, yet small enough to be absorbed by the broader Ethereum ecosystem without causing systemic failure. The forced deadline creates a sense of urgency that often leads to panic selling or, conversely, rushed transactions that could result in errors. It serves as a stark reminder that "high yield" often comes with high operational risk. **Market Impact & Sentiment** The immediate market reaction to has been mixed but leans toward caution. Short-term traders are likely exiting to avoid liquidity crunches, which could suppress the token's price in the coming days.
$SUI $ETH
#NFT #Layer
🚨 **Blast (BLAST) Hits Pause: $20M L2 Network Shuts Down, Oct 26 Deadline Set** The crypto world is buzzing with urgent news as Blast, a prominent Layer-2 network with approximately $20M in Total Value Locked (TVL), has announced a temporary shutdown. If you are holding assets on this chain, this is not a drill. The network is pausing withdrawals, and users face a hard exit deadline of **October 26**. **What Exactly Happened?** Blast has initiated a halt on its operations, forcing a temporary pause on all withdrawal functions. This isn’t a permanent rug pull, but rather a structured shutdown or migration process. The critical detail here is the timeline: while withdrawals are currently paused, there is a strict window where users must exit through Blast’s normal interface by October 26. After this date, the standard exit path may close, potentially complicating recovery for those who procrastinate. **Why Does This Matter?** This event highlights the inherent volatility and operational risks of Layer-2 solutions, particularly those in the yield-aggregation or "airdrop farming" space. A $20M TVL is significant enough to impact individual traders significantly, yet small enough to be absorbed by the broader Ethereum ecosystem without causing systemic failure. The forced deadline creates a sense of urgency that often leads to panic selling or, conversely, rushed transactions that could result in errors. It serves as a stark reminder that "high yield" often comes with high operational risk. **Market Impact & Sentiment** The immediate market reaction to has been mixed but leans toward caution. Short-term traders are likely exiting to avoid liquidity crunches, which could suppress the token's price in the coming days.
$SUI $ETH
#NFT #Layer
$SUI $ETH
#NFT #Layer
108
·
--
📚 📚 Ever felt confused by why you buy at one price and sell at another? That gap is the Bid-Ask Spread. It’s the silent cost of every trade, yet most new traders ignore it until it eats their profits. Think of the spread as the dealer’s fee. The 'Bid' is the highest price a buyer will pay. The 'Ask' is the lowest price a seller will accept. The difference between them is the spread. In highly liquid markets like Bitcoin, this gap is tiny—often just a few cents. But in low-liquidity altcoins, it can be huge. How does it work? Imagine you want to buy $BTC. You see the Bid at $60,000 and the Ask at $60,002. That $2 difference is the spread. If you buy now, you’re instantly down $2 per coin. To break even, the price must rise by that amount before you sell. This is why high-volatility pairs often have wider spreads. Why should you care? A tight spread means high liquidity and easier entry/exit. A wide spread signals low liquidity and higher risk. If you trade small-cap coins, always check the spread first. Common Mistakes: 1. Ignoring the spread on entry. 2. Assuming the mid-price is your actual entry price. 3. Trading illiquid pairs during low-volume hours. Pro Tip: Use limit orders instead of market orders to avoid paying the full spread. Place your order at the Bid or Ask price to get a better fill. Which coin has the widest spread you’ve traded? $BTC $ETH #CryptoEducation #TradingTips
📚 📚 Ever felt confused by why you buy at one price and sell at another? That gap is the Bid-Ask Spread. It’s the silent cost of every trade, yet most new traders ignore it until it eats their profits. Think of the spread as the dealer’s fee. The 'Bid' is the highest price a buyer will pay. The 'Ask' is the lowest price a seller will accept. The difference between them is the spread. In highly liquid markets like Bitcoin, this gap is tiny—often just a few cents. But in low-liquidity altcoins, it can be huge. How does it work? Imagine you want to buy $BTC . You see the Bid at $60,000 and the Ask at $60,002. That $2 difference is the spread. If you buy now, you’re instantly down $2 per coin. To break even, the price must rise by that amount before you sell. This is why high-volatility pairs often have wider spreads. Why should you care? A tight spread means high liquidity and easier entry/exit. A wide spread signals low liquidity and higher risk. If you trade small-cap coins, always check the spread first. Common Mistakes: 1. Ignoring the spread on entry. 2. Assuming the mid-price is your actual entry price. 3. Trading illiquid pairs during low-volume hours. Pro Tip: Use limit orders instead of market orders to avoid paying the full spread. Place your order at the Bid or Ask price to get a better fill. Which coin has the widest spread you’ve traded? $BTC $ETH #CryptoEducation #TradingTips
55
·
--
🚨 **Asia’s Crypto Power Shift: Singapore Rises as China Tightens the Noose** The geopolitical landscape for digital assets is shifting rapidly, and Asia is leading the charge. According to the latest report from Asia Express, the region is experiencing a massive divergence in regulatory approaches that will define the next cycle. 🌏 **What Happened?** Three major developments are reshaping the narrative: 1. **Singapore’s Surge:** Singapore’s crypto economy has exploded, growing by **55%**. This growth cements its status as the dominant hub for compliant Web3 innovation in Asia. 🇸🇬 2. **South Korea’s Legalization:** South Korea is set to officially make crypto market makers legal. This move removes a major gray area, providing institutional clarity and boosting liquidity for local exchanges. 🇰🇷 3. **China’s Warning:** In a stark contrast, China’s spy ministry has issued a direct warning to foreign operatives. They are explicitly stating they are monitoring blockchain activities for espionage purposes. 🇨🇳 **Why It Matters** This isn't just about regulation; it's about jurisdictional arbitrage. While China is using blockchain surveillance as a tool for national security and control, Singapore and South Korea are actively building frameworks to attract global capital. The 55% growth in Singapore suggests that major players are voting with their feet, moving operations to jurisdictions that offer legal certainty rather than ambiguity. **Market Impact** For institutional investors, this signals a clear "flight to quality" within the Asian market. * **Singapore** is becoming the safe haven for compliant DeFi and CeFi projects.
$APT $ZEC
#Altcoins #Web
🚨 **Asia’s Crypto Power Shift: Singapore Rises as China Tightens the Noose** The geopolitical landscape for digital assets is shifting rapidly, and Asia is leading the charge. According to the latest report from Asia Express, the region is experiencing a massive divergence in regulatory approaches that will define the next cycle. 🌏 **What Happened?** Three major developments are reshaping the narrative: 1. **Singapore’s Surge:** Singapore’s crypto economy has exploded, growing by **55%**. This growth cements its status as the dominant hub for compliant Web3 innovation in Asia. 🇸🇬 2. **South Korea’s Legalization:** South Korea is set to officially make crypto market makers legal. This move removes a major gray area, providing institutional clarity and boosting liquidity for local exchanges. 🇰🇷 3. **China’s Warning:** In a stark contrast, China’s spy ministry has issued a direct warning to foreign operatives. They are explicitly stating they are monitoring blockchain activities for espionage purposes. 🇨🇳 **Why It Matters** This isn't just about regulation; it's about jurisdictional arbitrage. While China is using blockchain surveillance as a tool for national security and control, Singapore and South Korea are actively building frameworks to attract global capital. The 55% growth in Singapore suggests that major players are voting with their feet, moving operations to jurisdictions that offer legal certainty rather than ambiguity. **Market Impact** For institutional investors, this signals a clear "flight to quality" within the Asian market. * **Singapore** is becoming the safe haven for compliant DeFi and CeFi projects.
$APT $ZEC
#Altcoins #Web
$APT $ZEC
#Altcoins #Web
1
310
·
--
💡 Meet Super Cat (), currently ranked #869. In a market saturated with generic meme coins, addresses a critical gap: sustainable community engagement beyond fleeting hype. The problem is clear—most meme projects lack long-term utility, leading to rapid value decay. How does Super Cat solve this? By integrating a robust staking ecosystem and interactive governance that transforms passive holders into active stakehoders. Key features include: 1. **Staking Rewards**: Users can lock to earn yield, aligning incentives for long-term holding. 2. **Community Governance**: Token holders vote on roadmap decisions, fostering true decentralization. 3. **Unique Tokenomics**: A deflationary model ensures scarcity over time, potentially boosting value as supply decreases. While the project shows promise, risks remain. Its rank of #869 indicates it is still an emerging asset with higher volatility than blue-chip cryptos. Liquidity depth may be limited compared to top-tier projects, and regulatory uncertainties in the meme coin sector could impact adoption. Investors should monitor trading volume and community growth closely. Is your portfolio ready for the next viral cat? 🐱 #Crypto #MemeCoins
$FTM $EGLD
#NFT
💡 Meet Super Cat (), currently ranked #869. In a market saturated with generic meme coins, addresses a critical gap: sustainable community engagement beyond fleeting hype. The problem is clear—most meme projects lack long-term utility, leading to rapid value decay. How does Super Cat solve this? By integrating a robust staking ecosystem and interactive governance that transforms passive holders into active stakehoders. Key features include: 1. **Staking Rewards**: Users can lock to earn yield, aligning incentives for long-term holding. 2. **Community Governance**: Token holders vote on roadmap decisions, fostering true decentralization. 3. **Unique Tokenomics**: A deflationary model ensures scarcity over time, potentially boosting value as supply decreases. While the project shows promise, risks remain. Its rank of #869 indicates it is still an emerging asset with higher volatility than blue-chip cryptos. Liquidity depth may be limited compared to top-tier projects, and regulatory uncertainties in the meme coin sector could impact adoption. Investors should monitor trading volume and community growth closely. Is your portfolio ready for the next viral cat? 🐱 #Crypto #MemeCoins
$FTM $EGLD
#NFT
$FTM $EGLD
#NFT
179
·
--
📊 **Market Pulse: Consolidation Amidst Highs** The crypto market is currently navigating a critical phase of consolidation within a bullish structure. With major assets trading tightly, the focus shifts from aggressive momentum to precise technical positioning. Understanding these micro-movements is key to anticipating the next directional shift. **Current State & Key Levels** **** is holding firm at **$84,621**, showing a minor pullback of -0.30%. This stability suggests that despite minor profit-taking, long-term accumulation remains robust. * **Support Zone:** The immediate floor sits near **$83,500**. A hold here confirms the uptrend integrity. * **Resistance:** The psychological and technical barrier is at **$86,000**. Breaking this level with volume would signal a breakout toward new all-time highs. **** is trading at **$2,679**, experiencing a slightly deeper correction of -1.31%. This relative weakness compared to Bitcoin might indicate short-term capital rotation, but the asset remains fundamentally strong. * **Support:** Critical defense line at **$2,600**. If this breaks, we could see a retest of **$2,500**. * **Resistance:** The upper bound is currently **$2,750**. Reclaiming this level would often precede an ETH/BTC ratio recovery. **Trends & Technical Analysis** The broader trend remains bullish, but the short-term momentum is cooling off. Bitcoin’s dominance is stabilizing, suggesting that while liquidity is present, traders are cautious. The -0.30% move in BTC is negligible in the grand scheme, acting more as a breathing pause than a reversal signal. Conversely, ETH’s -1.31% drop warrants closer attention. Is it a divergence warning, or simply a lagging reaction to Bitcoin’s consolidation?
$BTC $ETH
#Crypto #Metaverse
📊 **Market Pulse: Consolidation Amidst Highs** The crypto market is currently navigating a critical phase of consolidation within a bullish structure. With major assets trading tightly, the focus shifts from aggressive momentum to precise technical positioning. Understanding these micro-movements is key to anticipating the next directional shift. **Current State & Key Levels** **** is holding firm at **$84,621**, showing a minor pullback of -0.30%. This stability suggests that despite minor profit-taking, long-term accumulation remains robust. * **Support Zone:** The immediate floor sits near **$83,500**. A hold here confirms the uptrend integrity. * **Resistance:** The psychological and technical barrier is at **$86,000**. Breaking this level with volume would signal a breakout toward new all-time highs. **** is trading at **$2,679**, experiencing a slightly deeper correction of -1.31%. This relative weakness compared to Bitcoin might indicate short-term capital rotation, but the asset remains fundamentally strong. * **Support:** Critical defense line at **$2,600**. If this breaks, we could see a retest of **$2,500**. * **Resistance:** The upper bound is currently **$2,750**. Reclaiming this level would often precede an ETH/BTC ratio recovery. **Trends & Technical Analysis** The broader trend remains bullish, but the short-term momentum is cooling off. Bitcoin’s dominance is stabilizing, suggesting that while liquidity is present, traders are cautious. The -0.30% move in BTC is negligible in the grand scheme, acting more as a breathing pause than a reversal signal. Conversely, ETH’s -1.31% drop warrants closer attention. Is it a divergence warning, or simply a lagging reaction to Bitcoin’s consolidation?
$BTC $ETH
#Crypto #Metaverse
$BTC $ETH
#Crypto #Metaverse
96
·
--
📊 **Bitcoin Q3 Kickoff: The $82K-$85K "Old Guard" Range** Bitcoin has officially ushered in the third quarter with a familiar, almost eerie, precision. The market has opened the new quarter locked firmly within the **$82,000-$85,000** price corridor. For those who have been watching the charts closely, this isn't a new story; it’s a repetition of a pattern that has defined the last few months of consolidation. We are seeing the King of Crypto pause its upward momentum to re-accumulate and shake out weaker hands before the next leg. **What’s Happening?** The price action has been remarkably static since the start of the quarter. Instead of breaking out to new highs or capitulating into a deep correction, is grinding sideways. This "choppy" zone acts as a massive battle ground between bulls and bears. Every dip toward $82,000 has found immediate support, while every push toward $85,000 has faced significant resistance. It is a textbook example of a range-bound market where volatility has compressed, often a precursor to a violent expansion in either direction. **Why It Matters** This consolidation is critical. After the euphoric rallies, the market needs to digest gains. The $82K-$85K range serves as a liquidity pool. Market makers and institutional whales are likely using this stable period to reposition their portfolios without triggering stop-losses. If Bitcoin can hold this floor, it validates the long-term bullish thesis. If it breaks below $82,000 with volume, we could see a rapid retest of lower support levels. The significance lies in the *time* spent here. The longer Bitcoin stays in this range, the more potential energy builds up for the next move.
$ZIL $BTC
#Bitcoin #Web
📊 **Bitcoin Q3 Kickoff: The $82K-$85K "Old Guard" Range** Bitcoin has officially ushered in the third quarter with a familiar, almost eerie, precision. The market has opened the new quarter locked firmly within the **$82,000-$85,000** price corridor. For those who have been watching the charts closely, this isn't a new story; it’s a repetition of a pattern that has defined the last few months of consolidation. We are seeing the King of Crypto pause its upward momentum to re-accumulate and shake out weaker hands before the next leg. **What’s Happening?** The price action has been remarkably static since the start of the quarter. Instead of breaking out to new highs or capitulating into a deep correction, is grinding sideways. This "choppy" zone acts as a massive battle ground between bulls and bears. Every dip toward $82,000 has found immediate support, while every push toward $85,000 has faced significant resistance. It is a textbook example of a range-bound market where volatility has compressed, often a precursor to a violent expansion in either direction. **Why It Matters** This consolidation is critical. After the euphoric rallies, the market needs to digest gains. The $82K-$85K range serves as a liquidity pool. Market makers and institutional whales are likely using this stable period to reposition their portfolios without triggering stop-losses. If Bitcoin can hold this floor, it validates the long-term bullish thesis. If it breaks below $82,000 with volume, we could see a rapid retest of lower support levels. The significance lies in the *time* spent here. The longer Bitcoin stays in this range, the more potential energy builds up for the next move.
$ZIL $BTC
#Bitcoin #Web
$ZIL $BTC
#Bitcoin #Web
109
Log in to explore more content
Join global crypto users on Binance Square
⚡️ Get latest and useful information about crypto.
💬 Trusted by the world’s largest crypto exchange.
👍 Discover real insights from verified creators.
Email / Phone number
Trending Topics
DriftHackVictimsBeginClaims
8,950 views
159 Discussing
#DriftHackVictimsBeginClaims
Victims of the April 1 Drift exploit, which caused nearly $295.4M in verified losses, can now claim DFX recovery tokens.
the initial recovery pool is only about $3.1M, so the launch payout is roughly $0.0104 per $1 lost - around $10.40 for every $1,000 lost.
Victims can redeem, sell, or hold DFX and wait for future recovery funds, including protocol revenue, partner commitments and recovered assets.
Taking the payout now burns the DFX and ends that claim permanently. #Mahanadi
Digital Mahanadi
·0 Likes
·84 views
SolanaTokenizedStockVolumeTops$4.4BInSeptember
1,609 views
24 Discussing
BitcoinSpotETFsDraw$6.34BInflowsInQ3
9,536 views
135 Discussing