

#ram
ram
639,049 views
1,352 Discussing
Hot
Latest


·
--
Bearish
$RAM Funding Hits -0.556% as Shorts Stack Up — But a Squeeze Bounce Could Come First
My bias is bearish on the 1h. Structure remains lower highs and lower lows, price is trading below both EMAs, and BTC is also bearish. With the daily still bullish, I see this as a counter-trend dump inside a larger uptrend — so I want confirmation, not a chase.
The extreme negative funding shows shorts are heavily positioned. Since funding is already moving with the 1h trend, I treat it as an exhaustion warning rather than a reason to blindly add shorts. OI is down 3% while taker flow is slightly buyer-dominant, which could support a squeeze bounce before sellers step back in.
Key levels:
First reaction zone: 14.09
Major rejection zone: 14.56–14.68
Downside targets: 13.69 / 13.63 → 13.27 → 13.20
Avoid chasing the dump around 13.77
Bearish invalidation: 1h close above 15.11
Shorts make more sense only after a clear rejection — bearish engulfing, wick rejection, or lower-timeframe MSS back down.
Flow: OI $895K (-3.0% 24h) | Funding -0.5557% | Taker 1.07×
Not financial advice. Educational market analysis only.
#Crypto #RAM #Trading #Altcoins #Binance $RAM
{future}(RAMUSDT)
$RAM Funding Hits -0.556% as Shorts Stack Up — But a Squeeze Bounce Could Come First
My bias is bearish on the 1h. Structure remains lower highs and lower lows, price is trading below both EMAs, and BTC is also bearish. With the daily still bullish, I see this as a counter-trend dump inside a larger uptrend — so I want confirmation, not a chase.
The extreme negative funding shows shorts are heavily positioned. Since funding is already moving with the 1h trend, I treat it as an exhaustion warning rather than a reason to blindly add shorts. OI is down 3% while taker flow is slightly buyer-dominant, which could support a squeeze bounce before sellers step back in.
Key levels:
First reaction zone: 14.09
Major rejection zone: 14.56–14.68
Downside targets: 13.69 / 13.63 → 13.27 → 13.20
Avoid chasing the dump around 13.77
Bearish invalidation: 1h close above 15.11
Shorts make more sense only after a clear rejection — bearish engulfing, wick rejection, or lower-timeframe MSS back down.
Flow: OI $895K (-3.0% 24h) | Funding -0.5557% | Taker 1.07×
Not financial advice. Educational market analysis only.
#Crypto #RAM #Trading #Altcoins #Binance $RAM
My bias is bearish on the 1h. Structure remains lower highs and lower lows, price is trading below both EMAs, and BTC is also bearish. With the daily still bullish, I see this as a counter-trend dump inside a larger uptrend — so I want confirmation, not a chase.
The extreme negative funding shows shorts are heavily positioned. Since funding is already moving with the 1h trend, I treat it as an exhaustion warning rather than a reason to blindly add shorts. OI is down 3% while taker flow is slightly buyer-dominant, which could support a squeeze bounce before sellers step back in.
Key levels:
First reaction zone: 14.09
Major rejection zone: 14.56–14.68
Downside targets: 13.69 / 13.63 → 13.27 → 13.20
Avoid chasing the dump around 13.77
Bearish invalidation: 1h close above 15.11
Shorts make more sense only after a clear rejection — bearish engulfing, wick rejection, or lower-timeframe MSS back down.
Flow: OI $895K (-3.0% 24h) | Funding -0.5557% | Taker 1.07×
Not financial advice. Educational market analysis only.
#Crypto #RAM #Trading #Altcoins #Binance $RAM
100

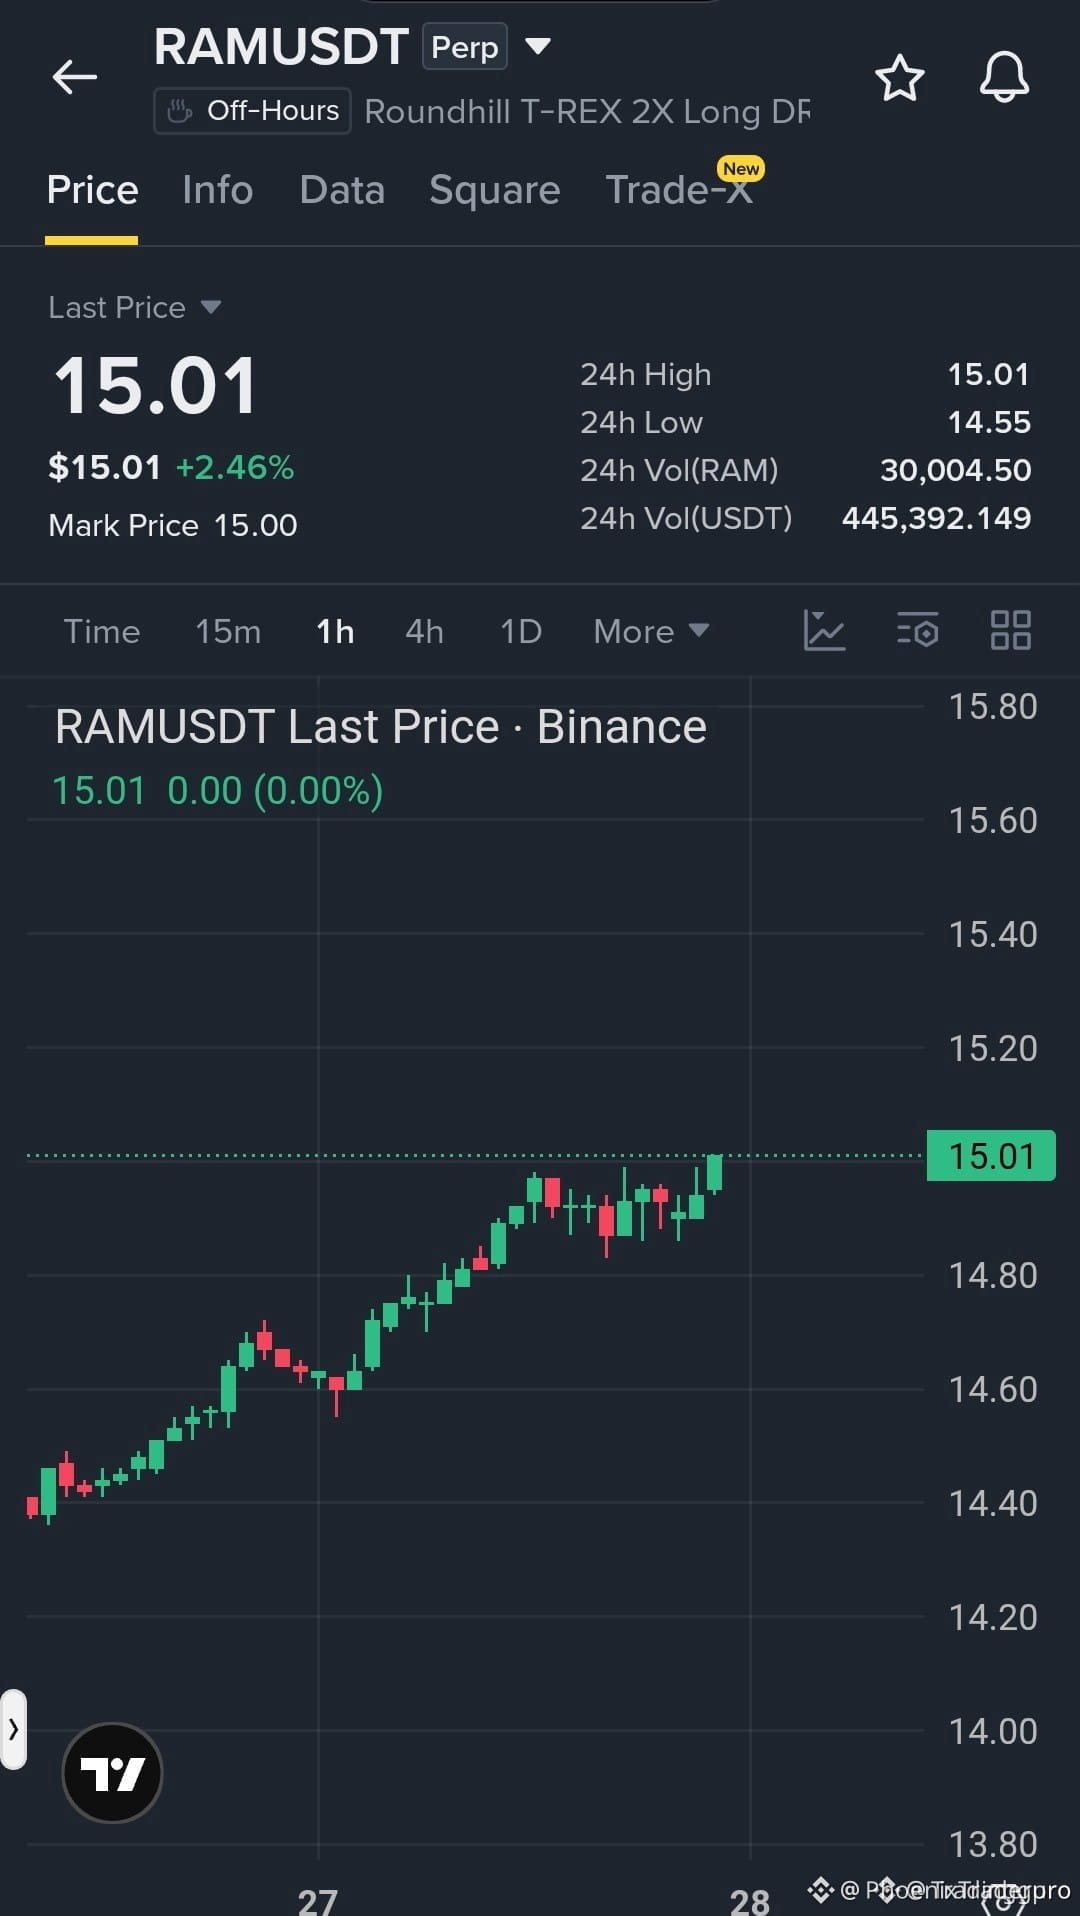
⚡ SILENT ACCUMULATION IN $RAM PREPARES FOR AN EXPLOSIVE BREAKOUT ABOVE $15.05! 🚀
Entry: 14.90 - 15.00 ⚡
Target: 15.10 - 15.35 🚀
Stop Loss: 14.78 ⚠️
📌 While retail sleeps on modest volume, $RAM is quietly grinding out higher lows and defending the $14.80 demand floor with absolute precision. 📊 This disciplined structural climb reveals smart money absorbing sell orders before the real volatility arrives.
💡 A clean flip of the $15.05 resistance trigger will unleash momentum toward our upper targets in rapid succession. 🔍 Are you locking in positions early during steady accumulation or waiting to chase the breakout candle? 👇
⚠️ Not financial advice. Always manage your risk. 🛡️
🏷️ #RAM #LongSetup #Altcoins #Crypto #Breakout
🔥 💎
⚡ SILENT ACCUMULATION IN $RAM PREPARES FOR AN EXPLOSIVE BREAKOUT ABOVE $15.05! 🚀
Entry: 14.90 - 15.00 ⚡
Target: 15.10 - 15.35 🚀
Stop Loss: 14.78 ⚠️
📌 While retail sleeps on modest volume, $RAM is quietly grinding out higher lows and defending the $14.80 demand floor with absolute precision. 📊 This disciplined structural climb reveals smart money absorbing sell orders before the real volatility arrives.
💡 A clean flip of the $15.05 resistance trigger will unleash momentum toward our upper targets in rapid succession. 🔍 Are you locking in positions early during steady accumulation or waiting to chase the breakout candle? 👇
⚠️ Not financial advice. Always manage your risk. 🛡️
🏷️ #RAM #LongSetup #Altcoins #Crypto #Breakout
🔥 💎
Entry: 14.90 - 15.00 ⚡
Target: 15.10 - 15.35 🚀
Stop Loss: 14.78 ⚠️
📌 While retail sleeps on modest volume, $RAM is quietly grinding out higher lows and defending the $14.80 demand floor with absolute precision. 📊 This disciplined structural climb reveals smart money absorbing sell orders before the real volatility arrives.
💡 A clean flip of the $15.05 resistance trigger will unleash momentum toward our upper targets in rapid succession. 🔍 Are you locking in positions early during steady accumulation or waiting to chase the breakout candle? 👇
⚠️ Not financial advice. Always manage your risk. 🛡️
🏷️ #RAM #LongSetup #Altcoins #Crypto #Breakout
🔥 💎
8

·
--
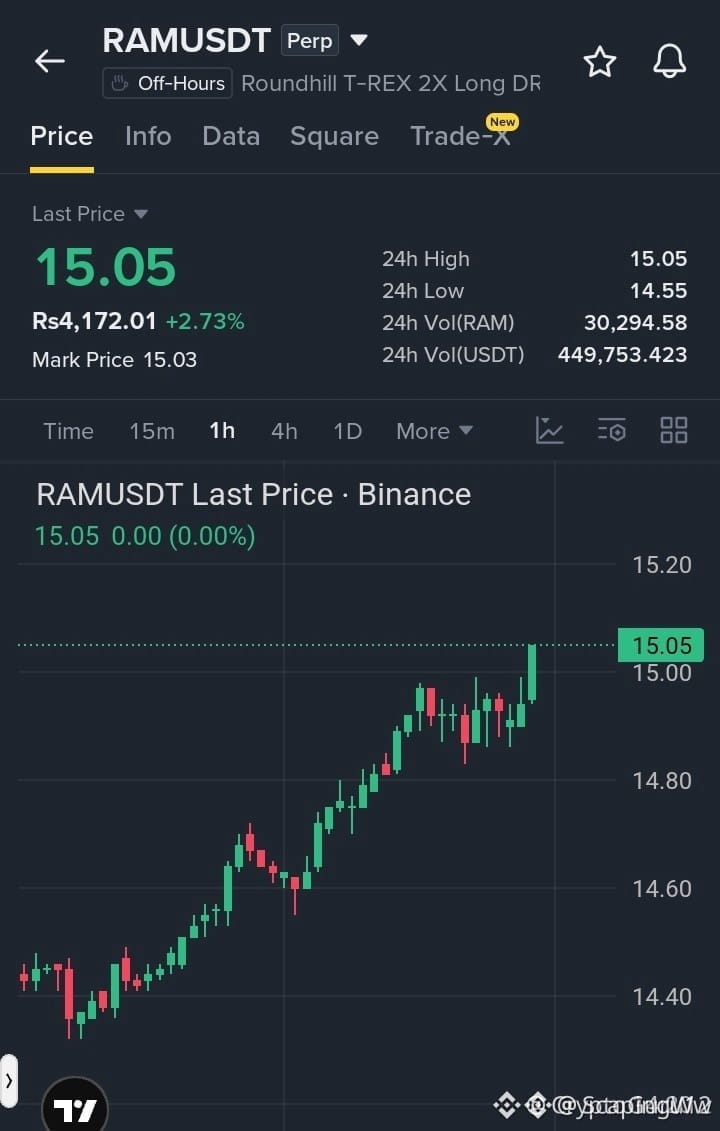
⚡ $RAM BREAKS RANGE RESISTANCE AS BULLS CHARGE TOWARD HIGHER LIQUIDITY! 🚀
Entry: 14.98 – 15.05 ⚡
Target: 15.20 🚀
Stop Loss: 14.82 ⚠️
📌 Buyers have maintained a steady 1H structure of higher highs and higher lows, coiling tightly around the 15.00 handle. The latest expansion candle is slicing straight through range resistance, confirming upside momentum as sellers get pushed back. 📊
💡 Volume expansion on this breakout signals strong demand absorption, setting the stage for a clean run toward the overhead target. 💬 Are you riding this momentum candle or waiting for a retest of the range high? 👇
⚠️ Not financial advice. Always manage your risk. 🛡️
🏷️ #RAM #LongSetup #Breakout #Crypto
🔥 💎
⚡ $RAM BREAKS RANGE RESISTANCE AS BULLS CHARGE TOWARD HIGHER LIQUIDITY! 🚀
Entry: 14.98 – 15.05 ⚡
Target: 15.20 🚀
Stop Loss: 14.82 ⚠️
📌 Buyers have maintained a steady 1H structure of higher highs and higher lows, coiling tightly around the 15.00 handle. The latest expansion candle is slicing straight through range resistance, confirming upside momentum as sellers get pushed back. 📊
💡 Volume expansion on this breakout signals strong demand absorption, setting the stage for a clean run toward the overhead target. 💬 Are you riding this momentum candle or waiting for a retest of the range high? 👇
⚠️ Not financial advice. Always manage your risk. 🛡️
🏷️ #RAM #LongSetup #Breakout #Crypto
🔥 💎
Entry: 14.98 – 15.05 ⚡
Target: 15.20 🚀
Stop Loss: 14.82 ⚠️
📌 Buyers have maintained a steady 1H structure of higher highs and higher lows, coiling tightly around the 15.00 handle. The latest expansion candle is slicing straight through range resistance, confirming upside momentum as sellers get pushed back. 📊
💡 Volume expansion on this breakout signals strong demand absorption, setting the stage for a clean run toward the overhead target. 💬 Are you riding this momentum candle or waiting for a retest of the range high? 👇
⚠️ Not financial advice. Always manage your risk. 🛡️
🏷️ #RAM #LongSetup #Breakout #Crypto
🔥 💎
24
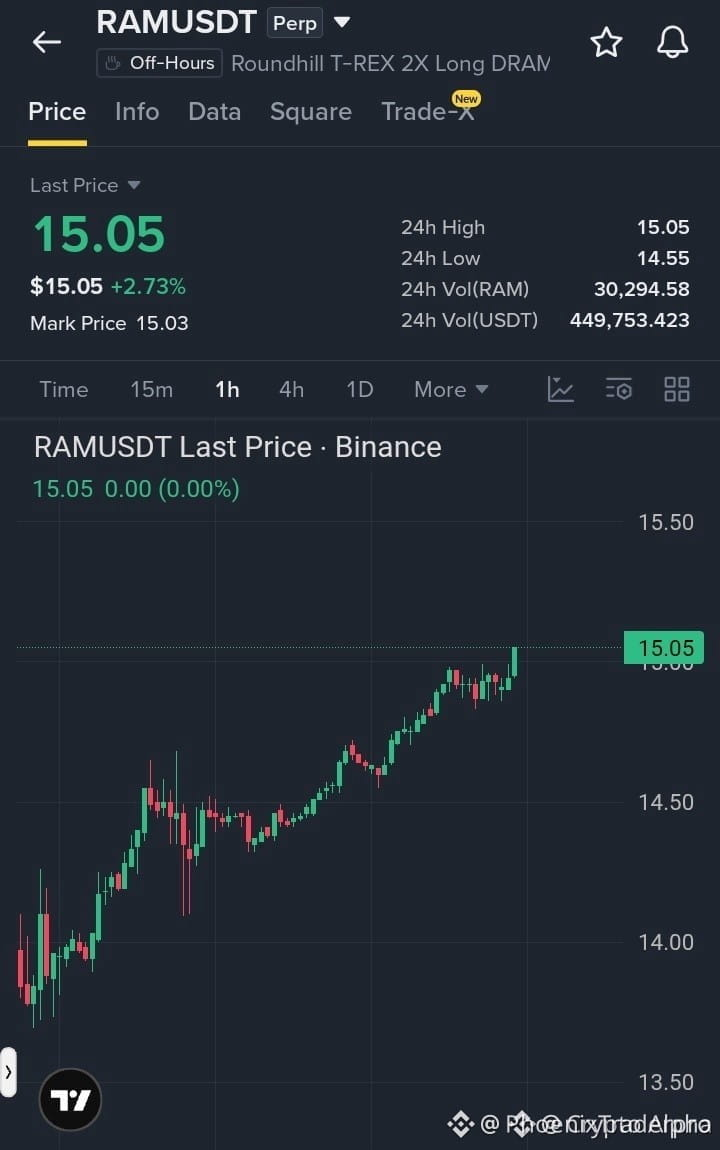
💥 $RAM IS GRINDING TOWARD A BREAKOUT FLIP ABOVE THE $15 RANGE! 📈
Entry: 14.85 – 15.05 ⚡
Target: 15.25 / 15.50 / 15.80 🚀
Stop Loss: 14.60 ⚠️
Buyers have been relentlessly defending the $14.00 floor, stepping up bids and forging a clean series of higher lows right into the $15.05 resistance zone. 📊 Momentum is building steadily as supply gets absorbed at the top of the structure.
If we lock in a solid candle close and reclaim above this current range, the path opens fast for an expansion leg straight toward our upper target levels. 💡 Sellers are visibly running out of ammo to keep capping this price action. 💬 Are you bidding this range retest or waiting for a confirmed breakout flip? 👇
⚠️ Not financial advice. Always manage your risk. 🛡️
🏷️ #RAM #LSK #BTW #Breakout #Trading
🔥 💎
💥 $RAM IS GRINDING TOWARD A BREAKOUT FLIP ABOVE THE $15 RANGE! 📈
Entry: 14.85 – 15.05 ⚡
Target: 15.25 / 15.50 / 15.80 🚀
Stop Loss: 14.60 ⚠️
Buyers have been relentlessly defending the $14.00 floor, stepping up bids and forging a clean series of higher lows right into the $15.05 resistance zone. 📊 Momentum is building steadily as supply gets absorbed at the top of the structure.
If we lock in a solid candle close and reclaim above this current range, the path opens fast for an expansion leg straight toward our upper target levels. 💡 Sellers are visibly running out of ammo to keep capping this price action. 💬 Are you bidding this range retest or waiting for a confirmed breakout flip? 👇
⚠️ Not financial advice. Always manage your risk. 🛡️
🏷️ #RAM #LSK #BTW #Breakout #Trading
🔥 💎
Entry: 14.85 – 15.05 ⚡
Target: 15.25 / 15.50 / 15.80 🚀
Stop Loss: 14.60 ⚠️
Buyers have been relentlessly defending the $14.00 floor, stepping up bids and forging a clean series of higher lows right into the $15.05 resistance zone. 📊 Momentum is building steadily as supply gets absorbed at the top of the structure.
If we lock in a solid candle close and reclaim above this current range, the path opens fast for an expansion leg straight toward our upper target levels. 💡 Sellers are visibly running out of ammo to keep capping this price action. 💬 Are you bidding this range retest or waiting for a confirmed breakout flip? 👇
⚠️ Not financial advice. Always manage your risk. 🛡️
🏷️ #RAM #LSK #BTW #Breakout #Trading
🔥 💎
5

·
--
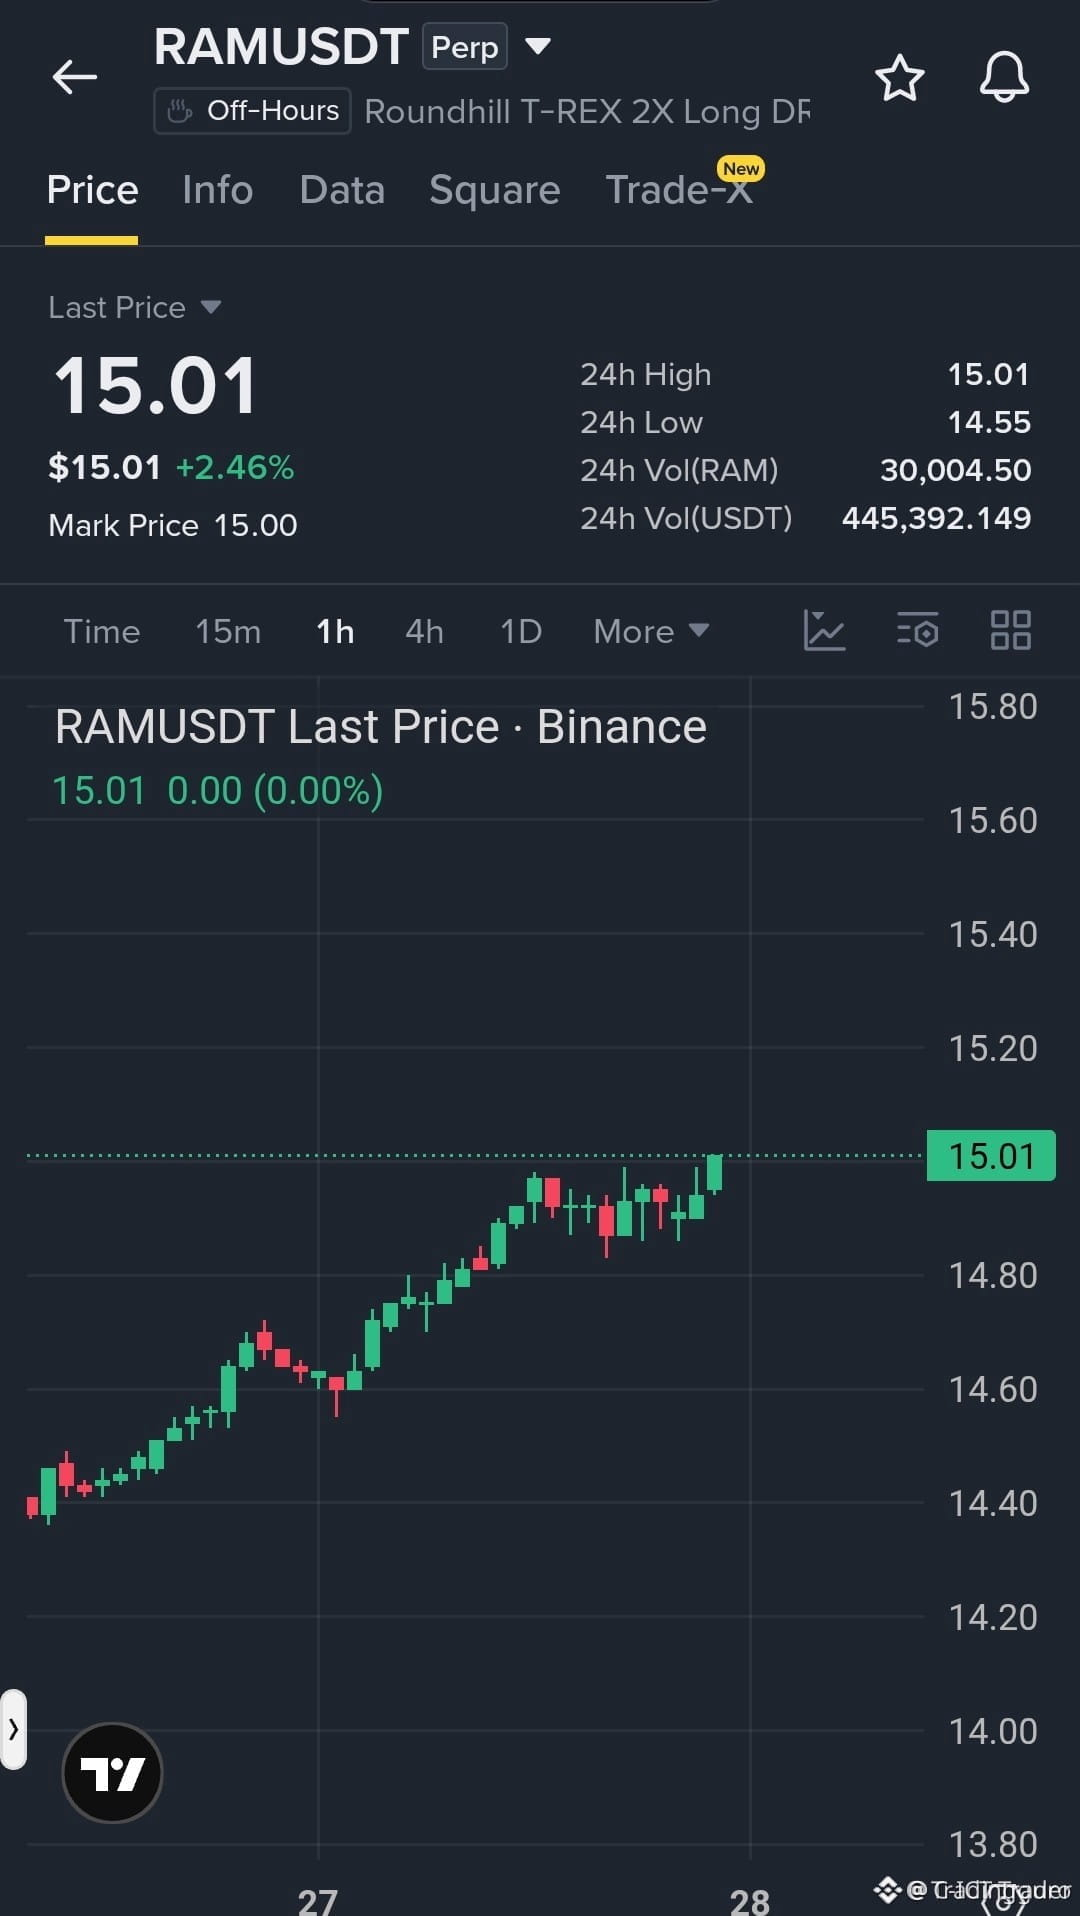
🚨 $RAM ABSORBING SUPPLY WITH STEADY HIGHER LOWS BEFORE THE NEXT EXPANSION! 📈
Entry: 14.90 - 15.00 ⚡
Target: 15.10 - 15.35 🚀
Stop Loss: 14.78 ⚠️
Despite subdued volume, $RAM is exhibiting methodical structural strength, consistently forming higher lows while holding firmly above the $14.80 institutional demand zone. Smart money is quietly defending this structural floor, compressing price right beneath the critical $15.05 resistance pivot. 🔍
A clean breakout above $15.05 triggers immediate order flow expansion toward our upside targets as buy-side liquidity is targeted. 📊 With downside risk strictly defined below $14.78, the structural setup offers clean risk-managed exposure. 💡
💬 Are you positioning inside this tight consolidation or waiting for a confirmed breakout above $15.05? 👇
⚠️ Not financial advice. Always manage your risk. 🛡️
🏷️ #RAM #LongSetup #Crypto #Breakout #Altcoins
🎯 🦈
🚨 $RAM ABSORBING SUPPLY WITH STEADY HIGHER LOWS BEFORE THE NEXT EXPANSION! 📈
Entry: 14.90 - 15.00 ⚡
Target: 15.10 - 15.35 🚀
Stop Loss: 14.78 ⚠️
Despite subdued volume, $RAM is exhibiting methodical structural strength, consistently forming higher lows while holding firmly above the $14.80 institutional demand zone. Smart money is quietly defending this structural floor, compressing price right beneath the critical $15.05 resistance pivot. 🔍
A clean breakout above $15.05 triggers immediate order flow expansion toward our upside targets as buy-side liquidity is targeted. 📊 With downside risk strictly defined below $14.78, the structural setup offers clean risk-managed exposure. 💡
💬 Are you positioning inside this tight consolidation or waiting for a confirmed breakout above $15.05? 👇
⚠️ Not financial advice. Always manage your risk. 🛡️
🏷️ #RAM #LongSetup #Crypto #Breakout #Altcoins
🎯 🦈
Entry: 14.90 - 15.00 ⚡
Target: 15.10 - 15.35 🚀
Stop Loss: 14.78 ⚠️
Despite subdued volume, $RAM is exhibiting methodical structural strength, consistently forming higher lows while holding firmly above the $14.80 institutional demand zone. Smart money is quietly defending this structural floor, compressing price right beneath the critical $15.05 resistance pivot. 🔍
A clean breakout above $15.05 triggers immediate order flow expansion toward our upside targets as buy-side liquidity is targeted. 📊 With downside risk strictly defined below $14.78, the structural setup offers clean risk-managed exposure. 💡
💬 Are you positioning inside this tight consolidation or waiting for a confirmed breakout above $15.05? 👇
⚠️ Not financial advice. Always manage your risk. 🛡️
🏷️ #RAM #LongSetup #Crypto #Breakout #Altcoins
🎯 🦈
2

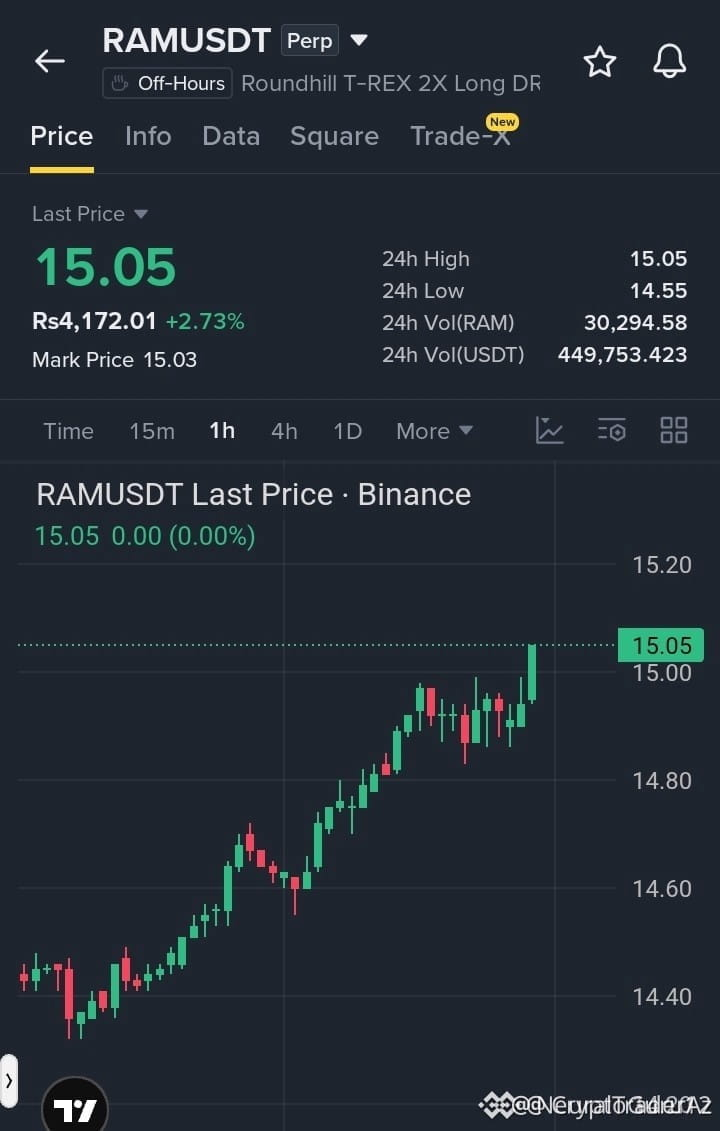
🚨 $RAM BREAKS LOCAL RANGE HIGH AS BULLS AIM FOR EXTENSION! 💥
Entry: 14.98 - 15.05 ⚡
Target: 15.20 🚀
Stop Loss: 14.82 ⚠️
📌 $RAM continues to respect a clean 1H market structure, printing consistent higher highs and higher lows into the 15.00 level. Institutional order flow is systematically absorbing sell liquidity at the range high, clearing the path for an upward expansion.
📊 Momentum remains firmly backed by demand as price pushes past immediate resistance. With structural support resting safely above 14.82, the risk-to-reward strongly favors a continuation toward higher targets. 💬 Are you riding this 1H trend expansion or waiting for a retest? 👇
⚠️ Not financial advice. Always manage your risk. 🛡️
🏷️ #RAM #ZEC #Q #Breakout #Crypto
⚡ 🎯
🚨 $RAM BREAKS LOCAL RANGE HIGH AS BULLS AIM FOR EXTENSION! 💥
Entry: 14.98 - 15.05 ⚡
Target: 15.20 🚀
Stop Loss: 14.82 ⚠️
📌 $RAM continues to respect a clean 1H market structure, printing consistent higher highs and higher lows into the 15.00 level. Institutional order flow is systematically absorbing sell liquidity at the range high, clearing the path for an upward expansion.
📊 Momentum remains firmly backed by demand as price pushes past immediate resistance. With structural support resting safely above 14.82, the risk-to-reward strongly favors a continuation toward higher targets. 💬 Are you riding this 1H trend expansion or waiting for a retest? 👇
⚠️ Not financial advice. Always manage your risk. 🛡️
🏷️ #RAM #ZEC #Q #Breakout #Crypto
⚡ 🎯
Entry: 14.98 - 15.05 ⚡
Target: 15.20 🚀
Stop Loss: 14.82 ⚠️
📌 $RAM continues to respect a clean 1H market structure, printing consistent higher highs and higher lows into the 15.00 level. Institutional order flow is systematically absorbing sell liquidity at the range high, clearing the path for an upward expansion.
📊 Momentum remains firmly backed by demand as price pushes past immediate resistance. With structural support resting safely above 14.82, the risk-to-reward strongly favors a continuation toward higher targets. 💬 Are you riding this 1H trend expansion or waiting for a retest? 👇
⚠️ Not financial advice. Always manage your risk. 🛡️
🏷️ #RAM #ZEC #Q #Breakout #Crypto
⚡ 🎯
10

·
--
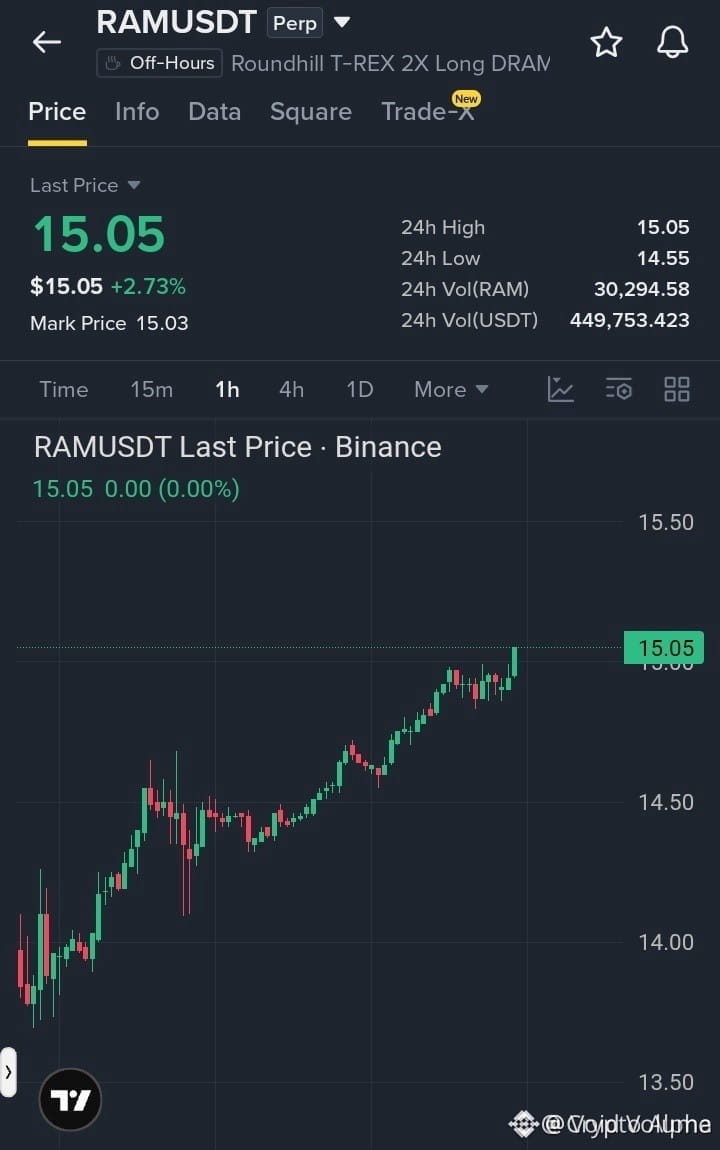
⚡ $RAM EXPANDING STRUCTURE AS INSTITUTIONAL DEMAND PUSHES TOWARD BREAKOUT TRIGGER! 💥
Entry: $14.85 - $15.05 ⚡
Target: $15.80 🚀
Stop Loss: $14.60 ⚠️
📌 Smart money continues to construct a textbook bullish structure on $RAM , steadily absorbing sell-side liquidity from the $14.00 base. 📊 With price grinding directly into the $15.05 key supply zone while printing consistent higher lows, aggressive sellers are losing control of the order flow.
💡 A clean structural hold above this compression range signals immediate expansion toward upper liquidity pools. 💬 Are you front-running the breakout trigger here, or waiting for a structural confirmation candle above $15.05? 👇
⚠️ Not financial advice. Always manage your risk. 🛡️
🏷️ #RAM #Crypto #MarketStructure #Breakout #LSK
🎯 🦈
⚡ $RAM EXPANDING STRUCTURE AS INSTITUTIONAL DEMAND PUSHES TOWARD BREAKOUT TRIGGER! 💥
Entry: $14.85 - $15.05 ⚡
Target: $15.80 🚀
Stop Loss: $14.60 ⚠️
📌 Smart money continues to construct a textbook bullish structure on $RAM , steadily absorbing sell-side liquidity from the $14.00 base. 📊 With price grinding directly into the $15.05 key supply zone while printing consistent higher lows, aggressive sellers are losing control of the order flow.
💡 A clean structural hold above this compression range signals immediate expansion toward upper liquidity pools. 💬 Are you front-running the breakout trigger here, or waiting for a structural confirmation candle above $15.05? 👇
⚠️ Not financial advice. Always manage your risk. 🛡️
🏷️ #RAM #Crypto #MarketStructure #Breakout #LSK
🎯 🦈
Entry: $14.85 - $15.05 ⚡
Target: $15.80 🚀
Stop Loss: $14.60 ⚠️
📌 Smart money continues to construct a textbook bullish structure on $RAM , steadily absorbing sell-side liquidity from the $14.00 base. 📊 With price grinding directly into the $15.05 key supply zone while printing consistent higher lows, aggressive sellers are losing control of the order flow.
💡 A clean structural hold above this compression range signals immediate expansion toward upper liquidity pools. 💬 Are you front-running the breakout trigger here, or waiting for a structural confirmation candle above $15.05? 👇
⚠️ Not financial advice. Always manage your risk. 🛡️
🏷️ #RAM #Crypto #MarketStructure #Breakout #LSK
🎯 🦈
5

·
--
Bullish
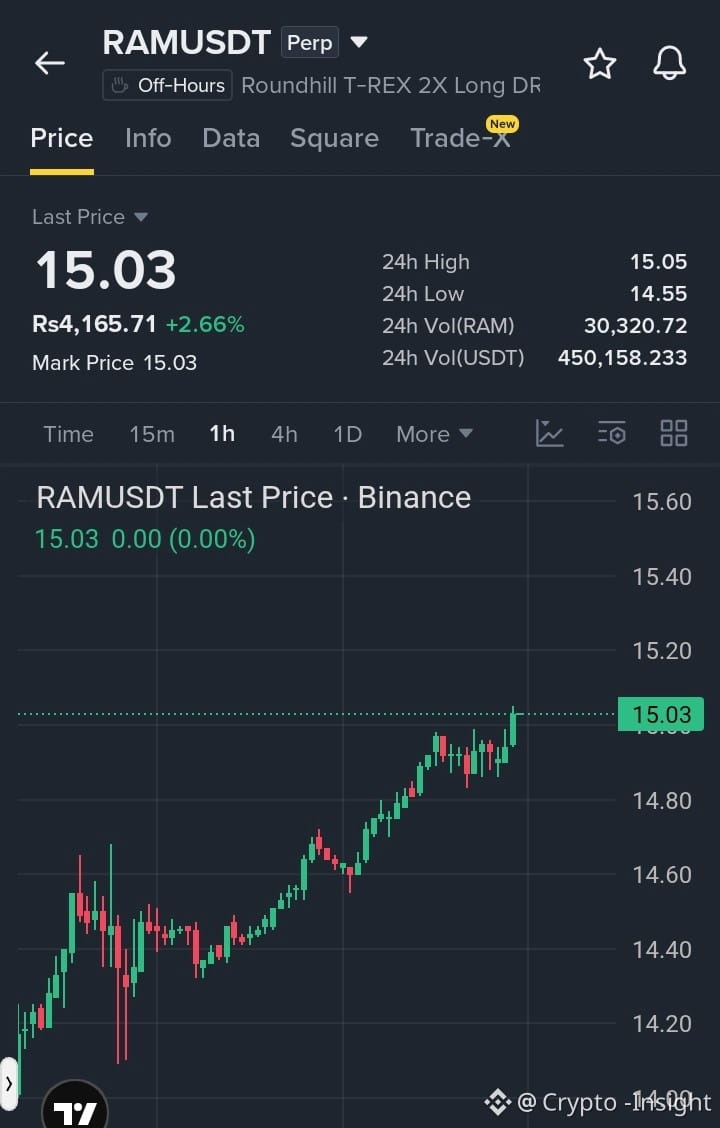
$RAM Is Holding Firm Near A Critical Resistance…!!
#RAM is showing mild bullish momentum at 15.03 after holding above 14.55 Support around 14.80 remains important while 15.05 is the key resistance If buyers break higher the next targets could be 15.40 and 15.60$ZEC
{future}(ZECUSDT)
$QNT
{future}(QNTUSDT)
{future}(RAMUSDT)
$RAM Is Holding Firm Near A Critical Resistance…!!
#RAM is showing mild bullish momentum at 15.03 after holding above 14.55 Support around 14.80 remains important while 15.05 is the key resistance If buyers break higher the next targets could be 15.40 and 15.60$ZEC
$QNT
#RAM is showing mild bullish momentum at 15.03 after holding above 14.55 Support around 14.80 remains important while 15.05 is the key resistance If buyers break higher the next targets could be 15.40 and 15.60$ZEC
$QNT
189

·
--
An old dog glanced at the order book. Now $RAM is trading at 13.79, down 6.318% over the past 24 hours. Trading volume is roughly a little over two million USD. But one data point is pretty interesting: its funding rate is 0.00000000—exactly one cent more or less, not a cent. In the derivatives market, that means longs and shorts are both staying very calm; nobody needs to pay the other side. Market sentiment, for now, hasn’t swung to any extreme.
I think this drop looks more like a mild pullback caused by thin liquidity rather than panic selling or a collective new entry by long positions. The evidence is just two things: the price did fall, but the magnitude stayed in the single digits—no cliff-like move; and the funding rate stayed perfectly flat, indicating that during the decline there wasn’t a huge short army pressing the trade and actively placing bets, nor did we see long holders stubbornly holding on, forced to add to prevent liquidation and prop things up. This is totally different from that slow bleed accompanied by high positive funding—where longs are often trapped and hard-pressed, with a real risk of liquidation cascades.
So who will be uncomfortable next? The current balance is actually very fragile. If there’s no new external capital or any news catalyst, price may continue to drift down in a low-liquidity environment, and positions will slowly lose patience. But on the other hand, once buy orders lift the price, because shorts haven’t built up an especially high position (as seen from the zero funding), the buy-side cover force might not be particularly strong. The rebound momentum will depend on how determined the spot side is. So for now, the main cost is being borne by holders watching from the sidelines—they’re facing both time cost and opportunity cost.
My move is very clear: wait and observe, and don’t act urgently. The triggers are simple: either price strongly recovers last night’s losses and the trading volume increases noticeably—then I’ll consider cautiously adding a bit of exposure; or price continues to sink but the funding rate suddenly turns positive, which would mean longs are starting to brace the trade—I would fully exit. Where might my view be most likely wrong? That it might not be a pullback at all, but the start of a trend reversal. If over the next two trading days $RAM sees continuous volume-expanding selloffs, while open interest (OI) doesn’t fall but instead rises, that would indicate capital is actively initiating shorts—and then the mild pullback logic I just described fails, and I’d have to immediately switch to a bearish stance.
Trading tag: #BinanceFutures #TradFi #USDⓈM #RAM #RAMUSDT $RAM
An old dog glanced at the order book. Now $RAM is trading at 13.79, down 6.318% over the past 24 hours. Trading volume is roughly a little over two million USD. But one data point is pretty interesting: its funding rate is 0.00000000—exactly one cent more or less, not a cent. In the derivatives market, that means longs and shorts are both staying very calm; nobody needs to pay the other side. Market sentiment, for now, hasn’t swung to any extreme.
I think this drop looks more like a mild pullback caused by thin liquidity rather than panic selling or a collective new entry by long positions. The evidence is just two things: the price did fall, but the magnitude stayed in the single digits—no cliff-like move; and the funding rate stayed perfectly flat, indicating that during the decline there wasn’t a huge short army pressing the trade and actively placing bets, nor did we see long holders stubbornly holding on, forced to add to prevent liquidation and prop things up. This is totally different from that slow bleed accompanied by high positive funding—where longs are often trapped and hard-pressed, with a real risk of liquidation cascades.
So who will be uncomfortable next? The current balance is actually very fragile. If there’s no new external capital or any news catalyst, price may continue to drift down in a low-liquidity environment, and positions will slowly lose patience. But on the other hand, once buy orders lift the price, because shorts haven’t built up an especially high position (as seen from the zero funding), the buy-side cover force might not be particularly strong. The rebound momentum will depend on how determined the spot side is. So for now, the main cost is being borne by holders watching from the sidelines—they’re facing both time cost and opportunity cost.
My move is very clear: wait and observe, and don’t act urgently. The triggers are simple: either price strongly recovers last night’s losses and the trading volume increases noticeably—then I’ll consider cautiously adding a bit of exposure; or price continues to sink but the funding rate suddenly turns positive, which would mean longs are starting to brace the trade—I would fully exit. Where might my view be most likely wrong? That it might not be a pullback at all, but the start of a trend reversal. If over the next two trading days $RAM sees continuous volume-expanding selloffs, while open interest (OI) doesn’t fall but instead rises, that would indicate capital is actively initiating shorts—and then the mild pullback logic I just described fails, and I’d have to immediately switch to a bearish stance.
Trading tag: #BinanceFutures #TradFi #USDⓈM #RAM #RAMUSDT $RAM
I think this drop looks more like a mild pullback caused by thin liquidity rather than panic selling or a collective new entry by long positions. The evidence is just two things: the price did fall, but the magnitude stayed in the single digits—no cliff-like move; and the funding rate stayed perfectly flat, indicating that during the decline there wasn’t a huge short army pressing the trade and actively placing bets, nor did we see long holders stubbornly holding on, forced to add to prevent liquidation and prop things up. This is totally different from that slow bleed accompanied by high positive funding—where longs are often trapped and hard-pressed, with a real risk of liquidation cascades.
So who will be uncomfortable next? The current balance is actually very fragile. If there’s no new external capital or any news catalyst, price may continue to drift down in a low-liquidity environment, and positions will slowly lose patience. But on the other hand, once buy orders lift the price, because shorts haven’t built up an especially high position (as seen from the zero funding), the buy-side cover force might not be particularly strong. The rebound momentum will depend on how determined the spot side is. So for now, the main cost is being borne by holders watching from the sidelines—they’re facing both time cost and opportunity cost.
My move is very clear: wait and observe, and don’t act urgently. The triggers are simple: either price strongly recovers last night’s losses and the trading volume increases noticeably—then I’ll consider cautiously adding a bit of exposure; or price continues to sink but the funding rate suddenly turns positive, which would mean longs are starting to brace the trade—I would fully exit. Where might my view be most likely wrong? That it might not be a pullback at all, but the start of a trend reversal. If over the next two trading days $RAM sees continuous volume-expanding selloffs, while open interest (OI) doesn’t fall but instead rises, that would indicate capital is actively initiating shorts—and then the mild pullback logic I just described fails, and I’d have to immediately switch to a bearish stance.
Trading tag: #BinanceFutures #TradFi #USDⓈM #RAM #RAMUSDT $RAM
6

·
--
$RAM has fallen 4.724% over the past 24 hours; current price is 14.32. The current funding rate is -0.00122818, meaning shorts are paying longs. A downward price move combined with a negative funding rate creates a typical structure of short accumulation with bearish consensus prevailing, but the negative funding rate itself also suggests that short sentiment could be overheated. The strongest counter-evidence is that any sudden positive catalyst could trigger short covering. If the price stabilizes around the current level, the negative funding rate would force some shorts to close positions, supporting a modest rebound. I lean toward staying on the sidelines; if the funding rate turns positive, short sentiment should ease, and the current structure is not worth heavily betting on.
Trading tag: #TradFi #链上美股 #RAM
Where do you think this assessment is most likely to be wrong?
$RAM has fallen 4.724% over the past 24 hours; current price is 14.32. The current funding rate is -0.00122818, meaning shorts are paying longs. A downward price move combined with a negative funding rate creates a typical structure of short accumulation with bearish consensus prevailing, but the negative funding rate itself also suggests that short sentiment could be overheated. The strongest counter-evidence is that any sudden positive catalyst could trigger short covering. If the price stabilizes around the current level, the negative funding rate would force some shorts to close positions, supporting a modest rebound. I lean toward staying on the sidelines; if the funding rate turns positive, short sentiment should ease, and the current structure is not worth heavily betting on.
Trading tag: #TradFi #链上美股 #RAM
Where do you think this assessment is most likely to be wrong?
Trading tag: #TradFi #链上美股 #RAM
Where do you think this assessment is most likely to be wrong?
94

·
--
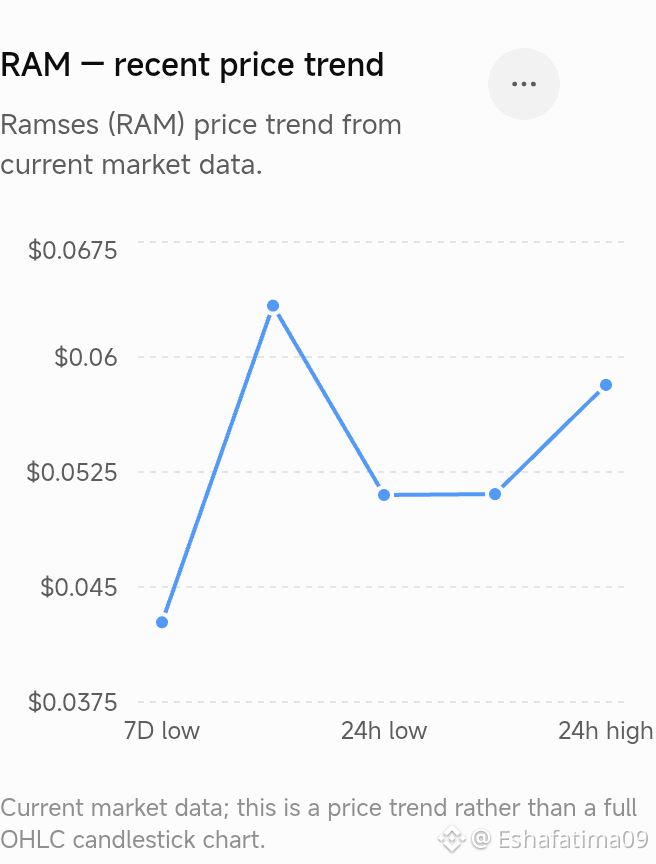
$RAM #RAM Current: ~$0.0511
24h: -9.2%
7D: +16.5%
Support: ~$0.0500–$0.0510
Resistance: ~$0.0580–$0.0630
A move above ~$0.063 could show stronger upside momentum.
A break below ~$0.050 could increase short-term selling pressure.
RAM is a DeFi/DEX token in the Robinhood/HyperEVM ecosystem.
#BNBMarketCapPassesBNYMellon
#DogecoinRises15%
$RAM #RAM Current: ~$0.0511
24h: -9.2%
7D: +16.5%
Support: ~$0.0500–$0.0510
Resistance: ~$0.0580–$0.0630
A move above ~$0.063 could show stronger upside momentum.
A break below ~$0.050 could increase short-term selling pressure.
RAM is a DeFi/DEX token in the Robinhood/HyperEVM ecosystem.
#BNBMarketCapPassesBNYMellon
#DogecoinRises15%
24h: -9.2%
7D: +16.5%
Support: ~$0.0500–$0.0510
Resistance: ~$0.0580–$0.0630
A move above ~$0.063 could show stronger upside momentum.
A break below ~$0.050 could increase short-term selling pressure.
RAM is a DeFi/DEX token in the Robinhood/HyperEVM ecosystem.
#BNBMarketCapPassesBNYMellon
#DogecoinRises15%
104

·
--
$RAM 24 hours rises 5.497% to 14.97; funding rate -0.00005350. Shorts are paying longs.
Price is up but the rate is negative—this is a classic signal of a short squeeze. Open interest at 57915.52 isn’t especially high relative to the size of the price increase, suggesting that chasing-long capital hasn’t flooded in wildly yet, and the squeeze could continue.
If the funding rate turns positive or the price breaks below 14.5, I will immediately reduce my position. Stay cautiously on the sidelines; if you’re more aggressive, you can try a small long but put the stop-loss below 14.5 to manage risk. If neither happens, wait until the funding rate returns to zero.
Trading tag: #TradFi #链上美股 #RAM
Where do you think this judgment is most likely to be wrong?
$RAM 24 hours rises 5.497% to 14.97; funding rate -0.00005350. Shorts are paying longs.
Price is up but the rate is negative—this is a classic signal of a short squeeze. Open interest at 57915.52 isn’t especially high relative to the size of the price increase, suggesting that chasing-long capital hasn’t flooded in wildly yet, and the squeeze could continue.
If the funding rate turns positive or the price breaks below 14.5, I will immediately reduce my position. Stay cautiously on the sidelines; if you’re more aggressive, you can try a small long but put the stop-loss below 14.5 to manage risk. If neither happens, wait until the funding rate returns to zero.
Trading tag: #TradFi #链上美股 #RAM
Where do you think this judgment is most likely to be wrong?
Price is up but the rate is negative—this is a classic signal of a short squeeze. Open interest at 57915.52 isn’t especially high relative to the size of the price increase, suggesting that chasing-long capital hasn’t flooded in wildly yet, and the squeeze could continue.
If the funding rate turns positive or the price breaks below 14.5, I will immediately reduce my position. Stay cautiously on the sidelines; if you’re more aggressive, you can try a small long but put the stop-loss below 14.5 to manage risk. If neither happens, wait until the funding rate returns to zero.
Trading tag: #TradFi #链上美股 #RAM
Where do you think this judgment is most likely to be wrong?
48
·
--
$RAM 24 hours surged 5.79%, and the price is back above 15.34, but the funding rate is zero. This number is a bit interesting: the move is close to 6%, yet in the futures market no one seems to be paying anyone. That suggests the capital structure driving this rally is relatively balanced, not the typical long-leverage “charging ahead” pattern. Compared with the high funding-rate environment commonly seen in traditional financial futures, on-chain perpetual contracts’ immediate pricing mechanism makes the transmission of sentiment more direct, with one less buffer layer.
An old dog glanced at its open interest—nearly 58,000 contracts. The state of a zero funding rate is not that common during a strong uptrend. Usually, rising prices attract longs to open positions, which turns the funding rate positive and longs start paying shorts. Now it’s zero, so there are only two possibilities to infer: either spot buying is pushing the contract price higher, but the incremental long positions on the contract side aren’t aggressive; or shorts are opening positions in parallel during the rally, creating a subtle balance. Since it falls under the EQUITY category and is linked to traditional financial assets, this pricing efficiency may reflect cross-market expectations faster. But the specific expectations aren’t provided in the input data—there’s no related news or announcement—so I won’t guess. From the perspective of M3_crypto_link, the current upswing in $RAM and the zero funding rate look more like a quick financialized reaction of crypto-native capital to price fluctuations in some traditional underlying asset, rather than purely driven by internal crypto leverage sentiment.
So my view is that $RAM is in a fragile equilibrium in the short term. The rise is supported by spot demand or low-leverage buys, but it lacks confirmation and reinforcement from long-side sentiment in the derivatives market. At the current level of 15.34, if over the next 24 hours the funding rate stays near 0 and the price can hold above 15.0, I’m inclined to treat it as a consolidation pattern—watch it with a light position and wait for a directional choice. My trigger conditions are: if the price breaks below 15.0 and the open interest clearly declines, I’ll exit and observe, because that indicates the support bids have withdrawn; conversely, if the price breaks above 15.5 with strong volume and the funding rate starts turning positive, I may consider adding, because that would mean long-side consensus is forming and they’re willing to pay the cost to maintain positions.
The strongest counter-evidence comes from traditional risk-asset correlation.
Trading Tag: #BinanceFutures #TradFi #USDⓈM #RAM #RAMUSDT $RAM
$RAM 24 hours surged 5.79%, and the price is back above 15.34, but the funding rate is zero. This number is a bit interesting: the move is close to 6%, yet in the futures market no one seems to be paying anyone. That suggests the capital structure driving this rally is relatively balanced, not the typical long-leverage “charging ahead” pattern. Compared with the high funding-rate environment commonly seen in traditional financial futures, on-chain perpetual contracts’ immediate pricing mechanism makes the transmission of sentiment more direct, with one less buffer layer.
An old dog glanced at its open interest—nearly 58,000 contracts. The state of a zero funding rate is not that common during a strong uptrend. Usually, rising prices attract longs to open positions, which turns the funding rate positive and longs start paying shorts. Now it’s zero, so there are only two possibilities to infer: either spot buying is pushing the contract price higher, but the incremental long positions on the contract side aren’t aggressive; or shorts are opening positions in parallel during the rally, creating a subtle balance. Since it falls under the EQUITY category and is linked to traditional financial assets, this pricing efficiency may reflect cross-market expectations faster. But the specific expectations aren’t provided in the input data—there’s no related news or announcement—so I won’t guess. From the perspective of M3_crypto_link, the current upswing in $RAM and the zero funding rate look more like a quick financialized reaction of crypto-native capital to price fluctuations in some traditional underlying asset, rather than purely driven by internal crypto leverage sentiment.
So my view is that $RAM is in a fragile equilibrium in the short term. The rise is supported by spot demand or low-leverage buys, but it lacks confirmation and reinforcement from long-side sentiment in the derivatives market. At the current level of 15.34, if over the next 24 hours the funding rate stays near 0 and the price can hold above 15.0, I’m inclined to treat it as a consolidation pattern—watch it with a light position and wait for a directional choice. My trigger conditions are: if the price breaks below 15.0 and the open interest clearly declines, I’ll exit and observe, because that indicates the support bids have withdrawn; conversely, if the price breaks above 15.5 with strong volume and the funding rate starts turning positive, I may consider adding, because that would mean long-side consensus is forming and they’re willing to pay the cost to maintain positions.
The strongest counter-evidence comes from traditional risk-asset correlation.
Trading Tag: #BinanceFutures #TradFi #USDⓈM #RAM #RAMUSDT $RAM
An old dog glanced at its open interest—nearly 58,000 contracts. The state of a zero funding rate is not that common during a strong uptrend. Usually, rising prices attract longs to open positions, which turns the funding rate positive and longs start paying shorts. Now it’s zero, so there are only two possibilities to infer: either spot buying is pushing the contract price higher, but the incremental long positions on the contract side aren’t aggressive; or shorts are opening positions in parallel during the rally, creating a subtle balance. Since it falls under the EQUITY category and is linked to traditional financial assets, this pricing efficiency may reflect cross-market expectations faster. But the specific expectations aren’t provided in the input data—there’s no related news or announcement—so I won’t guess. From the perspective of M3_crypto_link, the current upswing in $RAM and the zero funding rate look more like a quick financialized reaction of crypto-native capital to price fluctuations in some traditional underlying asset, rather than purely driven by internal crypto leverage sentiment.
So my view is that $RAM is in a fragile equilibrium in the short term. The rise is supported by spot demand or low-leverage buys, but it lacks confirmation and reinforcement from long-side sentiment in the derivatives market. At the current level of 15.34, if over the next 24 hours the funding rate stays near 0 and the price can hold above 15.0, I’m inclined to treat it as a consolidation pattern—watch it with a light position and wait for a directional choice. My trigger conditions are: if the price breaks below 15.0 and the open interest clearly declines, I’ll exit and observe, because that indicates the support bids have withdrawn; conversely, if the price breaks above 15.5 with strong volume and the funding rate starts turning positive, I may consider adding, because that would mean long-side consensus is forming and they’re willing to pay the cost to maintain positions.
The strongest counter-evidence comes from traditional risk-asset correlation.
Trading Tag: #BinanceFutures #TradFi #USDⓈM #RAM #RAMUSDT $RAM
20

·
--
$RAM surged 4.676% over the past 24 hours, with the price at 13.88. U.S. tech stocks have been in a recent pullback; if Trump again speaks out to pressure tariffs, on-chain U.S.-stock proxies could slip as well. The funding rate is 0.00055728, which is positive—meaning longs are paying to maintain positions. A rise along with a positive funding rate indicates that the cost of chasing highs is accumulating. My view is that the risk of going long in the short term is greater than the potential upside; this area is likely to get hit.
The counterargument is that if U.S. stocks V-rebound, $RAM might rebound too. But the fact remains that the longs are crowded. If Trump posts again and calls out tech companies, panic selling could first target this level.
Trading tag: #TradFi #链上美股 #RAM
Where do you think this set of 판단 is most likely to be wrong?
$RAM surged 4.676% over the past 24 hours, with the price at 13.88. U.S. tech stocks have been in a recent pullback; if Trump again speaks out to pressure tariffs, on-chain U.S.-stock proxies could slip as well. The funding rate is 0.00055728, which is positive—meaning longs are paying to maintain positions. A rise along with a positive funding rate indicates that the cost of chasing highs is accumulating. My view is that the risk of going long in the short term is greater than the potential upside; this area is likely to get hit.
The counterargument is that if U.S. stocks V-rebound, $RAM might rebound too. But the fact remains that the longs are crowded. If Trump posts again and calls out tech companies, panic selling could first target this level.
Trading tag: #TradFi #链上美股 #RAM
Where do you think this set of 판단 is most likely to be wrong?
The counterargument is that if U.S. stocks V-rebound, $RAM might rebound too. But the fact remains that the longs are crowded. If Trump posts again and calls out tech companies, panic selling could first target this level.
Trading tag: #TradFi #链上美股 #RAM
Where do you think this set of 판단 is most likely to be wrong?
60
·
--
$RAM fell 11.68, down 2.99% over 24 hours, but the corresponding perpetual contract funding rate remains positive at 0.00062. Price weakness alongside a positive funding rate means long positions are paying financing costs against the trend.
Current open interest is 37,668, with trading volume of about 1.51 million. Liquidity is not particularly strong. This structure is a classic case of longs trapped: as the price declines, longs not only absorb unrealized losses, but also pay the short side for holding the positions. If the funding rate continues to stay positive, longs’ time costs will keep accumulating until they either reduce exposure or get liquidated.
The counterpoint is that if sentiment in the US stock market suddenly turns bullish and lifts these TradFi derivatives, longs could quickly swing back into profit and the funding pressure would dissipate instantly. The trigger for this thesis to fail is straightforward: the price recovers 11.68 for two consecutive days and the funding rate turns negative.
I’m waiting for a clearer signal. This drifting lower-with-interest-paid setup is not suitable for a left-side entry. If the price stabilizes above 11.68 and we observe the funding rate turning negative, that would be an initial signal that shorts concede and longs regain control. At that point, you could consider a small initial long position.
Aggressive: When the price holds above 11.68 and the funding rate turns negative, go long with a small position; set a stop-loss below the prior low.
Trading tag: #TradFi #链上美股 #RAM
Where do you think this judgment is most likely to be wrong?
$RAM fell 11.68, down 2.99% over 24 hours, but the corresponding perpetual contract funding rate remains positive at 0.00062. Price weakness alongside a positive funding rate means long positions are paying financing costs against the trend.
Current open interest is 37,668, with trading volume of about 1.51 million. Liquidity is not particularly strong. This structure is a classic case of longs trapped: as the price declines, longs not only absorb unrealized losses, but also pay the short side for holding the positions. If the funding rate continues to stay positive, longs’ time costs will keep accumulating until they either reduce exposure or get liquidated.
The counterpoint is that if sentiment in the US stock market suddenly turns bullish and lifts these TradFi derivatives, longs could quickly swing back into profit and the funding pressure would dissipate instantly. The trigger for this thesis to fail is straightforward: the price recovers 11.68 for two consecutive days and the funding rate turns negative.
I’m waiting for a clearer signal. This drifting lower-with-interest-paid setup is not suitable for a left-side entry. If the price stabilizes above 11.68 and we observe the funding rate turning negative, that would be an initial signal that shorts concede and longs regain control. At that point, you could consider a small initial long position.
Aggressive: When the price holds above 11.68 and the funding rate turns negative, go long with a small position; set a stop-loss below the prior low.
Trading tag: #TradFi #链上美股 #RAM
Where do you think this judgment is most likely to be wrong?
Current open interest is 37,668, with trading volume of about 1.51 million. Liquidity is not particularly strong. This structure is a classic case of longs trapped: as the price declines, longs not only absorb unrealized losses, but also pay the short side for holding the positions. If the funding rate continues to stay positive, longs’ time costs will keep accumulating until they either reduce exposure or get liquidated.
The counterpoint is that if sentiment in the US stock market suddenly turns bullish and lifts these TradFi derivatives, longs could quickly swing back into profit and the funding pressure would dissipate instantly. The trigger for this thesis to fail is straightforward: the price recovers 11.68 for two consecutive days and the funding rate turns negative.
I’m waiting for a clearer signal. This drifting lower-with-interest-paid setup is not suitable for a left-side entry. If the price stabilizes above 11.68 and we observe the funding rate turning negative, that would be an initial signal that shorts concede and longs regain control. At that point, you could consider a small initial long position.
Aggressive: When the price holds above 11.68 and the funding rate turns negative, go long with a small position; set a stop-loss below the prior low.
Trading tag: #TradFi #链上美股 #RAM
Where do you think this judgment is most likely to be wrong?
30
·
--
$RAM current price 11.68, down 2.99% over the past 24 hours, yet the funding rate remains at 0.00062257. Price is falling, and the funding rate is still positive—this is a typical long-squeeze/longs-being-trapped situation, where shorts are collecting funding from longs.
This is a single-signal judgment, but the structure is clear. A positive funding rate means longs are currently paying shorts the cost of holding positions. If the price drops while the funding rate stays positive, it suggests the longs that are “holding on” have not admitted defeat and exited—possibly even adding to positions to dilute their cost basis. Open interest is 37668.15; that number alone can’t be directly compared, but combined with the price and funding rate, it points to a crowded long position and a passive/forced situation. Under this kind of structure, any further decline may trigger long liquidation stops or even liquidations, leading to liquidity “trampling.”
The opposing view is that $RAM, as a tokenized U.S. stock product, may have underlying assets supported by earnings reports or industry tailwinds, and after a short-term pullback, buy-side demand will re-enter. However, the current contract structure doesn’t reflect that—funding hasn’t quickly dropped toward zero or turned negative as the price falls, which suggests shorts have not widely closed their positions, and bearish pressure is still solid.
If the price breaks below 11.5 and the funding rate does not show a significant decline, I would reduce exposure to avoid the risk of “one sell triggers another.” Conversely, if the funding rate quickly turns negative, that would indicate shorts are exhausted, and the market may enter a new balance.
Trading tag: #TradFi #链上美股 #RAM
Where do you think this analysis is most likely to be wrong?
$RAM current price 11.68, down 2.99% over the past 24 hours, yet the funding rate remains at 0.00062257. Price is falling, and the funding rate is still positive—this is a typical long-squeeze/longs-being-trapped situation, where shorts are collecting funding from longs.
This is a single-signal judgment, but the structure is clear. A positive funding rate means longs are currently paying shorts the cost of holding positions. If the price drops while the funding rate stays positive, it suggests the longs that are “holding on” have not admitted defeat and exited—possibly even adding to positions to dilute their cost basis. Open interest is 37668.15; that number alone can’t be directly compared, but combined with the price and funding rate, it points to a crowded long position and a passive/forced situation. Under this kind of structure, any further decline may trigger long liquidation stops or even liquidations, leading to liquidity “trampling.”
The opposing view is that $RAM , as a tokenized U.S. stock product, may have underlying assets supported by earnings reports or industry tailwinds, and after a short-term pullback, buy-side demand will re-enter. However, the current contract structure doesn’t reflect that—funding hasn’t quickly dropped toward zero or turned negative as the price falls, which suggests shorts have not widely closed their positions, and bearish pressure is still solid.
If the price breaks below 11.5 and the funding rate does not show a significant decline, I would reduce exposure to avoid the risk of “one sell triggers another.” Conversely, if the funding rate quickly turns negative, that would indicate shorts are exhausted, and the market may enter a new balance.
Trading tag: #TradFi #链上美股 #RAM
Where do you think this analysis is most likely to be wrong?
This is a single-signal judgment, but the structure is clear. A positive funding rate means longs are currently paying shorts the cost of holding positions. If the price drops while the funding rate stays positive, it suggests the longs that are “holding on” have not admitted defeat and exited—possibly even adding to positions to dilute their cost basis. Open interest is 37668.15; that number alone can’t be directly compared, but combined with the price and funding rate, it points to a crowded long position and a passive/forced situation. Under this kind of structure, any further decline may trigger long liquidation stops or even liquidations, leading to liquidity “trampling.”
The opposing view is that $RAM , as a tokenized U.S. stock product, may have underlying assets supported by earnings reports or industry tailwinds, and after a short-term pullback, buy-side demand will re-enter. However, the current contract structure doesn’t reflect that—funding hasn’t quickly dropped toward zero or turned negative as the price falls, which suggests shorts have not widely closed their positions, and bearish pressure is still solid.
If the price breaks below 11.5 and the funding rate does not show a significant decline, I would reduce exposure to avoid the risk of “one sell triggers another.” Conversely, if the funding rate quickly turns negative, that would indicate shorts are exhausted, and the market may enter a new balance.
Trading tag: #TradFi #链上美股 #RAM
Where do you think this analysis is most likely to be wrong?
81
·
--
$RAM 24 hours saw a 6.67% drop, with a closing price of 11.48. Political and military tensions are heating up, and risk-avoidance sentiment in the market is rising. The typical route is capital flowing out of high-risk assets. $RAM, such as these on-chain U.S. stock-style contracts, is hit first—its decline is the evidence.
The drawdown isn’t that deep because the funding rate is 0. This indicates there’s no extreme sentiment on either the long or short side—neither side is paying funding fees to stubbornly hold. The fall looks more like a natural adjustment rather than a panic sell-off or a situation where shorts squeeze the market. Trading volume is 1.69 million, open interest is 38,000, and for now there are no signs of large-scale withdrawal.
My take: geopolitical risk is the knife hanging overhead. Nothing major has happened yet, so the market is holding steady. But as soon as another piece of news drops, a liquidity-middling asset like $RAM could fall even harder than the broader market. Chasing longs now is essentially betting that the conflict will cool down—the odds aren’t good.
Clear action: stay on the sidelines. If the price breaks below the previous low around 11.40, I’ll test a short position with a small size, with a stop-loss set above 11.80. If the price first rises back above 11.60, then this short thesis will be abandoned for now.
Trading tag: #TradFi #链上美股 #RAM
Where do you think this analysis is most likely to be wrong?
$RAM 24 hours saw a 6.67% drop, with a closing price of 11.48. Political and military tensions are heating up, and risk-avoidance sentiment in the market is rising. The typical route is capital flowing out of high-risk assets. $RAM , such as these on-chain U.S. stock-style contracts, is hit first—its decline is the evidence.
The drawdown isn’t that deep because the funding rate is 0. This indicates there’s no extreme sentiment on either the long or short side—neither side is paying funding fees to stubbornly hold. The fall looks more like a natural adjustment rather than a panic sell-off or a situation where shorts squeeze the market. Trading volume is 1.69 million, open interest is 38,000, and for now there are no signs of large-scale withdrawal.
My take: geopolitical risk is the knife hanging overhead. Nothing major has happened yet, so the market is holding steady. But as soon as another piece of news drops, a liquidity-middling asset like $RAM could fall even harder than the broader market. Chasing longs now is essentially betting that the conflict will cool down—the odds aren’t good.
Clear action: stay on the sidelines. If the price breaks below the previous low around 11.40, I’ll test a short position with a small size, with a stop-loss set above 11.80. If the price first rises back above 11.60, then this short thesis will be abandoned for now.
Trading tag: #TradFi #链上美股 #RAM
Where do you think this analysis is most likely to be wrong?
The drawdown isn’t that deep because the funding rate is 0. This indicates there’s no extreme sentiment on either the long or short side—neither side is paying funding fees to stubbornly hold. The fall looks more like a natural adjustment rather than a panic sell-off or a situation where shorts squeeze the market. Trading volume is 1.69 million, open interest is 38,000, and for now there are no signs of large-scale withdrawal.
My take: geopolitical risk is the knife hanging overhead. Nothing major has happened yet, so the market is holding steady. But as soon as another piece of news drops, a liquidity-middling asset like $RAM could fall even harder than the broader market. Chasing longs now is essentially betting that the conflict will cool down—the odds aren’t good.
Clear action: stay on the sidelines. If the price breaks below the previous low around 11.40, I’ll test a short position with a small size, with a stop-loss set above 11.80. If the price first rises back above 11.60, then this short thesis will be abandoned for now.
Trading tag: #TradFi #链上美股 #RAM
Where do you think this analysis is most likely to be wrong?
35
·
--
$RAM fell 7.076% over the past 24 hours, and the price is down to 11.95. The old dog glanced at the data and found something interesting: with this kind of drawdown, the perpetual contract funding rate is 0.00000000. This setup needs to be looked at piece by piece.
The price has dropped sharply; under normal logic, short-side pressure should strengthen and push the funding rate into negative territory—meaning shorts pay longs. But now the rate hasn’t moved at all and stays at zero, which indicates that the costs between longs and shorts in the contract market are perfectly balanced, with no side needing to pay extra for holding positions. This points to a possible scenario: the selling pressure behind this drop is likely not mainly from shorts actively driving the market down in the futures/perps, but more likely from spot holders or longs on the contract side actively closing positions.
Open interest (OI) remains at 37774.47, but without historical comparisons, it’s impossible to say whether this level is high or low. Looking at just this one signal, the decline lacks “fuel” from shorts in the contract market, so the continuation of the selloff needs a question mark.
My view is that this isn’t the beginning of a trend-driven selloff led by shorts. It looks more like a concentrated profit-taking and position-reduction move on the spot side or from long positions in the contracts. Because if shorts truly rushed in aggressively, they wouldn’t be able to accept the zero-funding cost—they would push funding down. The current data doesn’t support the idea that shorts have strong intentions to go heavily short. So, based on a single-signal read: the rapid selloff in the short term may be close to the end, but an immediate reversal still requires fresh evidence of new buying.
But on the other hand, the strongest counter-evidence is this: if the funding rate quickly turns negative—for example, below -0.01%—then it would mean shorts have started moving in to buy the dip and bet on further downside, and my judgment would be wrong. At the same time, watch OI: if the price stabilizes and OI increases significantly, it may indicate longs taking orders on the left side; if the price stabilizes but OI declines, it suggests funding is being withdrawn and the rebound lacks momentum.
The second-order effect is that if the price consolidates here while funding stays at zero, contract longs don’t have to pay interest, but they still face unrealized losses on their positions. That psychological pressure could trigger a new round of forced liquidations. If spot selling pressure continues, it could weigh on the coin price; however, the calm in the contract market limits the depth of panic-driven selloffs, which may keep the market trapped in a frustrating grind lower.
When would my view become invalid?
Trading tag: #BinanceFutures #TradFi #USDⓈM #RAM #RAMUSDT $RAM
$RAM fell 7.076% over the past 24 hours, and the price is down to 11.95. The old dog glanced at the data and found something interesting: with this kind of drawdown, the perpetual contract funding rate is 0.00000000. This setup needs to be looked at piece by piece.
The price has dropped sharply; under normal logic, short-side pressure should strengthen and push the funding rate into negative territory—meaning shorts pay longs. But now the rate hasn’t moved at all and stays at zero, which indicates that the costs between longs and shorts in the contract market are perfectly balanced, with no side needing to pay extra for holding positions. This points to a possible scenario: the selling pressure behind this drop is likely not mainly from shorts actively driving the market down in the futures/perps, but more likely from spot holders or longs on the contract side actively closing positions.
Open interest (OI) remains at 37774.47, but without historical comparisons, it’s impossible to say whether this level is high or low. Looking at just this one signal, the decline lacks “fuel” from shorts in the contract market, so the continuation of the selloff needs a question mark.
My view is that this isn’t the beginning of a trend-driven selloff led by shorts. It looks more like a concentrated profit-taking and position-reduction move on the spot side or from long positions in the contracts. Because if shorts truly rushed in aggressively, they wouldn’t be able to accept the zero-funding cost—they would push funding down. The current data doesn’t support the idea that shorts have strong intentions to go heavily short. So, based on a single-signal read: the rapid selloff in the short term may be close to the end, but an immediate reversal still requires fresh evidence of new buying.
But on the other hand, the strongest counter-evidence is this: if the funding rate quickly turns negative—for example, below -0.01%—then it would mean shorts have started moving in to buy the dip and bet on further downside, and my judgment would be wrong. At the same time, watch OI: if the price stabilizes and OI increases significantly, it may indicate longs taking orders on the left side; if the price stabilizes but OI declines, it suggests funding is being withdrawn and the rebound lacks momentum.
The second-order effect is that if the price consolidates here while funding stays at zero, contract longs don’t have to pay interest, but they still face unrealized losses on their positions. That psychological pressure could trigger a new round of forced liquidations. If spot selling pressure continues, it could weigh on the coin price; however, the calm in the contract market limits the depth of panic-driven selloffs, which may keep the market trapped in a frustrating grind lower.
When would my view become invalid?
Trading tag: #BinanceFutures #TradFi #USDⓈM #RAM #RAMUSDT $RAM
The price has dropped sharply; under normal logic, short-side pressure should strengthen and push the funding rate into negative territory—meaning shorts pay longs. But now the rate hasn’t moved at all and stays at zero, which indicates that the costs between longs and shorts in the contract market are perfectly balanced, with no side needing to pay extra for holding positions. This points to a possible scenario: the selling pressure behind this drop is likely not mainly from shorts actively driving the market down in the futures/perps, but more likely from spot holders or longs on the contract side actively closing positions.
Open interest (OI) remains at 37774.47, but without historical comparisons, it’s impossible to say whether this level is high or low. Looking at just this one signal, the decline lacks “fuel” from shorts in the contract market, so the continuation of the selloff needs a question mark.
My view is that this isn’t the beginning of a trend-driven selloff led by shorts. It looks more like a concentrated profit-taking and position-reduction move on the spot side or from long positions in the contracts. Because if shorts truly rushed in aggressively, they wouldn’t be able to accept the zero-funding cost—they would push funding down. The current data doesn’t support the idea that shorts have strong intentions to go heavily short. So, based on a single-signal read: the rapid selloff in the short term may be close to the end, but an immediate reversal still requires fresh evidence of new buying.
But on the other hand, the strongest counter-evidence is this: if the funding rate quickly turns negative—for example, below -0.01%—then it would mean shorts have started moving in to buy the dip and bet on further downside, and my judgment would be wrong. At the same time, watch OI: if the price stabilizes and OI increases significantly, it may indicate longs taking orders on the left side; if the price stabilizes but OI declines, it suggests funding is being withdrawn and the rebound lacks momentum.
The second-order effect is that if the price consolidates here while funding stays at zero, contract longs don’t have to pay interest, but they still face unrealized losses on their positions. That psychological pressure could trigger a new round of forced liquidations. If spot selling pressure continues, it could weigh on the coin price; however, the calm in the contract market limits the depth of panic-driven selloffs, which may keep the market trapped in a frustrating grind lower.
When would my view become invalid?
Trading tag: #BinanceFutures #TradFi #USDⓈM #RAM #RAMUSDT $RAM
13

·
--
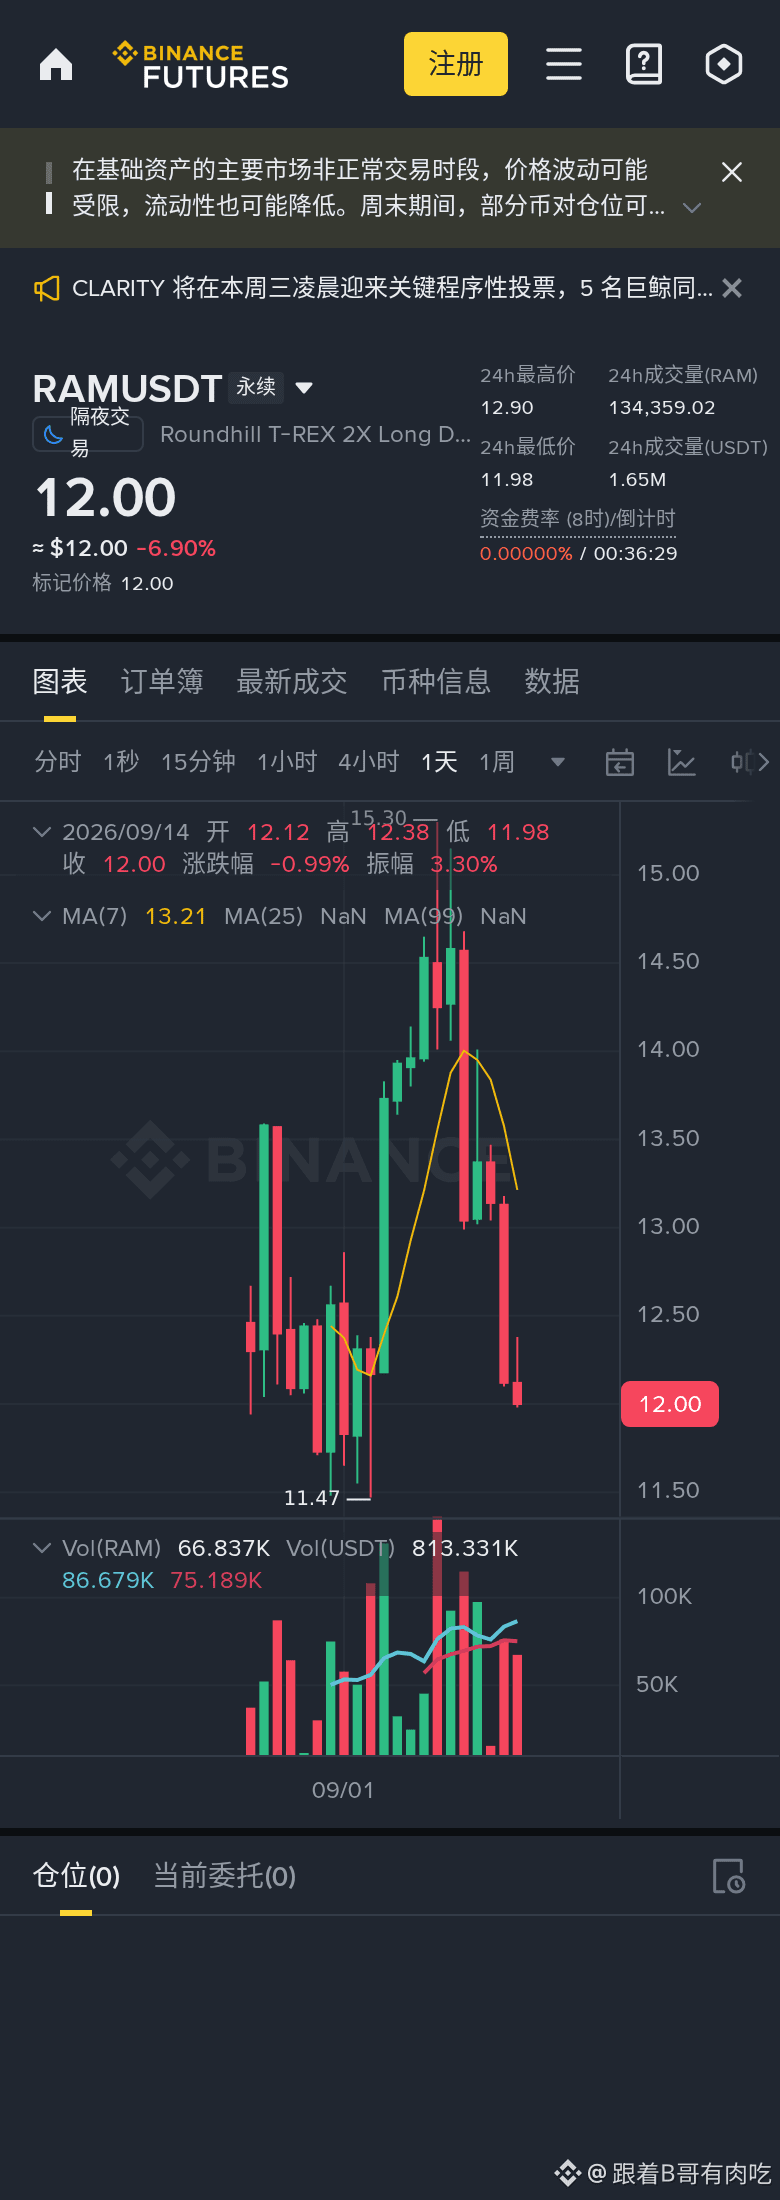
RAM 4-hour window: dark clouds over the top + key levels—say it all at once
After watching RAM for hours, a 4-hour level signal has finally appeared. “Dark clouds over the top” forming at a high level is a strong warning of resistance against any rebound. On the 4-hour chart, it’s at 12.00 (-6.69%); RSI is 14.5. Moving averages are bearish (and the data is insufficient), and the candlestick pattern is “dark clouds over the top.”
Key levels on the 4-hour chart: support 11.98 / resistance 15.30.
Trigger conditions, written clearly: go long if it breaks and holds above 15.30; go short if it breaks below 11.98. Don’t make any moves in between—let it choose its direction on its own.
Right now, it’s not advisable to take action. The 4-hour direction isn’t clear yet—wait for a breakout.
Bottom line: if you’re wrong, cut the loss—don’t stubbornly “hold and it’ll come back.” That’s how people start losing big money. Markets change fast, but keep the same mindset. Good luck.
⚠️ Pure technical sharing, not investment advice. Take full responsibility for your own gains and losses. Crypto markets are highly volatile—make independent judgments and control risk.
#RAM #币安广场 #low-position setup
RAM 4-hour window: dark clouds over the top + key levels—say it all at once
After watching RAM for hours, a 4-hour level signal has finally appeared. “Dark clouds over the top” forming at a high level is a strong warning of resistance against any rebound. On the 4-hour chart, it’s at 12.00 (-6.69%); RSI is 14.5. Moving averages are bearish (and the data is insufficient), and the candlestick pattern is “dark clouds over the top.”
Key levels on the 4-hour chart: support 11.98 / resistance 15.30.
Trigger conditions, written clearly: go long if it breaks and holds above 15.30; go short if it breaks below 11.98. Don’t make any moves in between—let it choose its direction on its own.
Right now, it’s not advisable to take action. The 4-hour direction isn’t clear yet—wait for a breakout.
Bottom line: if you’re wrong, cut the loss—don’t stubbornly “hold and it’ll come back.” That’s how people start losing big money. Markets change fast, but keep the same mindset. Good luck.
⚠️ Pure technical sharing, not investment advice. Take full responsibility for your own gains and losses. Crypto markets are highly volatile—make independent judgments and control risk.
#RAM #币安广场 #low-position setup
After watching RAM for hours, a 4-hour level signal has finally appeared. “Dark clouds over the top” forming at a high level is a strong warning of resistance against any rebound. On the 4-hour chart, it’s at 12.00 (-6.69%); RSI is 14.5. Moving averages are bearish (and the data is insufficient), and the candlestick pattern is “dark clouds over the top.”
Key levels on the 4-hour chart: support 11.98 / resistance 15.30.
Trigger conditions, written clearly: go long if it breaks and holds above 15.30; go short if it breaks below 11.98. Don’t make any moves in between—let it choose its direction on its own.
Right now, it’s not advisable to take action. The 4-hour direction isn’t clear yet—wait for a breakout.
Bottom line: if you’re wrong, cut the loss—don’t stubbornly “hold and it’ll come back.” That’s how people start losing big money. Markets change fast, but keep the same mindset. Good luck.
⚠️ Pure technical sharing, not investment advice. Take full responsibility for your own gains and losses. Crypto markets are highly volatile—make independent judgments and control risk.
#RAM #币安广场 #low-position setup
34
·
--
The old dog scanned and found that this $RAM 24-hour line is pierced a bit deep; a -7.219% drop paired with a funding rate of -0.00114409 is a combination worth a closer look. The price is $12.21, daily trading volume is over $1.25 million, and open interest is 36,901.57—everything here is ready-made data.
From an angle that falls on the M4 mover, this looks more like a short-term liquidity anomaly. A negative funding rate means shorts are continuously paying longs, which is usually interpreted as bearish sentiment being dominant and positions being crowded. But the price is falling, creating a setup where the price is down while the funding rate is negative. This kind of divergence on short timeframes often suggests shorts have built up too many contrarian positions, making them prone to liquidation on a small rebound or changes in liquidity—what people commonly call a short squeeze. Right now, I haven’t seen comparative data from other coins in the same sector, so I can’t tell whether it’s a broad sector selloff or whether $RAM alone is under pressure.
My view is that the current negative funding rate may be building power for a potential rebound as shorts liquidate/close—but the prerequisite is that the price needs to stabilize. If the price keeps grinding lower, the funding rate could remain negative as well. So the key thing to watch is whether the divergence between price and funding can be corrected.
Trading tag: #BinanceFutures #TradFi #USDⓈM #RAM #RAMUSDT $RAM
The old dog scanned and found that this $RAM 24-hour line is pierced a bit deep; a -7.219% drop paired with a funding rate of -0.00114409 is a combination worth a closer look. The price is $12.21, daily trading volume is over $1.25 million, and open interest is 36,901.57—everything here is ready-made data.
From an angle that falls on the M4 mover, this looks more like a short-term liquidity anomaly. A negative funding rate means shorts are continuously paying longs, which is usually interpreted as bearish sentiment being dominant and positions being crowded. But the price is falling, creating a setup where the price is down while the funding rate is negative. This kind of divergence on short timeframes often suggests shorts have built up too many contrarian positions, making them prone to liquidation on a small rebound or changes in liquidity—what people commonly call a short squeeze. Right now, I haven’t seen comparative data from other coins in the same sector, so I can’t tell whether it’s a broad sector selloff or whether $RAM alone is under pressure.
My view is that the current negative funding rate may be building power for a potential rebound as shorts liquidate/close—but the prerequisite is that the price needs to stabilize. If the price keeps grinding lower, the funding rate could remain negative as well. So the key thing to watch is whether the divergence between price and funding can be corrected.
Trading tag: #BinanceFutures #TradFi #USDⓈM #RAM #RAMUSDT $RAM
From an angle that falls on the M4 mover, this looks more like a short-term liquidity anomaly. A negative funding rate means shorts are continuously paying longs, which is usually interpreted as bearish sentiment being dominant and positions being crowded. But the price is falling, creating a setup where the price is down while the funding rate is negative. This kind of divergence on short timeframes often suggests shorts have built up too many contrarian positions, making them prone to liquidation on a small rebound or changes in liquidity—what people commonly call a short squeeze. Right now, I haven’t seen comparative data from other coins in the same sector, so I can’t tell whether it’s a broad sector selloff or whether $RAM alone is under pressure.
My view is that the current negative funding rate may be building power for a potential rebound as shorts liquidate/close—but the prerequisite is that the price needs to stabilize. If the price keeps grinding lower, the funding rate could remain negative as well. So the key thing to watch is whether the divergence between price and funding can be corrected.
Trading tag: #BinanceFutures #TradFi #USDⓈM #RAM #RAMUSDT $RAM
44
Log in to explore more content
Join global crypto users on Binance Square
⚡️ Get latest and useful information about crypto.
💬 Trusted by the world’s largest crypto exchange.
👍 Discover real insights from verified creators.
Email / Phone number
Trending Topics
1
#BitcoinClears$85200
12,979 views
217 Discussing
2
#AltcoinSeasonIndexHoldsAbove60For5Days
62,865 views
1,198 Discussing
3
#USADPAdds90000JobsInSeptember
29,302 views
672 Discussing
4
#USCorePCEEasesTo3%InAugust
21,121 views
504 Discussing
5
#KospiPostsWorstQuarterSince2020
14,753 views
487 Discussing
6
#SECToClarifyOnChainFundraisingRules
36,006 views
660 Discussing
7
#UKFCAOpensCryptoFirmAuthorization
35,314 views
558 Discussing
8
#JapanMOFStudyGroupOnTokenizedGovtBonds
21,512 views
423 Discussing
9
#QNTRises287%
102,892 views
913 Discussing
10
#TrumpRejectsAIRulesForVoluntaryAudits
59,400 views
797 Discussing