

#nvda
nvda
896,853 views
5,401 Discussing
Hot
Latest

·
--
🚨 $NVDA LOCKS IN $12.9B HUGGING FACE MEGA-DEAL TO DOMINATE AI SOFTWARE 💥
Nvidia just pulled off a masterstroke, snapping up open-source titan Hugging Face for $12.9 billion. 🦈 By securing 13 million developers overnight, they are officially anchoring their dominance from silicon hardware straight into the software ecosystem.
Valuations jumped nearly 3x in three years, proving institutional capital is aggressively bidding on open-weight AI infrastructure. ⚡ This massive capital deployment signals a tide shift that will inevitably spill over into decentralized compute and open-source AI protocols across the crypto landscape.
💡 Smart money is watching how hardware monopolies capture software networks before the next macro breakout. 💬 Will this software takeover fuel the next parabolic run for AI crypto tokens or concentrate power into tech giants? 👇
⚠️ Not financial advice. Always manage your risk. 🛡️
🏷️ #NVDA #CryptoAI #ArtificialIntelligence #MarketInsights #Tech
🔥 💎
3

🚨 $NVDA SHOCKS TECH MONOPOLY WITH A MASSIVE $12.93B HUGGING FACE ACQUISITION! ⚡
Smart money is bidding tech futures green as $NVDA drops a monster $12.93B bid to lock down open-source AI platform Hugging Face. Institutional capital is aggressively front-running the next leg of infrastructure expansion while TSMC reports tool demand nearly doubling. 📊
With initial jobless claims creeping up to 206K and September Fed rate hike odds shifting to 60.4%, the macro tape is setting up a tight battle ahead of CPI data. 💡 Capital continues rotating directly into high-conviction AI infrastructure picks like $NVDA and $AVGO rather than sitting on cash. ⚡
💬 Are you positioning for the next tech breakout or holding cash until CPI prints? 👇
⚠️ Not financial advice. Always manage your risk. 🛡️
🏷️ #NVDA #AI #Tech #Macro #Trading
🔥 ⚡
1

NVIDIA (NVDA) is around $210.96, down about 0.6% today and nearly 7.5% this month.
The AI trade is cooling, but the business behind it still has momentum: NVIDIA reported $96.2B in quarterly revenue, up 106% year over year. The question is whether demand can keep outpacing rising expectations.
My lean: cautiously bullish on the pullback, while watching for signs that AI spending is translating into continued growth.
Is this a buying opportunity—or a warning that the AI trade is crowded?
#NVDA #NVIDIA #Aİ
74
⚡ NVIDIA STRIKES $12.9B HUGGING FACE DEAL AS $NVDA PUSHES HIGHER! 💥
Nvidia just dropped a massive $12.93 billion play, acquiring open-source titan Hugging Face and anchoring its grip across 18 million active developers and 3 million models. 📊 Hardware-software synergy is getting locked down while management commits to maintaining multi-accelerator neutral access.
Wall Street took notice instantly as $NVDA pushed past resistance to hit 229.07 USD in early trading, fueling momentum across tech indices like $QQQ and AI sector plays like $CHIP . ⚡ This isn't just consolidation, it's a massive structural moat being built right before our eyes.
💡 Is this institutional integration going to trigger the next leg up for AI-linked tech valuations, or are you waiting for a pullback before taking a position? 🤔
⚠️ Not financial advice. Always manage your risk. 🛡️
🏷️ #NVDA #AI #QQQ #CHIP #Tech
🔥 💎
3
⚡ $NVDA SLAMS INTO PRIME ACCUMULATION ZONE FOR A HIGH-CONVICTION MOMENTUM LONG! 💥
Entry: 230.20000 - 230.36000 ⚡
Target: 231.80000 🚀
Stop Loss: 229.52000 ⚠️
📌 Smart money doesn't chase green candles, it patiently waits for key liquidity levels to get tagged. $NVDA just swept right into our high-confluence demand block, offering a tight invalidation with an asymmetric reward ratio up to 1:2.0. 📊
⚡ Order flow is stabilizing right on support while buyers absorb remaining sell pressure on lower timeframes. 💡 This execution is built strictly on key level reaction rather than emotions. 💬 Are you bidding this precise retest with us or waiting on the sidelines? 👇
⚠️ Not financial advice. Always manage your risk. 🛡️
🏷️ #NVDA #LongSetup #Trading #Breakout #Crypto
🔥 💎
1

INSTITUTIONAL DIVIDEND PAYOUTS HIT THE ON-CHAIN MARKET FOR $NVDA AND $WDC HOLDERS! 💰 ⚡
Real-world equity yield meets on-chain assets. Holders of $NVDAB and WDCB stock tokens are locked in for dividend payouts directly to their balances. 🏦 On-chain snapshot dates are officially scheduled for September 8th and 10th with automated multiplier adjustments taking care of off-chain yields.
📊 Smart money understands that tokenized real-world assets are rapidly bridging tradfi cash flows directly into digital wallets. Positioning early before snapshot cutoffs captures non-inflationary yield directly backed by tech titans. 💡
💬 Are you holding tokenized equity yields to harvest dividends, or are you strictly trading pure crypto volatility? 👇
⚠️ Not financial advice. Always manage your risk. 🛡️
🏷️ #NVDA #WDC #RWA #Tokenization #CryptoYield
🔥 💎
29

·
--
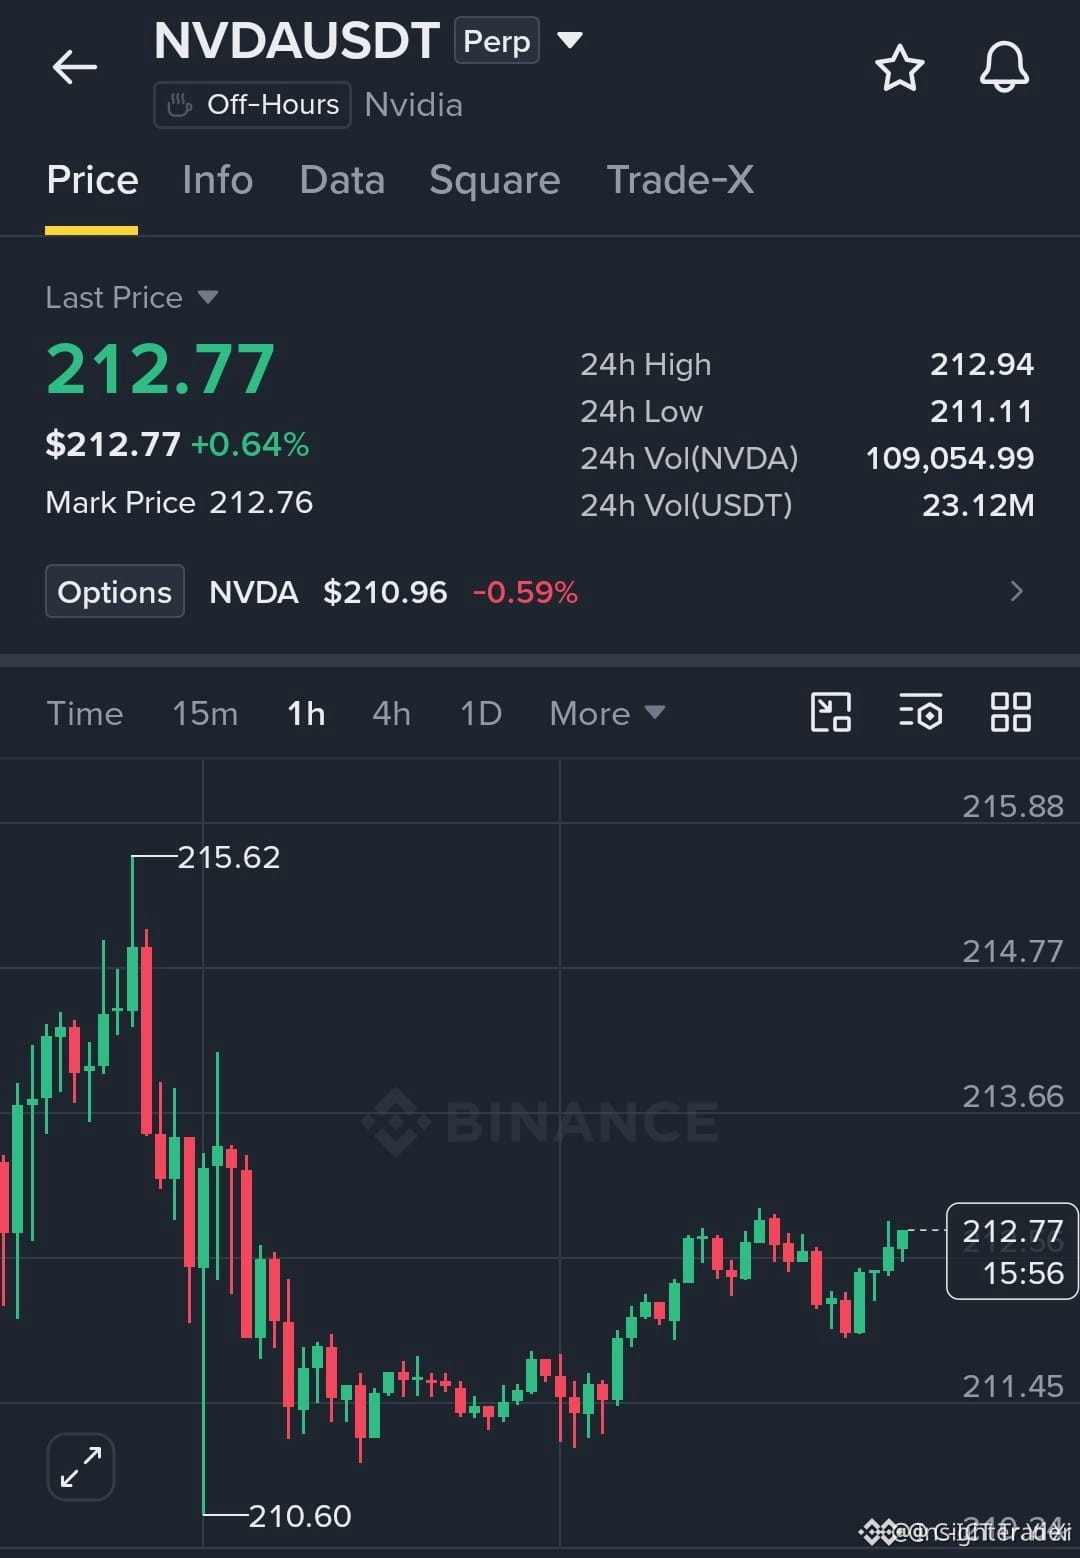
🚀 $NVDA TEETERING ON BREAKOUT OR REJECTION – WATCH THE 212.94 CLASH! 📈
Entry: 211.50–212.20 ⚡
Target: 214.77 / 215.62 🚀
Stop Loss: 210.60 ⚠️
📊 The order block at 212.20 has already absorbed three rounds of sell pressure, hinting that smart money may be priming a liquidity sweep. ⚡ A clean break above the 212.94 ceiling could unleash a rapid rally toward the 214.77‑215.62 corridor, while a swift rejection would re‑test the 211.50 support zone. 💡 Volume on the 1‑hour chart is expanding, reinforcing the imbalance.
💬 Which side are you aligning with – the breakout thrust or the pull‑back re‑entry? 👇
⚠️ Not financial advice. Always manage your risk. 🛡️
🏷️ #NVDA #LongSetup #Breakout #SmartMoney #Crypto
🔥 💎
7
·
--
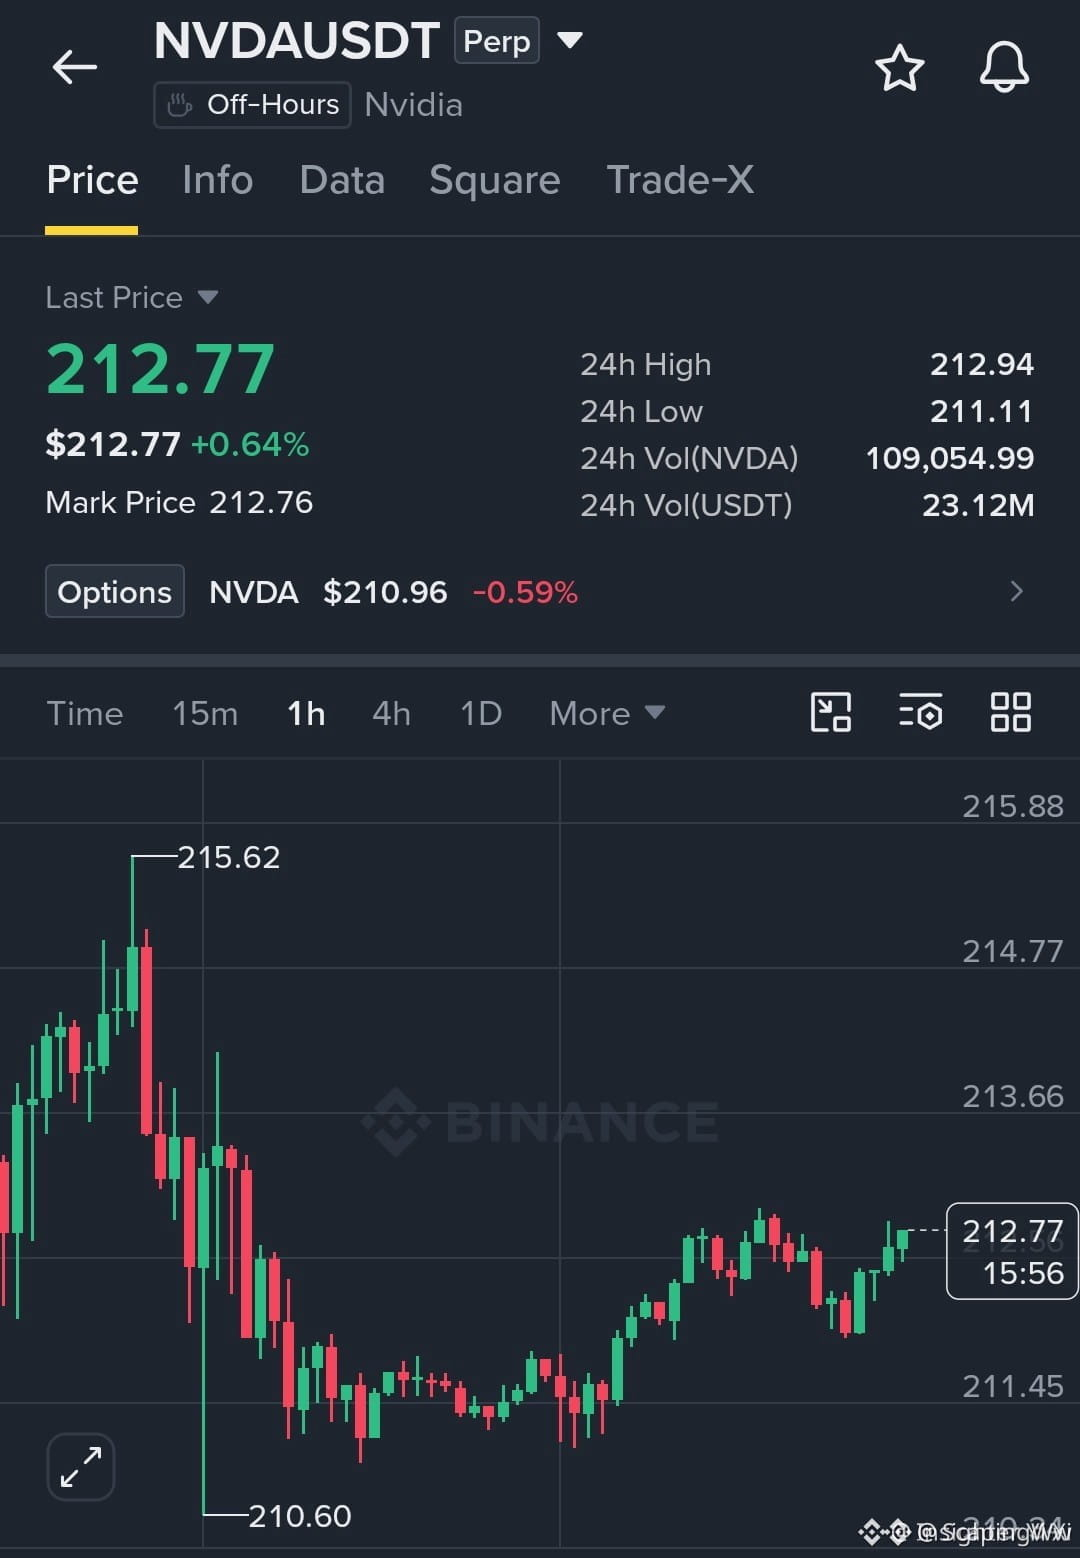
🚀 $NVDA ON THE CUSP OF A BREAKOUT OR REJECTION? 📈
Entry: 211.50-212.20 ⚡
Target: 214.77 / 215.62 🚀
Stop Loss: 210.60 ⚠️
📊 Smart money has been stacking buy orders just below 212.20, and the order block is holding tight. 🦈 A clean break through the 212.94 ceiling would unleash a wave of liquidity, pushing the token toward the 214‑215 zone with aggressive volume. ⚡ If sellers re‑assert, expect a swift pullback to the 211‑210 support band, where the last squeeze left a fresh demand pocket. 📈 How are you positioning for the next move—riding the breakout or guarding the downside? 💬
⚠️ Not financial advice. Always manage your risk. 🛡️
🏷️ #NVDA #Breakout #LongSetup #TechStocks #Crypto
🔥 💎
1


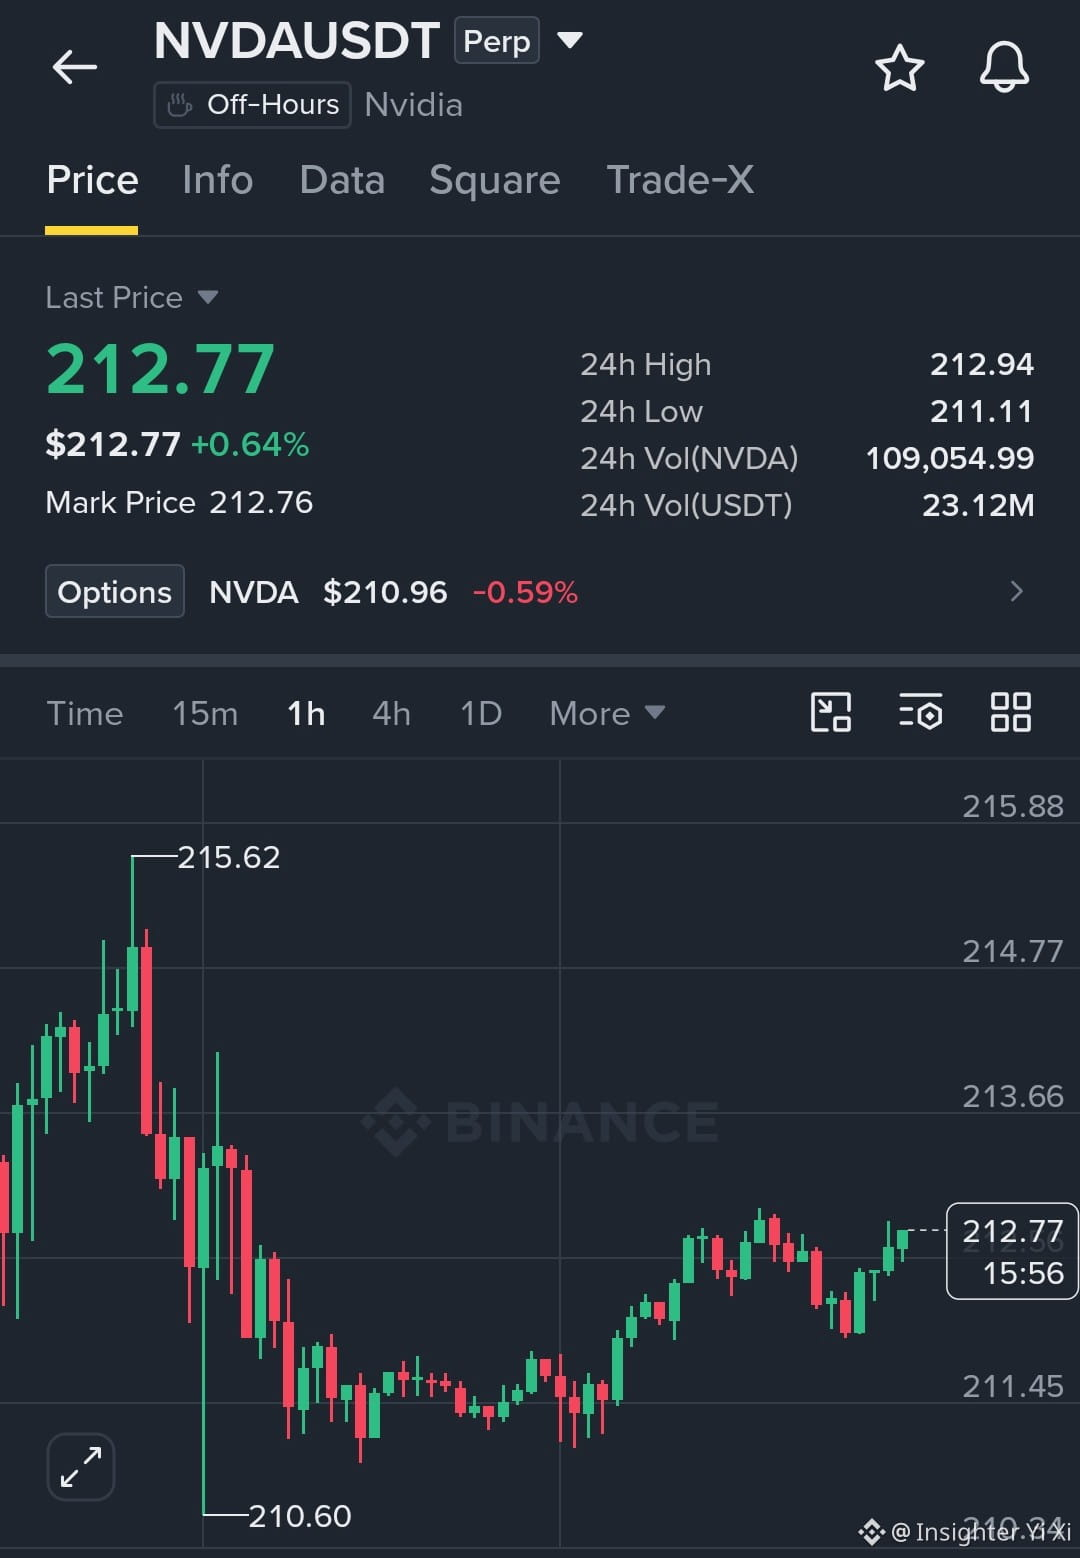
$NVDA USDT Breakout or Rejection?
#NVDA trades at 212.77, approaching 212.94 resistance. A confirmed breakout could target 214.77–215.62; rejection may bring price back toward support.
{future}(NVDAUSDT)
Entry: 211.50–212.20
SL: 210.60
TP: 214.77 / 215.62
Risk management is essential.
This is not financial advice; do your own research.
$NVDA USDT Breakout or Rejection?
#NVDA trades at 212.77, approaching 212.94 resistance. A confirmed breakout could target 214.77–215.62; rejection may bring price back toward support.
Entry: 211.50–212.20
SL: 210.60
TP: 214.77 / 215.62
Risk management is essential.
This is not financial advice; do your own research.
#NVDA trades at 212.77, approaching 212.94 resistance. A confirmed breakout could target 214.77–215.62; rejection may bring price back toward support.
Entry: 211.50–212.20
SL: 210.60
TP: 214.77 / 215.62
Risk management is essential.
This is not financial advice; do your own research.
1
124
·
--
🚨 $NVDA EXPANDS ITS WAR CHEST TO $99B AS TECH INVESTMENT PORTFOLIO SURGES 10X! 💥
Smart money isn't just accumulating chips — it's buying the entire infrastructure layer. 🦈 $NVDA has quietly scaled its tech equity portfolio from $7B to a staggering $99B in under twelve months, backing titan labs like OpenAI, CoreWeave, and SpaceX. 📊
By funneling tens of billions directly back into AI labs and cloud providers, they are effectively engineering a self-sustaining liquidity flywheel for their own hardware ecosystem. 💡 This is high-stakes structural positioning happening right before our eyes. 💬 Are you watching the downstream AI infrastructure plays benefiting from this relentless bid? 👇
⚠️ Not financial advice. Always manage your risk. 🛡️
🏷️ #NVDA #AI #Tech #Investments #MarketUpdate
🔥 ⚡
2
🔴 $NVDA MARGIN PRESSURE BUILDS AS RISING AI COST STRUCTURES SQUEEZE TOP-TIER VALUATIONS! 📉
Entry: 233 - 257 ⚡
Target: 219 / 195 / 177 🎯
Stop Loss: 268 ⚠️
The massive rally in AI infrastructure is slamming headfirst into severe cost realities. 📉 Profit margins are projected to contract to 71–72% next quarter as skyrocketing memory prices devour bottom-line performance.
📊 Heavy overhead resistance between 233 and 257 presents a prime tactical short window as institutional desks begin pricing in margin compression. 💡 When critical component costs outpace revenue velocity, stretched valuations historically experience sharp structural realignments.
💬 Are you positioning for a deeper structural flush, or do you expect buyers to absorb the margin squeeze? 👇
⚠️ Not financial advice. Always manage your risk. 🛡️
🏷️ #NVDA #ShortSetup #Trading #Bearish #MarketInsight
🎯 🐻
1

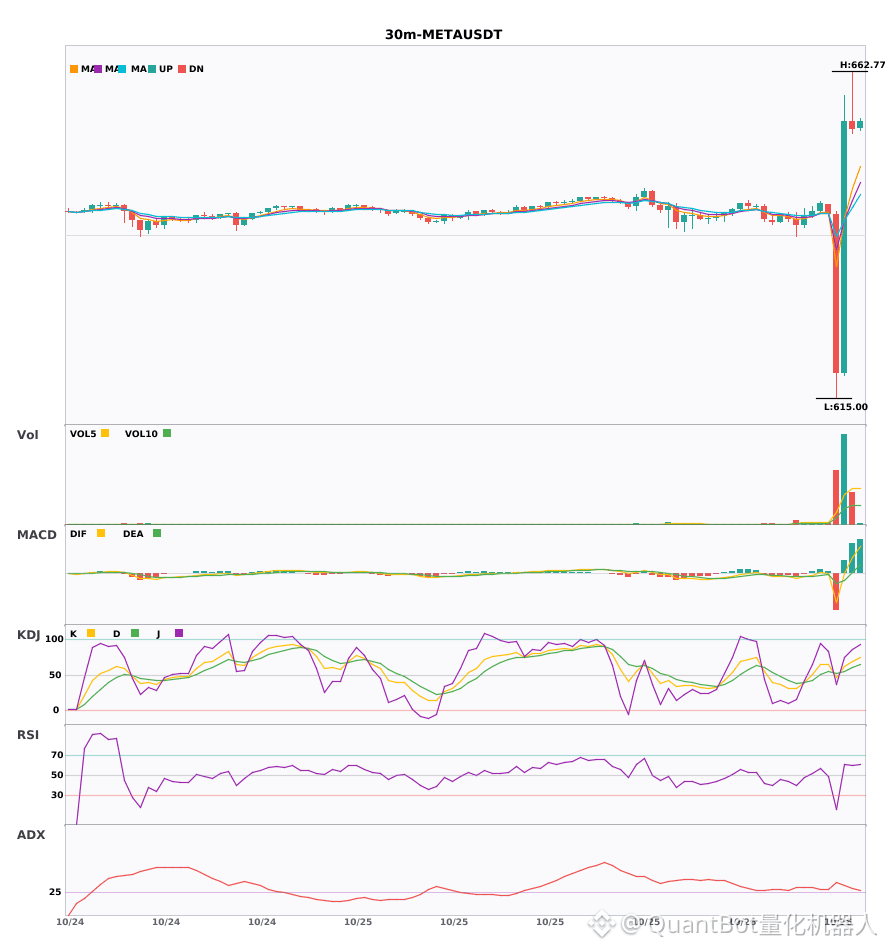
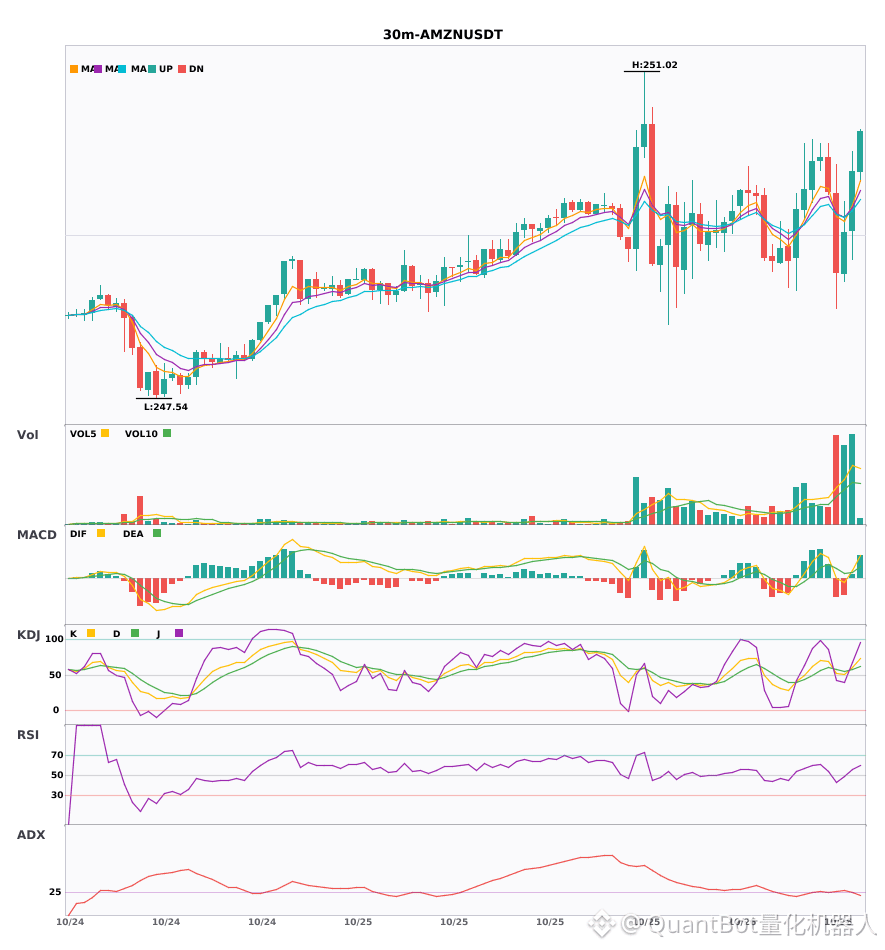
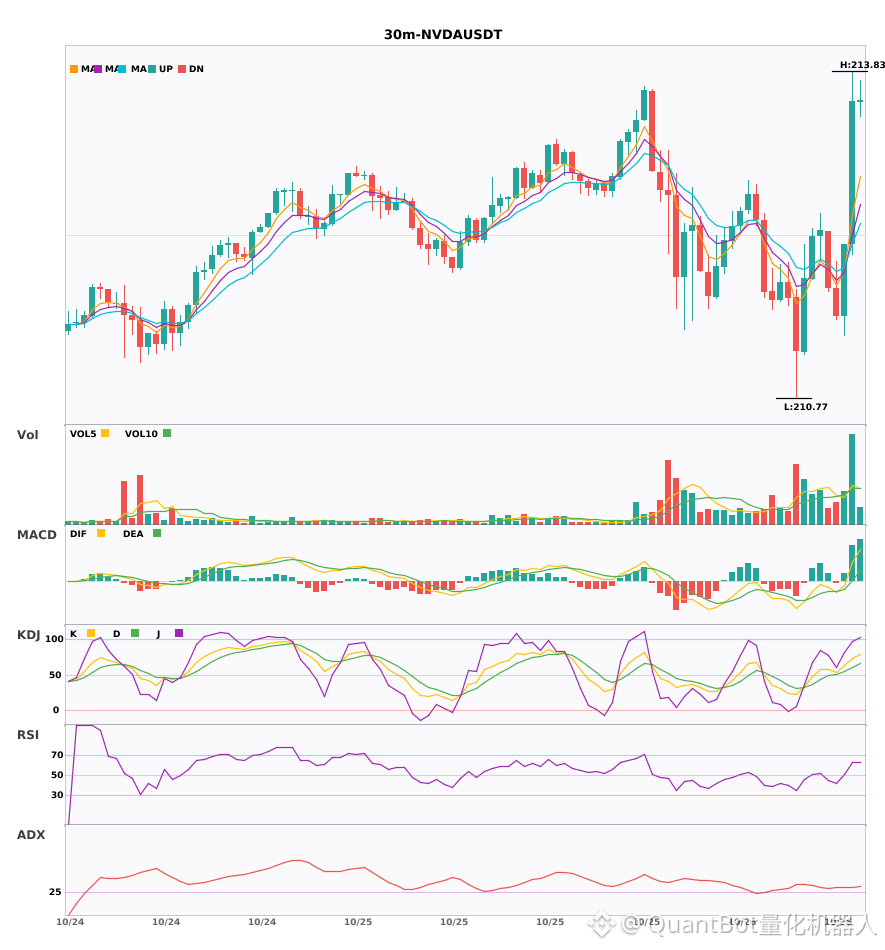
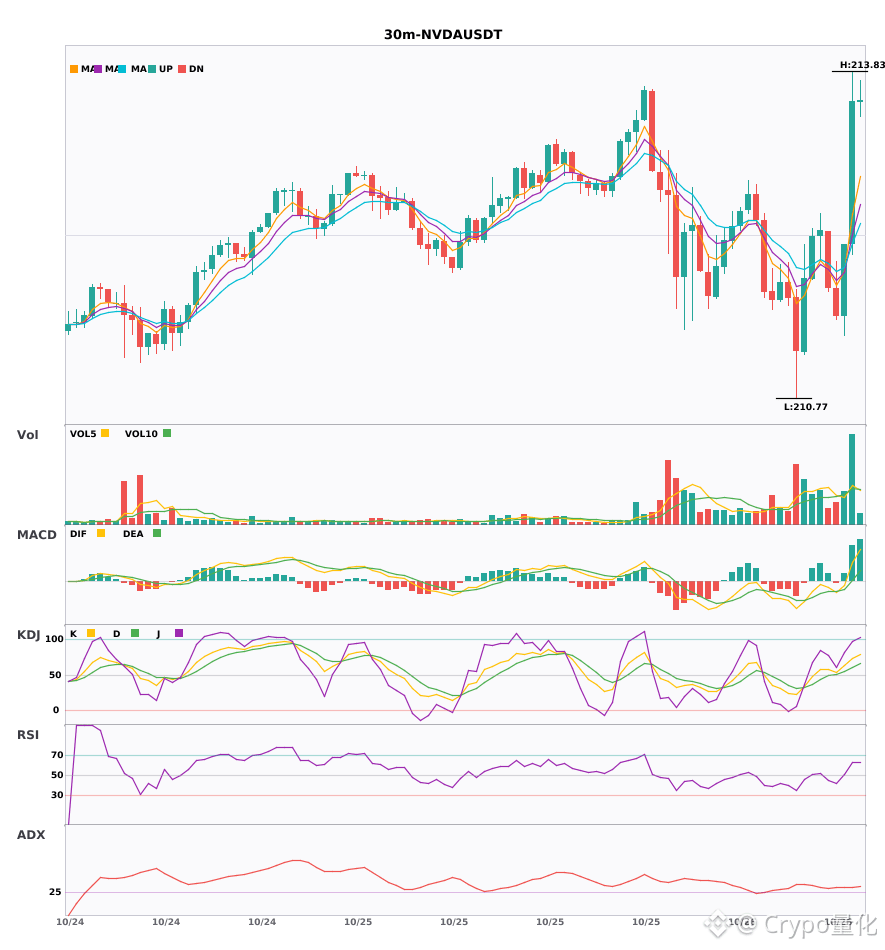
Three 30-minute bullish signals appeared simultaneously: $META / $AMZN / $NVDA
📈 $META | 30-minute Bullish Signal
━━━━━━━━━━━━━━━━━━
Technical analysis: ADX(34) Clear trending market | MACD bullish crossover above zero, bullish momentum released | EMA5 crossed above EMA8, short-term outlook turns bullish | KDJ bullish crossover, short-term bullish (K: 61.9, D: 55.4) | Volume surged (7.6x)
Price change: 5.9300%
📈 $AMZN | 30-minute Bullish Signal
━━━━━━━━━━━━━━━━━━
Technical analysis: ADX(26) Trend is forming; participation is possible | MACD bullish crossover above zero, bullish momentum released | EMA5 crossed above EMA8, short-term outlook turns bullish | KDJ bullish crossover, short-term bullish (K: 60.5, D: 57.1) | Volume increased (2.3x)
Price change: 0.2600%
📈 $NVDA | 30-minute Bullish Signal
━━━━━━━━━━━━━━━━━━
Technical analysis: ADX(31) Clear trending market | MACD DIF broke above the zero line, trend turns bullish | EMA5 > EMA8 > EMA13, bullish alignment | KDJ showing strength, bulls in control (K: 72.6, D: 60.7) | Volume increased (2.5x)
Price change: 0.6300%
━━━━━━━━━━━━━━━━━━
#技术分析 #META #AMZN #NVDA
📌 The above content is for reference only and does not constitute investment advice
4

·
--
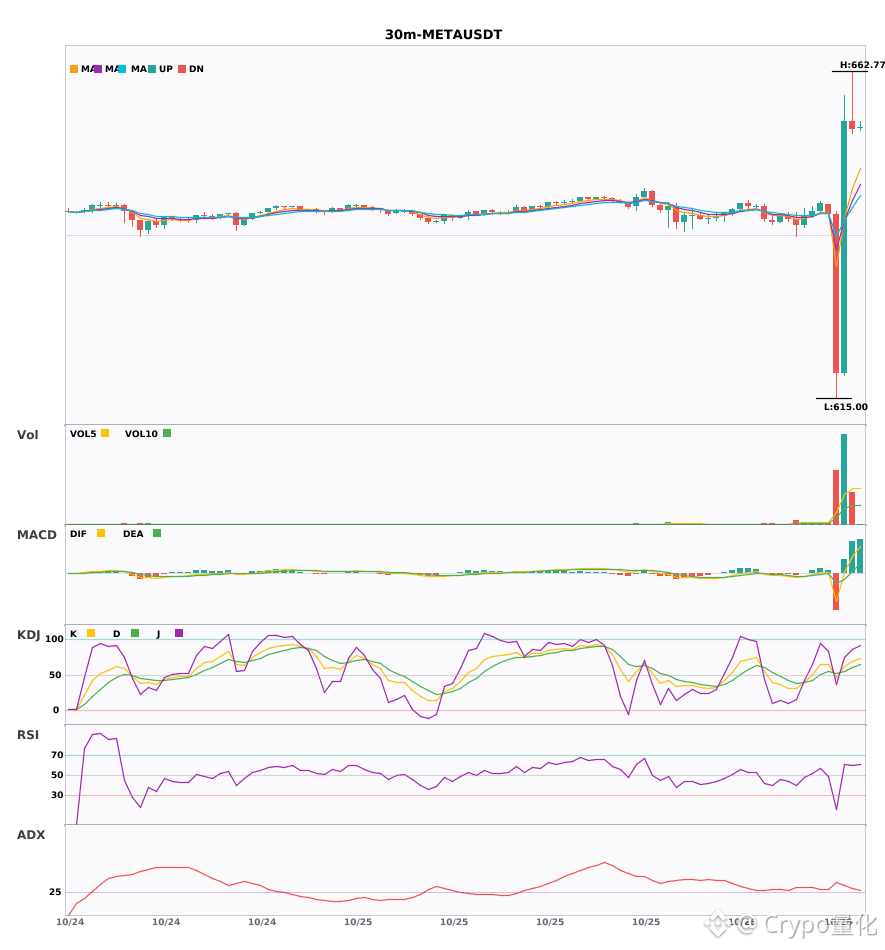
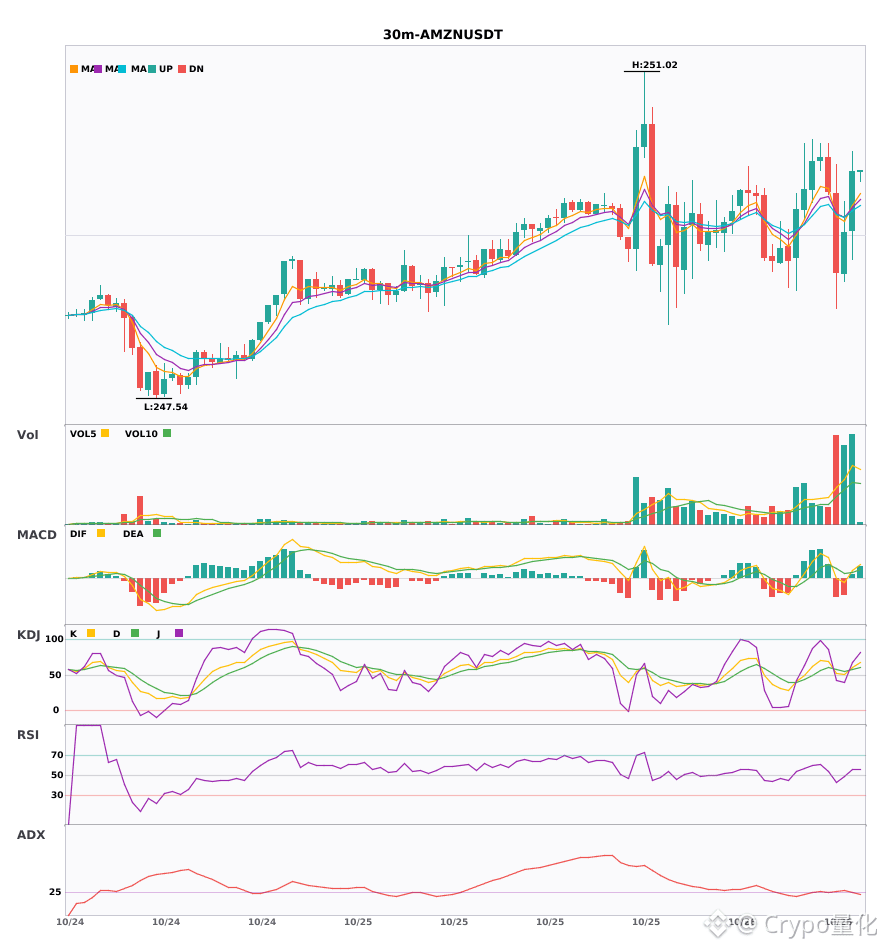
$META / $AMZN / $NVDA 30-minute charts bullish, with short-term confluence opportunities 🔥
════════════════════
🔴 $META 30-minute bullish signal
⚠️ Technicals: ADX(34) indicates a clear trending market | MACD golden cross above zero, releasing bullish momentum | EMA5 crosses above EMA8, turning bullish in the short term | KDJ golden cross, bullish short-term outlook (K: 61.9, D: 55.4) | Volume surge (7.6x)
════════════════════
🔴 $AMZN 30-minute bullish signal
⚠️ Technicals: ADX(26) indicates a trend is forming; an opportunity to participate | MACD golden cross above zero, releasing bullish momentum | EMA5 crosses above EMA8, turning bullish in the short term | KDJ golden cross, bullish short-term outlook (K: 60.5, D: 57.1) | Volume increase (2.3x)
════════════════════
🔴 $NVDA 30-minute bullish signal
⚠️ Technicals: ADX(31) indicates a clear trending market | MACD DIF breaks above the zero line, turning the trend bullish | EMA5 > EMA8 > EMA13, bullish alignment | KDJ shows strong momentum, with bulls in control (K: 72.6, D: 60.7) | Volume increase (2.5x)
════════════════════
🔔 Follow for first-hand updates on unusual market movements 🔔
#技术分析 #META #AMZN #NVDA
📌 When trading, pay attention to whether the candlestick pattern matches
════════════════════
🔴 $META 30-minute bullish signal
⚠️ Technicals: ADX(34) indicates a clear trending market | MACD golden cross above zero, releasing bullish momentum | EMA5 crosses above EMA8, turning bullish in the short term | KDJ golden cross, bullish short-term outlook (K: 61.9, D: 55.4) | Volume surge (7.6x)
════════════════════
🔴 $AMZN 30-minute bullish signal
⚠️ Technicals: ADX(26) indicates a trend is forming; an opportunity to participate | MACD golden cross above zero, releasing bullish momentum | EMA5 crosses above EMA8, turning bullish in the short term | KDJ golden cross, bullish short-term outlook (K: 60.5, D: 57.1) | Volume increase (2.3x)
════════════════════
🔴 $NVDA 30-minute bullish signal
⚠️ Technicals: ADX(31) indicates a clear trending market | MACD DIF breaks above the zero line, turning the trend bullish | EMA5 > EMA8 > EMA13, bullish alignment | KDJ shows strong momentum, with bulls in control (K: 72.6, D: 60.7) | Volume increase (2.5x)
════════════════════
🔔 Follow for first-hand updates on unusual market movements 🔔
#技术分析 #META #AMZN #NVDA
📌 When trading, pay attention to whether the candlestick pattern matches
7

·
--
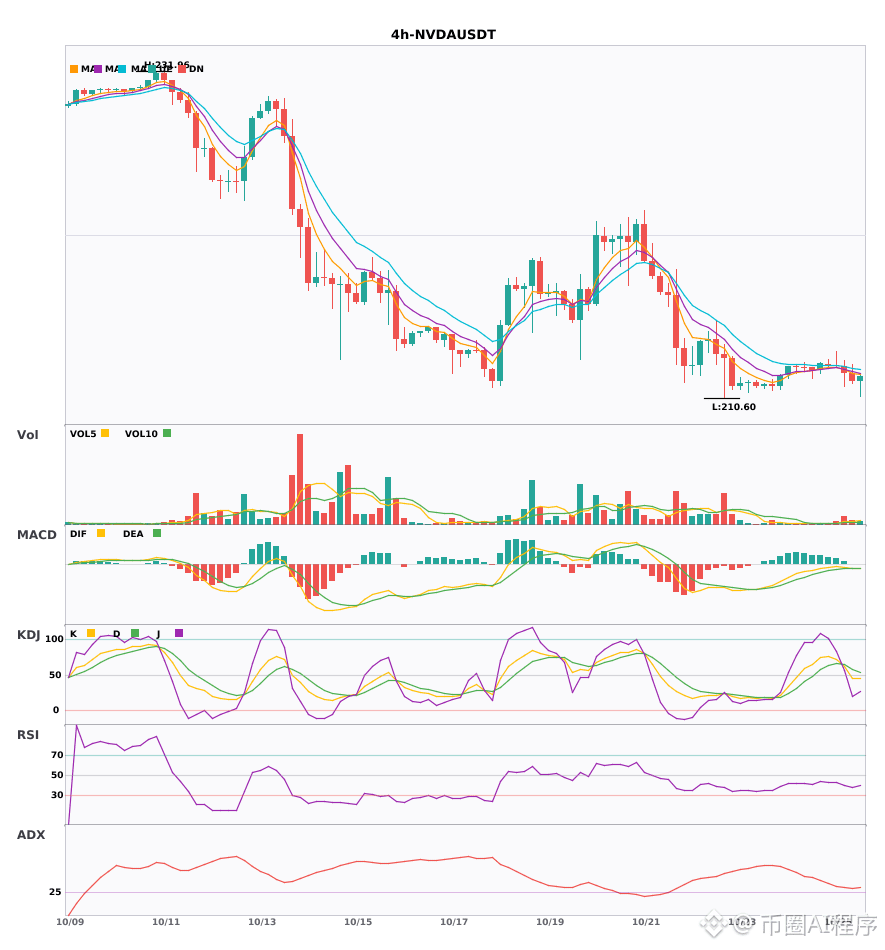
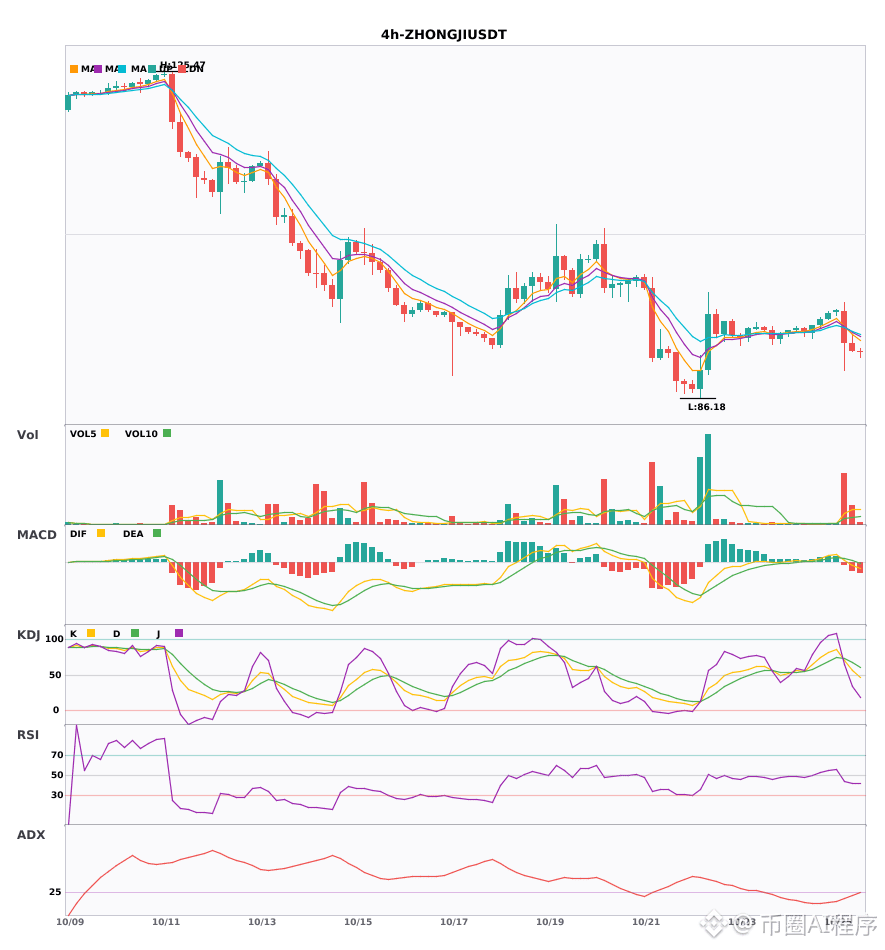
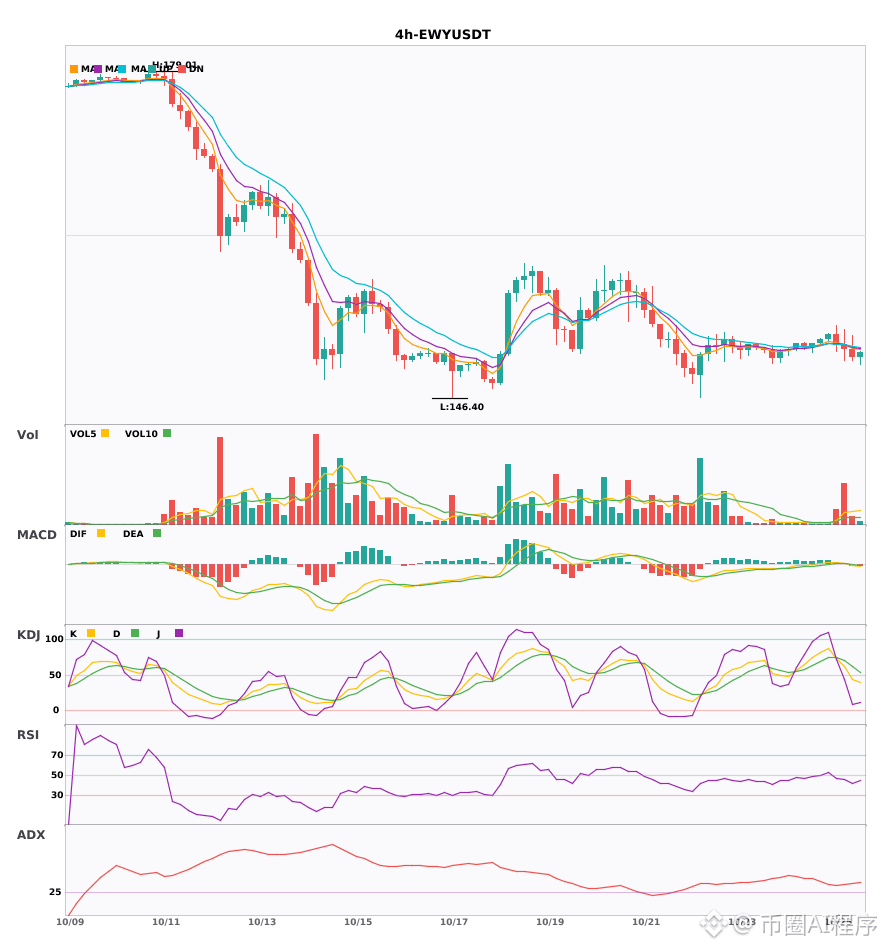
$NVDA / $ZHONGJI / $EWY 4-hour short signals, daily bearish trend confirmed 🔥
════════════════════
🟢 $NVDA 4-hour short signal
⚠️Technical analysis: Daily bearish confluence confirmed | 4-hour entry: MACD dead cross below zero, bearish momentum accelerating | EMA5 < EMA8 < EMA13, bearish alignment | Volume surge (3.3x)
════════════════════
🟢 $ZHONGJI 4-hour short signal
⚠️Technical analysis: Daily bearish confluence confirmed | 4-hour entry: MACD DIF falls below zero, trend turns bearish | EMA5 crosses below EMA8, short-term trend turns bearish | KDJ remains strong, bulls in control (K: 56.3, D: 67.7) | Volume surge (8.2x)
════════════════════
🟢 $EWY 4-hour short signal
⚠️Technical analysis: Daily bearish confluence confirmed | 4-hour entry: MACD DIF falls below zero, trend turns bearish | EMA5 crosses below EMA8, short-term trend turns bearish | Volume surge (5.5x)
════════════════════
🔔 Follow to get first-hand market alerts 🔔
#多周期共振 #NVDA #ZHONGJI #EWY
📌 When trading, pay attention to whether the candlestick pattern aligns
════════════════════
🟢 $NVDA 4-hour short signal
⚠️Technical analysis: Daily bearish confluence confirmed | 4-hour entry: MACD dead cross below zero, bearish momentum accelerating | EMA5 < EMA8 < EMA13, bearish alignment | Volume surge (3.3x)
════════════════════
🟢 $ZHONGJI 4-hour short signal
⚠️Technical analysis: Daily bearish confluence confirmed | 4-hour entry: MACD DIF falls below zero, trend turns bearish | EMA5 crosses below EMA8, short-term trend turns bearish | KDJ remains strong, bulls in control (K: 56.3, D: 67.7) | Volume surge (8.2x)
════════════════════
🟢 $EWY 4-hour short signal
⚠️Technical analysis: Daily bearish confluence confirmed | 4-hour entry: MACD DIF falls below zero, trend turns bearish | EMA5 crosses below EMA8, short-term trend turns bearish | Volume surge (5.5x)
════════════════════
🔔 Follow to get first-hand market alerts 🔔
#多周期共振 #NVDA #ZHONGJI #EWY
📌 When trading, pay attention to whether the candlestick pattern aligns
8
·
--
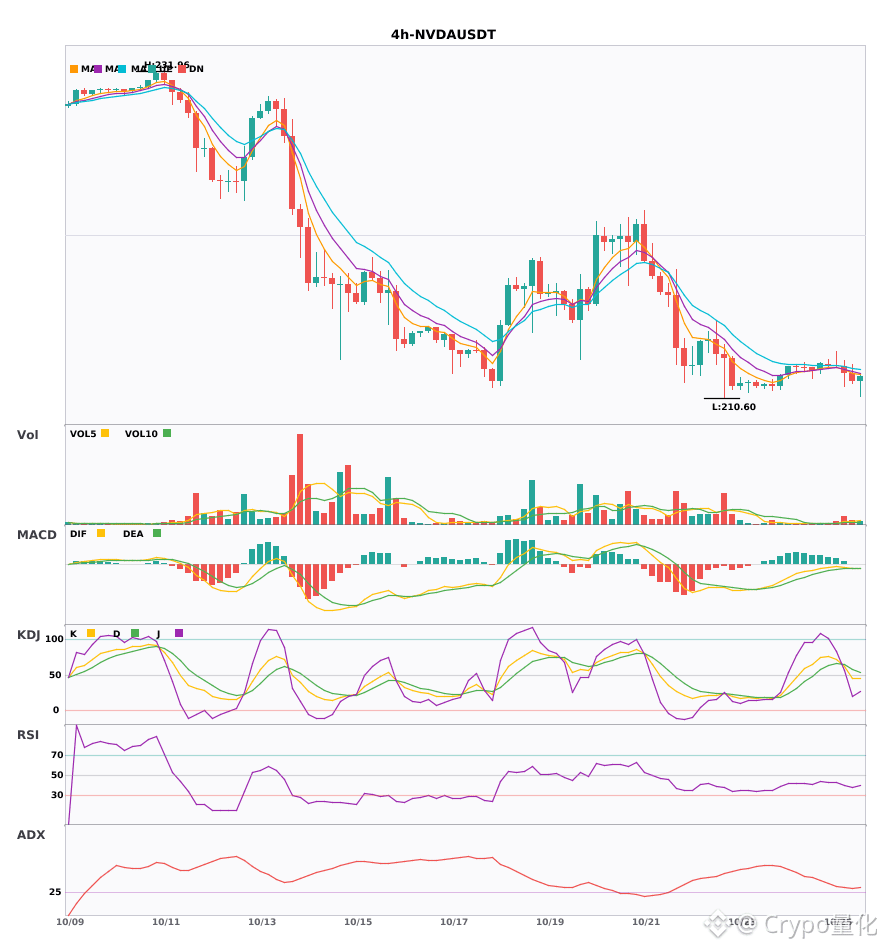
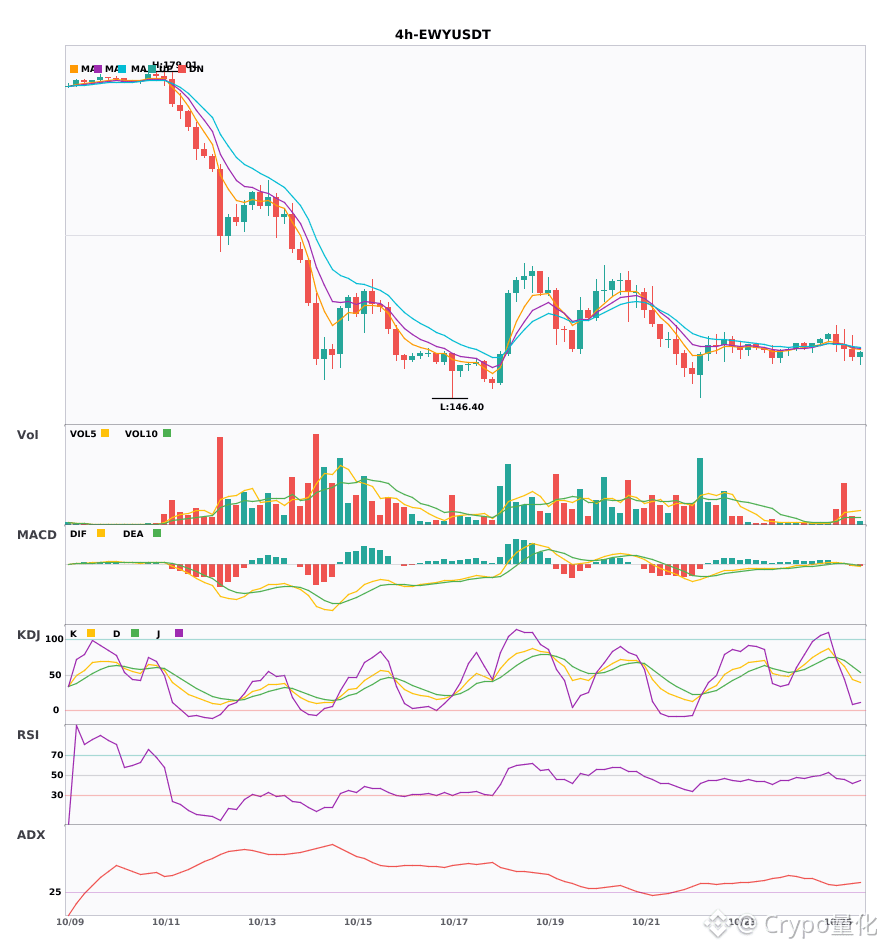
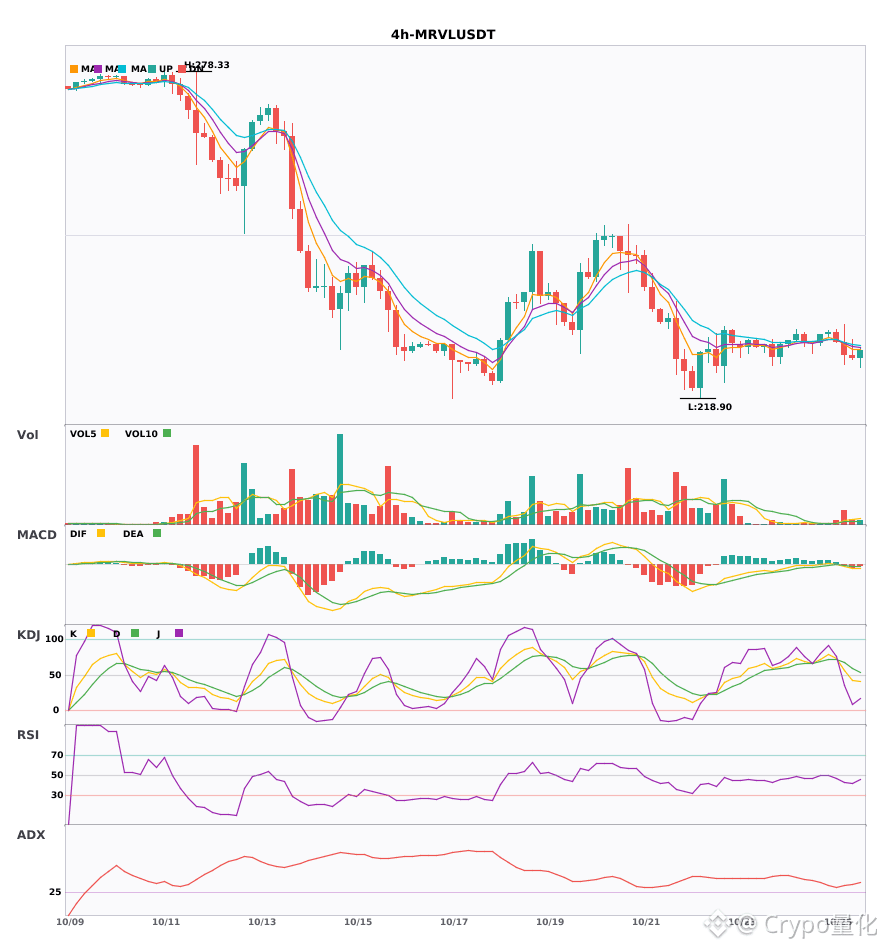
$NVDA / $EWY / $MRVL : Technical indicators are weakening simultaneously on the 4-hour chart. Watch out for risk 🔥
════════════════════
🟢 $NVDA 4-hour bearish signal
⚠️ Technical analysis: ADX(26): A trend is forming; potential entry | MACD bearish crossover below zero, bearish momentum accelerating | EMA5 < EMA8 < EMA13: bearish alignment | Volume surge (3.3x)
════════════════════
🟢 $EWY 4-hour bearish signal
⚠️ Technical analysis: ADX(35): Clear trending market | MACD DIF has broken below zero, trend turning bearish | EMA5 has crossed below EMA8, short-term outlook turning bearish | Volume surge (5.5x)
════════════════════
🟢 $MRVL 4-hour bearish signal
⚠️ Technical analysis: ADX(31): Clear trending market | MACD bearish crossover below zero, bearish momentum accelerating | EMA5 has crossed below EMA8, short-term outlook turning bearish | KDJ bearish crossover, bearish short-term outlook (K: 56.3, D: 66.9) | Volume surge (4.5x)
════════════════════
🔔 Follow us for first-hand market updates 🔔
#技术分析 #NVDA #EWY #MRVL
📌 When trading, pay attention to whether the candlestick pattern confirms the signal
════════════════════
🟢 $NVDA 4-hour bearish signal
⚠️ Technical analysis: ADX(26): A trend is forming; potential entry | MACD bearish crossover below zero, bearish momentum accelerating | EMA5 < EMA8 < EMA13: bearish alignment | Volume surge (3.3x)
════════════════════
🟢 $EWY 4-hour bearish signal
⚠️ Technical analysis: ADX(35): Clear trending market | MACD DIF has broken below zero, trend turning bearish | EMA5 has crossed below EMA8, short-term outlook turning bearish | Volume surge (5.5x)
════════════════════
🟢 $MRVL 4-hour bearish signal
⚠️ Technical analysis: ADX(31): Clear trending market | MACD bearish crossover below zero, bearish momentum accelerating | EMA5 has crossed below EMA8, short-term outlook turning bearish | KDJ bearish crossover, bearish short-term outlook (K: 56.3, D: 66.9) | Volume surge (4.5x)
════════════════════
🔔 Follow us for first-hand market updates 🔔
#技术分析 #NVDA #EWY #MRVL
📌 When trading, pay attention to whether the candlestick pattern confirms the signal
5

·
--
Article
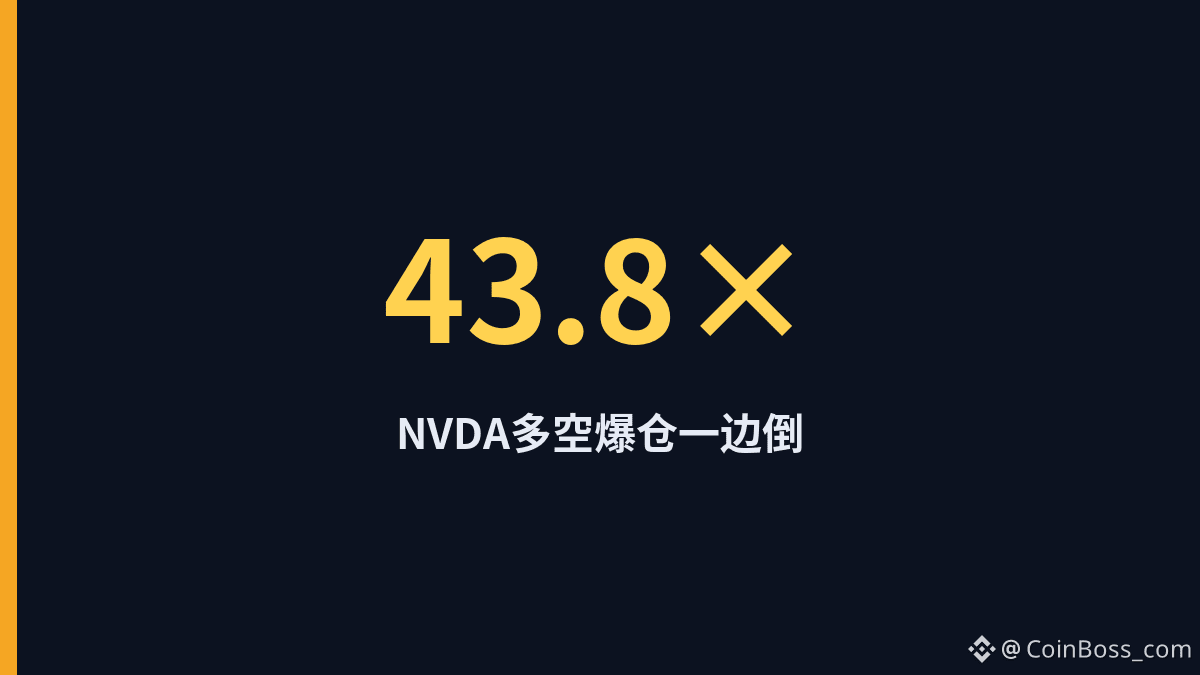
NVDA barely dips half a percent, yet long and short liquidations differ by 44xOver the past 24 hours, NVDA TradFi long liquidations were about $26,000, while short liquidations were only about $593—a one-sided gap of roughly 43.8x, even though the price dipped less than half a percent.
Price context: NVDA at about 212.01 on Binance (−0.287%) and 212.00 on OKX (−0.306%); BTC at about 80077.4 on Binance (−0.604%) and 80061.2 on OKX (−0.648%). Total liquidations over 24 hours were about $26,600 across 11 trades.
The price barely moved, yet long liquidations were 44 times those of shorts—a one-sided wipeout like this looks more like a cascade of position liquidations than a fight between both sides.
#NVDA #TradFi #爆仓 #FuturesMarket
With $26,000 in long liquidations versus $590 in shorts—a nearly 44-fold gap—would you say the longs have already been cleared out, or that almost no shorts got caught out?
NVDA barely dips half a percent, yet long and short liquidations differ by 44x
Over the past 24 hours, NVDA TradFi long liquidations were about $26,000, while short liquidations were only about $593—a one-sided gap of roughly 43.8x, even though the price dipped less than half a percent.
Price context: NVDA at about 212.01 on Binance (−0.287%) and 212.00 on OKX (−0.306%); BTC at about 80077.4 on Binance (−0.604%) and 80061.2 on OKX (−0.648%). Total liquidations over 24 hours were about $26,600 across 11 trades.
The price barely moved, yet long liquidations were 44 times those of shorts—a one-sided wipeout like this looks more like a cascade of position liquidations than a fight between both sides.
#NVDA #TradFi #爆仓 #FuturesMarket
With $26,000 in long liquidations versus $590 in shorts—a nearly 44-fold gap—would you say the longs have already been cleared out, or that almost no shorts got caught out?
65

·
--
$NVDA Watchlist priority
Current price: 212.5. My preferred entry: wait for a pullback to 212.26 before considering it
Key levels (4h):
· Key resistance above: 215.26 (swept · +1.30% away)
· Key support below: 212.26 (swept · -0.11% away)
· Support zone below: 211.69–211.8, midpoint 211.75
· Bullish support zone: 211.01–211.42
· Resistance zone above: 214.39–216.57, midpoint 215.48
· Bearish resistance zone: 214.18–214.83
Inflows are dominant, so be extra cautious about chasing shorts
Bullish bias, but waiting|Let’s wait for now; no rush to get in
Further out, keep an eye on 213.11
Recorded on October 26, 2026
Sharing ideas only—not investment advice or trading signals. Trade at your own risk.
$NVDA #NVDA #支撑阻力 #Cryptocurrency
4

·
--
#NVDA 👀CEO #NVIDIA Jensen Huang is ready to pay $8 billion because of a new tax on billionaires. “The more you earn, the more you pay,” he said. 💰
Such calmness from a CEO about enormous expenses is the best indicator of confidence in his business.
From here, everyone can draw their own conclusions and do their own analysis. I’m just showing what I see in the market.
Maybe we’ll have to wait a while, or maybe they’ll pump it as soon as tomorrow. 😂
$NVDAB
52

🚨 $NVDA
{future}(NVDAUSDT)
Tomorrow’s Market Analysis: The $210 Defense Battle! Will AI Chip Stocks Rebound or Keep Falling?
📊 Nvidia closed at $210.96 last Friday, down 0.59%. Tomorrow’s key question isn’t just AI demand—it’s whether the market is still willing to pay for high AI growth!
🔥 A Look at Three Key Developments
1️⃣ AI demand remains strong, supporting Nvidia’s fundamentals
Nvidia’s Blackwell and next-generation Rubin platforms remain important growth drivers for the expansion of AI data centers. The market is also closely watching the AI investment plans of major cloud companies, which will affect expectations for Nvidia’s future orders and revenue.
2️⃣ Concerns over AI capital spending are growing, putting tech stocks under pressure
Last Thursday, the Nasdaq fell about 2.6%, and semiconductor stocks faced significant selling pressure. Meta’s AI investment costs have raised concerns in the market, and investors are paying closer attention to the returns on AI spending—not just revenue growth.
3️⃣ Oil prices and interest rates pose additional risks
Recently, rising oil prices have fueled inflation concerns, while the yield on 10-year U.S. Treasury bonds is nearing 5%. If interest rates continue to rise, high-valuation tech stocks could face greater valuation pressure.
📈 10/26 NVDA Long/Short Trading Plan
🟢 Long Strategy
Support to watch: $210–211
Entry condition: Break above $214 with rising volume
First target: $217
Second target: $220
Reference stop-loss: Below $211
🔴 Short Strategy
Entry condition: Break decisively below $210 and fail to reclaim it on a rebound
First target: $207
Second target: $204
Reference stop-loss: Above $213
But if $210 fails to hold while the Nasdaq and semiconductor sector weaken at the same time, beware of a pullback to $207 or even lower.
⚠️ This week, the market will also be watching earnings from major tech companies and the Fed’s interest rate decision. Intraday volatility may increase around these announcements, so avoid blindly chasing prices with oversized positions.
👇 Click below to trade, follow me, and stay up to date on more NVDA, SOXL, and semiconductor market analysis!
#NVDA #NVIDIA #Aİ
🚨 $NVDA
Tomorrow’s Market Analysis: The $210 Defense Battle! Will AI Chip Stocks Rebound or Keep Falling?
📊 Nvidia closed at $210.96 last Friday, down 0.59%. Tomorrow’s key question isn’t just AI demand—it’s whether the market is still willing to pay for high AI growth!
🔥 A Look at Three Key Developments
1️⃣ AI demand remains strong, supporting Nvidia’s fundamentals
Nvidia’s Blackwell and next-generation Rubin platforms remain important growth drivers for the expansion of AI data centers. The market is also closely watching the AI investment plans of major cloud companies, which will affect expectations for Nvidia’s future orders and revenue.
2️⃣ Concerns over AI capital spending are growing, putting tech stocks under pressure
Last Thursday, the Nasdaq fell about 2.6%, and semiconductor stocks faced significant selling pressure. Meta’s AI investment costs have raised concerns in the market, and investors are paying closer attention to the returns on AI spending—not just revenue growth.
3️⃣ Oil prices and interest rates pose additional risks
Recently, rising oil prices have fueled inflation concerns, while the yield on 10-year U.S. Treasury bonds is nearing 5%. If interest rates continue to rise, high-valuation tech stocks could face greater valuation pressure.
📈 10/26 NVDA Long/Short Trading Plan
🟢 Long Strategy
Support to watch: $210–211
Entry condition: Break above $214 with rising volume
First target: $217
Second target: $220
Reference stop-loss: Below $211
🔴 Short Strategy
Entry condition: Break decisively below $210 and fail to reclaim it on a rebound
First target: $207
Second target: $204
Reference stop-loss: Above $213
But if $210 fails to hold while the Nasdaq and semiconductor sector weaken at the same time, beware of a pullback to $207 or even lower.
⚠️ This week, the market will also be watching earnings from major tech companies and the Fed’s interest rate decision. Intraday volatility may increase around these announcements, so avoid blindly chasing prices with oversized positions.
👇 Click below to trade, follow me, and stay up to date on more NVDA, SOXL, and semiconductor market analysis!
#NVDA #NVIDIA #Aİ
1
31
·
--
Article
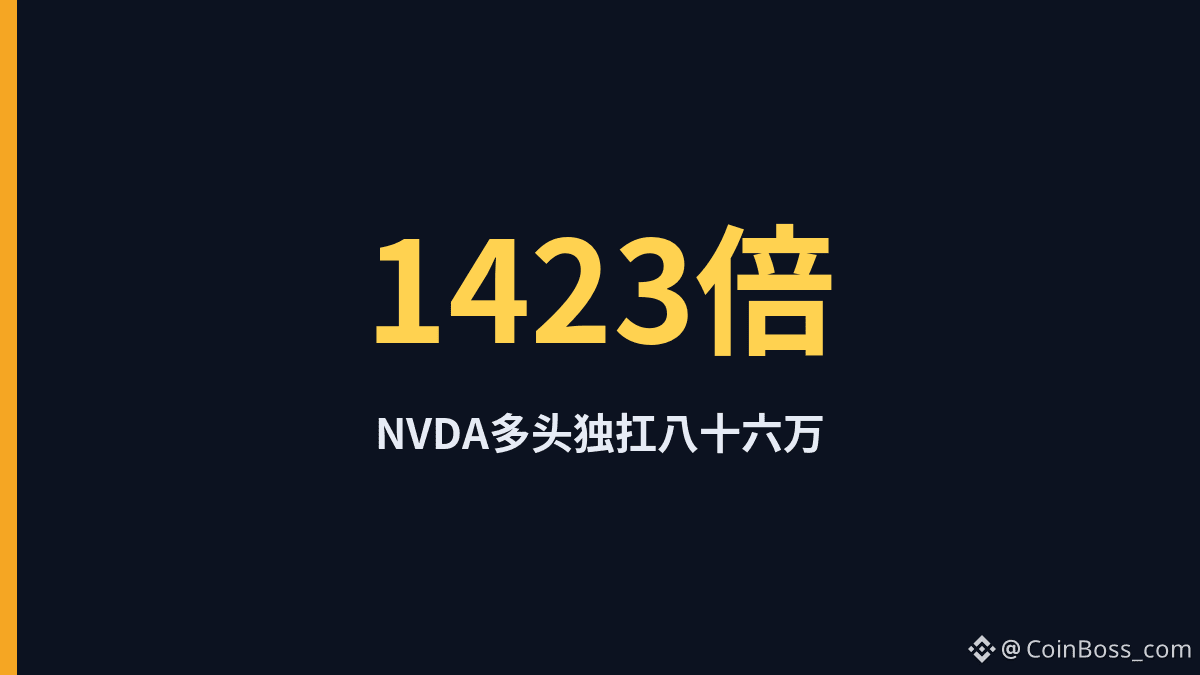
$860,000 in NVDA longs liquidated; short-side liquidations fall short of $1,000Over the past day, about $862,000 in long positions on U.S. stock NVDA were liquidated, while the short side saw only about $606. Nearly all of the 21 liquidations hit longs, widening the gap between the two sides to about 1,423x.
Across TradFi stocks, 24-hour liquidations totaled about $6.555 million for longs and $719,000 for shorts, or about $7.273 million across 1,058 liquidations. NVDA accounted for about $863,000 across 21 liquidations. Prices: BTC at about 80,654.5 on Binance (+1.231%) and 80,643.4 on OKX (+1.240%); ETH at about 2,342.64 on Binance (+1.374%) and 2,342.26 on OKX (+1.415%).
The short side couldn’t even reach $1,000, while longs alone took nearly $860,000 in liquidations—this looks more like leveraged bullish positions in chip stocks hitting trouble first than two-sided wash trading.
$860,000 in NVDA longs liquidated; short-side liquidations fall short of $1,000
Over the past day, about $862,000 in long positions on U.S. stock NVDA were liquidated, while the short side saw only about $606. Nearly all of the 21 liquidations hit longs, widening the gap between the two sides to about 1,423x.
Across TradFi stocks, 24-hour liquidations totaled about $6.555 million for longs and $719,000 for shorts, or about $7.273 million across 1,058 liquidations. NVDA accounted for about $863,000 across 21 liquidations. Prices: BTC at about 80,654.5 on Binance (+1.231%) and 80,643.4 on OKX (+1.240%); ETH at about 2,342.64 on Binance (+1.374%) and 2,342.26 on OKX (+1.415%).
The short side couldn’t even reach $1,000, while longs alone took nearly $860,000 in liquidations—this looks more like leveraged bullish positions in chip stocks hitting trouble first than two-sided wash trading.
4
Log in to explore more content
Join global crypto users on Binance Square
⚡️ Get latest and useful information about crypto.
💬 Trusted by the world’s largest crypto exchange.
👍 Discover real insights from verified creators.
Email / Phone number
Trending Topics
1
#BinancePick
2.7M views
145,646 Discussing
2
#EarningsSeason
5.1M views
24,919 Discussing
3
#AnthropicS1ExpectedToday
252 views
24 Discussing
4
#SouthKoreaReportedlyWeighsFourthCryptoTaxDelay
7,054 views
212 Discussing
5
#FranklinTempletonFilesForTwoDividendToBitcoinETFs
12,967 views
321 Discussing
6
#StrategyMSTRSurpassesNasdaqInMarketCap
11,282 views
263 Discussing
7
#CanadaProposesStablecoinRedemptionWithin3BusinessDays
475 views
29 Discussing
8
#ElectrumWalletBugLetRogueServersStealFunds
16,190 views
380 Discussing
9
#ArgentineCourtDismissesLIBRACaseAgainstMilei
26,903 views
453 Discussing
10
#SKHynixReportedlyPlansSpecialDividendFromKioxiaStakeSale
3,994 views
52 Discussing