
#ethusd
ethusd
418,256 views
905 Discussing
Hot
Latest

·
--
💎 ETHEREUM – VOLATILITY HITS THE MARKET! 📉
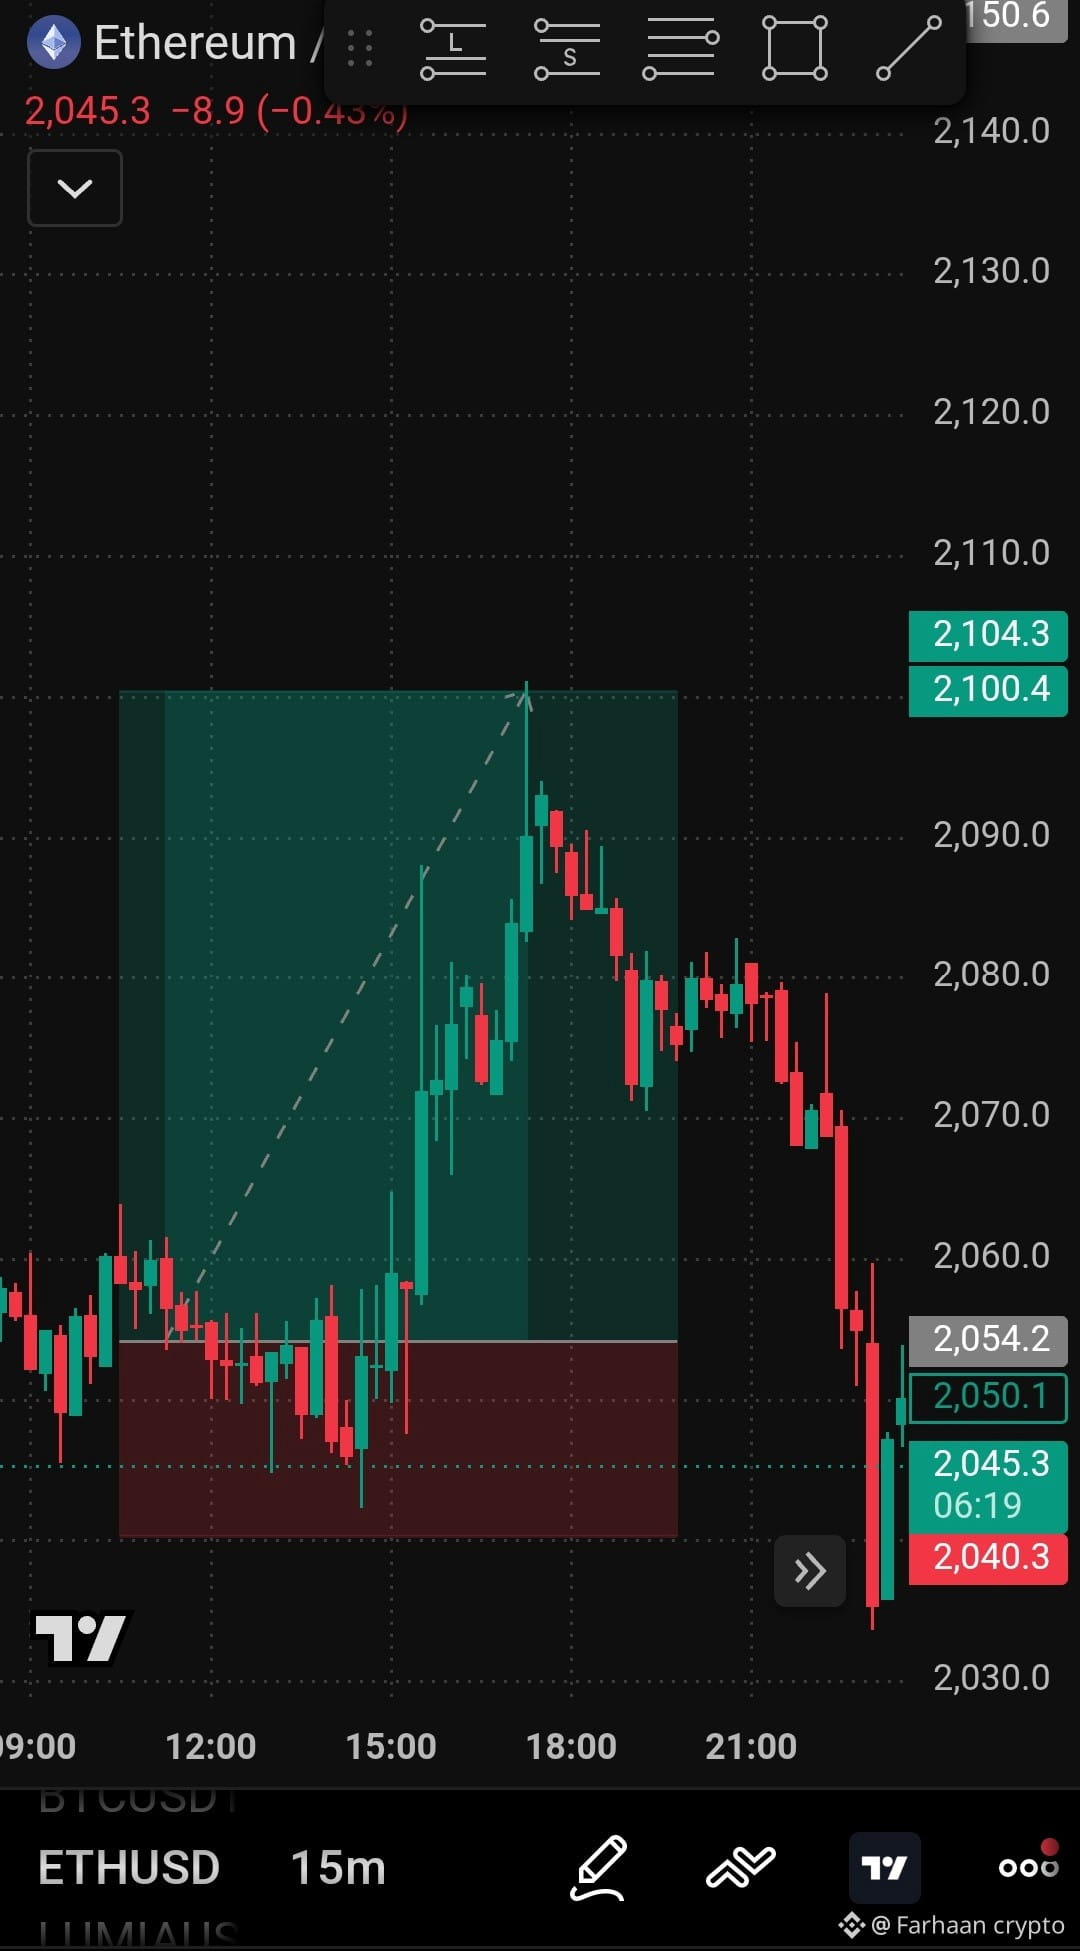
ETH showed a strong bullish move before facing significant selling pressure.
The recent pullback has brought price back towards the original entry area. Now, market confirmation is important before expecting another bullish move.
📊 Pair: ETHUSD
⏱️ Timeframe: 15M
🟢 Setup: LONG
🎯 Target: 2,100.4
🛑 Stop Loss: 2,040.3
Trading is not about being right every time. It's about managing risk and staying disciplined.
Respect the levels. Never fight the market. 💎
#Ethereum #ETHUSD #PriceAction #BinanceSquare $ETH
{future}(ETHUSDT)
💎 ETHEREUM – VOLATILITY HITS THE MARKET! 📉
ETH showed a strong bullish move before facing significant selling pressure.
The recent pullback has brought price back towards the original entry area. Now, market confirmation is important before expecting another bullish move.
📊 Pair: ETHUSD
⏱️ Timeframe: 15M
🟢 Setup: LONG
🎯 Target: 2,100.4
🛑 Stop Loss: 2,040.3
Trading is not about being right every time. It's about managing risk and staying disciplined.
Respect the levels. Never fight the market. 💎
#Ethereum #ETHUSD #PriceAction #BinanceSquare $ETH
ETH showed a strong bullish move before facing significant selling pressure.
The recent pullback has brought price back towards the original entry area. Now, market confirmation is important before expecting another bullish move.
📊 Pair: ETHUSD
⏱️ Timeframe: 15M
🟢 Setup: LONG
🎯 Target: 2,100.4
🛑 Stop Loss: 2,040.3
Trading is not about being right every time. It's about managing risk and staying disciplined.
Respect the levels. Never fight the market. 💎
#Ethereum #ETHUSD #PriceAction #BinanceSquare $ETH
280

·
--
#🚨 ETHEREUM UNDER PRESSURE — BUT WHALES ARE BUYING! 🐋🔥
$ETH Ethereum ($ETH) is attracting attention after dropping around 7%, with its price trading near the $2,230 support level.
But here's where things get interesting! 👀
According to the report highlighted by TheCurrencyAnalytics.com, large investors are reportedly accumulating approximately 18,550 ETH despite the recent market weakness.
📊 What's happening with Ethereum?
🔻 ETH has experienced a 7% price decline.
💰 Ethereum is trading near $2,230.
🐋 Whale wallets are reportedly accumulating 18,550 ETH.
📈 Analysts are comparing the current market structure with a 2025 price fractal.
🔥 On-chain data suggests improving investor sentiment.
THE BIG QUESTION:
Why are large investors buying while the market is falling?
Could these whales be positioning themselves ahead of a potential Ethereum recovery?
Or could ETH experience another correction before its next major move?
👀 WHAT'S YOUR PREDICTION?
Can Ethereum reclaim $2,500, or will it fall below $2,000 first?
👇 Share your ETH price prediction in the comments!
🚀 SMART MONEY OR RISKY BET? YOU DECIDE!
Remember: Whale accumulation does not guarantee a price increase. Cryptocurrency markets are volatile, and price predictions are speculative.
#Ethereum #ETH #EthereumWhales #CryptoNews #WhaleAlert #ETHUSD
#cryptouniverseofficial $ETH
#🚨 ETHEREUM UNDER PRESSURE — BUT WHALES ARE BUYING! 🐋🔥
$ETH Ethereum ($ETH ) is attracting attention after dropping around 7%, with its price trading near the $2,230 support level.
But here's where things get interesting! 👀
According to the report highlighted by TheCurrencyAnalytics.com, large investors are reportedly accumulating approximately 18,550 ETH despite the recent market weakness.
📊 What's happening with Ethereum?
🔻 ETH has experienced a 7% price decline.
💰 Ethereum is trading near $2,230.
🐋 Whale wallets are reportedly accumulating 18,550 ETH.
📈 Analysts are comparing the current market structure with a 2025 price fractal.
🔥 On-chain data suggests improving investor sentiment.
THE BIG QUESTION:
Why are large investors buying while the market is falling?
Could these whales be positioning themselves ahead of a potential Ethereum recovery?
Or could ETH experience another correction before its next major move?
👀 WHAT'S YOUR PREDICTION?
Can Ethereum reclaim $2,500, or will it fall below $2,000 first?
👇 Share your ETH price prediction in the comments!
🚀 SMART MONEY OR RISKY BET? YOU DECIDE!
Remember: Whale accumulation does not guarantee a price increase. Cryptocurrency markets are volatile, and price predictions are speculative.
#Ethereum #ETH #EthereumWhales #CryptoNews #WhaleAlert #ETHUSD
#cryptouniverseofficial $ETH
$ETH Ethereum ($ETH ) is attracting attention after dropping around 7%, with its price trading near the $2,230 support level.
But here's where things get interesting! 👀
According to the report highlighted by TheCurrencyAnalytics.com, large investors are reportedly accumulating approximately 18,550 ETH despite the recent market weakness.
📊 What's happening with Ethereum?
🔻 ETH has experienced a 7% price decline.
💰 Ethereum is trading near $2,230.
🐋 Whale wallets are reportedly accumulating 18,550 ETH.
📈 Analysts are comparing the current market structure with a 2025 price fractal.
🔥 On-chain data suggests improving investor sentiment.
THE BIG QUESTION:
Why are large investors buying while the market is falling?
Could these whales be positioning themselves ahead of a potential Ethereum recovery?
Or could ETH experience another correction before its next major move?
👀 WHAT'S YOUR PREDICTION?
Can Ethereum reclaim $2,500, or will it fall below $2,000 first?
👇 Share your ETH price prediction in the comments!
🚀 SMART MONEY OR RISKY BET? YOU DECIDE!
Remember: Whale accumulation does not guarantee a price increase. Cryptocurrency markets are volatile, and price predictions are speculative.
#Ethereum #ETH #EthereumWhales #CryptoNews #WhaleAlert #ETHUSD
#cryptouniverseofficial $ETH

210

$ETH
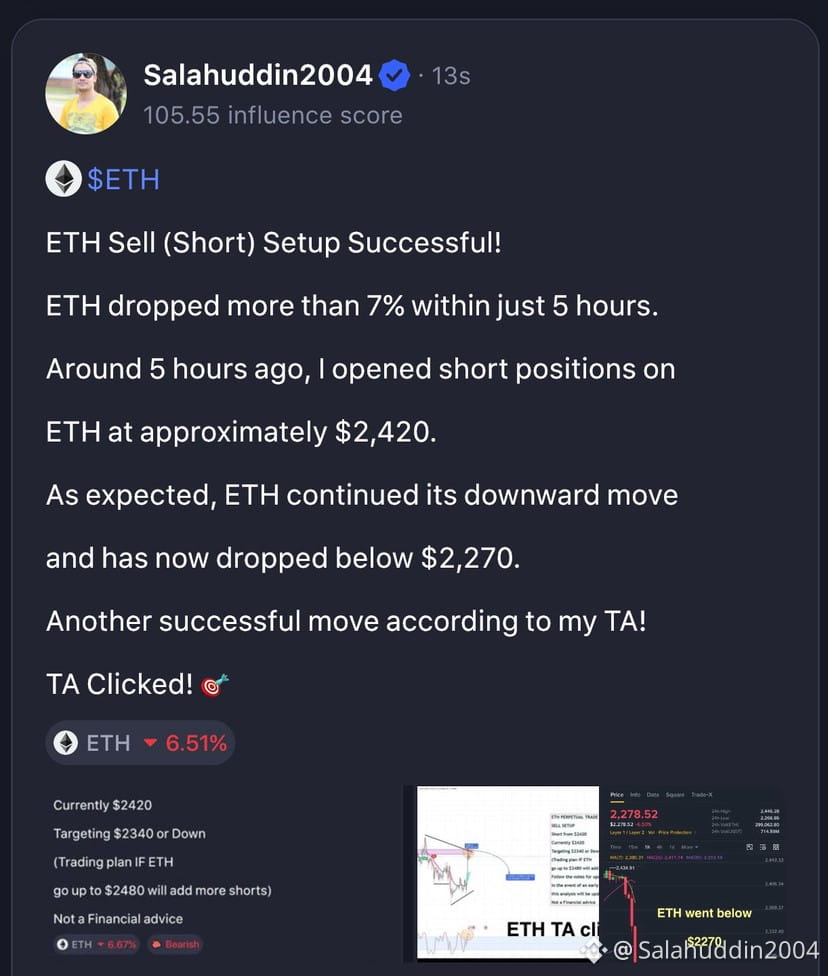
ETH Sell (Short) Setup Successful!
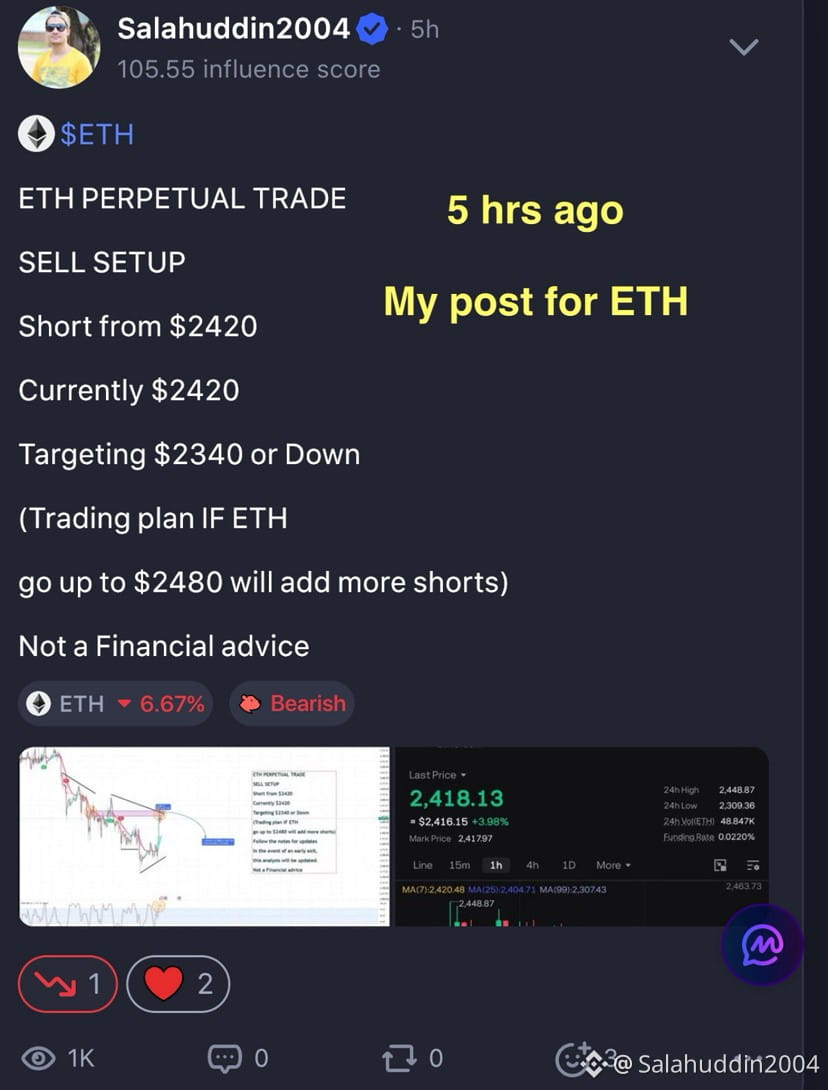
ETH dropped more than 7% within just 5 hours.
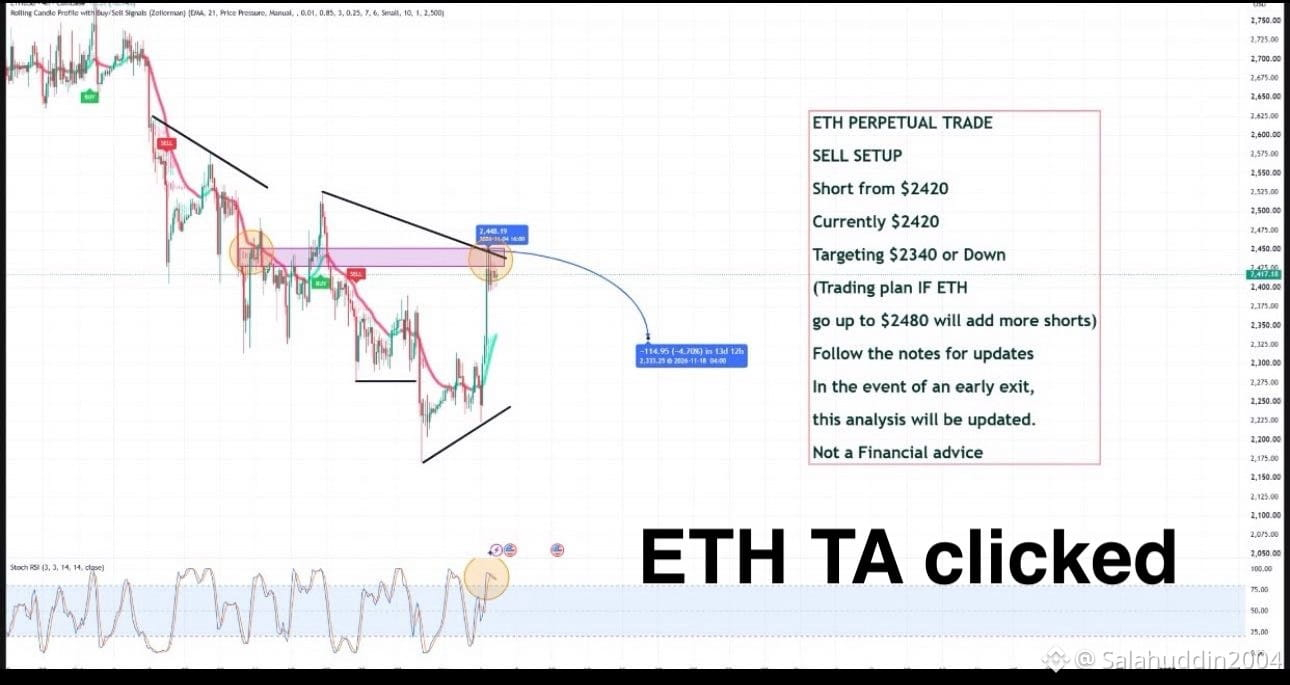
Around 5 hours ago, I opened short positions on
ETH at approximately $2,420.
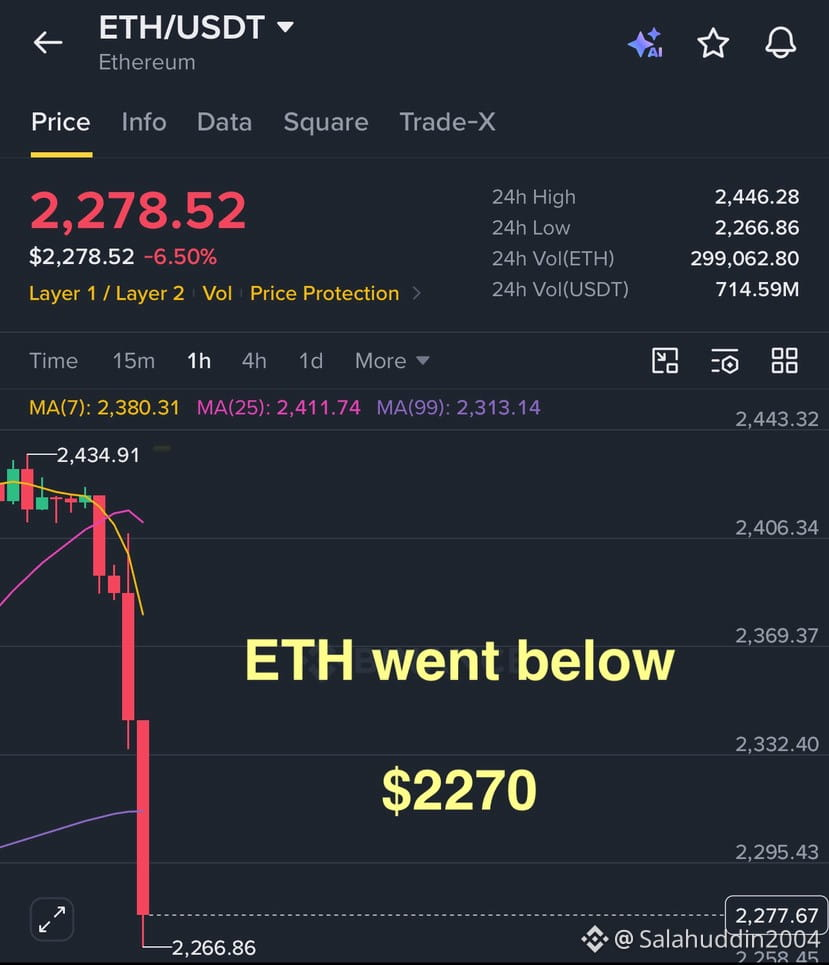
As expected, ETH continued its downward move
and has now dropped below $2,270.
Another successful move according to my TA!
TA Clicked! 🎯
#eth #ETHUSD #salahuddin2004
$ETH
ETH Sell (Short) Setup Successful!
ETH dropped more than 7% within just 5 hours.
Around 5 hours ago, I opened short positions on
ETH at approximately $2,420.
As expected, ETH continued its downward move
and has now dropped below $2,270.
Another successful move according to my TA!
TA Clicked! 🎯
#eth #ETHUSD #salahuddin2004
ETH Sell (Short) Setup Successful!
ETH dropped more than 7% within just 5 hours.
Around 5 hours ago, I opened short positions on
ETH at approximately $2,420.
As expected, ETH continued its downward move
and has now dropped below $2,270.
Another successful move according to my TA!
TA Clicked! 🎯
#eth #ETHUSD #salahuddin2004
1
238

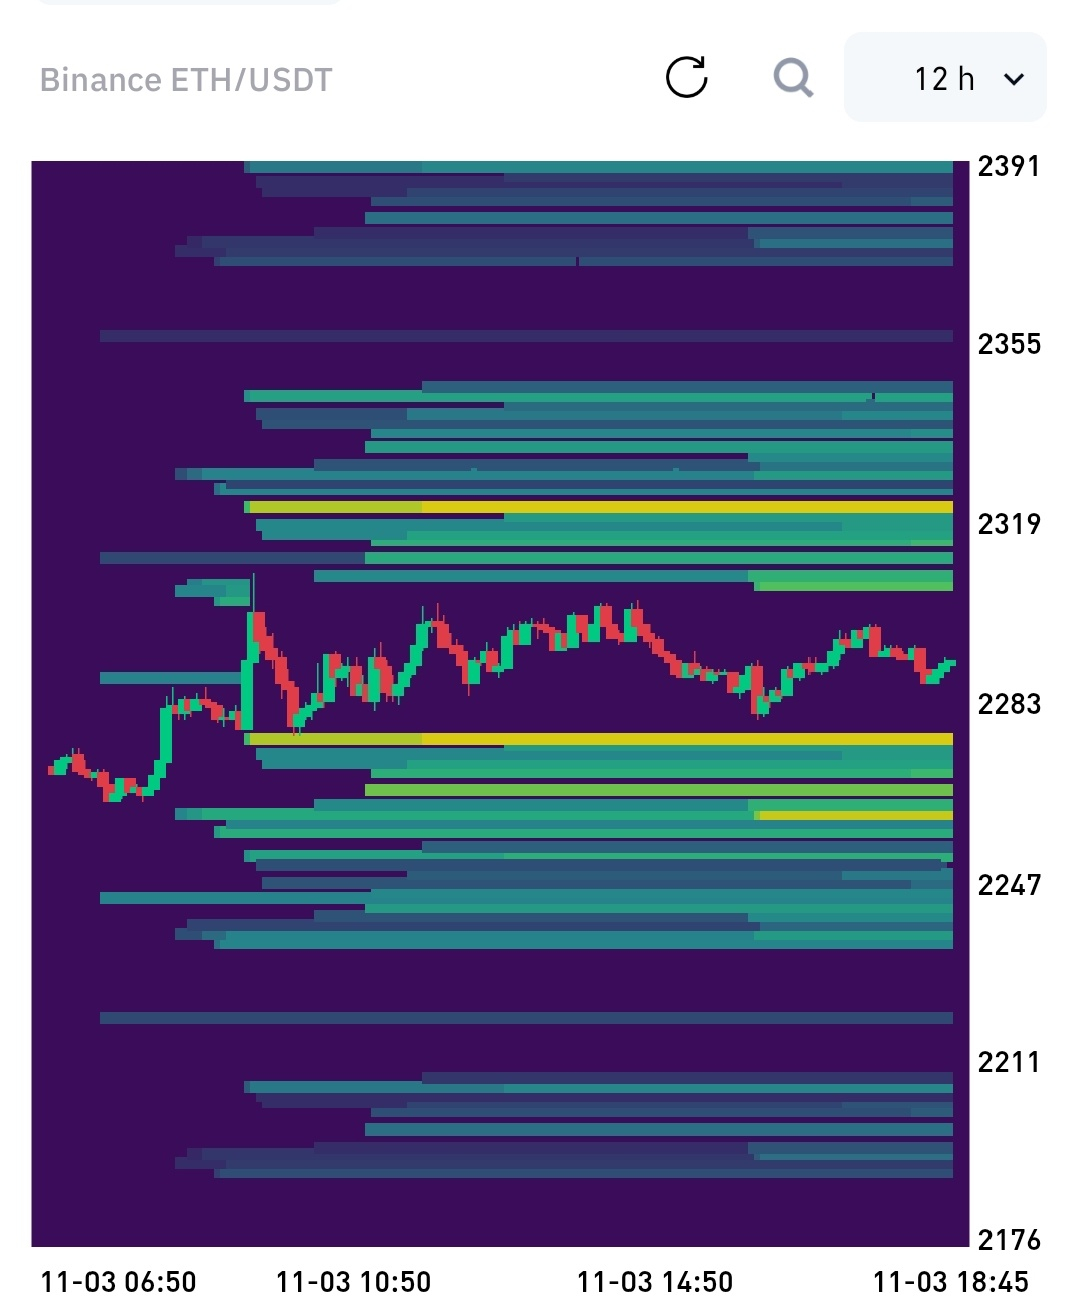
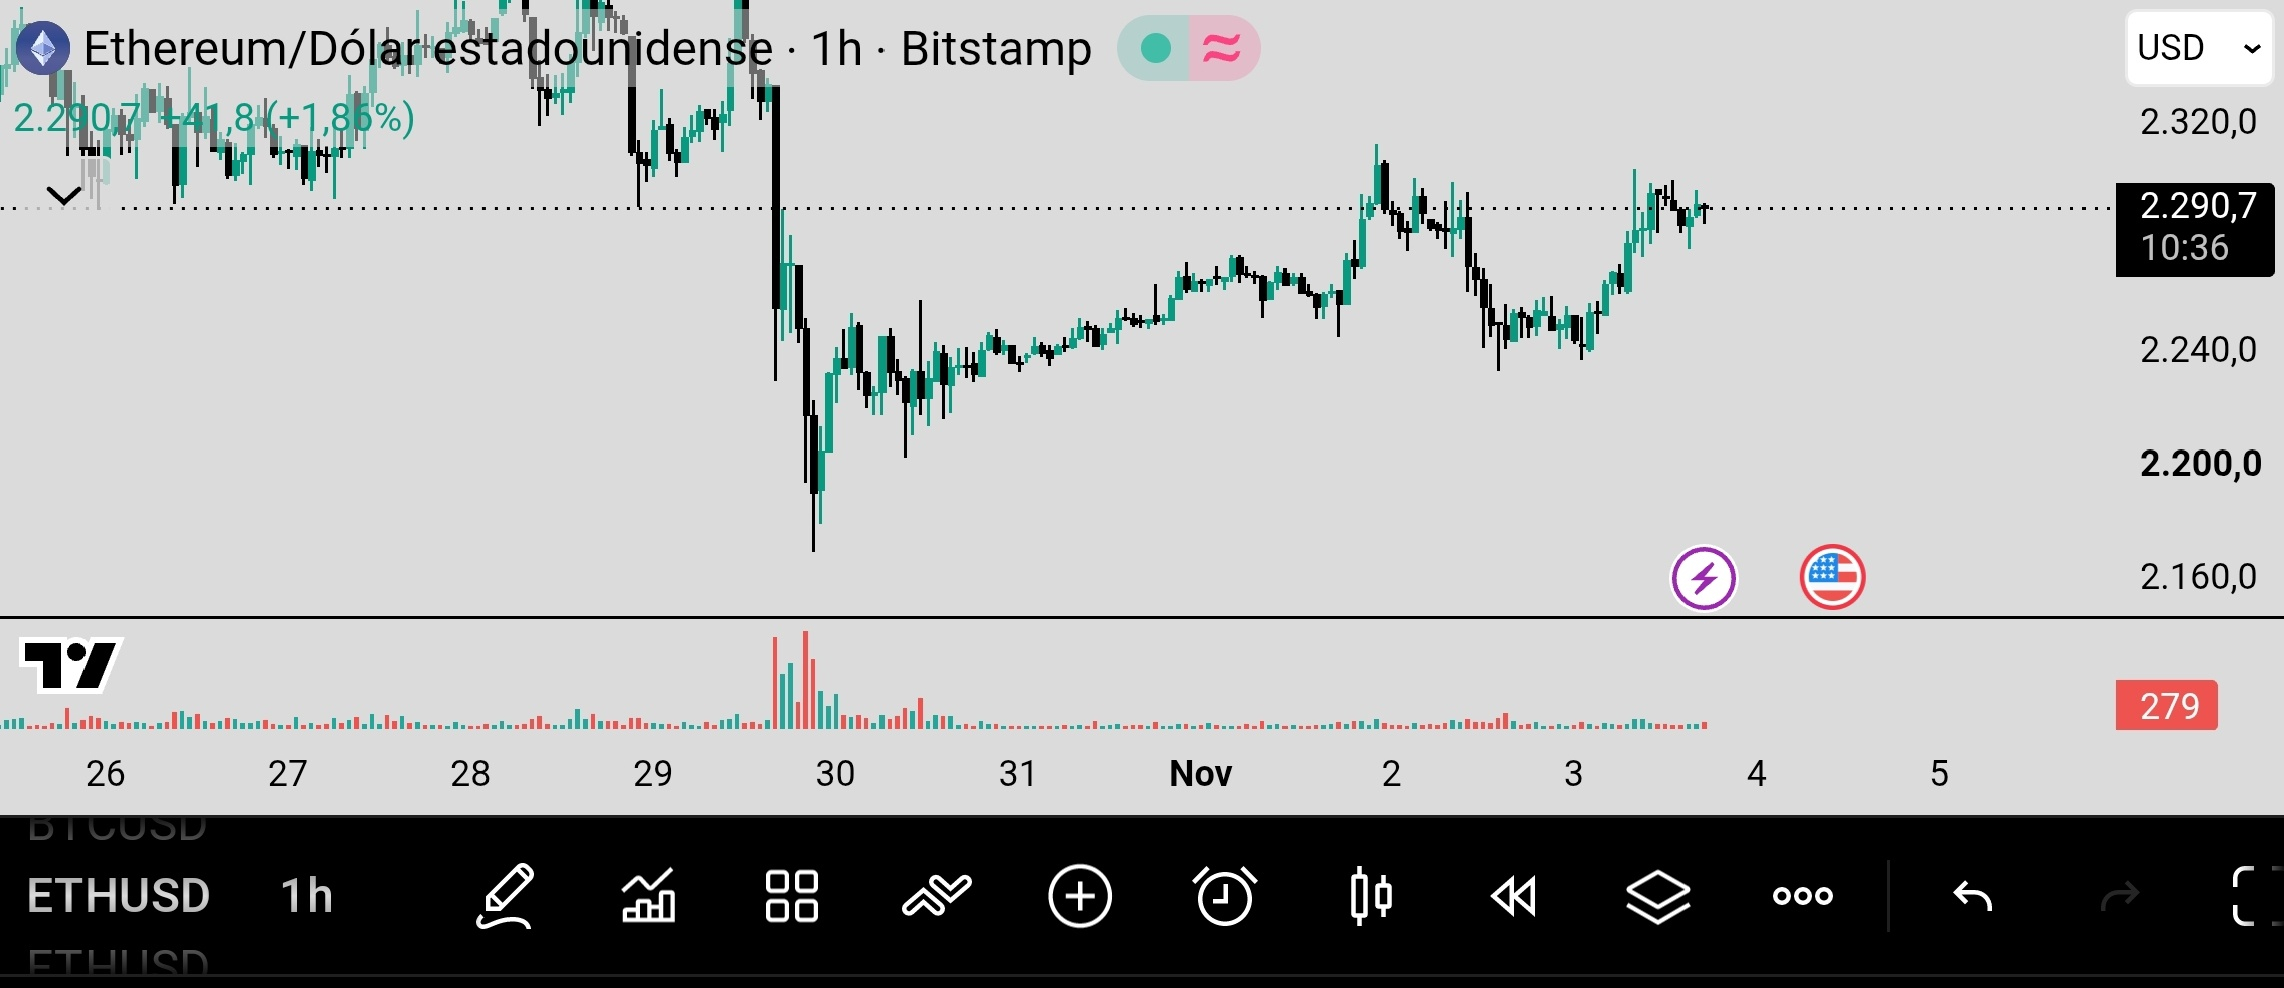
🚨 $ETH CONSOLIDATION AROUND $2,290: PUSH TOWARD $2,310 OR PULLBACK?
Price Movement: Maintaining a range structure after recent moves, Ethereum is trading around $2,290.70 on the 1-hour chart, recording a positive change of +1.85%
Upper Resistance Magnet: The 12-hour Liq Heatmap shows a dense concentration of liquidity firmly accumulated around the $2,319 level, establishing it as the immediate bullish target
Support and Lower Defense: On the downside, the most significant liquidation blocks are clustered at the $2,283 level, serving as the technical price-support cushion
Market Dynamics: Price action reflects candles in a tight
{future}(ETHUSDT)
range and low volatility, showing a stabilization and accumulation phase within the sideways channel
Do you think the price will manage to break the $2,319 resistance to seek further upside, or will we see a test of the $2,283 support? Let us know in the comments! 👇
🔎 Monitor order book depth and real-time flow changes through the official ETH/USD pair
#Ethereum #ETH #Crypto #Trading #ETHUSD
🚨 $ETH CONSOLIDATION AROUND $2,290: PUSH TOWARD $2,310 OR PULLBACK?
Price Movement: Maintaining a range structure after recent moves, Ethereum is trading around $2,290.70 on the 1-hour chart, recording a positive change of +1.85%
Upper Resistance Magnet: The 12-hour Liq Heatmap shows a dense concentration of liquidity firmly accumulated around the $2,319 level, establishing it as the immediate bullish target
Support and Lower Defense: On the downside, the most significant liquidation blocks are clustered at the $2,283 level, serving as the technical price-support cushion
Market Dynamics: Price action reflects candles in a tight
range and low volatility, showing a stabilization and accumulation phase within the sideways channel
Do you think the price will manage to break the $2,319 resistance to seek further upside, or will we see a test of the $2,283 support? Let us know in the comments! 👇
🔎 Monitor order book depth and real-time flow changes through the official ETH/USD pair
#Ethereum #ETH #Crypto #Trading #ETHUSD
Price Movement: Maintaining a range structure after recent moves, Ethereum is trading around $2,290.70 on the 1-hour chart, recording a positive change of +1.85%
Upper Resistance Magnet: The 12-hour Liq Heatmap shows a dense concentration of liquidity firmly accumulated around the $2,319 level, establishing it as the immediate bullish target
Support and Lower Defense: On the downside, the most significant liquidation blocks are clustered at the $2,283 level, serving as the technical price-support cushion
Market Dynamics: Price action reflects candles in a tight
range and low volatility, showing a stabilization and accumulation phase within the sideways channel
Do you think the price will manage to break the $2,319 resistance to seek further upside, or will we see a test of the $2,283 support? Let us know in the comments! 👇
🔎 Monitor order book depth and real-time flow changes through the official ETH/USD pair
#Ethereum #ETH #Crypto #Trading #ETHUSD
212
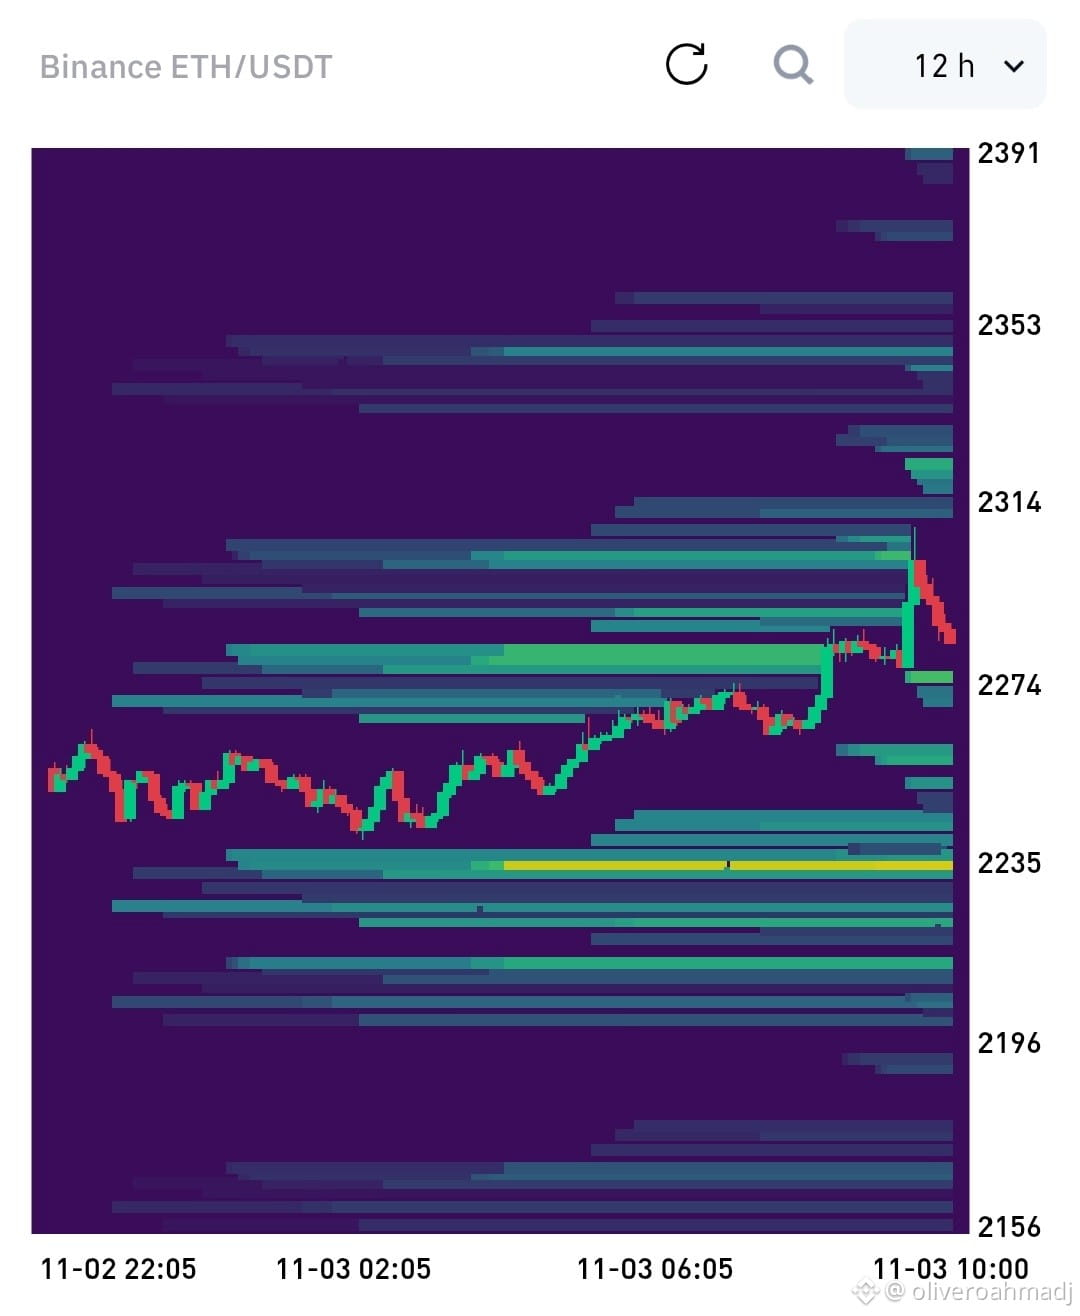
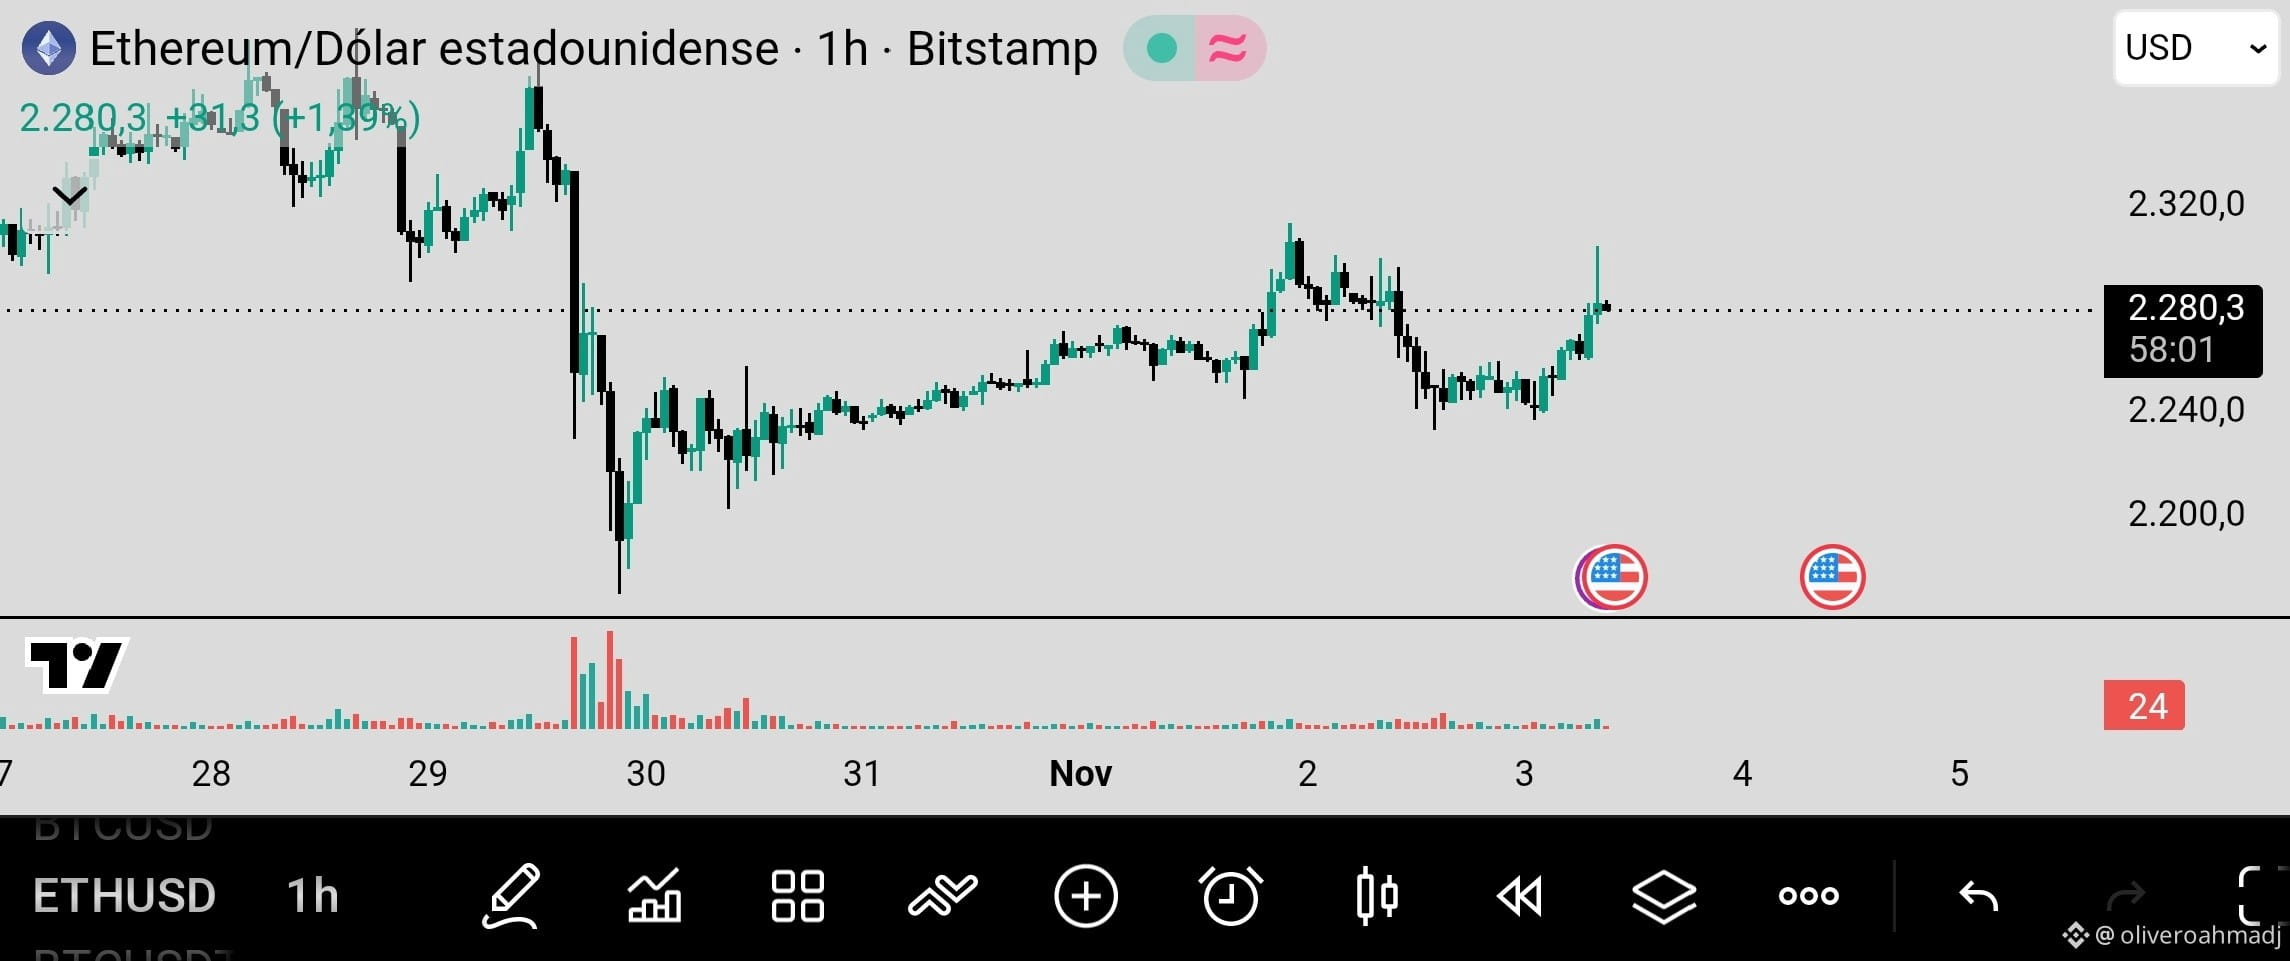
🚨 $ETH BOUNCE TOWARD THE $2,280 ZONE: BULLISH MOMENTUM OR ANOTHER RESISTANCE TEST?
Price Movement: After seeking lower support, Ethereum is showing a recovery and is trading around $2,280.33 on the 1-hour chart, up +1.39%
Upper Resistance Magnet: The 12-hour Liq Heatmap reveals a significant accumulation of sell-side liquidity around $2,314, making it the immediate upside target
Support and Lower Defense: Below, the most significant liquidation blocks are clustered around $2,235, serving as technical support against potential pullbacks
Market Dynamics: Price action reflects buying pressure after sweeping previous liquidity, consolidating a short-term recovery in the order books
Do you think the price will manage to break through the $2,310 resistance and continue rising, or will we see a rejection back toward support? Let us know in the comments! 👇
🔎 Monitor order book depth and real-time flow changes on the official ETH/USD pair.
#Ethereum #ETH #Crypto #trading #ETHUSD
{future}(ETHUSDT)
🚨 $ETH BOUNCE TOWARD THE $2,280 ZONE: BULLISH MOMENTUM OR ANOTHER RESISTANCE TEST?
Price Movement: After seeking lower support, Ethereum is showing a recovery and is trading around $2,280.33 on the 1-hour chart, up +1.39%
Upper Resistance Magnet: The 12-hour Liq Heatmap reveals a significant accumulation of sell-side liquidity around $2,314, making it the immediate upside target
Support and Lower Defense: Below, the most significant liquidation blocks are clustered around $2,235, serving as technical support against potential pullbacks
Market Dynamics: Price action reflects buying pressure after sweeping previous liquidity, consolidating a short-term recovery in the order books
Do you think the price will manage to break through the $2,310 resistance and continue rising, or will we see a rejection back toward support? Let us know in the comments! 👇
🔎 Monitor order book depth and real-time flow changes on the official ETH/USD pair.
#Ethereum #ETH #Crypto #trading #ETHUSD
Price Movement: After seeking lower support, Ethereum is showing a recovery and is trading around $2,280.33 on the 1-hour chart, up +1.39%
Upper Resistance Magnet: The 12-hour Liq Heatmap reveals a significant accumulation of sell-side liquidity around $2,314, making it the immediate upside target
Support and Lower Defense: Below, the most significant liquidation blocks are clustered around $2,235, serving as technical support against potential pullbacks
Market Dynamics: Price action reflects buying pressure after sweeping previous liquidity, consolidating a short-term recovery in the order books
Do you think the price will manage to break through the $2,310 resistance and continue rising, or will we see a rejection back toward support? Let us know in the comments! 👇
🔎 Monitor order book depth and real-time flow changes on the official ETH/USD pair.
#Ethereum #ETH #Crypto #trading #ETHUSD
112
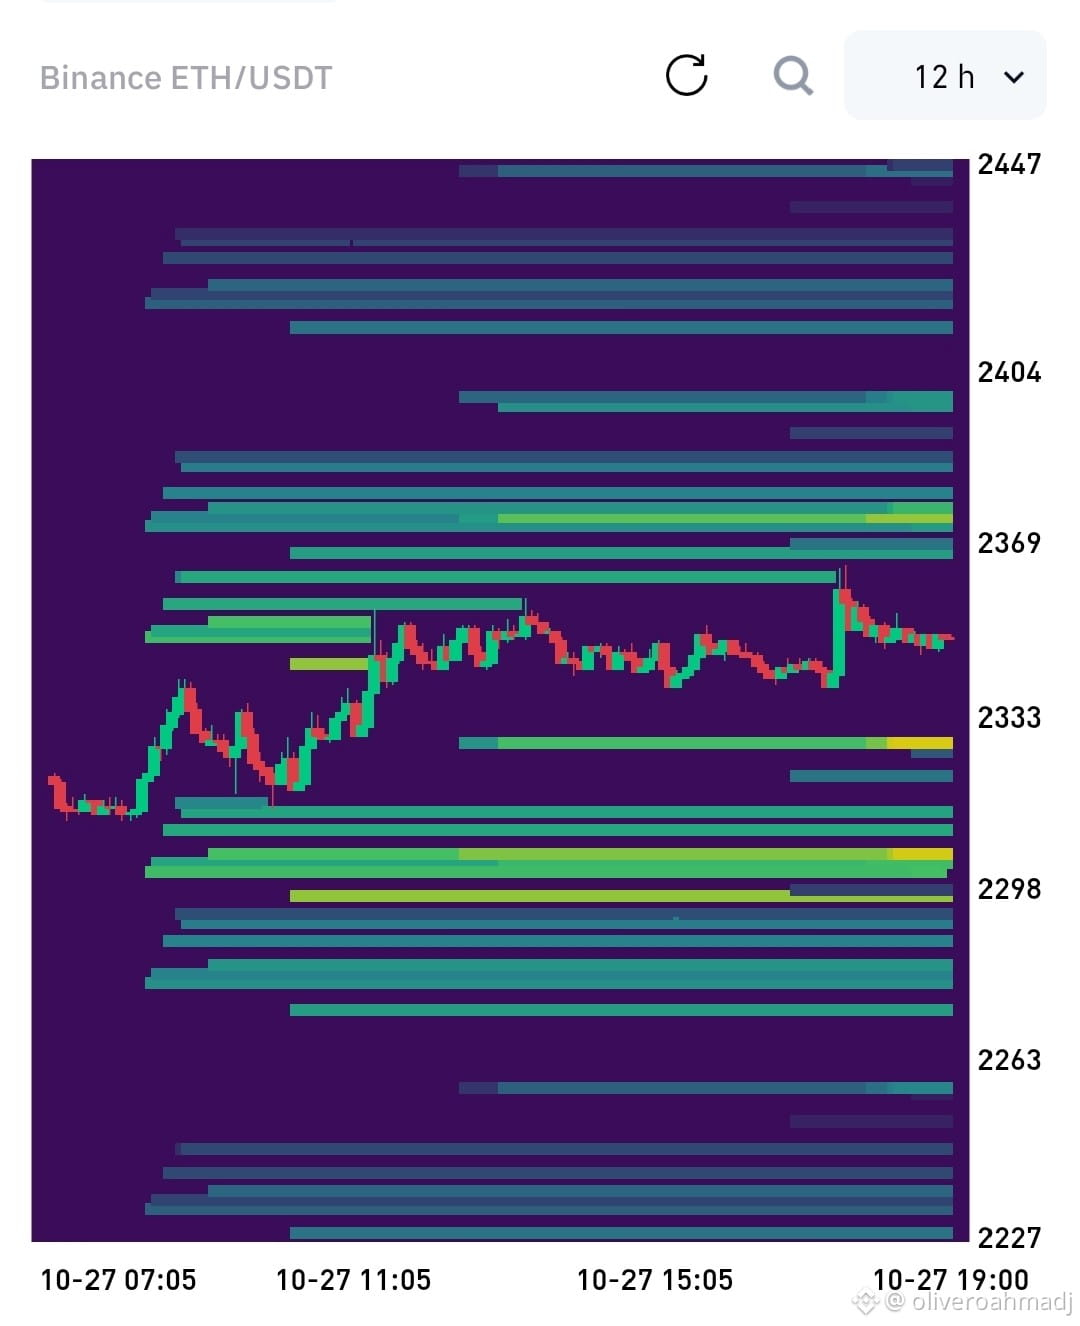
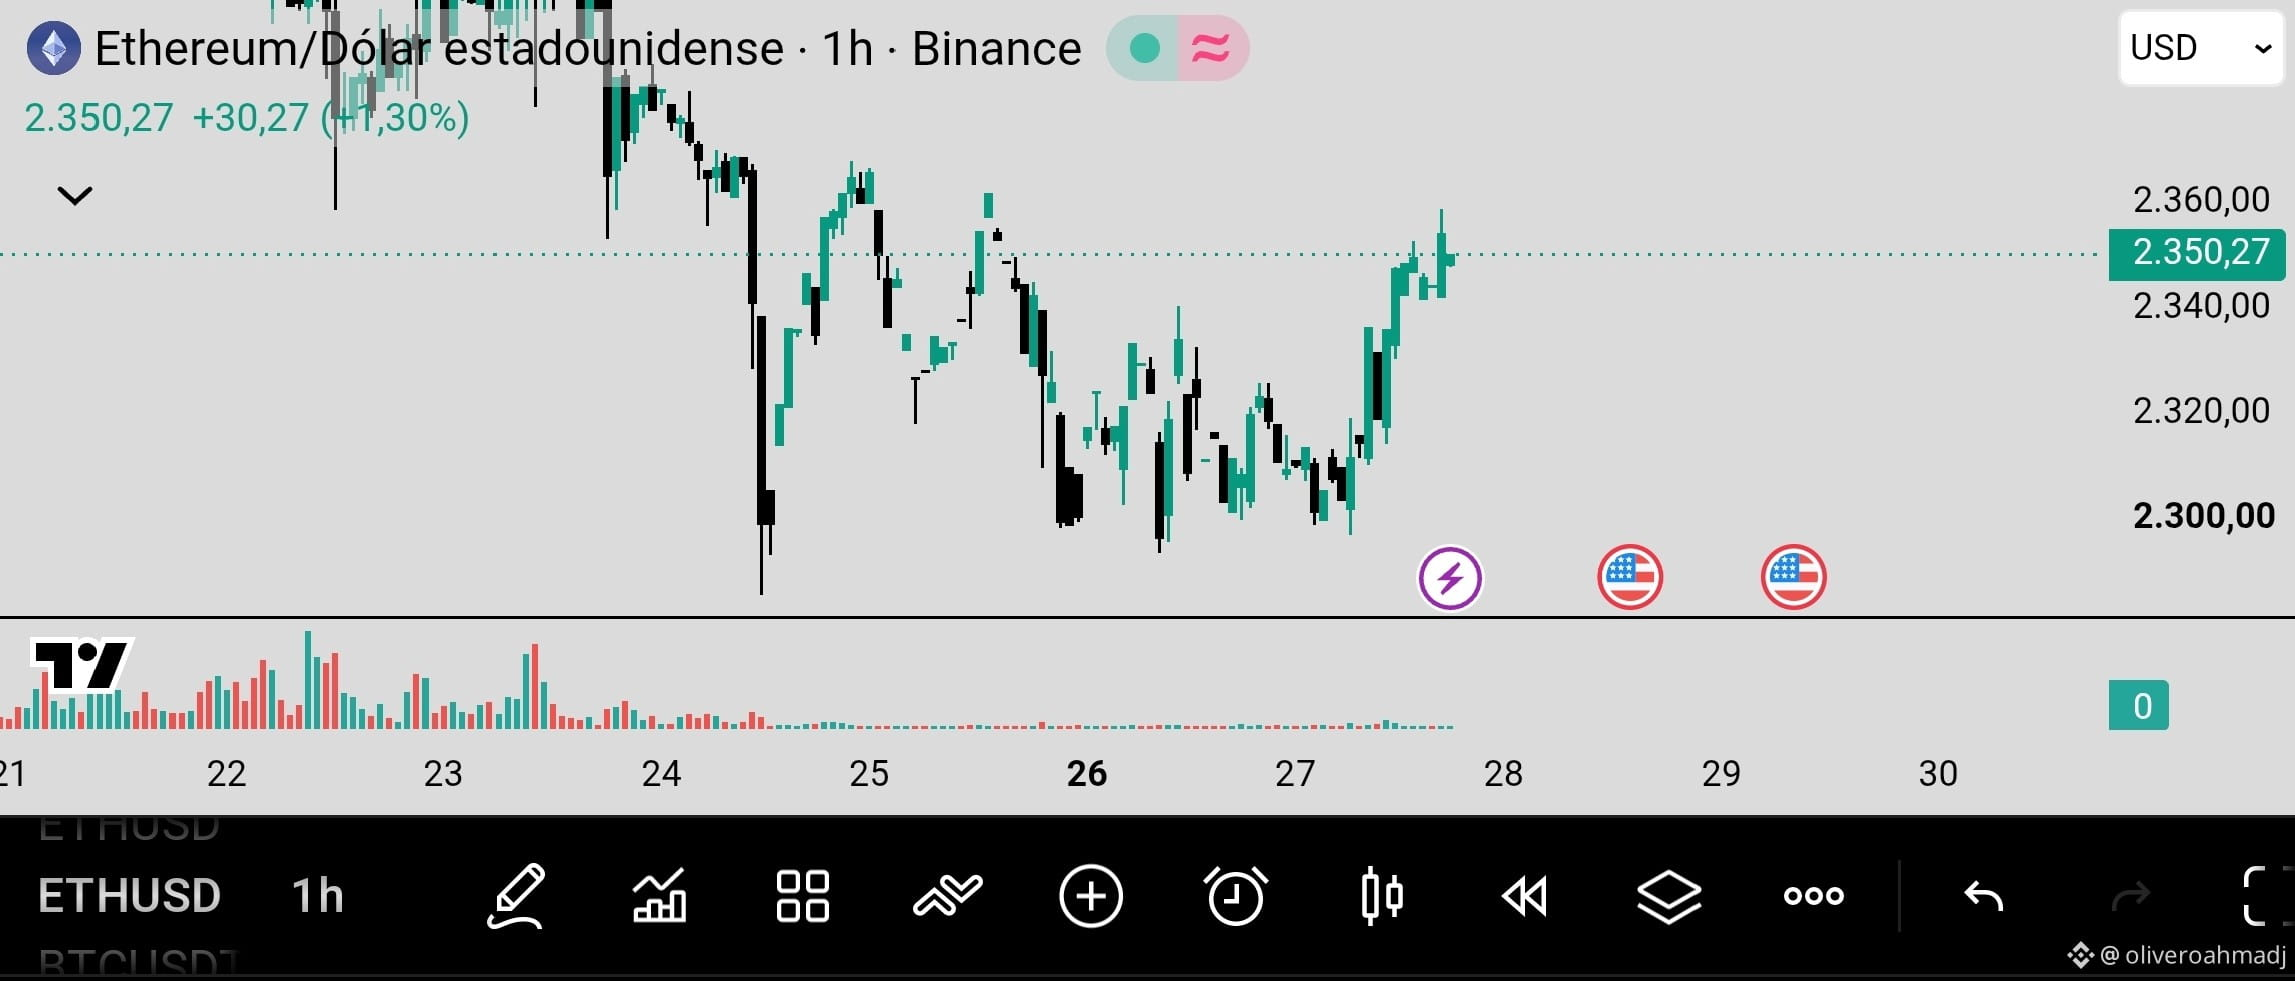
🚨 $ETH TARGET ACHIEVED AT 2,350 USD: BREAKOUT OR REJECTION AT THE RESISTANCE ZONE?
Price Movement: As outlined in the previous analysis, Ethereum met the bullish projection, reaching the 2,350.27 USD zone on the 1-hour chart and posting a solid gain of +1.30%
Liquidity Magnet and Heatmap: The 12-hour Liq Heatmap shows that the price has reached the dense upper liquidity band, encountering the first supply wall around 2,369 USD
Support Level: Below, the strongest liquidation blocks are now consolidated at the 2,333 USD level, serving as immediate cushioning against any technical pullback
Market Dynamics: The sharp rise shows an expansion in buying volume that has swept through the projected targets, challenging the main short-term barriers
Do you think Ethereum will manage to decisively break above 2,350 USD and target 2,369 USD, or will we see a consolidation pullback from this level? Let us know in the comments! 👇
🔎 Monitor order book depth and flow changes in real time on the official ETH/USD pair
#Ethereum #ETH #Crypto #Trading #ETHUSD
🚨 $ETH TARGET ACHIEVED AT 2,350 USD: BREAKOUT OR REJECTION AT THE RESISTANCE ZONE?
Price Movement: As outlined in the previous analysis, Ethereum met the bullish projection, reaching the 2,350.27 USD zone on the 1-hour chart and posting a solid gain of +1.30%
Liquidity Magnet and Heatmap: The 12-hour Liq Heatmap shows that the price has reached the dense upper liquidity band, encountering the first supply wall around 2,369 USD
Support Level: Below, the strongest liquidation blocks are now consolidated at the 2,333 USD level, serving as immediate cushioning against any technical pullback
Market Dynamics: The sharp rise shows an expansion in buying volume that has swept through the projected targets, challenging the main short-term barriers
Do you think Ethereum will manage to decisively break above 2,350 USD and target 2,369 USD, or will we see a consolidation pullback from this level? Let us know in the comments! 👇
🔎 Monitor order book depth and flow changes in real time on the official ETH/USD pair
#Ethereum #ETH #Crypto #Trading #ETHUSD
Price Movement: As outlined in the previous analysis, Ethereum met the bullish projection, reaching the 2,350.27 USD zone on the 1-hour chart and posting a solid gain of +1.30%
Liquidity Magnet and Heatmap: The 12-hour Liq Heatmap shows that the price has reached the dense upper liquidity band, encountering the first supply wall around 2,369 USD
Support Level: Below, the strongest liquidation blocks are now consolidated at the 2,333 USD level, serving as immediate cushioning against any technical pullback
Market Dynamics: The sharp rise shows an expansion in buying volume that has swept through the projected targets, challenging the main short-term barriers
Do you think Ethereum will manage to decisively break above 2,350 USD and target 2,369 USD, or will we see a consolidation pullback from this level? Let us know in the comments! 👇
🔎 Monitor order book depth and flow changes in real time on the official ETH/USD pair
#Ethereum #ETH #Crypto #Trading #ETHUSD
119
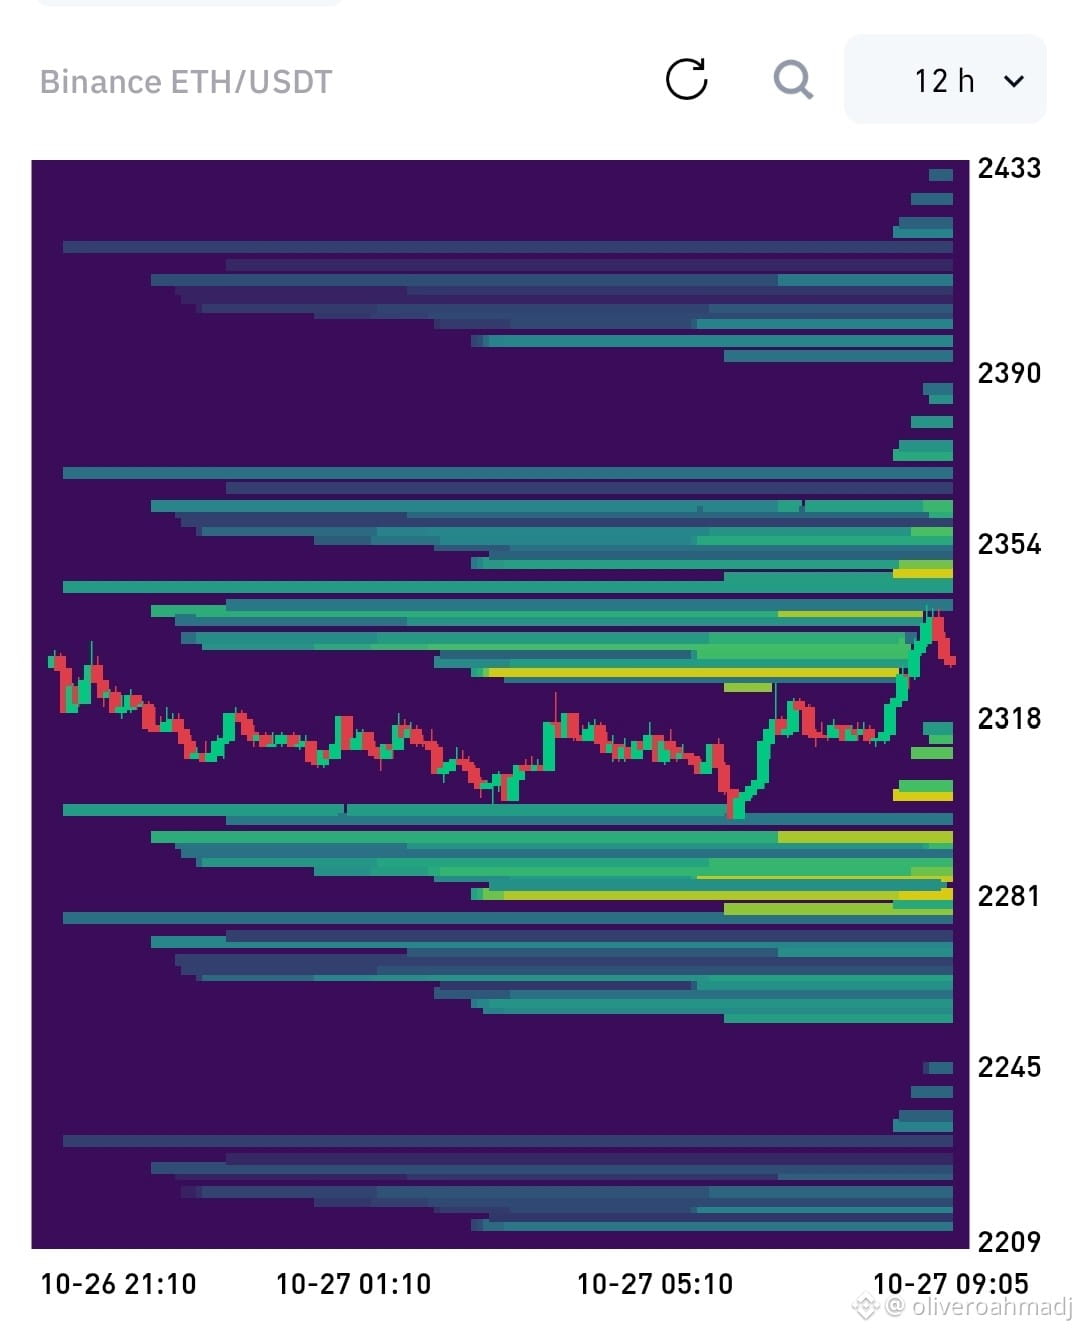
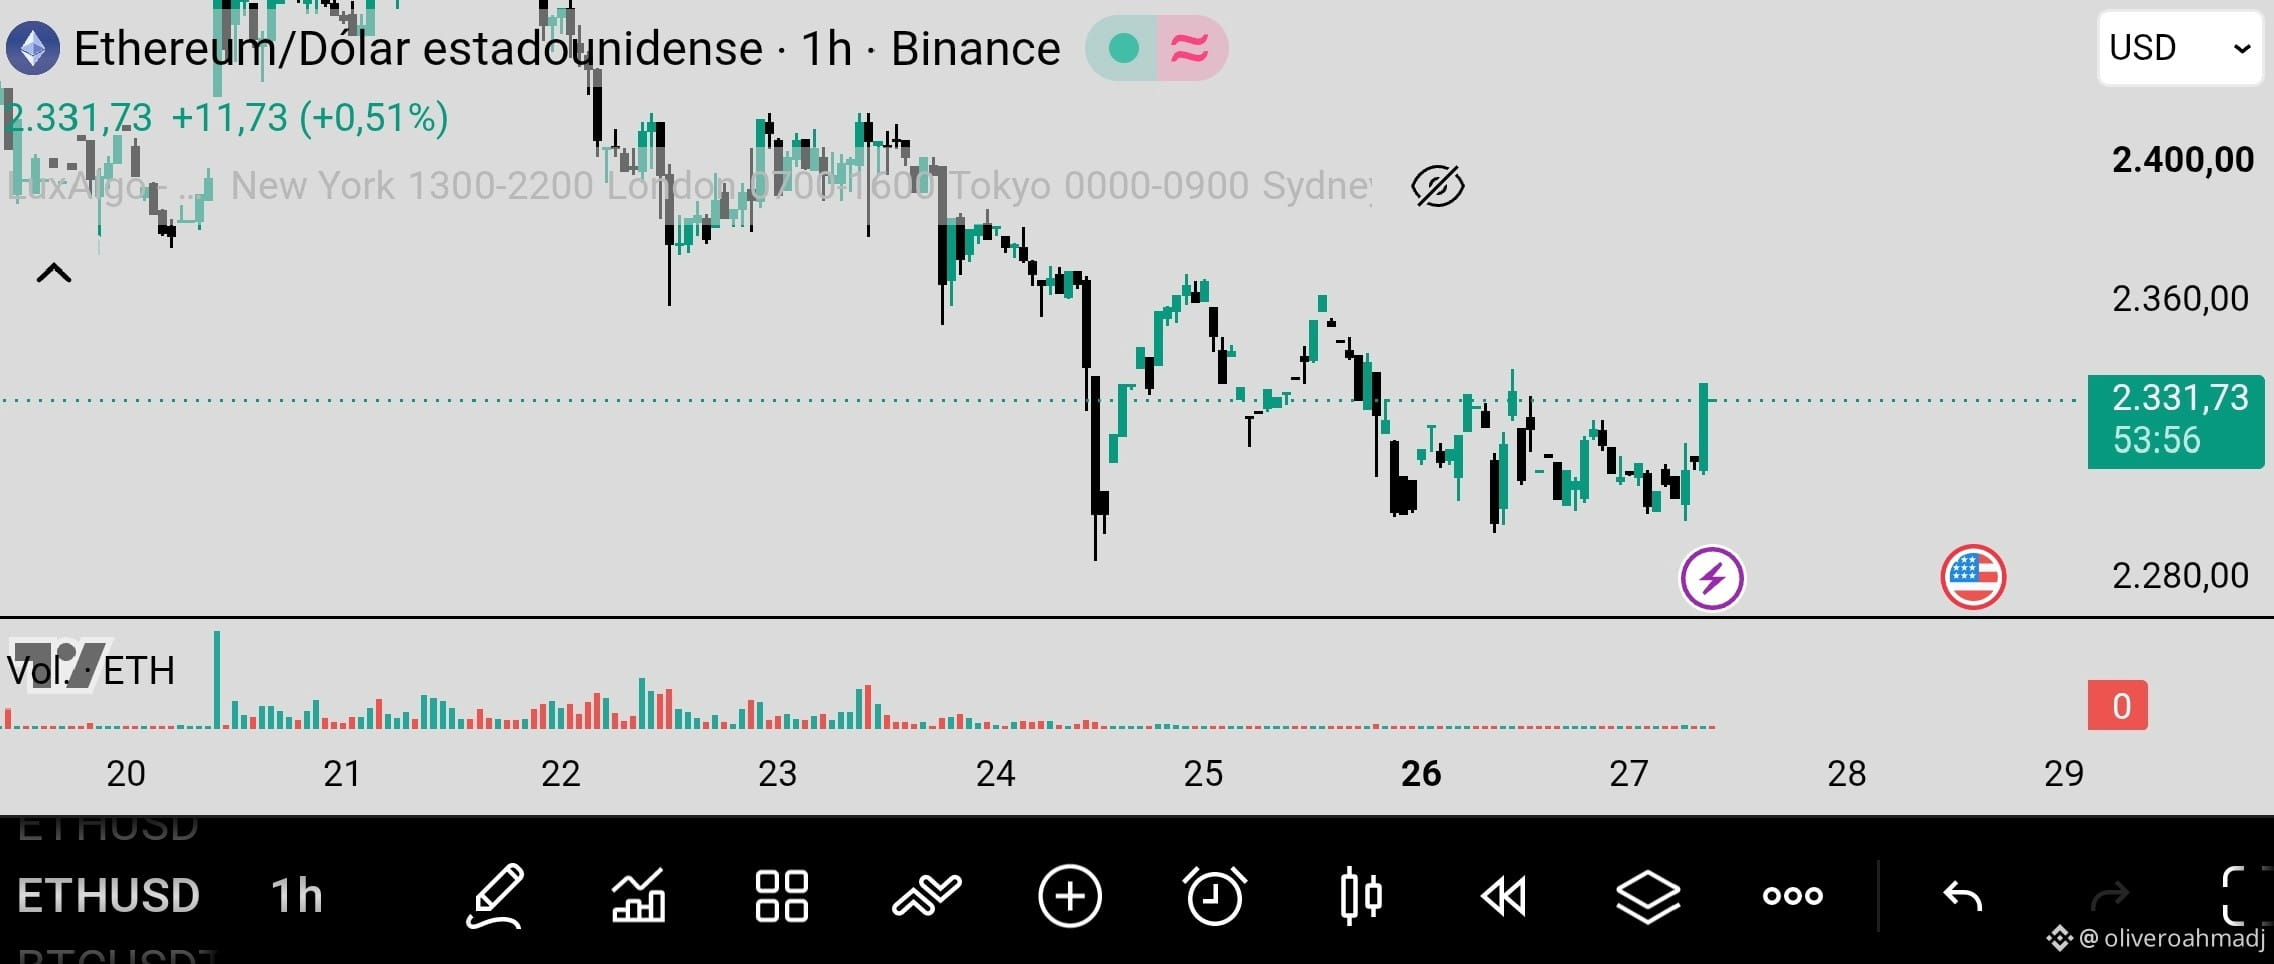
🚨 $ETH MOMENTUM FROM THE LOWER ZONE: TARGET AT 2,350 USD OR A NEW RETEST?
Price Action: Ethereum shows a bullish reaction after bouncing from its recent levels, trading around 2,331.73 USD on the 1-hour chart and recording a positive change of +0.51%
Upper Resistance Magnet: The 12-hour Liq Heatmap reveals a dense accumulation of liquidity and order blocks in the 2,354 USD range, shaping up as the immediate target for price
Support and Defense: On the lower side, the most relevant liquidation blocks extend firmly at the 2,281 USD level, serving as the main cushion of technical support
Market Structure: Price action reflects an increase in buying momentum after clearing lower liquidity zones, aiming to build a short-term recovery structure
Do you think this bullish momentum will manage to break the 2,350 USD resistance or will we see a rejection toward the support zone? Leave it in the comments! 👇
🔎 Monitor the order book depth and flow changes in real time from the official ETH/USD pair
#Ethereum #ETH #Crypto #Trading #ETHUSD
{future}(ETHUSDT)
🚨 $ETH MOMENTUM FROM THE LOWER ZONE: TARGET AT 2,350 USD OR A NEW RETEST?
Price Action: Ethereum shows a bullish reaction after bouncing from its recent levels, trading around 2,331.73 USD on the 1-hour chart and recording a positive change of +0.51%
Upper Resistance Magnet: The 12-hour Liq Heatmap reveals a dense accumulation of liquidity and order blocks in the 2,354 USD range, shaping up as the immediate target for price
Support and Defense: On the lower side, the most relevant liquidation blocks extend firmly at the 2,281 USD level, serving as the main cushion of technical support
Market Structure: Price action reflects an increase in buying momentum after clearing lower liquidity zones, aiming to build a short-term recovery structure
Do you think this bullish momentum will manage to break the 2,350 USD resistance or will we see a rejection toward the support zone? Leave it in the comments! 👇
🔎 Monitor the order book depth and flow changes in real time from the official ETH/USD pair
#Ethereum #ETH #Crypto #Trading #ETHUSD
Price Action: Ethereum shows a bullish reaction after bouncing from its recent levels, trading around 2,331.73 USD on the 1-hour chart and recording a positive change of +0.51%
Upper Resistance Magnet: The 12-hour Liq Heatmap reveals a dense accumulation of liquidity and order blocks in the 2,354 USD range, shaping up as the immediate target for price
Support and Defense: On the lower side, the most relevant liquidation blocks extend firmly at the 2,281 USD level, serving as the main cushion of technical support
Market Structure: Price action reflects an increase in buying momentum after clearing lower liquidity zones, aiming to build a short-term recovery structure
Do you think this bullish momentum will manage to break the 2,350 USD resistance or will we see a rejection toward the support zone? Leave it in the comments! 👇
🔎 Monitor the order book depth and flow changes in real time from the official ETH/USD pair
#Ethereum #ETH #Crypto #Trading #ETHUSD
144

$ETH
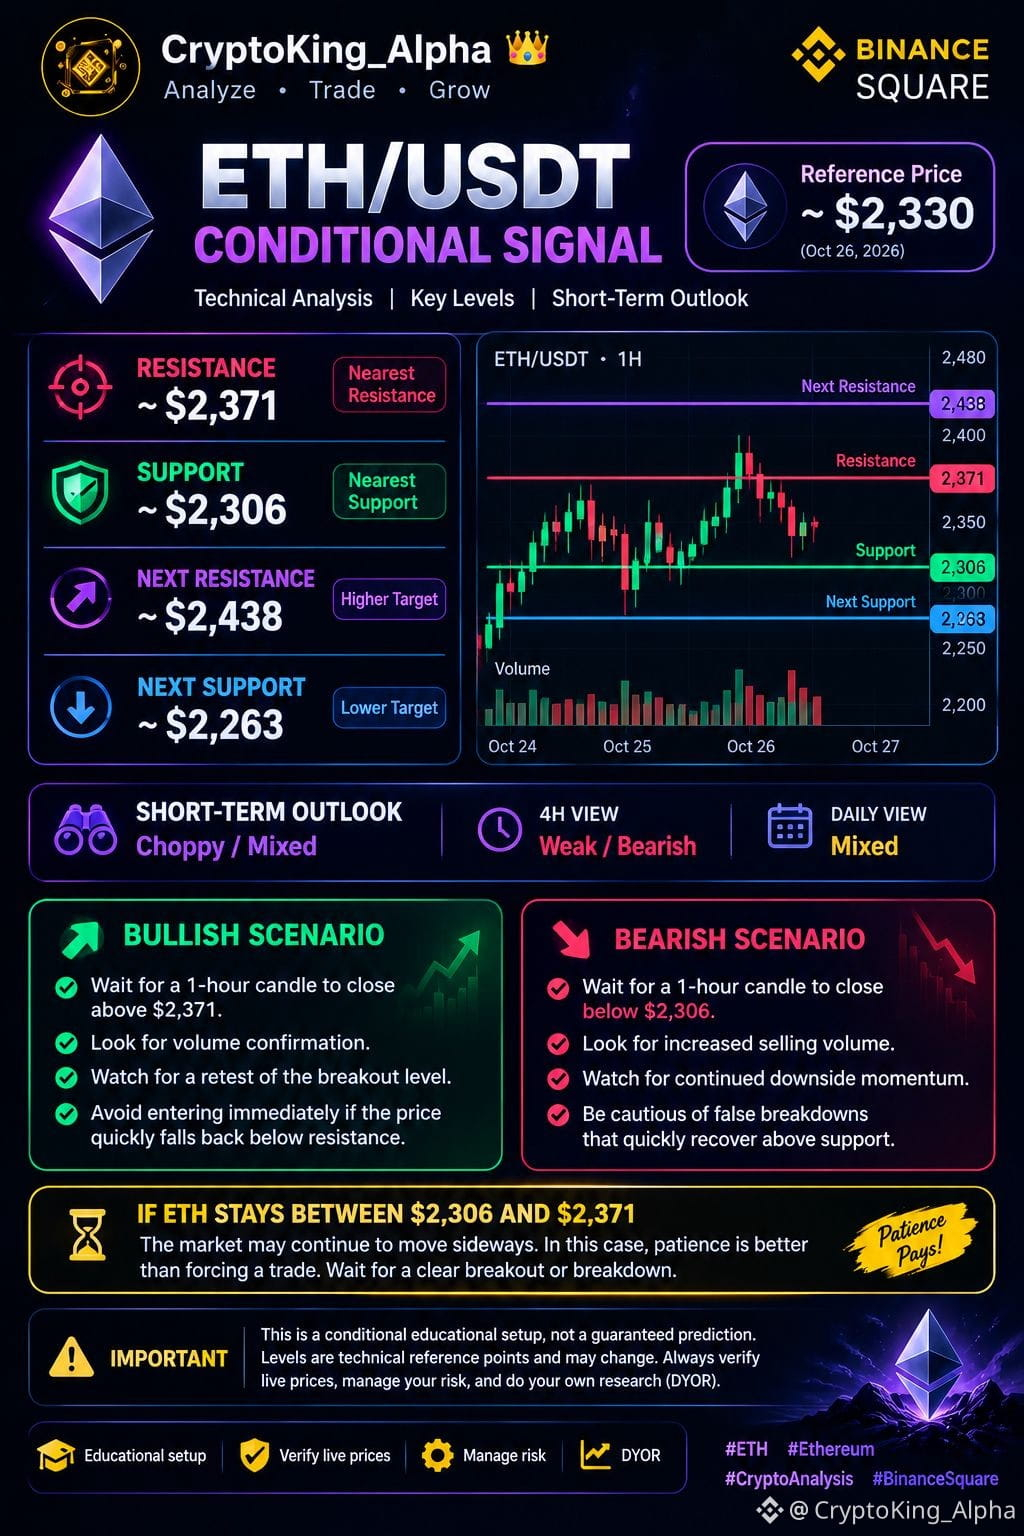
📊 ETH/USDT SIGNAL PLAN |
Ethereum is trading near the $2,330 area, with price action showing mixed short-term momentum. Traders should monitor the key support and resistance levels and wait for confirmation before making a decision.
🔴 Key Resistance: $2,371
The $2,371 level is the nearest resistance to watch. If ETH fails to break above this zone, sellers may push the price lower. However, a strong 1-hour candle close above $2,371, supported by increasing trading volume, could signal a potential bullish breakout. Traders should also watch for a successful retest before considering an entry.
🟢 Key Support: $2,306
The $2,306 level is the nearest support area. If buyers defend this zone, ETH may attempt another move toward resistance. However, if a 1-hour candle closes below $2,306 with strong selling volume, it could indicate further downside pressure.
📈 BULLISH SCENARIO
- Wait for a 1H candle close above $2,371.
- Look for strong volume confirmation.
- Watch for a successful retest of the breakout zone.
- Avoid chasing price after a sudden pump.
📉 BEARISH SCENARIO
- Wait for a 1H candle close below $2,306.
- Look for increased selling pressure.
- Watch for a retest of broken support as resistance.
- Be careful of false breakdowns.
⏳ NO-TRADE ZONE
If ETH remains between $2,306 and $2,371, the market may continue moving sideways. Patience is important—wait for a clearer setup rather than forcing a trade.
⚠️ These are technical reference levels, not guaranteed predictions. Verify the live ETH/USDT price before trading, manage position size carefully, and always do your own research (DYOR).
💬 What’s your view on ETH? Bullish breakout or bearish breakdown? Share your analysis below!
#ETH #Ethereum #ETHUSD #CryptoAnalysis #BinanceSquare
$ETH
📊 ETH/USDT SIGNAL PLAN |
Ethereum is trading near the $2,330 area, with price action showing mixed short-term momentum. Traders should monitor the key support and resistance levels and wait for confirmation before making a decision.
🔴 Key Resistance: $2,371
The $2,371 level is the nearest resistance to watch. If ETH fails to break above this zone, sellers may push the price lower. However, a strong 1-hour candle close above $2,371, supported by increasing trading volume, could signal a potential bullish breakout. Traders should also watch for a successful retest before considering an entry.
🟢 Key Support: $2,306
The $2,306 level is the nearest support area. If buyers defend this zone, ETH may attempt another move toward resistance. However, if a 1-hour candle closes below $2,306 with strong selling volume, it could indicate further downside pressure.
📈 BULLISH SCENARIO
- Wait for a 1H candle close above $2,371.
- Look for strong volume confirmation.
- Watch for a successful retest of the breakout zone.
- Avoid chasing price after a sudden pump.
📉 BEARISH SCENARIO
- Wait for a 1H candle close below $2,306.
- Look for increased selling pressure.
- Watch for a retest of broken support as resistance.
- Be careful of false breakdowns.
⏳ NO-TRADE ZONE
If ETH remains between $2,306 and $2,371, the market may continue moving sideways. Patience is important—wait for a clearer setup rather than forcing a trade.
⚠️ These are technical reference levels, not guaranteed predictions. Verify the live ETH/USDT price before trading, manage position size carefully, and always do your own research (DYOR).
💬 What’s your view on ETH? Bullish breakout or bearish breakdown? Share your analysis below!
#ETH #Ethereum #ETHUSD #CryptoAnalysis #BinanceSquare
📊 ETH/USDT SIGNAL PLAN |
Ethereum is trading near the $2,330 area, with price action showing mixed short-term momentum. Traders should monitor the key support and resistance levels and wait for confirmation before making a decision.
🔴 Key Resistance: $2,371
The $2,371 level is the nearest resistance to watch. If ETH fails to break above this zone, sellers may push the price lower. However, a strong 1-hour candle close above $2,371, supported by increasing trading volume, could signal a potential bullish breakout. Traders should also watch for a successful retest before considering an entry.
🟢 Key Support: $2,306
The $2,306 level is the nearest support area. If buyers defend this zone, ETH may attempt another move toward resistance. However, if a 1-hour candle closes below $2,306 with strong selling volume, it could indicate further downside pressure.
📈 BULLISH SCENARIO
- Wait for a 1H candle close above $2,371.
- Look for strong volume confirmation.
- Watch for a successful retest of the breakout zone.
- Avoid chasing price after a sudden pump.
📉 BEARISH SCENARIO
- Wait for a 1H candle close below $2,306.
- Look for increased selling pressure.
- Watch for a retest of broken support as resistance.
- Be careful of false breakdowns.
⏳ NO-TRADE ZONE
If ETH remains between $2,306 and $2,371, the market may continue moving sideways. Patience is important—wait for a clearer setup rather than forcing a trade.
⚠️ These are technical reference levels, not guaranteed predictions. Verify the live ETH/USDT price before trading, manage position size carefully, and always do your own research (DYOR).
💬 What’s your view on ETH? Bullish breakout or bearish breakdown? Share your analysis below!
#ETH #Ethereum #ETHUSD #CryptoAnalysis #BinanceSquare
57

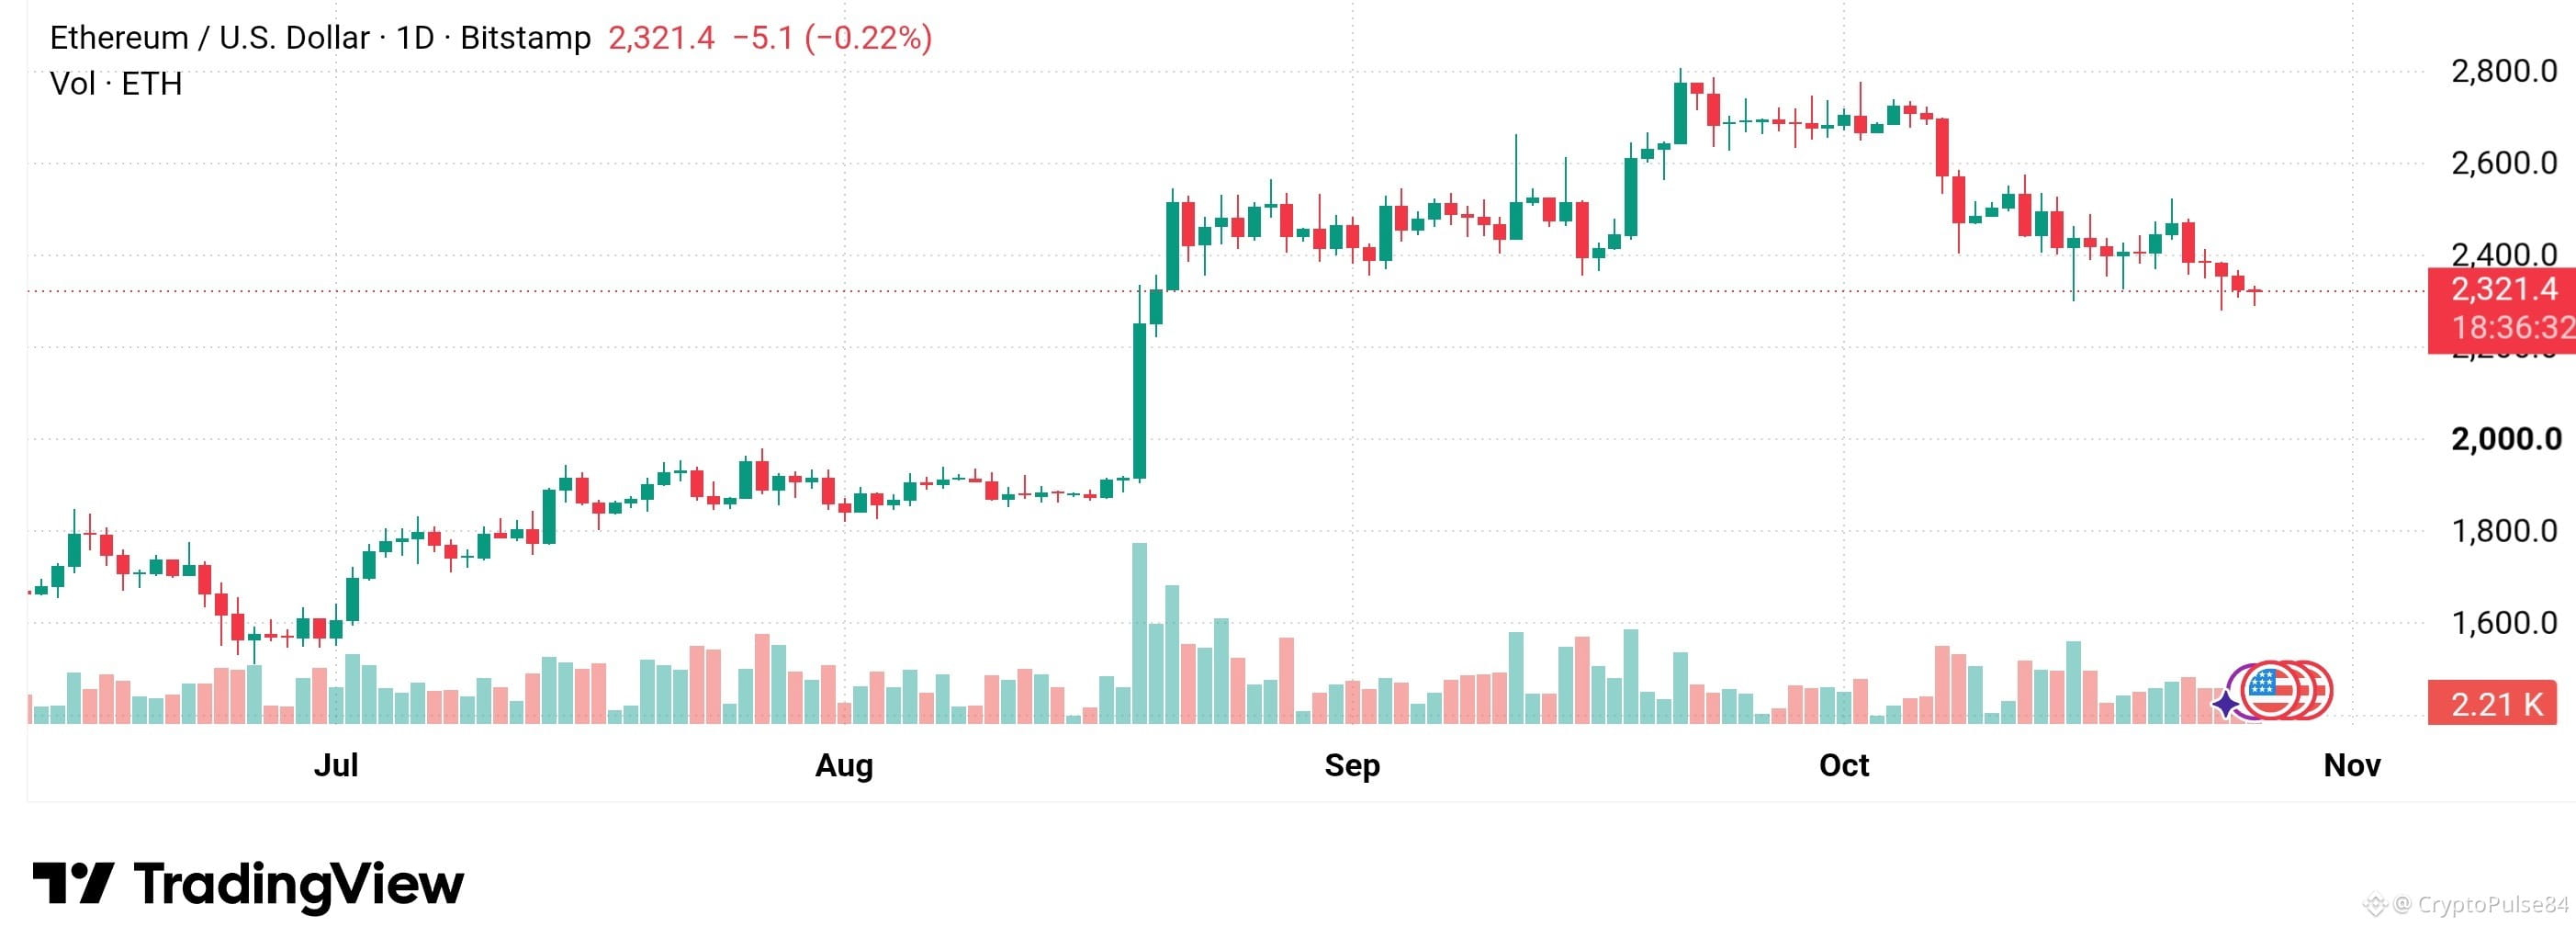
$ETH ETHUSD spot CFD saw $32.22M in 24h liquidations (≈$22.41M longs, $9.81M shorts); longs were 70–80% of total; perpetual futures drove most liquidations; largest ETH long exit on Binance.
#ETH #ETHUSD #ETHtradingview #BINANCE
$ETH ETHUSD spot CFD saw $32.22M in 24h liquidations (≈$22.41M longs, $9.81M shorts); longs were 70–80% of total; perpetual futures drove most liquidations; largest ETH long exit on Binance.
#ETH #ETHUSD #ETHtradingview #BINANCE
#ETH #ETHUSD #ETHtradingview #BINANCE
113

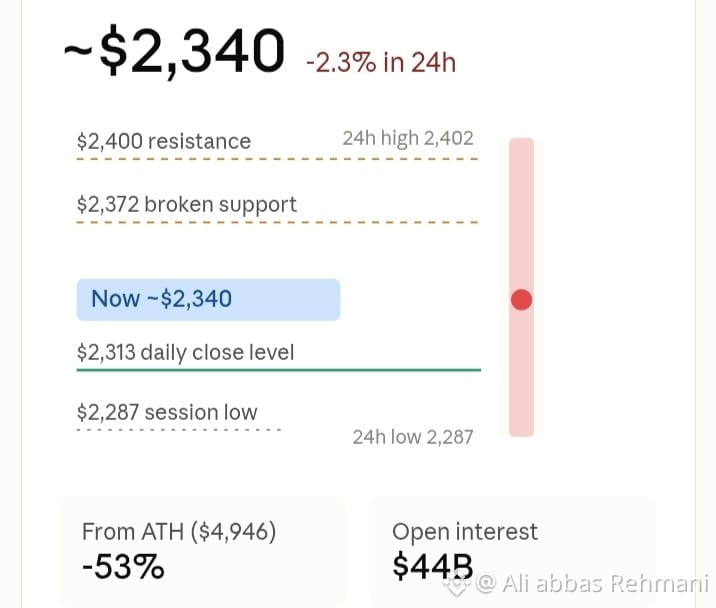
$ETH is trading around $2,340, down about 2.3% in 24 hours. It's roughly 53% below its $4,946 all-time high. The 24-hour range was about $2,287 to $2,402.
Support broke. It lost $2,372, and a sharp sell-off briefly pushed it under $2,313, a level flagged as a key daily close.
Leverage flush. About $184M in leveraged positions were liquidated, mostly longs. Open interest still sits near $44B, so liquidation risk remains.
Weak momentum. MACD shows a sell signal, RSI is about 38, and spot ETH ETFs are seeing redemptions.
Levels.
Support is $2,313, then the $2,287 session low.
Resistance is $2,372, then $2,400.
Bias. Bearish while below $2,372. A reclaim of $2,400 with ETF flows turning positive would shift the tone. A daily close under $2,287 risks a deeper pullback.
#Ethereum #ETH #crypto #ETHUSD
{spot}(ETHUSDT)
$ETH is trading around $2,340, down about 2.3% in 24 hours. It's roughly 53% below its $4,946 all-time high. The 24-hour range was about $2,287 to $2,402.
Support broke. It lost $2,372, and a sharp sell-off briefly pushed it under $2,313, a level flagged as a key daily close.
Leverage flush. About $184M in leveraged positions were liquidated, mostly longs. Open interest still sits near $44B, so liquidation risk remains.
Weak momentum. MACD shows a sell signal, RSI is about 38, and spot ETH ETFs are seeing redemptions.
Levels.
Support is $2,313, then the $2,287 session low.
Resistance is $2,372, then $2,400.
Bias. Bearish while below $2,372. A reclaim of $2,400 with ETF flows turning positive would shift the tone. A daily close under $2,287 risks a deeper pullback.
#Ethereum #ETH #crypto #ETHUSD
Support broke. It lost $2,372, and a sharp sell-off briefly pushed it under $2,313, a level flagged as a key daily close.
Leverage flush. About $184M in leveraged positions were liquidated, mostly longs. Open interest still sits near $44B, so liquidation risk remains.
Weak momentum. MACD shows a sell signal, RSI is about 38, and spot ETH ETFs are seeing redemptions.
Levels.
Support is $2,313, then the $2,287 session low.
Resistance is $2,372, then $2,400.
Bias. Bearish while below $2,372. A reclaim of $2,400 with ETF flows turning positive would shift the tone. A daily close under $2,287 risks a deeper pullback.
#Ethereum #ETH #crypto #ETHUSD
72

·
--
Article
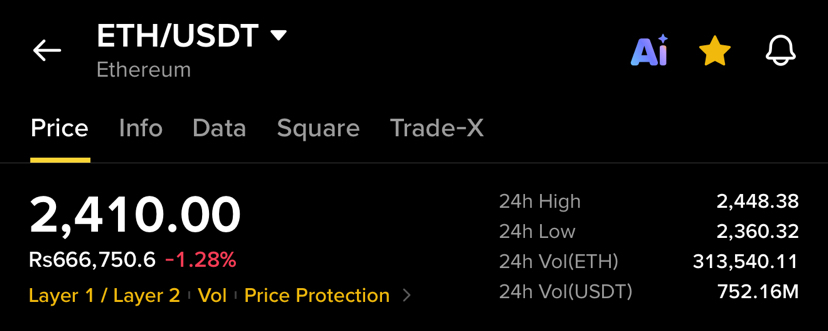
Ethereum (ETH) 1D Analysis: Is $2,400 the Next Big Turning Point? 📊ETH/USDT 1D Analysis: Ethereum at a Key Decision Zone 📊
Ethereum (ETH) is currently trading around $2,410, with the 24-hour price change showing approximately -1.28%.
Looking at the 1D chart, ETH has experienced a noticeable pullback from the higher levels seen earlier in the month. After reaching the $2,700–$2,800 area, price faced strong selling pressure and moved lower, eventually reaching the current region around $2,400.
At the moment, Ethereum appears to be trading inside a relatively important range, making the next few daily candles worth watching closely.
📉 Current Market Structure
The daily chart shows that ETH has moved from higher levels into a lower trading range.
After the strong decline from the $2,700+ zone, price has been attempting to stabilize around the $2,400 area. Several candles around this region show that buyers and sellers are actively competing for control.
The current price is approximately $2,410, while the 24-hour range is:
24H High: $2,448.38
24H Low: $2,360.32
24H Change: -1.28%
This suggests that short-term volatility remains present.
🔎 Important Levels to Watch
The $2,400 area is currently one of the most interesting zones on the chart.
If buyers manage to defend this region and ETH starts forming stronger daily candles, the price could attempt to move back toward the recent resistance areas.
On the other hand, if sellers push ETH below the recent low around $2,360, further weakness could become possible.
For the upside, the first area to watch is around $2,450, followed by the $2,500 region. A stronger move above these levels could improve the short-term structure.
📊 Higher-Timeframe Performance
ETH’s performance across different periods gives a mixed picture:
Today: +1.05%
7 Days: -1.70%
30 Days: -12.44%
90 Days: +29.36%
180 Days: +4.27%
1 Year: -36.63%
The 90-day performance remains positive, but the 30-day performance shows that Ethereum has experienced a significant correction recently.
This makes the current price area particularly interesting for traders and market watchers.
🐂 What Bulls Need to Watch
For the bullish side, ETH would ideally need to regain momentum and move back above the $2,450–$2,500 zone.
A sustained move above this area could indicate that buyers are becoming stronger again.
If momentum continues to improve, traders may then watch the previous higher areas around $2,600 and above.
However, confirmation from daily candles would be important rather than relying on a single price move.
🐻 What Bears Need to Watch
For sellers, the $2,360 area is an important level visible on the current chart.
A clear breakdown below this region could signal that the recent consolidation is failing and that sellers remain in control.
In that situation, the market could become more volatile, so waiting for confirmation may be safer than reacting to one candle.
👀 My Take on the Chart
At the moment, I would describe the ETH/USDT 1D chart as cautious and undecided.
Ethereum has already experienced a significant decline from the higher levels earlier in the month, but the current price is showing some signs of stabilization around $2,400.
The next few daily candles could therefore be important.
Instead of predicting an immediate breakout or breakdown, I would watch how ETH reacts around $2,360–$2,400 on the downside and $2,450–$2,500 on the upside.
A confirmed move outside this range could provide a clearer indication of the next direction.
💬 What do you think?
Will ETH reclaim the $2,500 level, or will sellers push the price below $2,360?
Share your view in the comments. 👇
#binance #ETHUSD $ETH
{spot}(ETHUSDT)
Ethereum (ETH) 1D Analysis: Is $2,400 the Next Big Turning Point? 📊
ETH/USDT 1D Analysis: Ethereum at a Key Decision Zone 📊
Ethereum (ETH) is currently trading around $2,410, with the 24-hour price change showing approximately -1.28%.
Looking at the 1D chart, ETH has experienced a noticeable pullback from the higher levels seen earlier in the month. After reaching the $2,700–$2,800 area, price faced strong selling pressure and moved lower, eventually reaching the current region around $2,400.
At the moment, Ethereum appears to be trading inside a relatively important range, making the next few daily candles worth watching closely.
📉 Current Market Structure
The daily chart shows that ETH has moved from higher levels into a lower trading range.
After the strong decline from the $2,700+ zone, price has been attempting to stabilize around the $2,400 area. Several candles around this region show that buyers and sellers are actively competing for control.
The current price is approximately $2,410, while the 24-hour range is:
24H High: $2,448.38
24H Low: $2,360.32
24H Change: -1.28%
This suggests that short-term volatility remains present.
🔎 Important Levels to Watch
The $2,400 area is currently one of the most interesting zones on the chart.
If buyers manage to defend this region and ETH starts forming stronger daily candles, the price could attempt to move back toward the recent resistance areas.
On the other hand, if sellers push ETH below the recent low around $2,360, further weakness could become possible.
For the upside, the first area to watch is around $2,450, followed by the $2,500 region. A stronger move above these levels could improve the short-term structure.
📊 Higher-Timeframe Performance
ETH’s performance across different periods gives a mixed picture:
Today: +1.05%
7 Days: -1.70%
30 Days: -12.44%
90 Days: +29.36%
180 Days: +4.27%
1 Year: -36.63%
The 90-day performance remains positive, but the 30-day performance shows that Ethereum has experienced a significant correction recently.
This makes the current price area particularly interesting for traders and market watchers.
🐂 What Bulls Need to Watch
For the bullish side, ETH would ideally need to regain momentum and move back above the $2,450–$2,500 zone.
A sustained move above this area could indicate that buyers are becoming stronger again.
If momentum continues to improve, traders may then watch the previous higher areas around $2,600 and above.
However, confirmation from daily candles would be important rather than relying on a single price move.
🐻 What Bears Need to Watch
For sellers, the $2,360 area is an important level visible on the current chart.
A clear breakdown below this region could signal that the recent consolidation is failing and that sellers remain in control.
In that situation, the market could become more volatile, so waiting for confirmation may be safer than reacting to one candle.
👀 My Take on the Chart
At the moment, I would describe the ETH/USDT 1D chart as cautious and undecided.
Ethereum has already experienced a significant decline from the higher levels earlier in the month, but the current price is showing some signs of stabilization around $2,400.
The next few daily candles could therefore be important.
Instead of predicting an immediate breakout or breakdown, I would watch how ETH reacts around $2,360–$2,400 on the downside and $2,450–$2,500 on the upside.
A confirmed move outside this range could provide a clearer indication of the next direction.
💬 What do you think?
Will ETH reclaim the $2,500 level, or will sellers push the price below $2,360?
Share your view in the comments. 👇
#binance #ETHUSD $ETH
Ethereum (ETH) is currently trading around $2,410, with the 24-hour price change showing approximately -1.28%.
Looking at the 1D chart, ETH has experienced a noticeable pullback from the higher levels seen earlier in the month. After reaching the $2,700–$2,800 area, price faced strong selling pressure and moved lower, eventually reaching the current region around $2,400.
At the moment, Ethereum appears to be trading inside a relatively important range, making the next few daily candles worth watching closely.
📉 Current Market Structure
The daily chart shows that ETH has moved from higher levels into a lower trading range.
After the strong decline from the $2,700+ zone, price has been attempting to stabilize around the $2,400 area. Several candles around this region show that buyers and sellers are actively competing for control.
The current price is approximately $2,410, while the 24-hour range is:
24H High: $2,448.38
24H Low: $2,360.32
24H Change: -1.28%
This suggests that short-term volatility remains present.
🔎 Important Levels to Watch
The $2,400 area is currently one of the most interesting zones on the chart.
If buyers manage to defend this region and ETH starts forming stronger daily candles, the price could attempt to move back toward the recent resistance areas.
On the other hand, if sellers push ETH below the recent low around $2,360, further weakness could become possible.
For the upside, the first area to watch is around $2,450, followed by the $2,500 region. A stronger move above these levels could improve the short-term structure.
📊 Higher-Timeframe Performance
ETH’s performance across different periods gives a mixed picture:
Today: +1.05%
7 Days: -1.70%
30 Days: -12.44%
90 Days: +29.36%
180 Days: +4.27%
1 Year: -36.63%
The 90-day performance remains positive, but the 30-day performance shows that Ethereum has experienced a significant correction recently.
This makes the current price area particularly interesting for traders and market watchers.
🐂 What Bulls Need to Watch
For the bullish side, ETH would ideally need to regain momentum and move back above the $2,450–$2,500 zone.
A sustained move above this area could indicate that buyers are becoming stronger again.
If momentum continues to improve, traders may then watch the previous higher areas around $2,600 and above.
However, confirmation from daily candles would be important rather than relying on a single price move.
🐻 What Bears Need to Watch
For sellers, the $2,360 area is an important level visible on the current chart.
A clear breakdown below this region could signal that the recent consolidation is failing and that sellers remain in control.
In that situation, the market could become more volatile, so waiting for confirmation may be safer than reacting to one candle.
👀 My Take on the Chart
At the moment, I would describe the ETH/USDT 1D chart as cautious and undecided.
Ethereum has already experienced a significant decline from the higher levels earlier in the month, but the current price is showing some signs of stabilization around $2,400.
The next few daily candles could therefore be important.
Instead of predicting an immediate breakout or breakdown, I would watch how ETH reacts around $2,360–$2,400 on the downside and $2,450–$2,500 on the upside.
A confirmed move outside this range could provide a clearer indication of the next direction.
💬 What do you think?
Will ETH reclaim the $2,500 level, or will sellers push the price below $2,360?
Share your view in the comments. 👇
#binance #ETHUSD $ETH
145

🚨 ETHEREUM ($ETH ) PRICE UPDATE 🚨
📅 Date: October 15, 2026
💰 Current Price: $2,411 USD 🇵🇰 Pakistani Rupees: Rs. 668,651 (Approx.) 📉 Market Trend: Bearish 📉
Ethereum is experiencing price fluctuations today as the crypto market continues to move. 📊
💡 Stay updated, analyze the market, and always do your own research before investing!
⚠️ Crypto trading involves risk. Invest responsibly.
🚀 ETHEREUM ($ETH ) PRICE UPDATE 📊
💎 Ethereum continues to make waves in the crypto market!
💰 Price: $2,400 (approx.) 🇵🇰 PKR Value: Rs. 668,000 (approx.) 📉 24-Hour Change: -3.7%
📊 The crypto market is constantly changing. Keep an eye on Ethereum's price movements and stay updated with the latest market trends.
⚠️ Remember: Always do your own research before investing. Crypto markets are highly volatile.
🔥 Follow for more crypto updates!
#ETH #Ethereum #ETHPrice #Crypto #CryptoNews #CryptoMarket #Bitcoin #Altcoins #Blockchain #CryptoTrading #ETHUSD #Binance #PakistanCrypto #Cryptocurrency #TradingUpdate #CryptoCommunity #Web3 #DeFi
{spot}(ETHUSDT)
🚨 ETHEREUM ($ETH ) PRICE UPDATE 🚨
📅 Date: October 15, 2026
💰 Current Price: $2,411 USD 🇵🇰 Pakistani Rupees: Rs. 668,651 (Approx.) 📉 Market Trend: Bearish 📉
Ethereum is experiencing price fluctuations today as the crypto market continues to move. 📊
💡 Stay updated, analyze the market, and always do your own research before investing!
⚠️ Crypto trading involves risk. Invest responsibly.
🚀 ETHEREUM ($ETH ) PRICE UPDATE 📊
💎 Ethereum continues to make waves in the crypto market!
💰 Price: $2,400 (approx.) 🇵🇰 PKR Value: Rs. 668,000 (approx.) 📉 24-Hour Change: -3.7%
📊 The crypto market is constantly changing. Keep an eye on Ethereum's price movements and stay updated with the latest market trends.
⚠️ Remember: Always do your own research before investing. Crypto markets are highly volatile.
🔥 Follow for more crypto updates!
#ETH #Ethereum #ETHPrice #Crypto #CryptoNews #CryptoMarket #Bitcoin #Altcoins #Blockchain #CryptoTrading #ETHUSD #Binance #PakistanCrypto #Cryptocurrency #TradingUpdate #CryptoCommunity #Web3 #DeFi
📅 Date: October 15, 2026
💰 Current Price: $2,411 USD 🇵🇰 Pakistani Rupees: Rs. 668,651 (Approx.) 📉 Market Trend: Bearish 📉
Ethereum is experiencing price fluctuations today as the crypto market continues to move. 📊
💡 Stay updated, analyze the market, and always do your own research before investing!
⚠️ Crypto trading involves risk. Invest responsibly.
🚀 ETHEREUM ($ETH ) PRICE UPDATE 📊
💎 Ethereum continues to make waves in the crypto market!
💰 Price: $2,400 (approx.) 🇵🇰 PKR Value: Rs. 668,000 (approx.) 📉 24-Hour Change: -3.7%
📊 The crypto market is constantly changing. Keep an eye on Ethereum's price movements and stay updated with the latest market trends.
⚠️ Remember: Always do your own research before investing. Crypto markets are highly volatile.
🔥 Follow for more crypto updates!
#ETH #Ethereum #ETHPrice #Crypto #CryptoNews #CryptoMarket #Bitcoin #Altcoins #Blockchain #CryptoTrading #ETHUSD #Binance #PakistanCrypto #Cryptocurrency #TradingUpdate #CryptoCommunity #Web3 #DeFi

115

·
--
Ethereum ($ETH) Market Update! 📊⚡
Ethereum is currently trading in the $2,510 – $2,530 range today. Following the recent market pullback, prices are attempting to stabilize, but $ETH faces a key resistance level before making its next major move.
📊 Key Technical Levels:
🔹 Current Price: ~$2,510 – $2,530
🔹 Key Resistance: $2,560 – $2,575 (Crucial breakout level for a push toward $2,700)
🔹 Key Support: $2,480 – $2,500 zone
💡 Market Sentiment: Despite recent ETF outflows, buyers remain active near the support zone, with solid accumulation activity around these levels.
Do you think Ethereum will break above $2,575 this week? Let us know in the comments below! 👇
#Ethereum #ETH #CryptoUpdate #CryptoNews #cryptotrading #ETHUSD
Ethereum ($ETH) Market Update! 📊⚡
Ethereum is currently trading in the $2,510 – $2,530 range today. Following the recent market pullback, prices are attempting to stabilize, but $ETH faces a key resistance level before making its next major move.
📊 Key Technical Levels:
🔹 Current Price: ~$2,510 – $2,530
🔹 Key Resistance: $2,560 – $2,575 (Crucial breakout level for a push toward $2,700)
🔹 Key Support: $2,480 – $2,500 zone
💡 Market Sentiment: Despite recent ETF outflows, buyers remain active near the support zone, with solid accumulation activity around these levels.
Do you think Ethereum will break above $2,575 this week? Let us know in the comments below! 👇
#Ethereum #ETH #CryptoUpdate #CryptoNews #cryptotrading #ETHUSD
Ethereum is currently trading in the $2,510 – $2,530 range today. Following the recent market pullback, prices are attempting to stabilize, but $ETH faces a key resistance level before making its next major move.
📊 Key Technical Levels:
🔹 Current Price: ~$2,510 – $2,530
🔹 Key Resistance: $2,560 – $2,575 (Crucial breakout level for a push toward $2,700)
🔹 Key Support: $2,480 – $2,500 zone
💡 Market Sentiment: Despite recent ETF outflows, buyers remain active near the support zone, with solid accumulation activity around these levels.
Do you think Ethereum will break above $2,575 this week? Let us know in the comments below! 👇
#Ethereum #ETH #CryptoUpdate #CryptoNews #cryptotrading #ETHUSD
97

·
--
Bullish
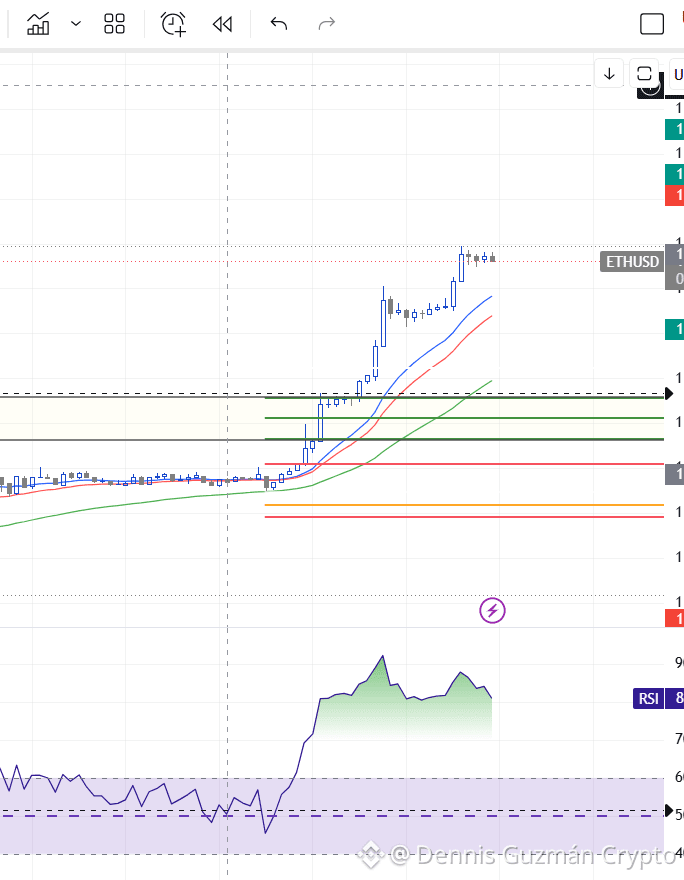
$ETH shows a strong bullish momentum that positions us in favor of the immediate trend. However, jumping in at the current price is high risk.
{future}(ETHUSDT)
My Execution Plan:
I will wait for a healthy pullback (discount) towards the key confluence zone before looking for short-term positions:
RSI: Waiting for a return and test of the 50% level. (ALERT)
Support/Resistance: Re-test of the broken resistance level (now macro support).
Imbalance: Mitigation of the visible imbalance left by institutional strength.
Patience pays! $ETH What do you think about this buying zone?
#Ethereum #ETHUSD #Trading #AnalisisTecnico
$ETH shows a strong bullish momentum that positions us in favor of the immediate trend. However, jumping in at the current price is high risk.
My Execution Plan:
I will wait for a healthy pullback (discount) towards the key confluence zone before looking for short-term positions:
RSI: Waiting for a return and test of the 50% level. (ALERT)
Support/Resistance: Re-test of the broken resistance level (now macro support).
Imbalance: Mitigation of the visible imbalance left by institutional strength.
Patience pays! $ETH What do you think about this buying zone?
#Ethereum #ETHUSD #Trading #AnalisisTecnico
My Execution Plan:
I will wait for a healthy pullback (discount) towards the key confluence zone before looking for short-term positions:
RSI: Waiting for a return and test of the 50% level. (ALERT)
Support/Resistance: Re-test of the broken resistance level (now macro support).
Imbalance: Mitigation of the visible imbalance left by institutional strength.
Patience pays! $ETH What do you think about this buying zone?
#Ethereum #ETHUSD #Trading #AnalisisTecnico
1
1
569

·
--
Talent is shared by all in the crypto space. In the current wave of wealth redistribution in the crypto world, a clear inverted hammer pattern has triggered on the 1-hour chart for ETHUSD.
This is not just a technical signal; it reflects a subtle shift in the underlying market logic—after experiencing significant sell pressure and panic-driven dip buying, bullish forces are gearing up for a counterattack.
We shouldn't blindly FOMO into the current price of 2027.65. The way of seasoned traders is to patiently wait for the whales to set the stage. What we seek is the ultimate value play on the left side of the trade. Even if we missed this launch point by a hair, it's not a loss; it's building strength for an even better entry point down the line.
From the data, the price in this cycle peaked at 2029.54 and dipped close to 2018.71. After such a wide range of fluctuations, this inverted hammer undoubtedly offers an attractive "value window." Patience in setting our nets is key to catching the momentum shift early.
#ETHUSD
Talent is shared by all in the crypto space. In the current wave of wealth redistribution in the crypto world, a clear inverted hammer pattern has triggered on the 1-hour chart for ETHUSD.
This is not just a technical signal; it reflects a subtle shift in the underlying market logic—after experiencing significant sell pressure and panic-driven dip buying, bullish forces are gearing up for a counterattack.
We shouldn't blindly FOMO into the current price of 2027.65. The way of seasoned traders is to patiently wait for the whales to set the stage. What we seek is the ultimate value play on the left side of the trade. Even if we missed this launch point by a hair, it's not a loss; it's building strength for an even better entry point down the line.
From the data, the price in this cycle peaked at 2029.54 and dipped close to 2018.71. After such a wide range of fluctuations, this inverted hammer undoubtedly offers an attractive "value window." Patience in setting our nets is key to catching the momentum shift early.
#ETHUSD
This is not just a technical signal; it reflects a subtle shift in the underlying market logic—after experiencing significant sell pressure and panic-driven dip buying, bullish forces are gearing up for a counterattack.
We shouldn't blindly FOMO into the current price of 2027.65. The way of seasoned traders is to patiently wait for the whales to set the stage. What we seek is the ultimate value play on the left side of the trade. Even if we missed this launch point by a hair, it's not a loss; it's building strength for an even better entry point down the line.
From the data, the price in this cycle peaked at 2029.54 and dipped close to 2018.71. After such a wide range of fluctuations, this inverted hammer undoubtedly offers an attractive "value window." Patience in setting our nets is key to catching the momentum shift early.
#ETHUSD
179
·
--
In the crypto world, fortunes aren't determined by a single day's wild swings. The reallocation of wealth in the crypto sphere is essentially an eternal game of fear and greed playing out at different stages.
【Today’s Observation: ETHUSD Inverted Hammer Pattern】
On the 1-hour chart of ETHUSD, we've spotted a classic 'inverted hammer' pattern. This isn't just a simple candlestick show; it reveals underlying logic: when the price hit a low of 2023.89, selling pressure reached a critical point, but then strong buying stepped in, pushing the price back up to a high of 2029.68, forming a robust long lower shadow signal. This indicates that the major players have completed the first wash and probe in the bottom area.
Old-timers know that it's not about chasing highs and cutting losses; it's about patiently waiting for the best entry point. Now that the signal has appeared, we should adopt a left-side precision entry strategy:
▶ Trigger Entry Point: Wait for price confirmation to break the bottom, placing a buy order near 2023.89 or slightly lower (like 2023.50).
▶ Stop Loss Risk Control: Set it in a relatively loose safety zone, below the pattern's low, say at 2023.00.
▶ Target Planning: Short-term target aimed at the high of 2029.68, while also placing staggered orders for longer-term targets, awaiting the next wave of funding.
Opportunities always favor those who can restrain their instincts and plan ahead. This inverted hammer is a free 'left-side' entry ticket from the universe. Those who can recognize this setup are rare, indeed.
#ETHUSD
In the crypto world, fortunes aren't determined by a single day's wild swings. The reallocation of wealth in the crypto sphere is essentially an eternal game of fear and greed playing out at different stages.
【Today’s Observation: ETHUSD Inverted Hammer Pattern】
On the 1-hour chart of ETHUSD, we've spotted a classic 'inverted hammer' pattern. This isn't just a simple candlestick show; it reveals underlying logic: when the price hit a low of 2023.89, selling pressure reached a critical point, but then strong buying stepped in, pushing the price back up to a high of 2029.68, forming a robust long lower shadow signal. This indicates that the major players have completed the first wash and probe in the bottom area.
Old-timers know that it's not about chasing highs and cutting losses; it's about patiently waiting for the best entry point. Now that the signal has appeared, we should adopt a left-side precision entry strategy:
▶ Trigger Entry Point: Wait for price confirmation to break the bottom, placing a buy order near 2023.89 or slightly lower (like 2023.50).
▶ Stop Loss Risk Control: Set it in a relatively loose safety zone, below the pattern's low, say at 2023.00.
▶ Target Planning: Short-term target aimed at the high of 2029.68, while also placing staggered orders for longer-term targets, awaiting the next wave of funding.
Opportunities always favor those who can restrain their instincts and plan ahead. This inverted hammer is a free 'left-side' entry ticket from the universe. Those who can recognize this setup are rare, indeed.
#ETHUSD
【Today’s Observation: ETHUSD Inverted Hammer Pattern】
On the 1-hour chart of ETHUSD, we've spotted a classic 'inverted hammer' pattern. This isn't just a simple candlestick show; it reveals underlying logic: when the price hit a low of 2023.89, selling pressure reached a critical point, but then strong buying stepped in, pushing the price back up to a high of 2029.68, forming a robust long lower shadow signal. This indicates that the major players have completed the first wash and probe in the bottom area.
Old-timers know that it's not about chasing highs and cutting losses; it's about patiently waiting for the best entry point. Now that the signal has appeared, we should adopt a left-side precision entry strategy:
▶ Trigger Entry Point: Wait for price confirmation to break the bottom, placing a buy order near 2023.89 or slightly lower (like 2023.50).
▶ Stop Loss Risk Control: Set it in a relatively loose safety zone, below the pattern's low, say at 2023.00.
▶ Target Planning: Short-term target aimed at the high of 2029.68, while also placing staggered orders for longer-term targets, awaiting the next wave of funding.
Opportunities always favor those who can restrain their instincts and plan ahead. This inverted hammer is a free 'left-side' entry ticket from the universe. Those who can recognize this setup are rare, indeed.
#ETHUSD
157

·
--
BTCUSD: The last wave of the bullish impulse continues to develop, and you can open long positions with expectations for price increase, setting a take profit level at 83,132.33.
XRPUSD: The price is climbing within a sideways corrective wave (flat), and you can open long positions with expectations for price rise, setting a take profit level at 1.545.
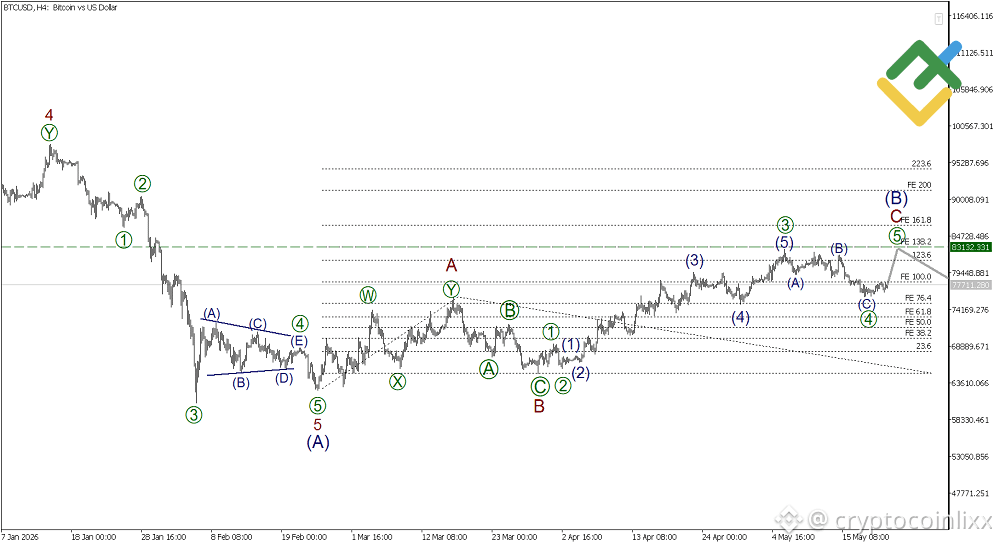
ETHUSD: The price might rise within the last wave of the corrective wave [B], and you can open long positions with expectations for price increase, setting a take profit level at 2,462.00
Elliott Wave Analysis for Bitcoin
Bitcoin is likely to form a simple zigzag wave consisting of waves (A), (B), and (C). The first impulse wave (A) has completed, while the corrective wave (B) is currently developing as a horizontal pattern of waves A, B, and C. The corrective waves A and B have already completed, and the price is now rising within the final impulse wave C, with the potential to rise towards the level of 83,132.33. At this level, the impulse wave C will reach 138.2% of the sub-corrective wave A.#BitcoinDunyamiz #bitcoin #ETHUSD #XRPUSD #BTCUSDTAnalysis $BTC $ETH $USDC
BTCUSD: The last wave of the bullish impulse continues to develop, and you can open long positions with expectations for price increase, setting a take profit level at 83,132.33.
XRPUSD: The price is climbing within a sideways corrective wave (flat), and you can open long positions with expectations for price rise, setting a take profit level at 1.545.
ETHUSD: The price might rise within the last wave of the corrective wave [B], and you can open long positions with expectations for price increase, setting a take profit level at 2,462.00
Elliott Wave Analysis for Bitcoin
Bitcoin is likely to form a simple zigzag wave consisting of waves (A), (B), and (C). The first impulse wave (A) has completed, while the corrective wave (B) is currently developing as a horizontal pattern of waves A, B, and C. The corrective waves A and B have already completed, and the price is now rising within the final impulse wave C, with the potential to rise towards the level of 83,132.33. At this level, the impulse wave C will reach 138.2% of the sub-corrective wave A.#BitcoinDunyamiz #bitcoin #ETHUSD #XRPUSD #BTCUSDTAnalysis $BTC $ETH $USDC
XRPUSD: The price is climbing within a sideways corrective wave (flat), and you can open long positions with expectations for price rise, setting a take profit level at 1.545.
ETHUSD: The price might rise within the last wave of the corrective wave [B], and you can open long positions with expectations for price increase, setting a take profit level at 2,462.00
Elliott Wave Analysis for Bitcoin
Bitcoin is likely to form a simple zigzag wave consisting of waves (A), (B), and (C). The first impulse wave (A) has completed, while the corrective wave (B) is currently developing as a horizontal pattern of waves A, B, and C. The corrective waves A and B have already completed, and the price is now rising within the final impulse wave C, with the potential to rise towards the level of 83,132.33. At this level, the impulse wave C will reach 138.2% of the sub-corrective wave A.#BitcoinDunyamiz #bitcoin #ETHUSD #XRPUSD #BTCUSDTAnalysis $BTC $ETH $USDC
245

$ETH USDC ETHUSDC SHORTS REKT!
$9.2184K liquidated at $2,909.85
Bullish pressure rising! #ETHUSD
#CangoQ1BitcoinMiningRevenue #XRPETF15.2MWeeklyInflow #BTCSpotETF1.42BOutflow C
$ETH USDC ETHUSDC SHORTS REKT!
$9.2184K liquidated at $2,909.85
Bullish pressure rising! #ETHUSD
#CangoQ1BitcoinMiningRevenue #XRPETF15.2MWeeklyInflow #BTCSpotETF1.42BOutflow C
$9.2184K liquidated at $2,909.85
Bullish pressure rising! #ETHUSD
#CangoQ1BitcoinMiningRevenue #XRPETF15.2MWeeklyInflow #BTCSpotETF1.42BOutflow C
83

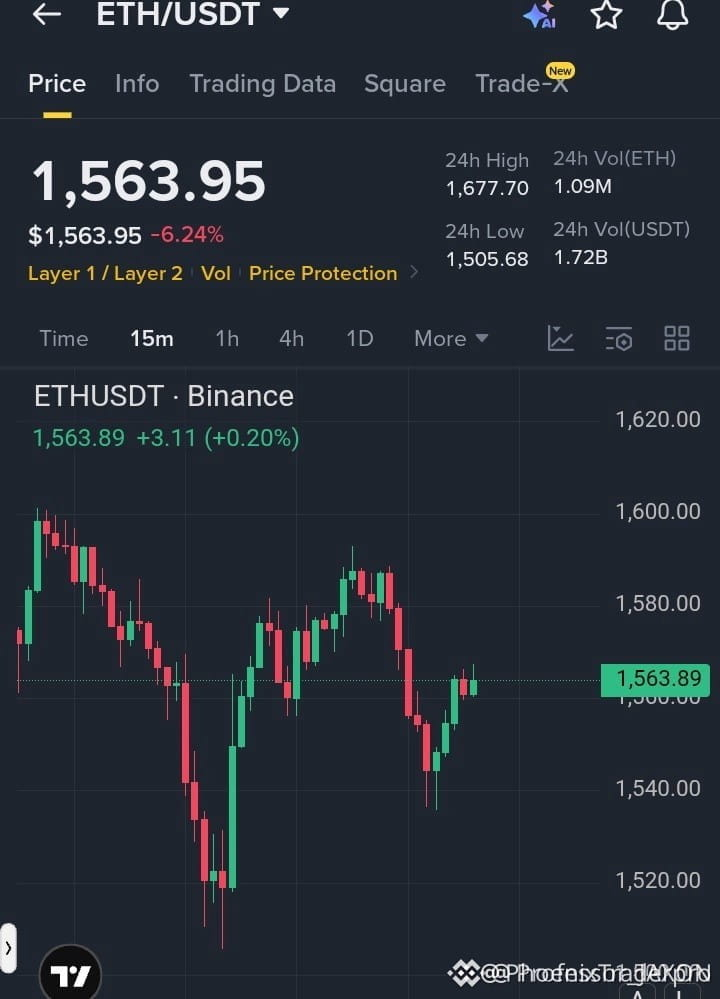
$ETH REVERSAL BOUNCE JUST GOT LOUD 🚀
1,555 - 1,565 🔥
1,580 / 1,595 / 1,615 🚀
1,535 🛑
$ETH is snapping back with bulls pressing the recovery lane. Momentum is shifting fast, and this setup is all about execution, not emotion. If price confirms strength, the upside zones are in play. If invalidated, respect the stop and move clean.
Not financial advice. Manage your risk.
#Ethereum #ETHUSD #CryptoTrading #BinanceSquare
⚡
{future}(ETHUSDT)
$ETH REVERSAL BOUNCE JUST GOT LOUD 🚀
1,555 - 1,565 🔥
1,580 / 1,595 / 1,615 🚀
1,535 🛑
$ETH is snapping back with bulls pressing the recovery lane. Momentum is shifting fast, and this setup is all about execution, not emotion. If price confirms strength, the upside zones are in play. If invalidated, respect the stop and move clean.
Not financial advice. Manage your risk.
#Ethereum #ETHUSD #CryptoTrading #BinanceSquare
⚡
1,555 - 1,565 🔥
1,580 / 1,595 / 1,615 🚀
1,535 🛑
$ETH is snapping back with bulls pressing the recovery lane. Momentum is shifting fast, and this setup is all about execution, not emotion. If price confirms strength, the upside zones are in play. If invalidated, respect the stop and move clean.
Not financial advice. Manage your risk.
#Ethereum #ETHUSD #CryptoTrading #BinanceSquare
⚡
73

·
--

Article
BREAKING: $ETH BULLISH PREDICTION 🚨*$ETH Robert Kiyosaki, _Rich Dad Poor Dad_ author, has actually made multiple ETH calls recently. The most widely reported: *$95,000 within 1 year of a global financial crash*. Another version circulating sets *$60,000 by 2026*.
#crypto ##ETHUSD ##Binance
BREAKING: $ETH BULLISH PREDICTION 🚨*
1
89
Log in to explore more content
Join global crypto users on Binance Square
⚡️ Get latest and useful information about crypto.
💬 Trusted by the world’s largest crypto exchange.
👍 Discover real insights from verified creators.
Email / Phone number
Trending Topics
1
#USPPIMissMayEaseBTCPressure
97,176 views
1,233 Discussing
2
#MANTRAPausesUnstakingFor7DaysAfterKeplrSecurityIncident
832 views
17 Discussing
3
#BitcoinCoreDisclosesTorTrafficVulnerability
45,645 views
718 Discussing
4
#WhatWillDriveCryptoandStocks’NextRebound?
235,878 views
1,921 Discussing
5
#BitcoinBreaksBelow200WeekMovingAverage
95,535 views
749 Discussing
6
#SpaceXTeslaMergerTalksWouldCombine30220BTC
29,294 views
434 Discussing
7
#Anthropic’s6xIPODemandSignalsPotentialRecordRaise
88,883 views
871 Discussing
8
#USCryptoETFsLose$1.48BInFiveDays
3,895 views
60 Discussing
9
#KoreaDigitalAssetBasicActFinalDraftExpectedEarlyJanuary
4,888 views
33 Discussing
10
#RippleRLUSDMarketCapSurpassesPayPalPYUSD
18,481 views
220 Discussing