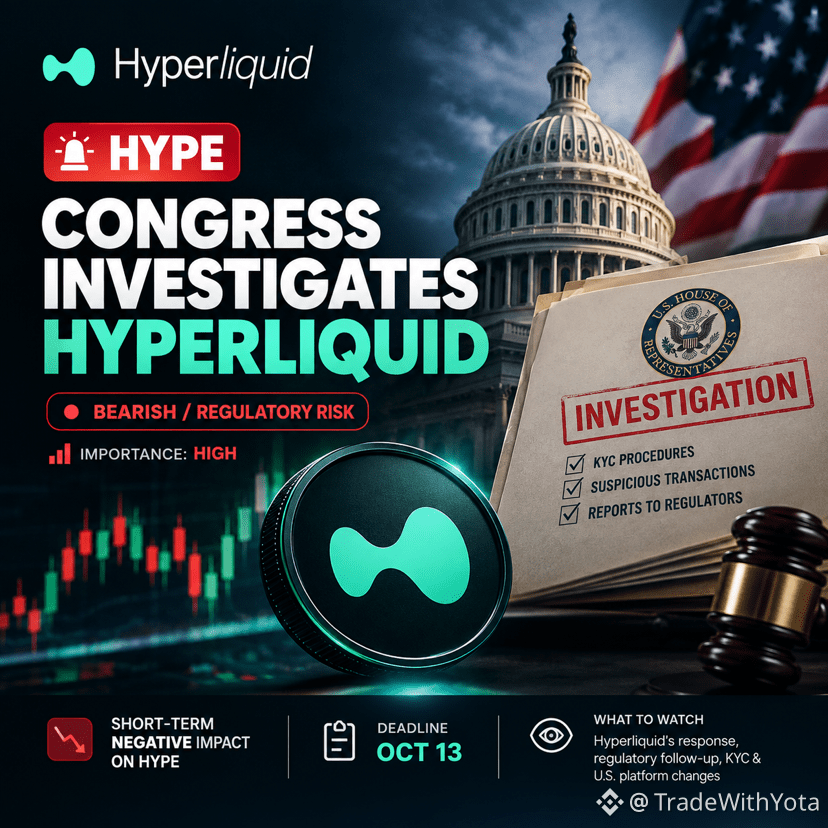
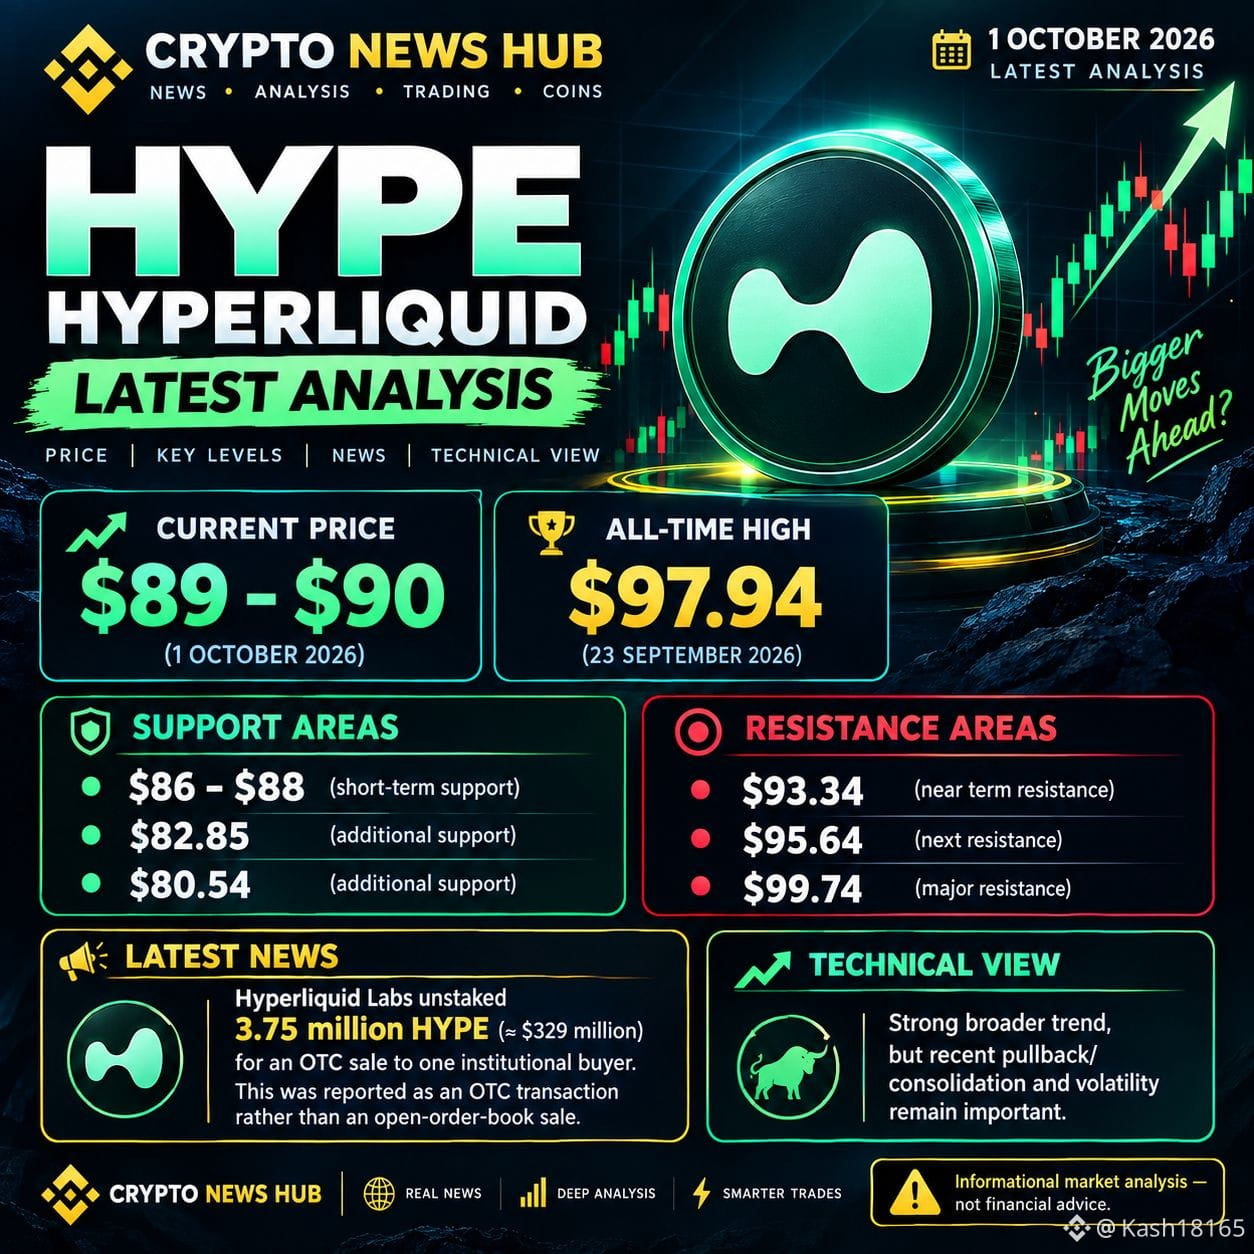
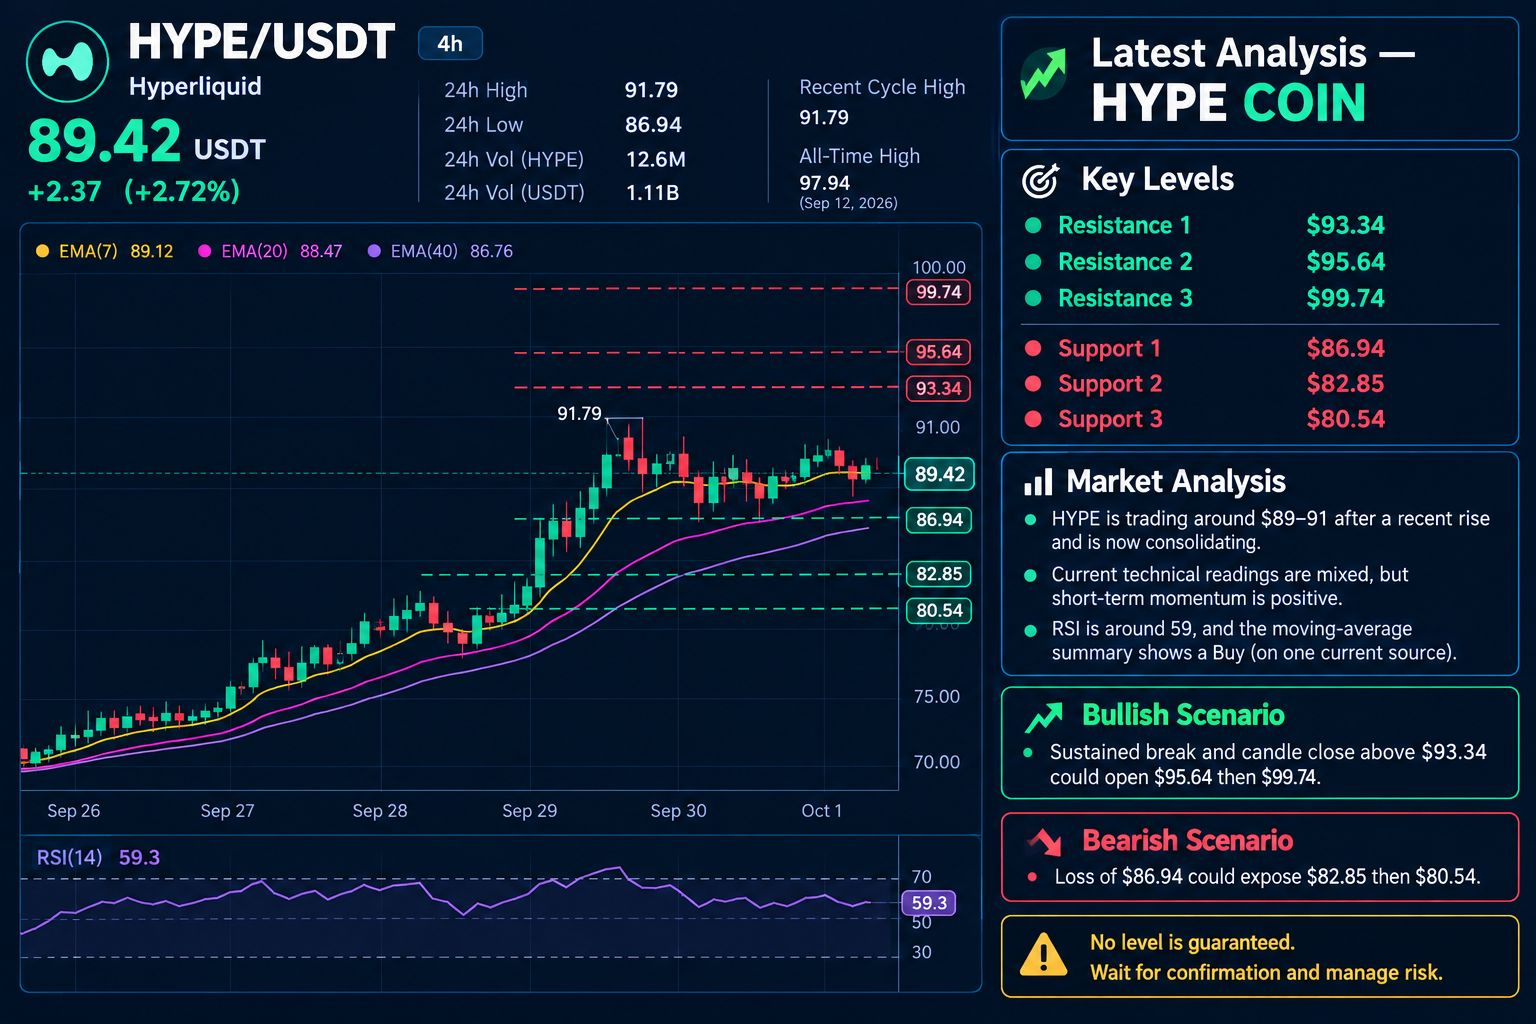
Hyperliquid’s HYPE traded near $88.45 on Oct. 1, down 2.74% on the daily chart, as Hyperliquid Policy Center pressed European regulators to classify perpetual futures under existing derivatives rules.
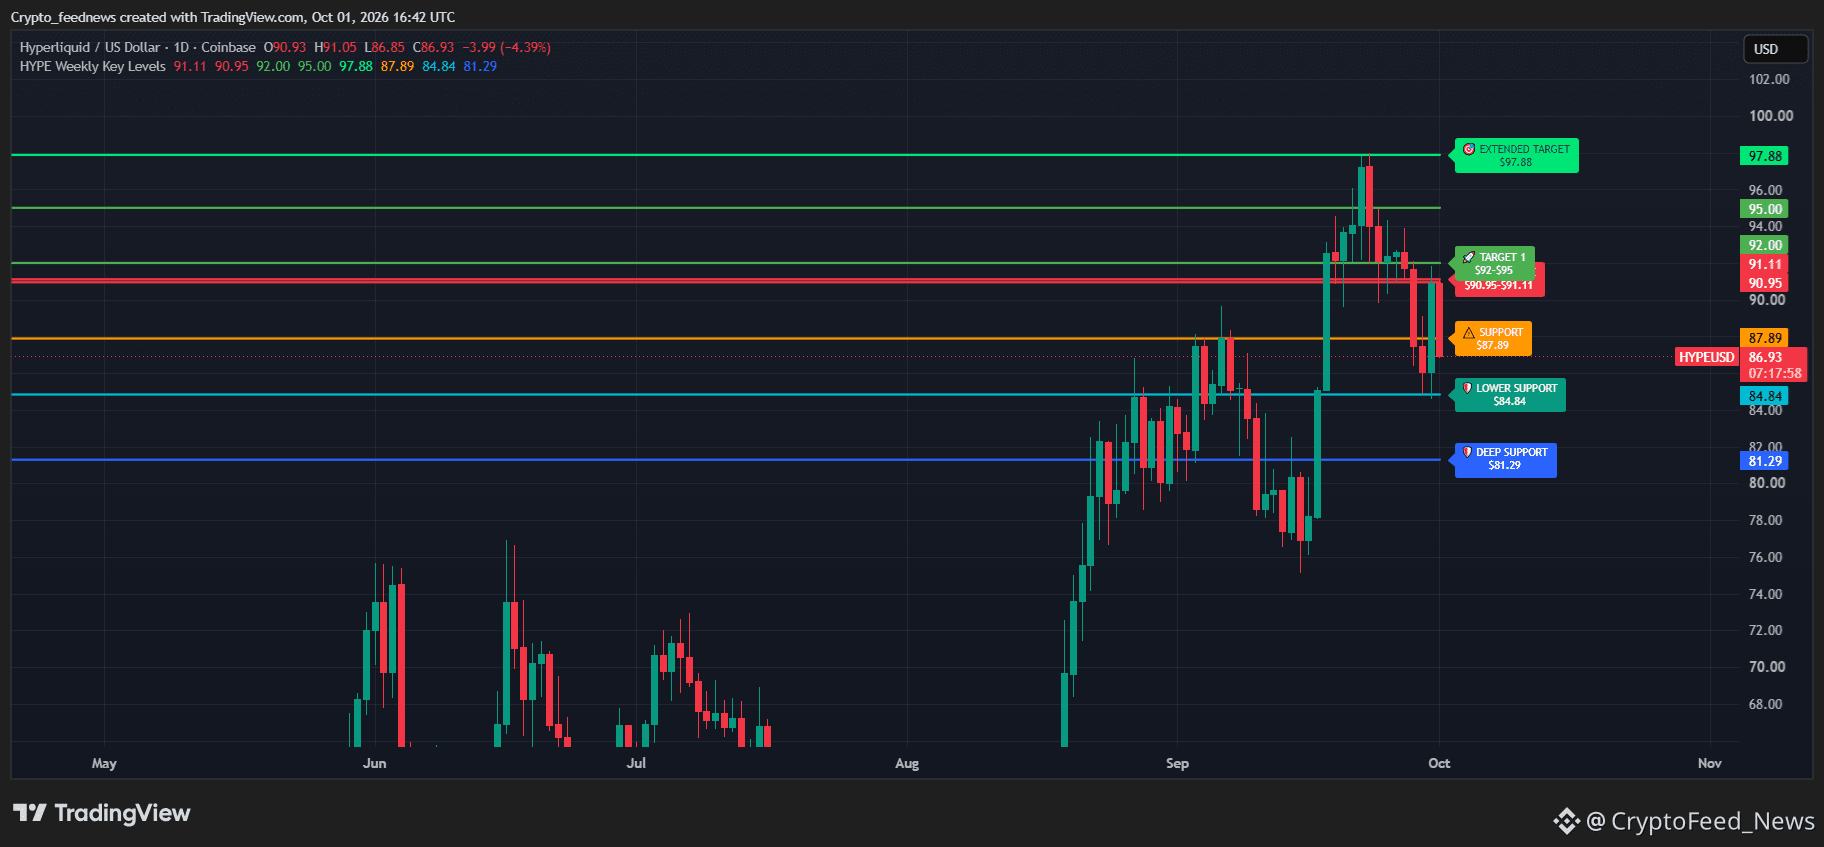
The token remained below its recent $97.88 peak, with the 4-hour chart placing the next nearby resistance around $90.95.
Hyperliquid faces resistance near $91
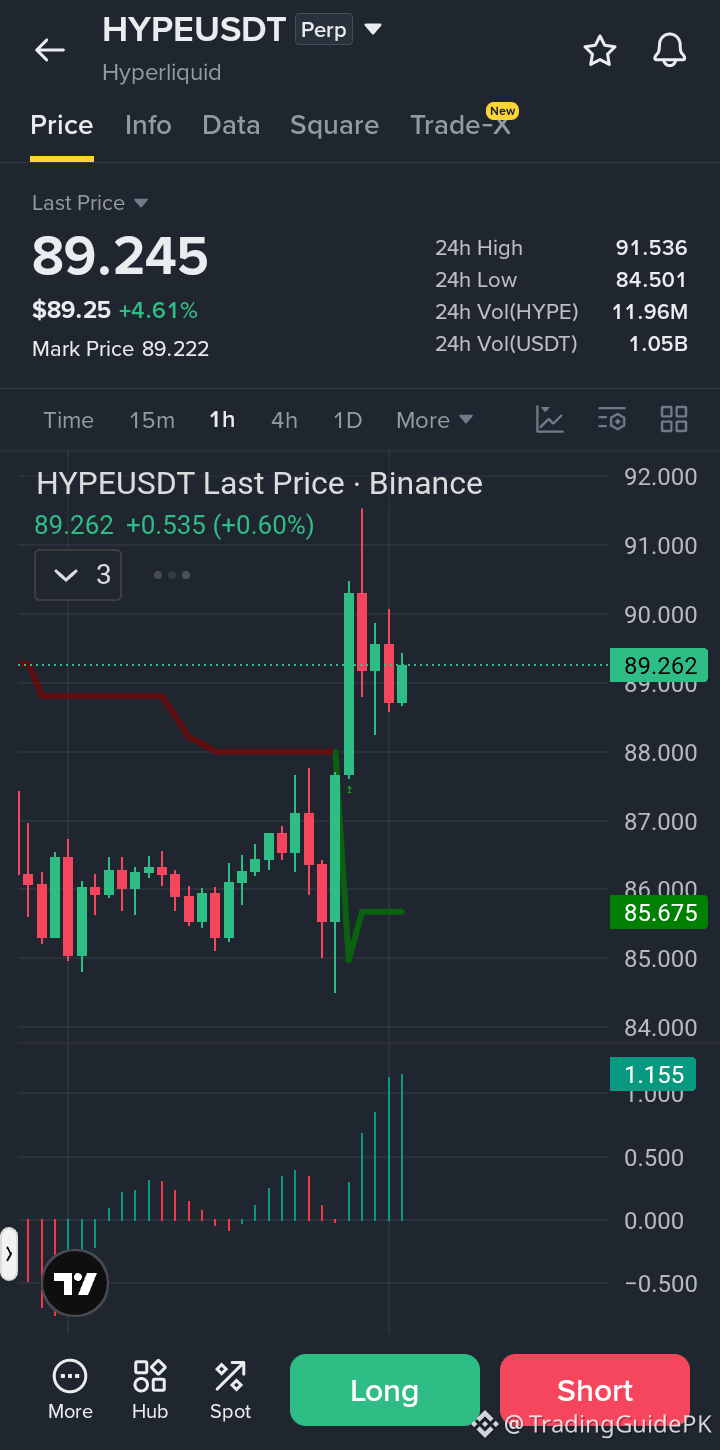
$HYPE /USDT daily chart showed a session high of $91.105 and a low of $88.119. The price stood near the lower end of that range after retreating from the late-September peak.
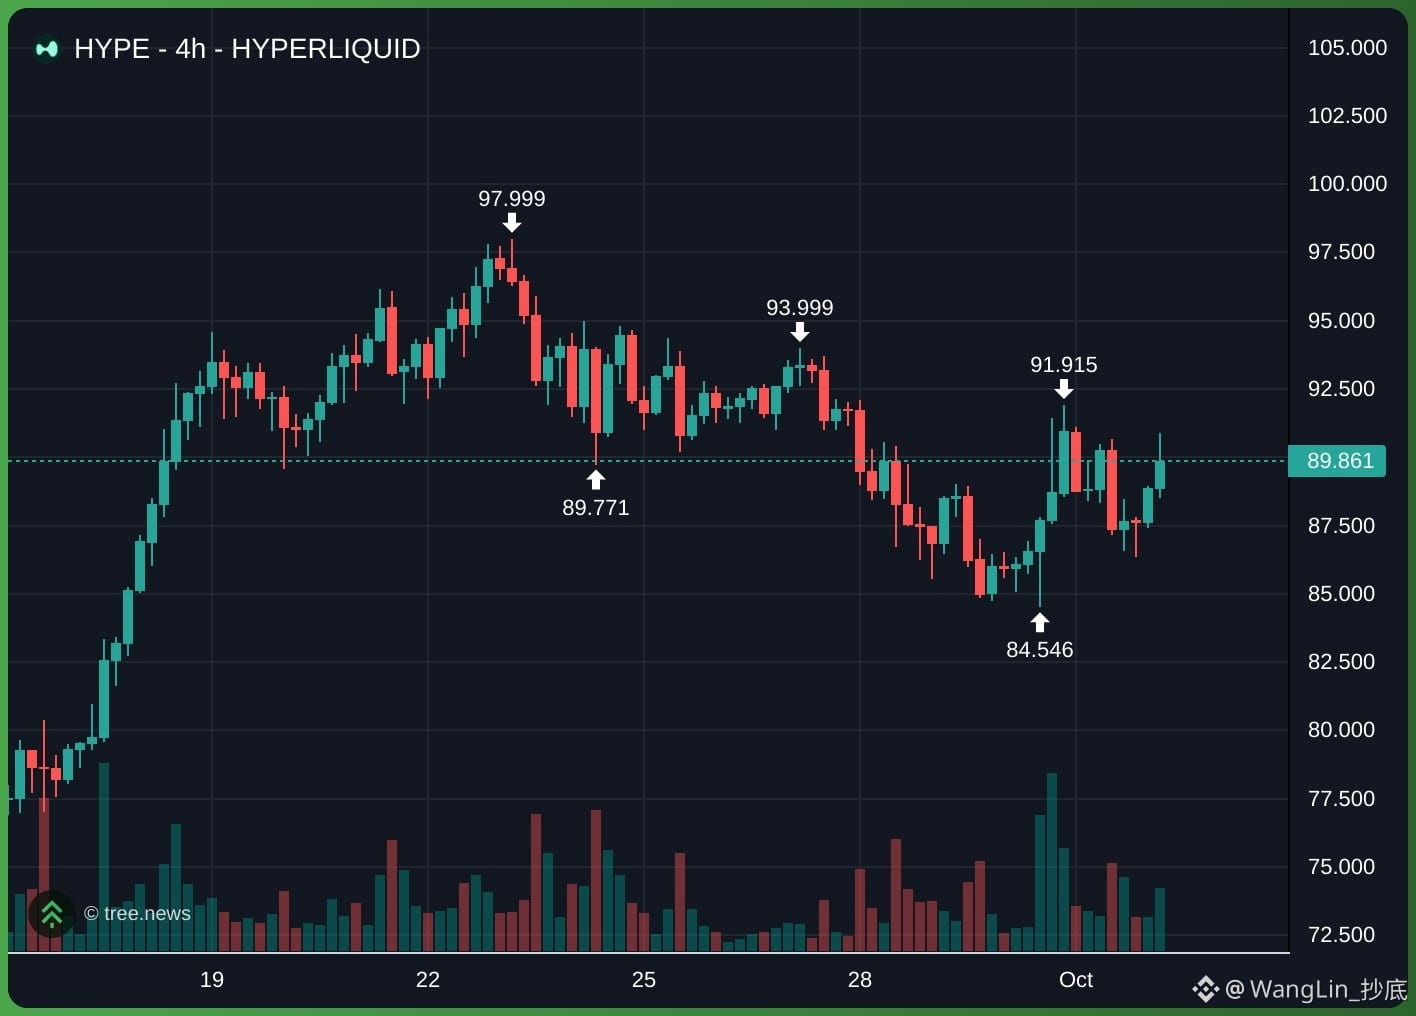
HYPE’s latest decline followed a recovery from roughly $85 on the 4-hour chart. That rebound carried the token back above $90 before selling pushed it toward $88.46, leaving the recovery below the recent trading area around $92–$95.
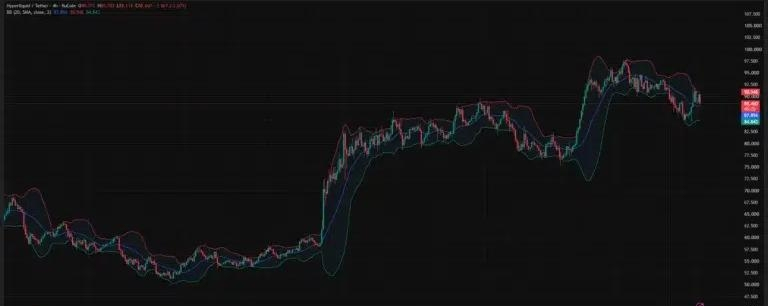
The 4-hour Bollinger Bands showed an upper boundary of $90.946, a midpoint of $87.894, and a lower boundary of $84.843. The upper band closely matched the daily high, placing the first resistance zone around $90.95–$91.11.
A sustained move above that zone would put the recent $92–$95 trading area back in focus. Beyond it, the daily chart’s marked high of $97.876 remains the next major reference, followed by the round-number $100 level.
At $88.45, HYPE would need to gain roughly 10.7% to revisit $97.88. The chart therefore places an initial resistance test near $91 before any attempt to recover the full decline from the peak.
Daily momentum cools as $87.89 becomes the first support test
The daily relative strength index stood at 52.58, above the neutral 50 level but below its moving average of 61.17. Earlier readings had reached the overbought area during the advance, while the latest reading showed weaker momentum after the pullback.
The daily Aroon panel showed Aroon Up at 42.86% and Aroon Down at 0%. The declining Up reading reflected the increasing distance from the recent high, while the Down reading remained at zero.
On the 4-hour chart, HYPE traded only about 0.6% above the Bollinger midpoint at $87.89. Holding that level would preserve the rebound above the indicator’s 20-period average; a move below it would bring the lower band near $84.84 into focus.
The daily Fibonacci overlay placed the next lower reference at $81.287, its 0.786 level. That area sits roughly 8.1% below $88.45 and near a zone HYPE traded through repeatedly during its August and September advance.
Below $81.29, the September trough around $76–$78 provides another visible reference. The daily overlay’s next Fibonacci level lies farther down at $68.264.
The 4-hour average directional index read 25.55 and had fallen from its late-September readings. ADX measures trend strength rather than direction, so the latest reading does not establish an upward breakout. The price remains between the nearby $87.89 midpoint and resistance around $91.
#Hyperliquid